
Sample Category Title
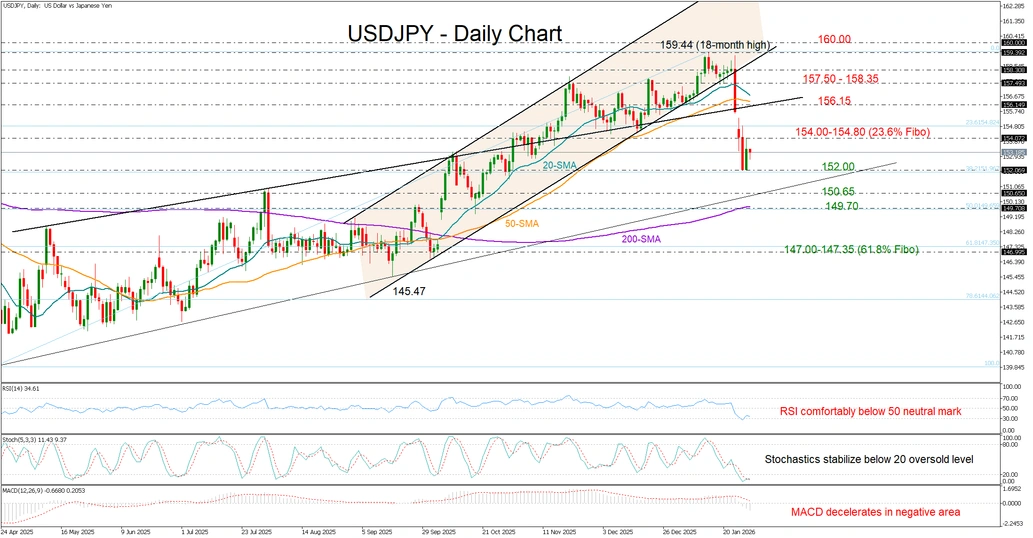
USD/JPY Wobbles Below 154.00
- USD/JPY gets rejected near 154.00 as Fed supports future rate cuts.
- Technical signals show vulnerability, selling capped above 150.70.
USD/JPY opened the day with soft momentum near 153.35 after failing to close above the 154.00 level on Wednesday. The pullback followed the Fed’s decision to leave interest rates unchanged, while Powell acknowledged the possibility of lower interest rates later in the year should inflation slow. At the same time, he struck a hawkish tone by emphasizing the resilience of the economy and the strength of the labor market, arguing that interest rates are not yet at restrictive levels. He also reiterated that policy decisions will remain data-dependent, which kept the pair largely on the sidelines in the aftermath.
With upside momentum lacking and technical indicators remaining in bearish territory, downside risks appear to outweigh upside potential, keeping the focus on the 152.00 support area. A break below this level could expose the pair to the 150.70 region, where the ascending trendline from April is located. Slightly lower, the 200-day simple moving average (SMA) may attempt to cease the sell-off near the 50% Fibonacci retracement of the April–January upleg around 149.70. Further declines could gather pace towards the 147.00–147.35 area.
In a bullish scenario, if the pair rebounds above the 154.00–154.80 zone, attention would shift to the 20- and 50-day SMAs, which are converging near 156.15. Beyond that, congestion could emerge between 157.50 and 158.35 before the bulls attempt a close above the 18-month high of 159.44 and the psychological 160.00 level.
Overall, USD/JPY continues to trade in a bearish zone. However, with key support levels approaching, sellers may need stronger momentum to attract fresh selling pressure below 150.70.
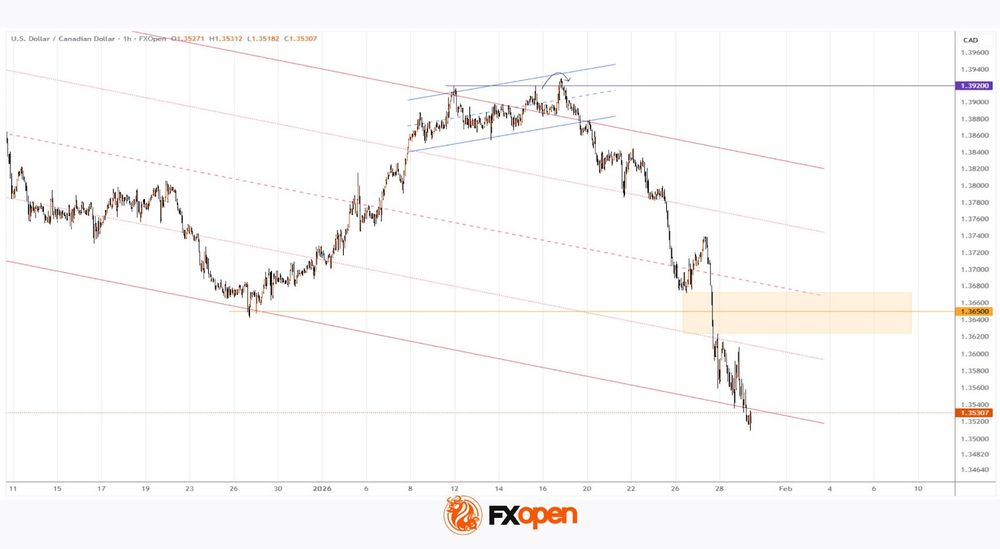
USD/CAD Falls Below the 2025 Low
Yesterday, financial markets were closely watching statements from central banks regarding interest rates, including the Federal Reserve and the Bank of Canada. According to Forex Factory:
→ The Federal Reserve kept the Federal Funds Rate at 3.75% by a majority vote. “The economy has once again surprised us with its strength,” Powell said at the press conference. The Fed Chair also added that “our policy is in a good place”.
→ The Bank of Canada left the Overnight Rate unchanged at 2.25%. In its official statement, significant attention was paid to the impact of uncertainty surrounding the trade agreement between Canada, the United States and Mexico (CUSMA).
Although there were no surprises and the central banks’ decisions matched analysts’ forecasts, the reaction of the USD/CAD pair was quite dynamic. After a spike in volatility, the exchange rate fell below the 2025 low. Moreover, on higher-timeframe charts, a bearish break of support is visible, with that support running through the lows of 2023–2025.
Technical Analysis of the USD/CAD Chart
On 19 January, when analysing the USD/CAD chart, we:
→ highlighted important signs of bullish weakness on the chart;
→ suggested that bears might seize the initiative and attempt a break of the local ascending channel (shown in blue).
Indeed, a bearish breakout occurred, after which the price formed a trajectory resembling an accelerating plunge (approximately −2.7% over 10 days). At the same time, there are grounds to assess the market within the context of a long-term downtrend (shown in red).
In this context, we see that the price is near the lower boundary of the channel, which may act as support and slow the decline. However, even if bulls attempt to form a rebound, they are likely to face significant difficulties, because:
→ the price fell aggressively from the median to the lower boundary and broke the December low with virtually no local recoveries;
→ the area around the 1.3650 level appears to be a key resistance zone.
Thus, the USD/CAD exchange rate reflects the broader January trend, in which the US dollar is under considerable pressure due to geopolitical and other factors. Notably, even Powell’s comment about the “strength of the economy” failed to support the dollar. This suggests that the market may currently be driven not by past successes of the US economy, but by concerns about future uncertainty.
Trade over 50 forex markets 24 hours a day with FXOpen. Take advantage of low commissions, deep liquidity, and spreads from 0.0 pips (additional fees may apply). Open your FXOpen account now or learn more about trading forex with FXOpen.
This article represents the opinion of the Companies operating under the FXOpen brand only. It is not to be construed as an offer, solicitation, or recommendation with respect to products and services provided by the Companies operating under the FXOpen brand, nor is it to be considered financial advice.
Japan Consumer Morale Improves. Gold Retreats from $5600 Highs, FTSE 100 Eyes Breakout
Asia Market Wrap - Asia Tech Leads the Way
- Asian tech markets, led by South Korea (+23% in Jan), continue a strong rise.
- The US Dollar remains shaky, trading near four-year lows after the Federal Reserve left interest rates unchanged as expected.
- Gold surged to a new record high near $5,595/oz before a pullback to below $5500/oz.
- The FTSE 100 index is positioned for fresh highs after bouncing off its 100-day moving average from a technical perspective.
Asian tech stocks continued their strong month-long rise on Thursday, fueled by investors who are optimistic about company profits and eagerly awaiting Apple’s upcoming financial results.
While US and European officials tried to speak positively to support the dollar, the currency remained shaky.
The US Federal Reserve left interest rates alone as widely expected, while Chair Jerome Powell talked of a "clearly improving" economic outlook and broad support on the committee for a pause.
Powell would not be drawn on whether he would remain as a governor after he steps down as Chair in May, given Trump's efforts to pressure the Fed into more aggressive cuts.
In the corporate world, Samsung Electronics helped keep the market mood high by tripling its profits, largely because the race to build Artificial Intelligence is driving up the price of computer chips.
Regionally, South Korea’s stock market saw a small daily rise that pushed its total gains for January to a massive 23%, while Taiwan’s market is up nearly 13% for the month.
Japan’s market rose only slightly, as it struggled with unstable currency values and rising interest rates.
However, not every country did well; Indonesia’s stock market dropped for a second day after warnings that their trading rules weren't clear enough. This lack of transparency caused the investment bank Goldman Sachs to downgrade its view on Indonesian stocks
Japan Consumer Morale Hits 21-Month Highs
Japan’s consumer confidence index increased to 37.9 in January 2026 from 37.2 in December, but remained slightly below market forecasts of 38.
It marked the highest reading since April 2024, as all components strengthened: overall livelihood (36.8 vs 35.9 in December 2025), employment outlook (42.4 vs 41.5), willingness to buy durable goods (30.4 vs 30.2), and income growth (42.0 vs 41.3).
A positive for Japan at a time that it is needed with elections on the horizon and concerns around debt, this will be welcome news.
European Session - Defence and Energy Companies Lead the Way
European stocks recovered on Thursday, helped by rising prices for oil, gold, and silver.
This positive turn comes after a bad day on Wednesday caused by weak earnings from luxury brands. Nervous investors are buying gold and silver to keep their money safe, which has pushed metal prices up and boosted the stock prices of mining companies.
Energy companies are also doing well because oil prices are rising on fears that the US might attack Iran.
Meanwhile, market participants are busy analyzing a flood of company financial reports. They are watching US tech giants for news on Artificial Intelligence and checking European companies to see if they are staying healthy despite global trade conflicts.
However, some major German companies struggled; software giant SAP saw its stock plunge after reporting only average sales, and Deutsche Bank shares fell despite announcing its highest profits in years.
This dragged down the German DAX Index, which is also suffering because the government admitted the economy is growing slower than expected.
On the FX front, the US dollar remained shaky on Thursday as investors continued to worry about American economic policies and global politics.
Earlier in the week, the dollar crashed to a four-year low after President Trump appeared unconcerned about its weakness, though it stabilized slightly after Treasury Secretary Scott Bessent assured the market that the US still wants a strong currency.
Currently, the dollar is trading very close to those recent lows.
Meanwhile, the Euro has dropped back slightly below $1.20, as European banking officials are concerned that if their currency gets too strong, it could hurt their economy.
In other currencies, the British Pound is hovering near a four-and-a-half-year high, and the Australian dollar hit a three-year peak because investors expect interest rates there to rise next week.
Currency Power Balance
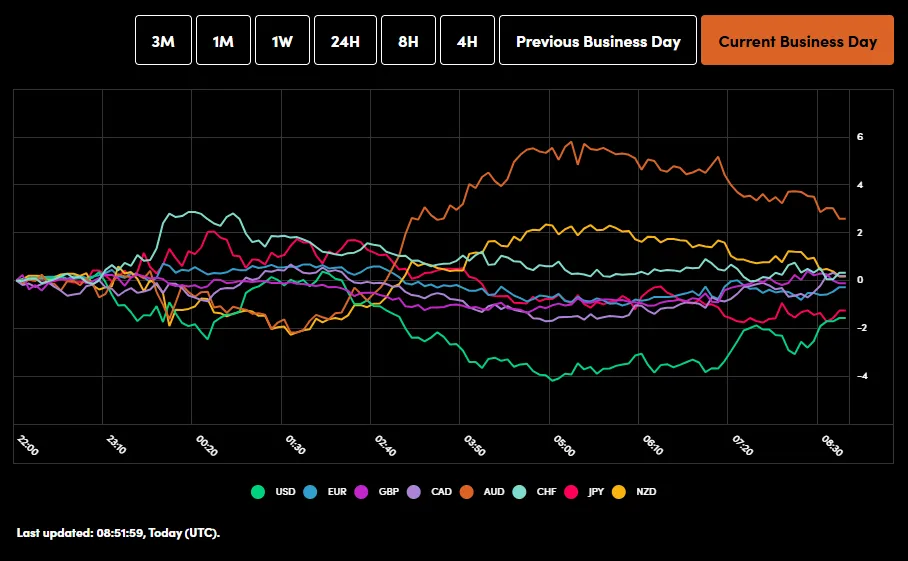
Source: OANDA Labs
Gold prices surged again on Thursday in the Asian session, climbing close to $5,600 per ounce as nervous market participants rushed to buy the metal to protect their money from global political and economic trouble.
Gold rose 2.7% to trade around $5,546, after hitting a new record high of nearly $5,595 earlier in the day; this marks the ninth day in a row that gold has broken price records.
There has been a selloff since then with the precious metal reaching lows around the $5475/oz handle in early European trade.The precious metal is still up over $1000 for the month of January.
Silver also reached a major milestone, briefly jumping past $120 per ounce before settling back down to around $118. Silver prices have risen more than 60% this year because it is in short supply and investors are looking for a cheaper alternative to gold.
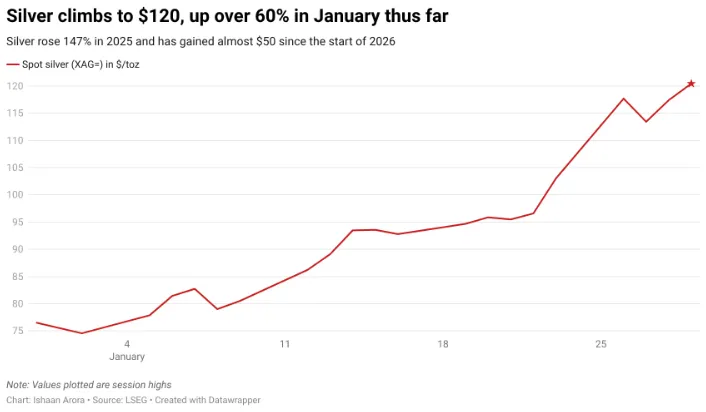
Source: LSEG
Economic Calendar and Final Thoughts
Data is largely thin today with Geopolitical developments likely to remain key. Greenland, tariffs, US-Iran among other discussions remain key drivers of volatility.
There is also a host of US companies reporting earnings today which could also stoke volatility with Apple likely to be the main focus. The only US data of note is the initial jobless claims data which have been lower than expected of late..
Barring a negative print here, the DXY can work its way higher.
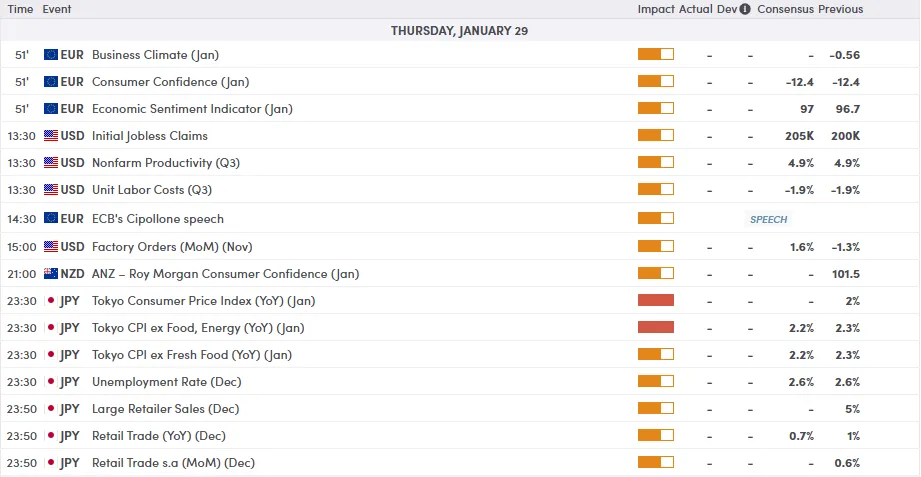
For all market-moving economic releases and events, see the MarketPulse Economic Calendar. (click to enlarge)
Chart of the Day - FTSE 100 Index
From a technical perspective, the FTSE 100 index has bounced off the 100-day MA on the four-hour timeframe once more.
This puts the index looking like it is on its way to fresh highs..
Immediate resistance rests at 10243 with a break above eyeing the 10277 handle before the 10300 handle comes into focus.
A move lower here may find support at 10178 before the psychological 10000 handle and the 200-day MA at 9973 comes into focus.
FTSE 100 Index Daily Chart, January 29, 2026
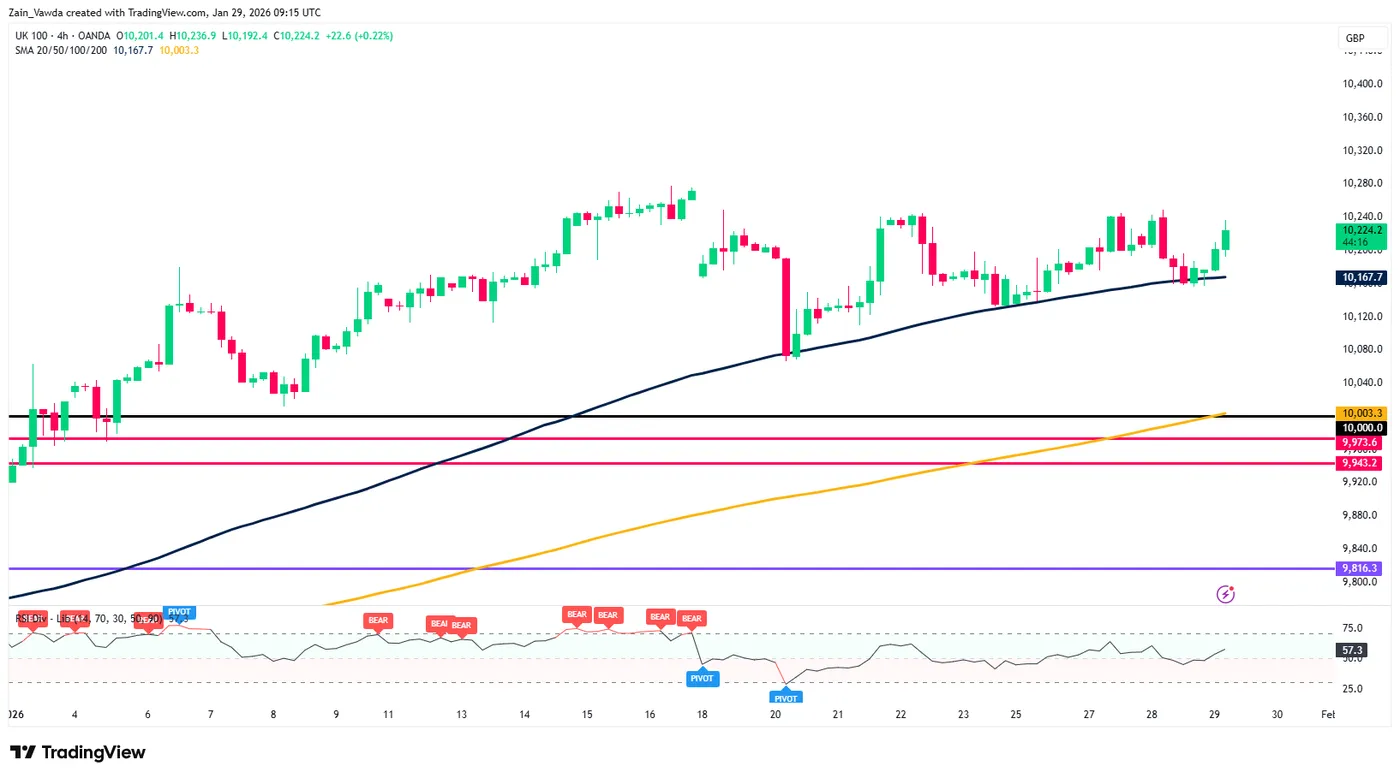
Source: TradingView.com (click to enlarge)
AUD/USD Daily Report
Daily Pivots: (S1) 0.6998; (P) 0.7021; (R1) 0.7064; More...
AUD/USD's rally continues today and intraday bias stays on the upside. Current up trend should target 100% projection of 0.5913 to 0.6706 from 0.6420 at 0.7213 next. On the downside, below 0.6975 minor support will turn intraday bias neutral and bring consolidations. Downside of retreat should be contained above 0.6765 resistance turned support to bring another rally.
In the bigger picture, current development argues that rise from 0.5913 (2024 low) is reversing whole down trend from 0.8006 (2021 high). Further rally should be seen to 61.8% retracement of 0.8006 to 0.5913 at 0.7206. This will remain the favored case as long as 0.6706 resistance turned support holds, even in case of deep pullback.
Fed Non-Event Gives Way to Higher Yields and Record Metals
Market reaction to the Fed’s widely expected rate hold was muted overnight, with equities struggling to find direction. S&P 500 briefly pushed above the 7,000 mark, but the move lacked follow-through. By the close, all three major US indexes finished near flat.
Away from equities, two developments stood out. US Treasury yields moved higher, with the 10-year yield closing back above 4.25%, hinting at renewed pressure on the long end rather than any rush into safety. At the same time, the rally in precious metals extended. Gold surged to another record above 5,500, while Silver pressed through the 120 level.
Taken together, the moves suggest markets have quickly returned to a familiar rhythm following what was largely a non-eventful FOMC decision.
The most notable takeaway from Jerome Powell’s press conference was not economic guidance, but his repeated emphasis on keeping the Fed insulated from political influence amid rising pressure from the Trump administration to cut rates.
“Stay out of elected politics, don’t get pulled into elected politics,” Powell said, stressing that independence remains central to the Fed’s credibility. He was careful, however, to distinguish independence from disengagement.
Powell emphasized that accountability runs through Congress, describing engagement with lawmakers as an “affirmative regular obligation.” He argued that democratic legitimacy is earned through oversight and transparency, not through alignment with political agendas.
When pressed repeatedly on a Justice Department probe into cost overruns for the Fed’s headquarters renovation and on whether he plans to stay after his term ends, Powell declined to engage. “There’s a time and place for these questions,” he said, repeatedly signaling boundaries.
In FX markets, Dollar remains the worst performer of the week, with selling pressure returning after the Fed. Euro follows as the second weakest, with Loonie next. Aussie leads, supported by firm inflation data and tightening expectations, followed by Kiwi and Swiss Franc. Yen and Sterling now sit in the middle of the performance table.
NZ ANZ business confidence eases to 64.1, pricing signals turn hotter
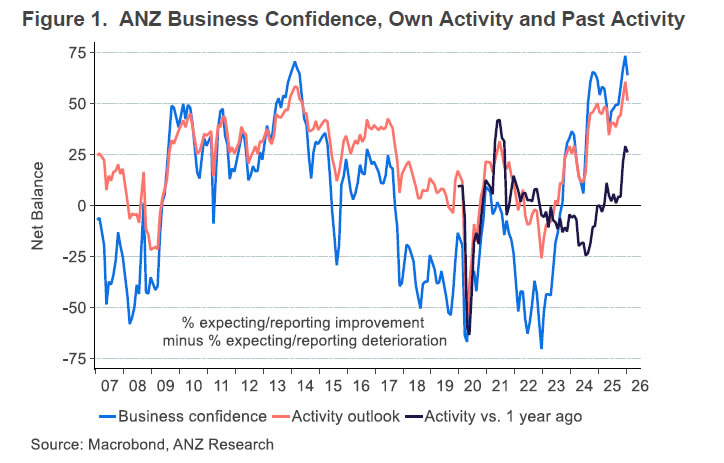
New Zealand’s ANZ Business Confidence eased in January, slipping from a 30-year high of 73.6 to 64.1. While the decline looks notable, confidence remains at a very strong level historically. The own activity outlook also moderated, falling from 60.9 to 51.6, pointing to some loss of momentum after December’s surge. According to ANZ, the coming months will be key in determining whether growing talk of rate hikes begins to weigh on activity.
The more important signal came from inflation indicators, which moved decisively higher. The net share of firms expecting to raise prices in the next three months rose 5 points to 57%, the highest reading since March 2023. Firms also expect to raise prices by 2.1%, up from 1.8%, marking the fastest pace in two years. Wage pressures are beginning to lift modestly, while inflation expectations reached their %, highest level in 15 months.
ANZ described the results as a mix of “good news and bad news,” warning that the inflation signals are not consistent with forecasts from either the bank or the RBNZ. Explanations include faster margin recovery or less spare capacity than assumed. ANZ still forecasts the first OCR hike in December, but cautioned that if pricing intentions show up in hard data, tightening could come earlier.
New Zealand exports and imports jump 15% yoy in December
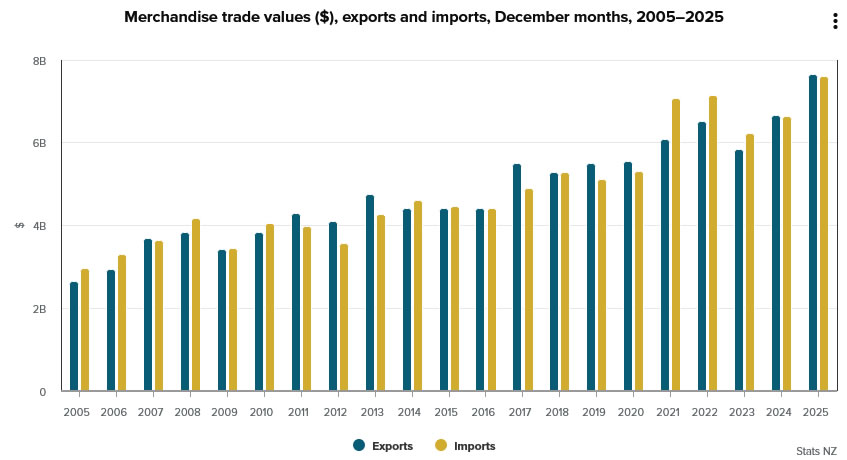
New Zealand recorded a modest but better-than-expected trade surplus of NZD 52m in December, exceeding forecasts for a NZD 40m surplus. According to Stats NZ, goods exports jumped 15% year-on-year to NZD 7.7B, while goods imports rose by a similar 15% to NZD 7.6B, reflecting strong two-way trade flows at year-end.
Export growth was broad-based across key trading partners. Shipments to Australia rose NZD 204m (26% yoy), while exports to the EU increased NZD 120m (31%). Exports to China, New Zealand’s largest market, grew a more modest 4.6%, while gains were also recorded to the US (4.8%) and Japan (15%).
On the import side, increases were led by China, with imports up NZD 381m (27% yoy), followed by the EU (26%) and Australia (27%). In contrast, imports from the US fell -16% yoy, offering some offset to the overall rise.
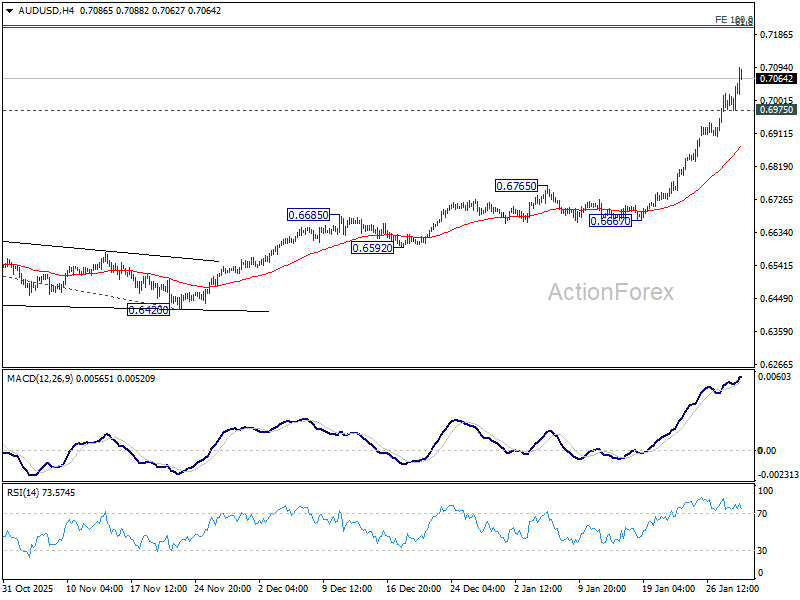
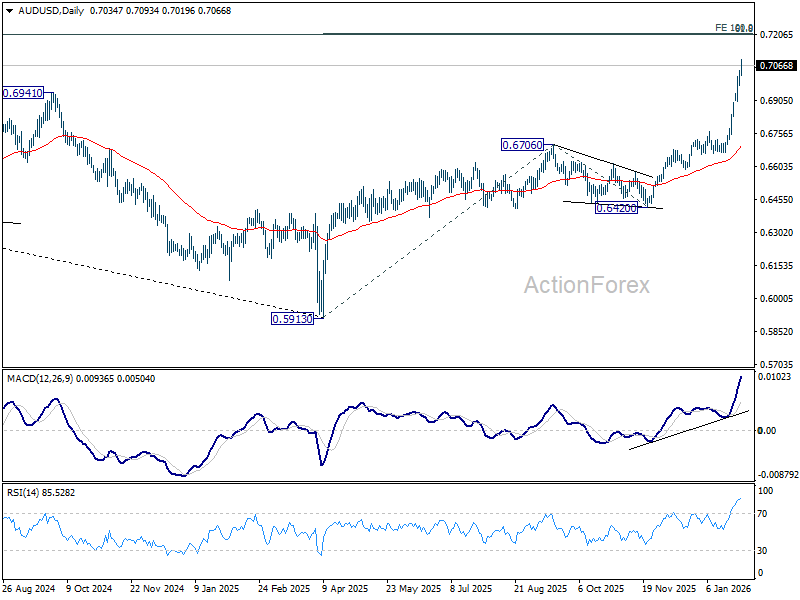
AUD/USD Daily Report
Daily Pivots: (S1) 0.6998; (P) 0.7021; (R1) 0.7064; More...
AUD/USD's rally continues today and intraday bias stays on the upside. Current up trend should target 100% projection of 0.5913 to 0.6706 from 0.6420 at 0.7213 next. On the downside, below 0.6975 minor support will turn intraday bias neutral and bring consolidations. Downside of retreat should be contained above 0.6765 resistance turned support to bring another rally.
In the bigger picture, current development argues that rise from 0.5913 (2024 low) is reversing whole down trend from 0.8006 (2021 high). Further rally should be seen to 61.8% retracement of 0.8006 to 0.5913 at 0.7206. This will remain the favored case as long as 0.6706 resistance turned support holds, even in case of deep pullback.
NZ ANZ business confidence eases to 64.1, pricing signals turn hotter
New Zealand’s ANZ Business Confidence eased in January, slipping from a 30-year high of 73.6 to 64.1. While the decline looks notable, confidence remains at a very strong level historically. The own activity outlook also moderated, falling from 60.9 to 51.6, pointing to some loss of momentum after December’s surge. According to ANZ, the coming months will be key in determining whether growing talk of rate hikes begins to weigh on activity.
The more important signal came from inflation indicators, which moved decisively higher. The net share of firms expecting to raise prices in the next three months rose 5 points to 57%, the highest reading since March 2023. Firms also expect to raise prices by 2.1%, up from 1.8%, marking the fastest pace in two years. Wage pressures are beginning to lift modestly, while inflation expectations reached their %, highest level in 15 months.
ANZ described the results as a mix of “good news and bad news,” warning that the inflation signals are not consistent with forecasts from either the bank or the RBNZ. Explanations include faster margin recovery or less spare capacity than assumed. ANZ still forecasts the first OCR hike in December, but cautioned that if pricing intentions show up in hard data, tightening could come earlier.
New Zealand exports and imports jump 15% yoy in December
New Zealand recorded a modest but better-than-expected trade surplus of NZD 52m in December, exceeding forecasts for a NZD 40m surplus. According to Stats NZ, goods exports jumped 15% year-on-year to NZD 7.7B, while goods imports rose by a similar 15% to NZD 7.6B, reflecting strong two-way trade flows at year-end.
Export growth was broad-based across key trading partners. Shipments to Australia rose NZD 204m (26% yoy), while exports to the EU increased NZD 120m (31%). Exports to China, New Zealand’s largest market, grew a more modest 4.6%, while gains were also recorded to the US (4.8%) and Japan (15%).
On the import side, increases were led by China, with imports up NZD 381m (27% yoy), followed by the EU (26%) and Australia (27%). In contrast, imports from the US fell -16% yoy, offering some offset to the overall rise.
FOMC Meeting Went by Unnoticed
Markets
The US Fed yesterday left the policy rate at 3.5%-3.75%, pausing the normalization cycle that (re)started last year and lasted three rate cuts through December. Miran (Trump’s pick) and Waller (Fed chair contender) opted for a 25 bps cut. Reasons for the status quo are straightforward. The economic outlook “has clearly improved since the last meeting” and that has implications for the labour market. Downside risks to the latter, while still out there, have eased and there were signs of stabilization in the unemployment rate. That led the FOMC to drop related language in the statement. Inflation remains somewhat elevated but most of the overshoot is due to tariffs on goods. This is expected to be a one-off while disinflation in the services category is ongoing. Chair Powell added that upside inflation risks were generally lower as well without calling the balance (between inflation and the labour market) even just yet. Asked about possibility of a further cut, Powell stuck to the usual: they are well positioned and make decisions meeting by meeting, depending on the data. The takeaway is that the Fed under its current chair (until May) is done with easing unless data suddenly dictates otherwise. There were of course multiple non-monetary policy related elephants in the room. Why was Powell at governor Cook’s hearing? It would be hard to explain why he didn’t attend “the most important legal case in the central bank’s 113-year history”. Powell had five buzz killing words to block off the other high-profile topics, from the Fed subpoenas, his video statement, him staying as governor after his chair term ends, his successor or the recent dollar weakening. “I have nothing for you.”
The FOMC meeting went by unnoticed. US money markets were already positioned for an unchanged policy rate at least through June. It resulted in negligible net daily changes on the US yield curve. Bunds outperformed, especially on the front end of the curve. The recent euro appreciation/dollar depreciation caused the first ECB policymakers (Kocher, Villeroy) to warn on its potential impact on the inflation outlook – and therefore monetary policy. Rates fell up to 3 bps (2-yr). On that currency front, USTS Bessent talked up the dollar yesterday. He said the US has always had a strong dollar policy and that the US is “absolutely not” intervening in dollar-yen. USD/JPY shot up to 153.41, EUR/USD fell back below 1.20 and DXY rebounded from 96. But it doesn’t look like a strong basis for further USD-gains with the dollar recovery already running in reverse at the Asian dealings this morning. The greenback remains at the center of attention – and with it metal/commodity prices – today. Gold, silver, copper continue a breakneck rally. Brent nears $70 on increasing Trump threats to attack Iran. Markets approved earnings from big tech including Tesla and Meta Platforms yesterday, but gave a thumbs down to Microsoft. Caterpillar and Apple are among the high-profile companies on tap today. The economic calendar otherwise is of secondary importance.
News and views
The Bank of Canada (BoC) left its policy rate unchanged yesterday at 2.25%. It remains appropriate, conditional on the economy evolving broadly in line with the updated outlook. Canadian money markets err on the side of a rate hike as a next move by year-end (30% probability). Although the outlook barely changed from October, it is more vulnerable to unpredictable US trade policies and geopolitical risks. Economic growth is projected to be modest in the near term (2%-ish) as population growth slows and Canada adjusts to US protectionism. Inflation was 2.1% in 2025 and the BoC expects inflation to stay close to, but above, the 2% target over the projection period, with trade-related cost pressures offset by excess supply. The Loonie continues strengthening against an overall weak USD with rising commodity prices coming in handy. The 100% tariff treat from the US on the trade agreement with China so far doesn’t impress the currency. USD/CAD falls below the 2025 low at 1.3540 this morning.
Czech National Bank (CNB) board member Prochazka is inclined to hold the 3.5% policy rate for some more time, waiting for the additional data and the right moment to explain the market that one more rate cut is appropriate. At the moment, he still thinks that the CNB is in a good position because of sticky core inflation. Prochazka’s comments contrasts with a more dovish view held by his colleague Frait earlier this week who was still out on next week’s decision and saw room for two more rate cuts by the end of 2026. The front end of the Czech curve remains nevertheless under downward pressure going into next week’s CNB meeting, including an updated quarterly policy report. The Czech koruna profited less than for example HUF or PLN the past days as the dollar sold off globally. EUR/CZK holds steady between roughly 24.10 and 24.40 since the start of Q4 2025.
Meta Up, Microsoft Down Post-Earnings
The US Federal Reserve (Fed) mostly did what was expected when it announced its policy update yesterday: it kept rates unchanged. Fed Chair Powell didn’t comment on the latest political drama surrounding the Fed and himself, nor on whether he would leave the committee when his term as Chair ends in May. Instead, he advised the next lucky person to take the helm of the Fed to “stay out of elected politics.” Two members voted to cut rates by 25bp – guess who?
That was the expected part. The surprise came from the economic outlook.
Powell pointed to a “clear improvement” in the US outlook, said the job market shows signs of steadying, and highlighted surprisingly “strong” growth. But a good part of that growth is explained by AI investment, which for now does not create many jobs. On the contrary, there has been a wave of job cuts announced recently. Amazon, for example, is looking to cut 16’000 jobs on top of the 14’000 let go last year. Meta is laying off around 10% of its Reality Labs employees. Microsoft cut more than 9’000 jobs last year. Nvidia is cutting jobs. Banks are cutting jobs. Some of these cuts have nothing to do with AI, but some clearly do. Meanwhile, yesterday’s survey showed that people find it harder to get jobs.
So the Fed is caught between a rock and a hard place. If inflation continues cooling, the Fed’s job will be easier. But energy prices are pushing higher this January, driven by cold weather and geopolitical tensions involving oil producers. US natural gas prices jumped more than 50% in less than two weeks. US crude climbed past the $64pb mark this morning on fears of a potential US attack on Iran. Prices are now above the 200-day moving average and testing a key Fibonacci level — the 38.2% retracement of the June-to-December sell-off — while US gasoline prices are up more than 13% this month.
In the medium term, these heightened energy price pressures should ease. Weather- and geopolitically-driven price spikes don’t change longer-term fundamentals. Global oil supply remains ample and comfortably meets demand.
In the shorter run, however, this argues for the Fed to sit tight before delivering another rate cut — assuming it already cut rates over the three meetings preceding this week’s decision. The next Fed rate cut is not expected before June, and that with roughly a 60% probability. Things could change quickly — in either direction — so incoming data will matter.
For now, bets still tilt towards a less dovish Fed. The US 2-year yield, which captures Fed rate expectations, appears to be bottoming near 3.60%, while the 10-year yield has climbed above 4.20% since the start of the week. Yields are also being pressured by talk of a potential partial government shutdown if Congress fails to pass new appropriations by tomorrow midnight.
Japanese yields, meanwhile, are moving lower, which helps avoid additional upward pressure on global yields. Still, a more hawkish-than-expected Fed tone following this week’s FOMC decision, combined with political and geopolitical uncertainty, is weighing on US bonds. This theme is likely to persist unless something fundamental changes in the way the White House operates.
Equities, however, don’t seem to care. The S&P 500 hit the 7’000 mark for the first time, and futures are positive at the time of writing. Three US tech giants reported earnings after the bell yesterday. They beat expectations and announced higher AI spending, but market reactions varied sharply.
Meta was praised for its improved profit outlook. The company has manages to turn AI spending into cash via advertising revenues, showing that its core business is performing well. Investors also welcomed the reduced focus on Reality Labs, a cash-burning division that has yet to gain meaningful adoption. Microsoft, by contrast, was punished as cloud growth came in below analysts’ expectations — a major concern given that cloud is the segment meant to justify heavy AI investment. Slower cloud growth made investors unhappy about further AI spending.
As for Tesla, profits plunged 61% in Q4 year-on-year. No surprise: sales have been falling since last year, partly reflecting Elon Musk’s political positioning. What’s surprising, however, is the market’s reaction. Tesla is a case study in itself — one that will allow academics to examine how a company with profits down more than 60% can still attract investor enthusiasm for projects largely unrelated to its core business. Investors welcomed Tesla’s plans to invest more than $20 billion this year in advanced AI, robotics, autonomous vehicles and energy storage, including a $2 billion investment in Elon Musk’s xAI startup! The company’s price-to-earnings ratio is now above 350. This is pure speculation on someone entirely unpredictable — but admittedly, it’s entertaining!
In FX markets, the Fed’s optimistic tone initially helped the US dollar rebound, but gains proved short-lived. The dollar index is back under pressure this morning.
One factor weighing on the dollar was US Treasury Secretary Scott Bessent’s CNBC interview, during which he said the US is “absolutely not” intervening to support the Japanese yen. The New York Fed’s calls to traders to check yen levels were, apparently, just that — curiosity, information-gathering...
The immediate consequence for Japan is that Bessent effectively spoiled the intervention narrative. The USDJPY bounced from the 152 level, which had been reached on speculation that US and Japanese authorities might jointly step in to curb yen weakness. Japan is now on its own. With or without the US help, authorities will continue to fight against the yen shorts as they dislike the pace of depreciation as it hurts households and erodes purchasing power, but at 152, intervention looks unlikely. On that basis, yen shorts may cautiously rebuild positions at these levels — cautiously though, until intervention threats ease.
Fundamentally, the yen is likely to remain under pressure at least until the February 8 snap election, which prices the risk of Takaichi consolidating political power. She favours ample fiscal spending — pushing yields higher — alongside supportive monetary policy, which weighs on the yen. As per the the Bank of Japan, it does not suffer from independence issues and remains willing to hike rates as part of its policy-normalisation process. But even so, last year’s hawkish signals did little to provide lasting support for the yen.
Riksbank Expected to Keep Rates Unchanged
In focus today
- In the US, November import and export data is set for release today. The trade deficit has narrowed significantly as imports have declined after Trump's tariff hikes, despite domestic demand remaining resilient.
- In Sweden, the Riksbank is expected to maintain its policy rate at 1.75% during its rate decision meeting, aligning with December's communication. The central bank is likely to repeat the statement that 'the rate is expected to remain at this level for some time to come', while previous rate cuts continue to support the ongoing recovery.
- Overnight Japan will release January CPI, with December CPI at 2.0% y/y and CPI excl. fresh food and fuel at 2.3% y/y. The Bank of Japan's December minutes highlighted the growing impact of a weak yen on inflation, as firms continue to pass on rising costs. The central bank maintained its hawkish inflation outlook, revising core inflation forecasts higher through to 2027, and signalled vigilance over mounting price pressures that could prompt further rate hikes.
Economic and market news
What happened yesterday
In the US, the Fed kept interest rates at 3.50-3.75%. Chair Powell struck a balanced stance, highlighting the economy's unexpected resilience and stabilisation in labour market data. Economic growth was described as "solid" rather than "moderate," and concerns about downside risks to employment were notably removed, signalling a lower likelihood of near-term rate cuts. Governor Waller's dissent over a rate cut presented a mildly dovish surprise, but the overall tone of the meeting was mixed. Despite the recent weakening of the USD, Powell avoided addressing its inflationary risks directly, leaving markets largely unmoved. For details see Fed review: Balanced and optimistic, 28 January.
In relation to the USD, Treasury Secretary Scott Bessent stated that the Trump administration is committed to a 'strong dollar policy' and that the US is "absolutely not" intervening in USD/JPY, addressing speculation about currency market interference. His comments provided some relief for the USD, lifting USD/JPY back above 153 and EUR/USD remained steady in the mid-1.19 to 1.20 range.
In Canada, the Bank of Canada left policy rates unchanged as expected, citing inflation projections close to target during the forecast period. The BoC showed no inclination to signal imminent rate cuts or hikes, pointing to uncertainties surrounding geopolitics and trade.
In geopolitics, the US has urged Iran to reach an agreement over its nuclear programme, warning of potential military action if a deal is not struck. President Trump stated that an "armada" is heading toward Iran and hinted at large-scale military intervention. Meanwhile, US forces will conduct a multi-day air exercise in the Middle East as Washington bolsters its military presence amid heightened tensions.
Equities: Equities little changed yesterday in a wait-and-see mode ahead of the tech earnings reports released after closing. Tech continued to outperform even before these numbers, with semis in particular extending recent outperformance (Intel and TXN +11%!). A slight cyclical bias in the sector preference while small caps continued to lag. US futures are slightly higher this morning.
The monetisation of AI and capex plans in focus. Meta was the positive standout with sales rising 24% y/y and AI contributing through advertising efficiency. Microsoft grew top line impressively as well at 17% y/y, but Azure revenue grew 'only' 38%, a percentage point below the rate in Q3. This drove shares in different directions in the aftermarket with Microsoft -6% and Meta +10%. Capex was bigger than expected, but the capex surprises were at least lower than in Q3. Meta updated their capex outlook to around USD 115-135bn for 2026, which would imply almost a doubling from its 2025 capex spend, but not miles from consensus expectations at 110bn. As for actual spend, capex came in at 22,1bn which was 5% more than expected. Microsoft's spend rose to 37,5bn and 9% more than expected. However, Microsoft beat capex spend with 15% and Meta 6%, so in this sense it was a more moderate quarter this time.
FI and FX: The USD slide took a breather yesterday and Treasury Secretary Bessent's comment that the US is "absolutely not" intervening in USD/JPY helped push USD/JPY back above 153. Despite the tentative USD stabilization, we saw AUD/USD continuing moving higher as markets are positioning themselves for an RBA hike next week. Scandies continue to be supported in the current sentiment, with further SEK and NOK strength and EUR/DKK hitting the lowest levels since September. Despite the elevated FX volatility of late, we have not yet seen the corresponding pick-up in bond volatility. Yesterday was no exception, with relatively muted moves in rates both before and after Fed.