Sample Category Title
EURJPY Fails to Increase Above 138.00; Shows Some Positive Signs
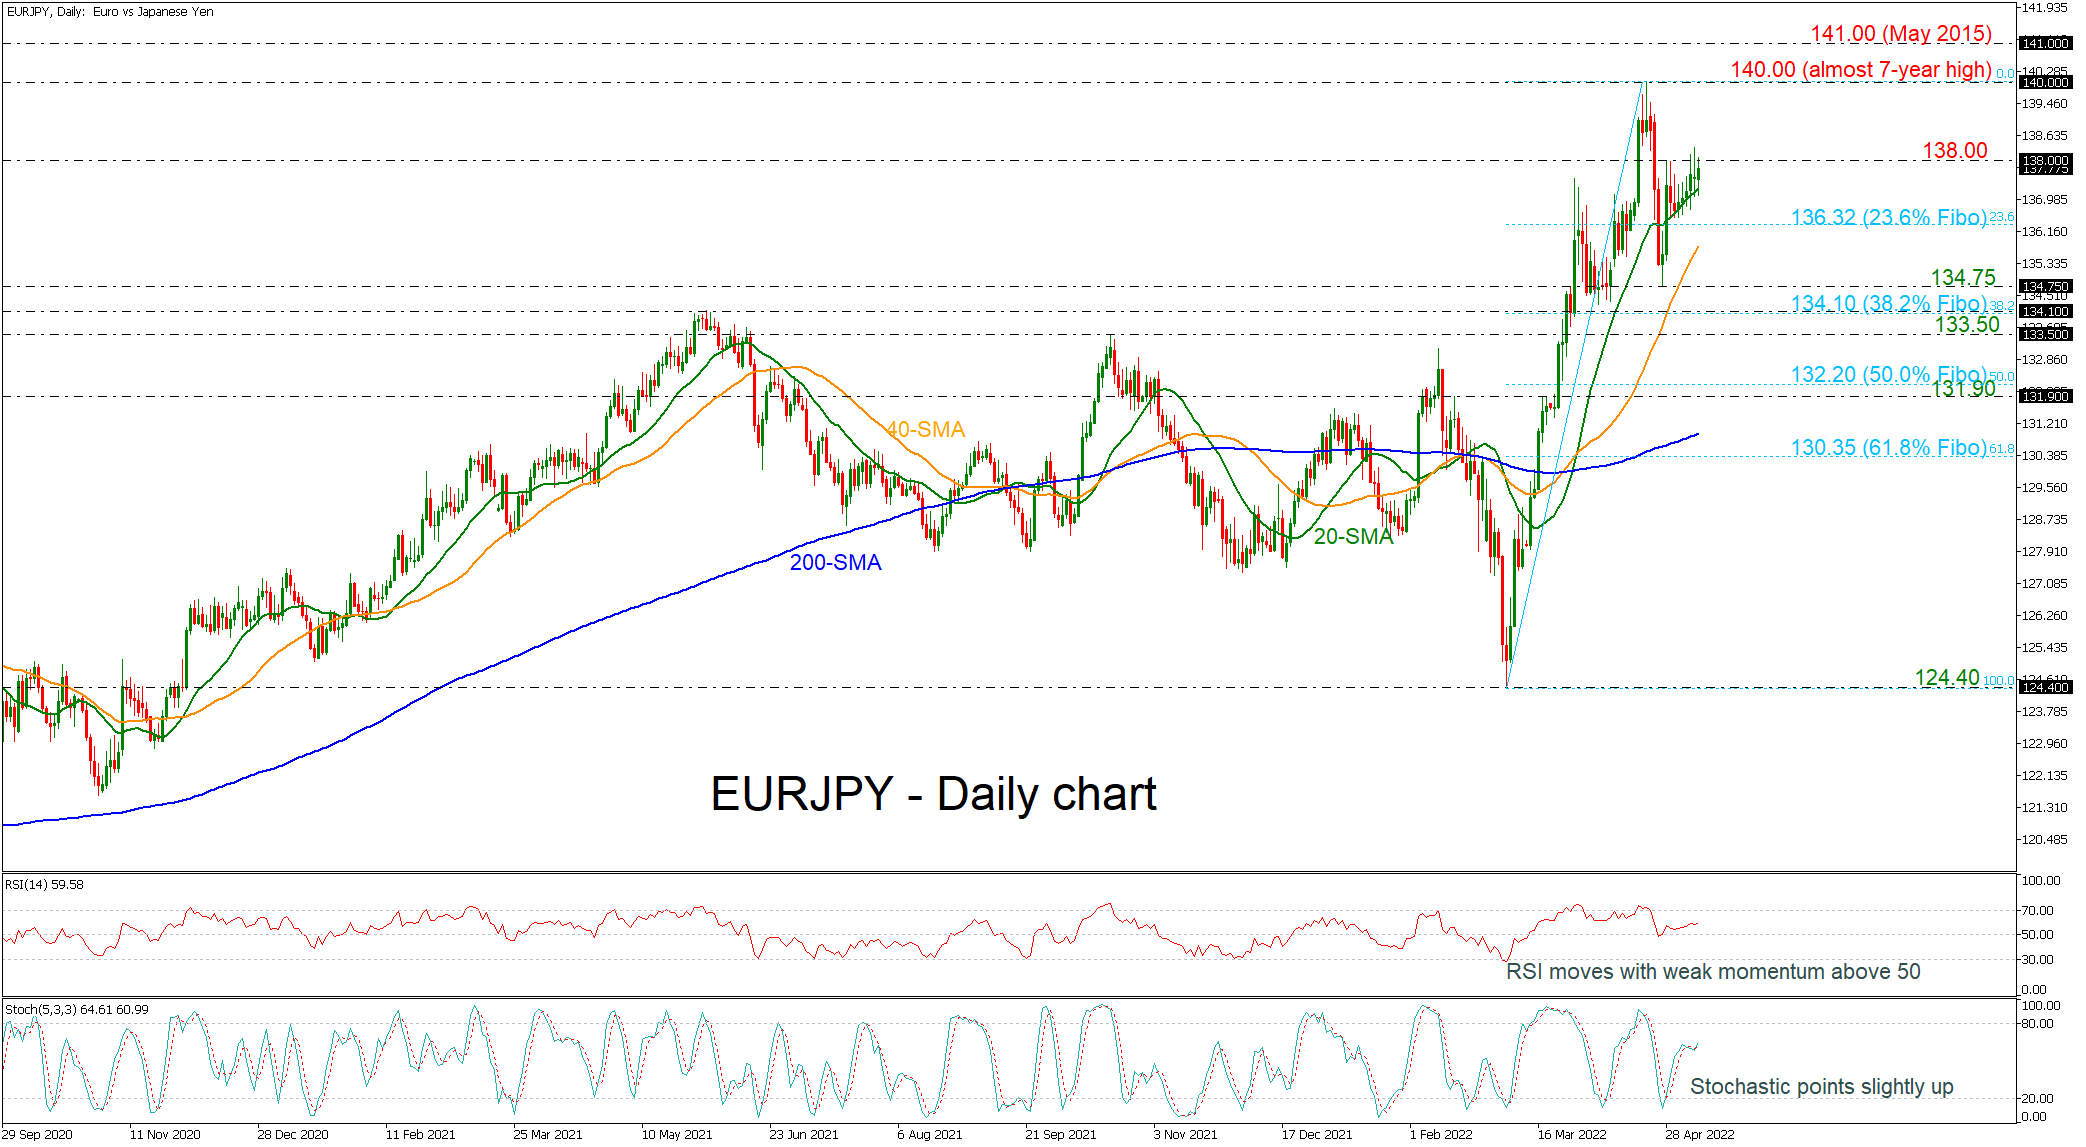
EURJPY gained little this week and remained above the 20-day simple moving average (SMA). The price is finding strong resistance obstacle near the 138.00 psychological mark and any advances above this critical level would endorse the positive bias. The RSI is confirming the recent weak to bullish momentum as it is holding above its 50 level, while the stochastic oscillator completed a positive cross within its %K and %D lines.
If the price fails to rise over the 138.00 level, it may fall to the 20-day simple moving average, which is currently at 137.25. The 23.6% Fibonacci retracement level of the up leg from 124.40 to 140.00 at 136.35 may prove significant support for the bears. However, more declines could meet the 40-day SMA at 135.80 ahead of 134.75.
On the flip side, if 138.00 is easily breached, the focus will shift to the almost seven-year peak of 140.00. Bulls would also have to clear the 141.00 round number, which was recorded in May 2015.
After the rally from 124.40, the short-term outlook for the EURJPY turned bullish. The outlook could improve if the market maintains its upward trend above the 140.00 resistance.
EUR/USD’s Performance May Provide Euro Bulls Some Comfort
Markets
Bond markets are in a schizophrenic state of mind these days. Core bond yields surge at one occasion, bracing for super aggressive tightening cycles by the likes of the Fed but tumble at another when pondering the consequences for growth. The latter took hold yesterday and it was bad news for stocks (again) and commodities. European equities slid a little less than 3%, the Nasdaq underperformed on Wall Street (-4.3%). Brent oil and iron fell about 6%, helping inflation expectations to ease and bull steepening core bond yield curves. The US curve wiped out 6.4 bps (20y) to 14.6 bps (5y). European swap yields slid about 7 bps at the front while still adding >2 bps in tenors from 10y on. UK Gilt yields joined the haven bid and shed as much as 11 bps (2y).
The Japanese yen outperformed currency peers but was very closely followed by the dollar and even the euro. EUR/USD tested the 1.05 big figure for an umpteenth time before rebounding. The pair finished at 1.056, marginally up from 1.054. The British pound lost against its two main competitors but closed off intraday lows. EUR/GBP rose to 0.856, cable (GBP/USD) capped losses to 1.233. BoE hawk Saunders in an interview explained his vote for a 50 bps hike at the meeting last week. Moving early may limit the total of the tightening cycle, he said, and would give a clear signal to markets.Asian stock markets followed the US by opening with deep losses. Sentiment then gradually improved. Equities currently trade about 1-1.5% lower. Hong Kong underperforms in a catch-up move (closed yesterday). Core bond (futures) initially built on yesterday’s gains but that move ran into resistance soon. US yields trade 1-1.4 bps higher across the board. The yen went from first yesterday to last this morning. The dollar trades slightly weaker as well. EUR/USD inches closer toward 1.06.
There’s a slew of ECB and Fed speeches by, a.o., Williams, Mester, de Guindos and Villeroy scheduled today. They take center stage as markets start the countdown to tomorrow’s US CPI reading. Turning to global markets, we have seen in the past that any downward yield correction usually doesn’t last long. For the moment we see no reason why this would be different this time. The sharp intraday U-turn in core bonds during Asian dealings serves as a point in case.
EUR/USD’s performance, both yesterday and this morning, may provide euro bulls some comfort. We remain skeptical for the short run though as long as the ECB hotshots (Lagarde, Lane) don’t give the proverbial green light to a normalization cycle. BRC retail sales were awful (see below) but sterling is probably more interested in Thursday’s GDP numbers.
News Headlines
In its semi-annual financial stability report, the Fed warned that uncertainty on the economic outlook has increased since November due to the Russian invasion un Ukraine. Inflation has been higher and more persistent than expected, even before the invasion, and uncertainty over the inflation outlook poses risks to financial conditions and economic activity. Some measures also indicate that market liquidity has deteriorated in some key markets. While the deterioration has not been extreme, risks are higher than usual. The report warns that elevated inflation and rising yields in the US could negatively affect domestic economic activity, asset prices and credit quality and financial conditions in general. US house prices also can be sensitive to shocks. In a separate statement, Brainard mentions the recent volatility in commodity markets. The war in Ukraine sparked large price movements and margin calls and highlighted a potential channel through which financial institutions could be exposed to contagion.
The Everything Rout
The selloff in stocks, bonds, and Bitcoin deepened on Monday. Even commodities sank and crude oil tumbled more than 8% on the back of mounting worries of a seriously tighter, and potentially ineffective Federal Reserve (Fed) policy that would, to fight back the skyrocketing inflation, pull back support aggressively enough to cause recession.
Another worry is that, even with a significantly tighter monetary policy, the Fed may not be able to tame inflation as much as desired. This is what the inflation expectations tell us.
Red hot
The S&P 500 dive another 3.20% yesterday, and slip below the 4000 points for the first time this year. Nasdaq tanked another 4.30%, and the technology heavy index, more sensitive to changes in interest rates, is down by almost 30% since last November peak; near half of its constituents are down by more than 50% below their 52-week highs.
And money doesn’t flow to ‘safer’ US sovereign bonds, as investors are rapidly unloading the US treasuries as well, given the Fed is now letting its holdings mature to reduce the size of its balance sheet which went through the roof since the 2007 subprime crisis.
The US 10-year yield hit 3.20% yesterday, the highest level since November 2018.
Gold lost more than 1.50% along with the everything rout yesterday, as the rising US yields continue weighing on the yellow metal, as they increase the opportunity cost of holding the non-interest-bearing gold, and making it look like a dull hedge against inflation.
And Bitcoin slipped shortly below the $30K level, as investors unloaded cryptocurrencies along with the other risk assets. Despite the rebound near the $30K mark, which brought some courageous dipbuyers in, the risks remain tilted to the downside for a deeper selloff below the $30K support.
And speaking of traditional safe haven, even the yen and the Swiss franc are completely out of the game right now, with the yen trading above the 130 level against the US dollar for the first time in more than 20 years, and the dollar-swissy flirting with parity for the first time since December 2019.
USD: Safest, and the only safe haven
So, where does the money go? To the US dollar. When everything goes bust, the US dollar is the safest safe haven. The dollar index consolidates near two decade highs. Geopolitical and economic uncertainties support a broad-based dollar appreciation. The US dollar index gains when all other assets tumble. The dollar will remain King, until the stress level in the market eases back to more reasonable levels.
There is one potential catalyzer this week, that could eventually slow down the market selloff: US inflation data due Wednesday. The consumer price index is expected to have eased to 8.1% in April from 8.5% printed a month earlier. A softer inflation is the only thing that could give hope to investors.
Growth Risks Continue to Weigh on Sentiment
Market movers today
We expect another leap higher in inflation in both Denmark and Norway, see more below.
In Germany, we will keep a close eye on ZEW expectations for May. A rebound from the depressed levels in April would be a welcome sign that the economy is not yet headed for recession.
We also have several Fed speakers on the wire. Here we will focus on the possibility of a 75bp hike. We will probably have to wait until after the CPI release on Wednesday to hear advocates for that, though.
The 60 second overview
Risk sentiment: Risk sentiment continued weakening on piling growth risks and rate hike worries, and equity markets declined broadly led by growth and cyclical sectors. Weakening demand outlook also caused oil prices to move sharply lower, with Brent now trading around USD104/barrel. Risk sensitive and commodity currencies weakened, with EUR/NOK moving back above 10.20. Bond yields also ticked lower, as the decline in commodity prices weighed on longer-term inflation expectations. Yesterday, the Sentix investor sentiment indicator declined more than expected to levels consistent with PMIs clearly below 50, and thus signalling rising recession risks.
Victory day aftermath: President Putin's speech ahead of the Victory Day parade on Monday provided little insight into what the next steps of the Russian army could be. Fears of Putin declaring war or announcing mass mobilisation of troops proved unfounded for now. Despite being loaded with propaganda such as Putin claiming provocation from the West and NATO led to the war in Ukraine and him comparing the WWII atrocities by the Nazis to what 'neo-nazis' are now doing in Ukraine, the speech could not be interpreted as an escalation, nor as a de-escalation, for that matter. Rather, it seems Putin is preparing his domestic audience for a protracted conflict in Ukraine. While today's speech was a relief as it did not signal immediate escalation, the threat remains, and Putin did mention nuclear weapons in his speech. That being said, we think only a severe escalation could return markets' focus to the war, as a frozen conflict in Ukraine is largely priced in already.
EU sanctions: While fear of a demand slowdown is the key driver weighing on commodity prices this week, EU's proposed embargo on Russian oil could also turn out to be less strict than what was initially proposed last week. Reuters sources suggested that the next draft would drop the ban on EU tankers carrying Russian oil, while some of the Eastern European states, Hungary, Slovakia and Czech Republic, already secured exemptions from the embargo until 2024. Even if the official embargo gets watered down, self-sanctioning by European oil buyers will have an impact on Russian supply, which will likely keep prices at elevated levels even amid rising recession risks.
Equities: Equity markets in bloodbath yesterday driven by US, growth, tech, small cap but also energy stocks were beaten down heavily as the stagflation fear turned into recession fear. Yields turned around during the day in massive intraday volatility and ended lower but this did lift the appetite for long duration stocks. Nasdaq at lowest levels since Nov-20 after 10% sell-off over past three sessions. Dow -2.0%, S&P 500 -3.2%, Nasdaq -4.3% and Russell 2000 -4.2%. Asian markets somewhat more positive this morning while Hang Seng doing some negative catch -up after the close yesterday. US and European futures are in green at the time of writing after being negative very early this morning.
There was a bullish steepening of the yield curves yesterday with 2Y German govt yields falling 9bp and 10Y falling 3.5bp. However, Germany continues to outperform the periphery and especially Italy, where the 2Y BTPS-Bund spread widened to more than 100bp and we reached the profit target on our recommendation to sell Italy versus Germany. There are some indications that ECB is working on a new tool to stop the fragmentation of the sovereign markets according to a news story on Bloomberg. However, given nothing is public yet, we expect that the spread widening can continue short-term.
FX: Risk- and commodity sensitive currencies suffered heavily in yesterday's session with most notably EUR/NOK moving above 10.20 and EUR/SEK settling in the 10.60s. EUR/USD rose half a big figure to around 1.0560.
Credit: Overall credit markets had a weak start to the week with iTraxx Xover widening 7bp to 469bp. At the beginning of 2022 iTraxx Xover was trading at 242bp. Main was wider by 1bp to 98bp. At the start of 2022 Main traded at 48bp.
Nordic macro
Denmark: We expect Danish April CPI inflation increased further to 6.0% from 5.4% in March. We expect the primary driver to be the large increase in electricity prices that we saw in the spring. On top of that, the tobacco fee should be fully phased in with the April figures. We will also keep a close eye on food prices which have accelerated recently and are already at 6.3% yoy.
Sweden: In Sweden, there is an open hearing about monetary policy in the Riksdag Finance Committee starting at 10:00. All six Board members participate. We will listen for nuances on policy beyond what was provided in the minutes.
Norway: Given stronger global inflationary pressures and higher wage growth, Norwegian core inflation is likely to climb further in the coming months, and we expect core inflation rose to 2.4% y/y in April. That would be only marginally above the 2.3% that Norges Bank predicted in its March monetary policy report and should have limited market effects. That said, history has seen big movements in April due to Easter-related effects on food and transport, so the uncertainty is high.
EUR/USD Daily Outlook
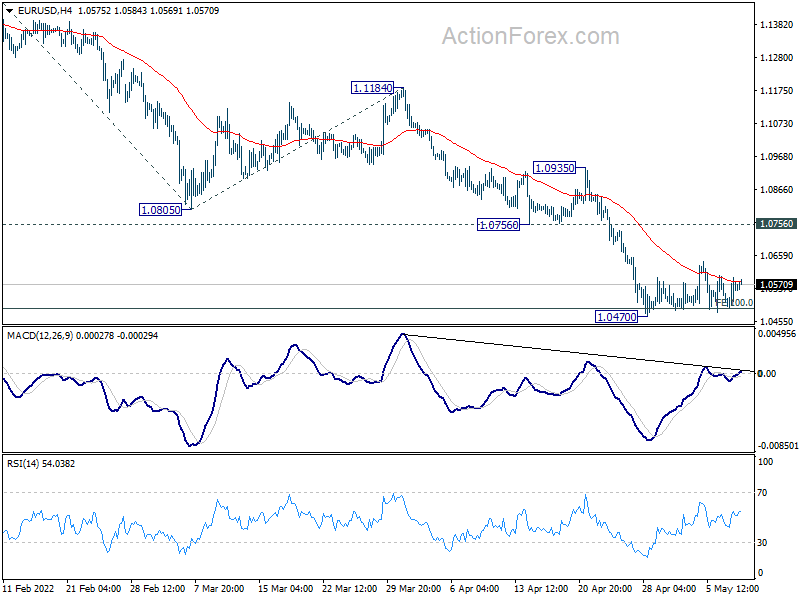
Daily Pivots: (S1) 1.0506; (P) 1.0549 (R1) 1.0604; More...
Intraday bias in EUR/USD remains neutral and outlook is unchanged. In case of another recovery, upside should be limited by 1.0756 support turned resistance to bring fall resumption. On the downside, firm break of 1.0470 will resume larger down trend to 161.8% projection of 1.1494 to 1.0805 from 1.1184 at 1.0069.
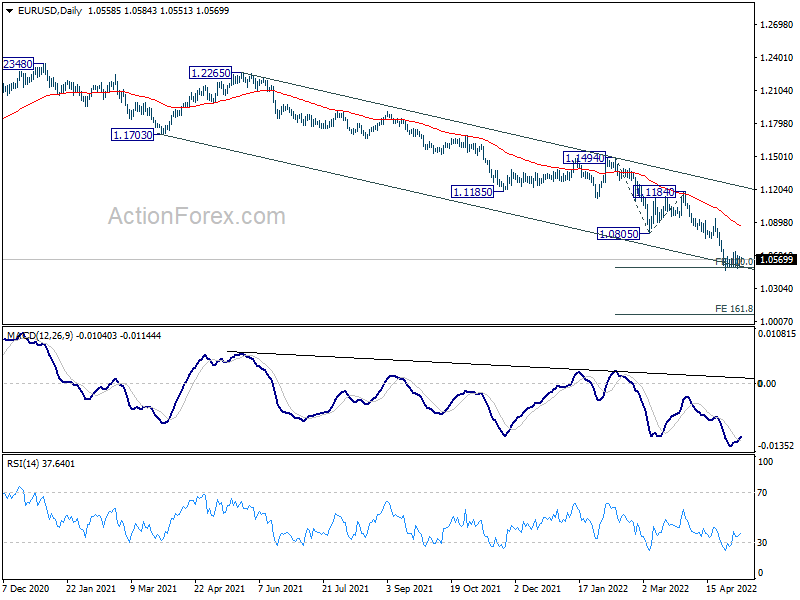
In the bigger picture, the decline from 1.2348 (2021 high) is expected to continue as long as 1.1185 support turned resistance holds. The break of 1.0635 (2020 low) now raises the chance that it's resuming long term down trend from 1.6039 (2008 high). Retest of 1.0339 (2017 low) low should be seen next. Decisive break there will confirm this bearish case.
GBP/USD Daily Outlook
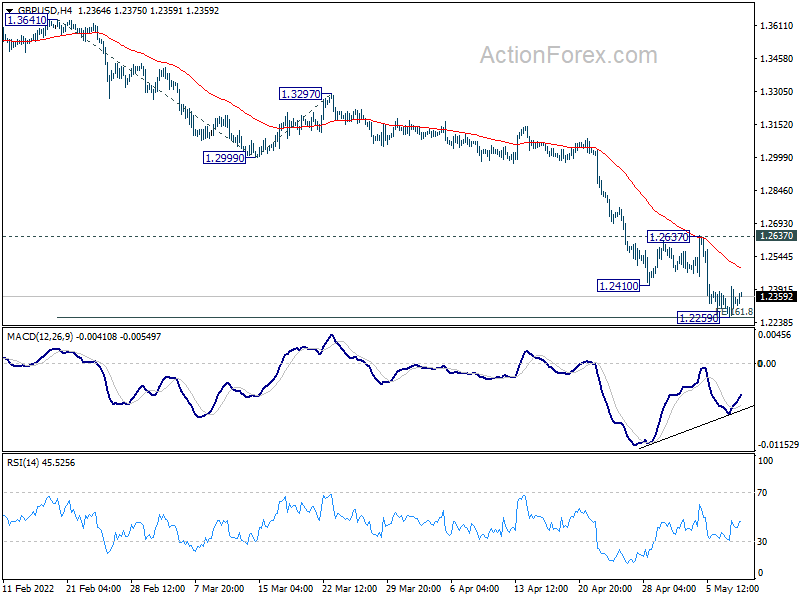
Daily Pivots: (S1) 1.2259; (P) 1.2333; (R1) 1.2403; More...
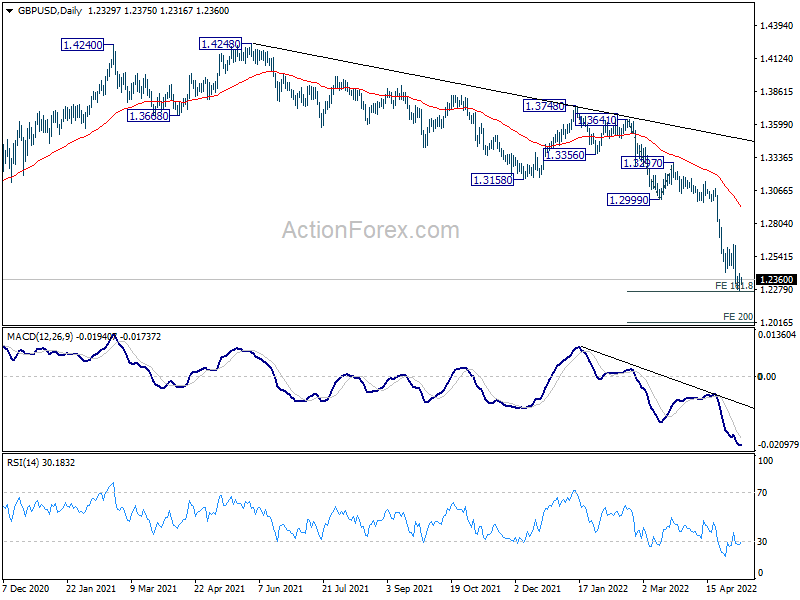
Intraday bias in GBP/USD remains neutral for the moment. Some consolidations could be seen but upside of recovery should be limited by 1.2637 resistance to bring fall resumption. On the downside, firm break of 161.8% projection of 1.3641 to 1.2999 from 1.3297 at 1.2258 will extend recent down trend to 200% projection at 1.2013 next.
In the bigger picture, based on current momentum, fall from 1.4248 (2018 high) at least at the same degree as the rise form 1.1409 (2020 low). That is, fall from 1.4248 could be a leg inside the pattern from 1.1409, or resuming the longer term down trend. In either case, deeper decline is expected as long as 1.2999 support turned resistance holds. Next target is 1.1409 low.
USD/CHF Daily Outlook
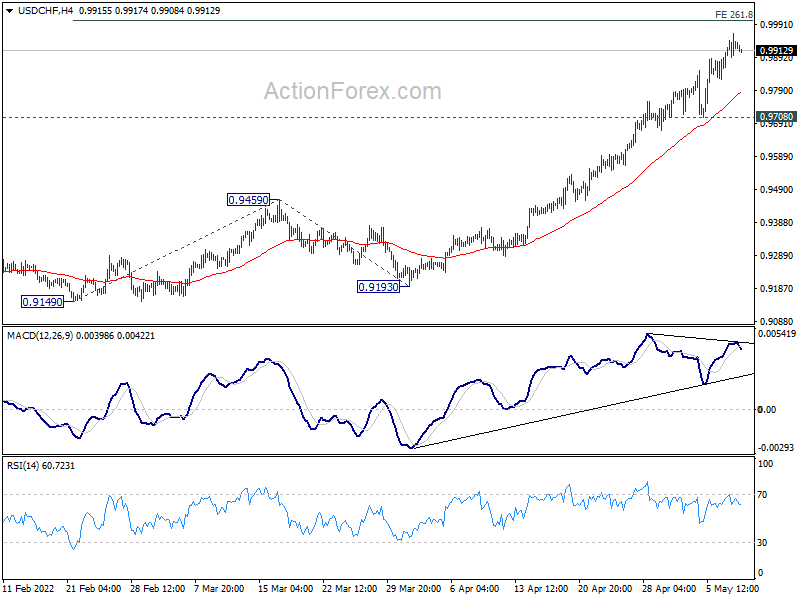
Daily Pivots: (S1) 0.9879; (P) 0.9922; (R1) 0.9983; More....
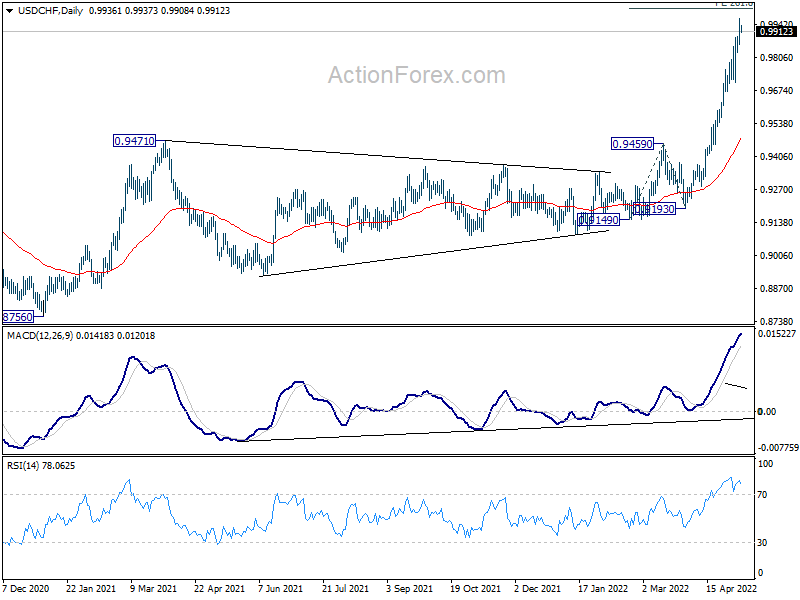
Intraday bias in USD/CHF remains on the upside despite some loss of momentum. Further rally should be seen to 261.8% projection of 0.9149 to 0.9459 from 0.9193 at 1.0005 next. On the downside, break of 0.9708 support is needed to indicate short term topping. Otherwise, outlook will stay bullish in case of retreat.
In the bigger picture, down trend from 1.0342 (2016 high) should have completed with three waves down to 0.8756 (2021 low) already. Rise from 0.8756 is likely a medium term up trend of its own. Sustained trading above 100% projection of 0.8756 to 0.9471 from 0.9149 at 0.9864 will pave the way to 161.8% projection at 1.0306, which is close to 1.0342 (2016 high). This will remain the favored case as long as 0.9459 resistance turned support holds.
USD/JPY Daily Outlook
Daily Pivots: (S1) 129.85; (P) 130.60; (R1) 131.08; More...
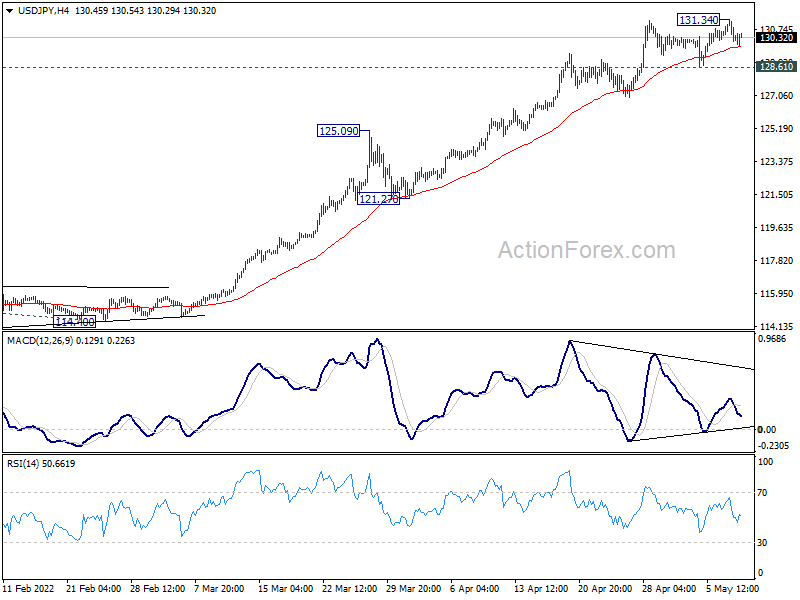
Intraday bias in USD/JPY is turned neutral again as it retreated quickly after hitting 131.34. Further is expected as long as 128.61 support holds. Above 131.34 will target 261.8% projection of 109.11 to 116.34 from 114.40 at 133.26. However, firm break of 128.61 will indicate short term topping, and turn bias to the downside for deeper pull back.
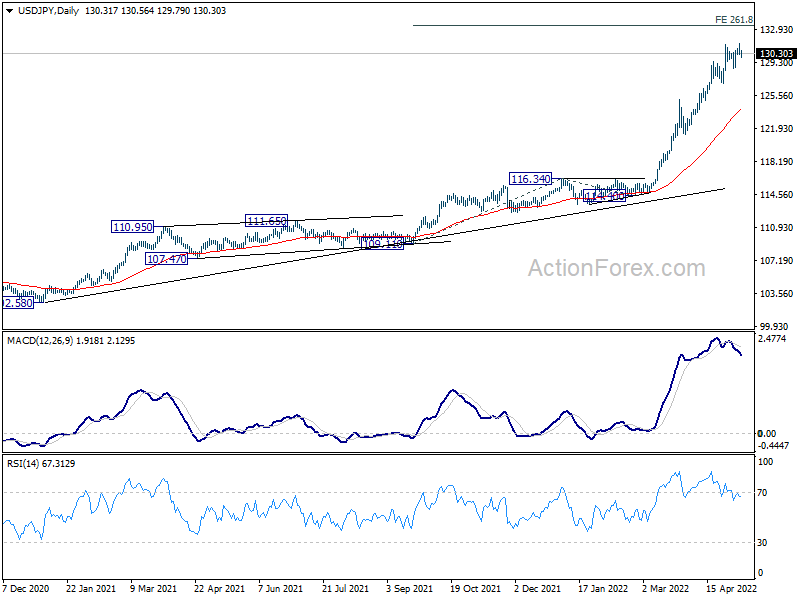
In the bigger picture, current rally is seen as part of the long term up trend form 75.56 (2011 low). Sustained trading above 61.8% projection of 75.56 (2011 low) to 125.85 (2015 high) from 98.97 at 130.04 will pave the way to 100% projection at 149.26, which is close to 147.68 (1998 high). For now, this will remain the favored case as long as 121.27 support holds.
AUD/USD Daily Report
Daily Pivots: (S1) 0.6905; (P) 0.6988; (R1) 0.7032; More...
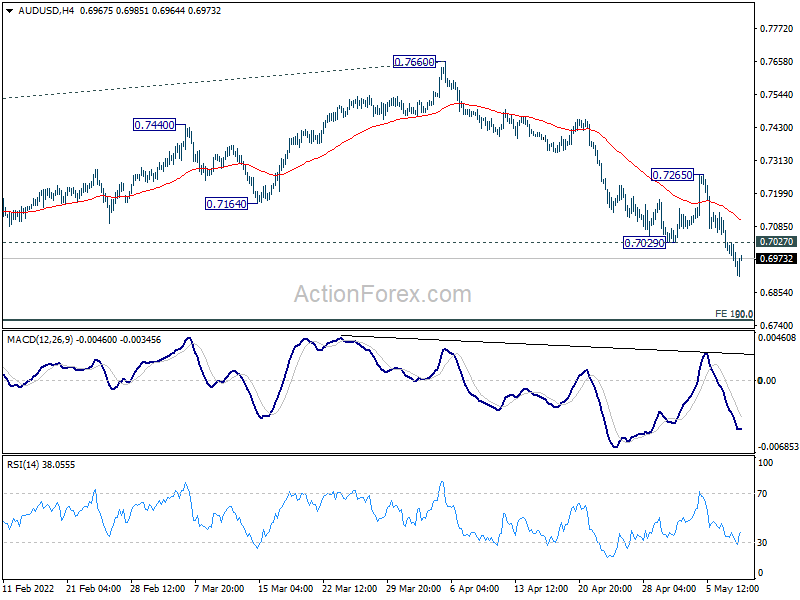
AUD/USD's break of 0.6966 low confirms resumption of whole corrective pattern from 0.8006. Intraday bias stays on the downside for 0.6756 medium term fibonacci level next. On the upside, above 0.7027 minor resistance will turn intraday bias neutral first. But near term outlook will stay bearish as long as 0.7265 resistance holds.
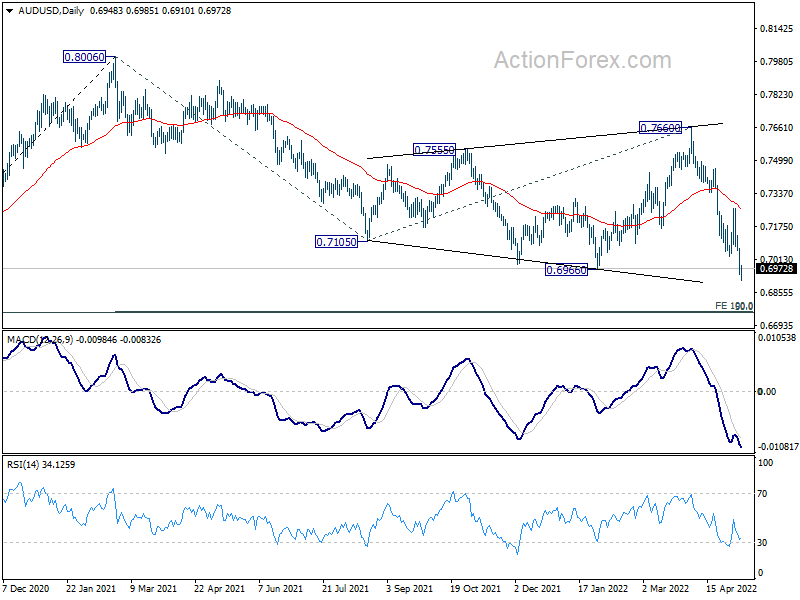
In the bigger picture, price actions from 0.8006 are seen as a corrective pattern to rise from 0.5506 (2020 low) with fall from 0.7660 as the third leg. Deeper fall should be seen to 50% retracement of 0.5506 to 0.8006 at 0.6756. This coincides with 100% projection of 0.8006 to 0.7105 from 0.7660 at 0.6760. Strong support is expected from 0.6756/60 cluster to contain downside to complete the correction. However, sustained break of 0.6756/60 would argue that AUD/USD is indeed in a medium term down trend.
USD/CAD Daily Outlook
Daily Pivots: (S1) 1.2940; (P) 1.2978; (R1) 1.3053; More...
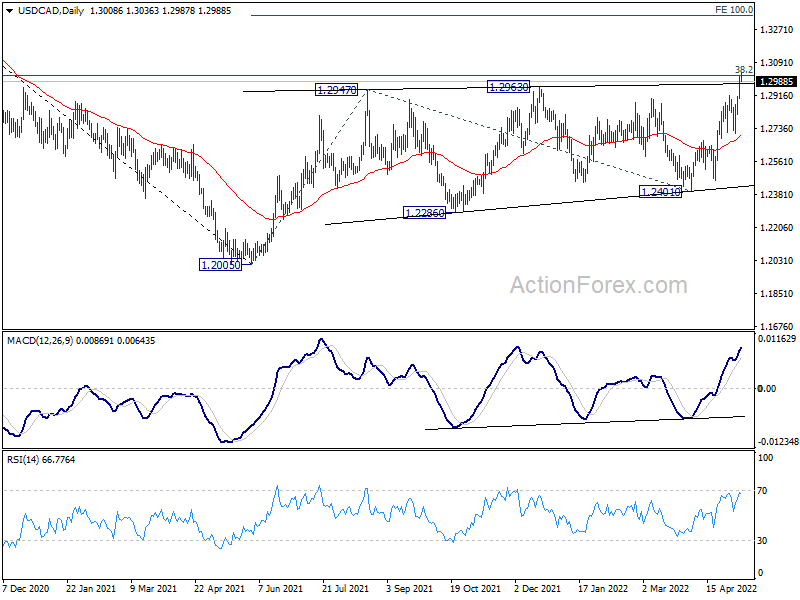
USD/CAD's rally continued and met 1.3022 fibonacci level already. There is no sign of topping yet and intraday bias stays on the upside. Sustained break of 1.3022 will carry larger bullish implications. Next target will be 100% projection of 1.2005 to 1.2947 from 1.2401 at 1.3343. On the downside, below 1.2907 minor support will turn intraday bias neutral first. But further rally will remain in favor as long as 1.2712 support holds.
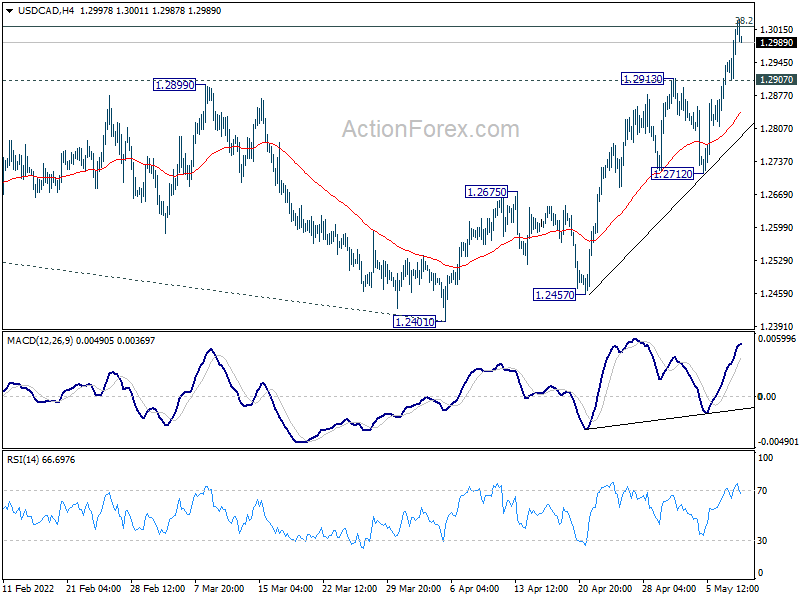
In the bigger picture, focus stays on 38.2% retracement of 1.4667 (2020 high) to 1.2005 (2021 low) at 1.3022. Sustained break there should confirm that the down trend from 1.4667 has completed after defending 1.2061 long term cluster support. Further rise would then be seen towards 61.8% retracement at 1.3650. However, rejection by 1.3022 will maintain medium term bearishness. Break of 1.2005 will resume the down trend from 1.4667 and that carries larger bearish implications too.