Sample Category Title
NZDJPY: Bullish Sequence and Trading Strategy
In this blog, we will look at the strong rally in NZDJPY which took place this year, talk about the sequence, what it means for the pair and also what our trading strategy is going forward. We will look at a sequence chart and also a chart showing the extreme area down from April 20, 2022 peak and highlight the next extreme area where we can see buyers entering the market to resume the rally or produce 3 waves reaction higher at least.
NZDJPY Bullish Sequence Since January 28, 2022 Low
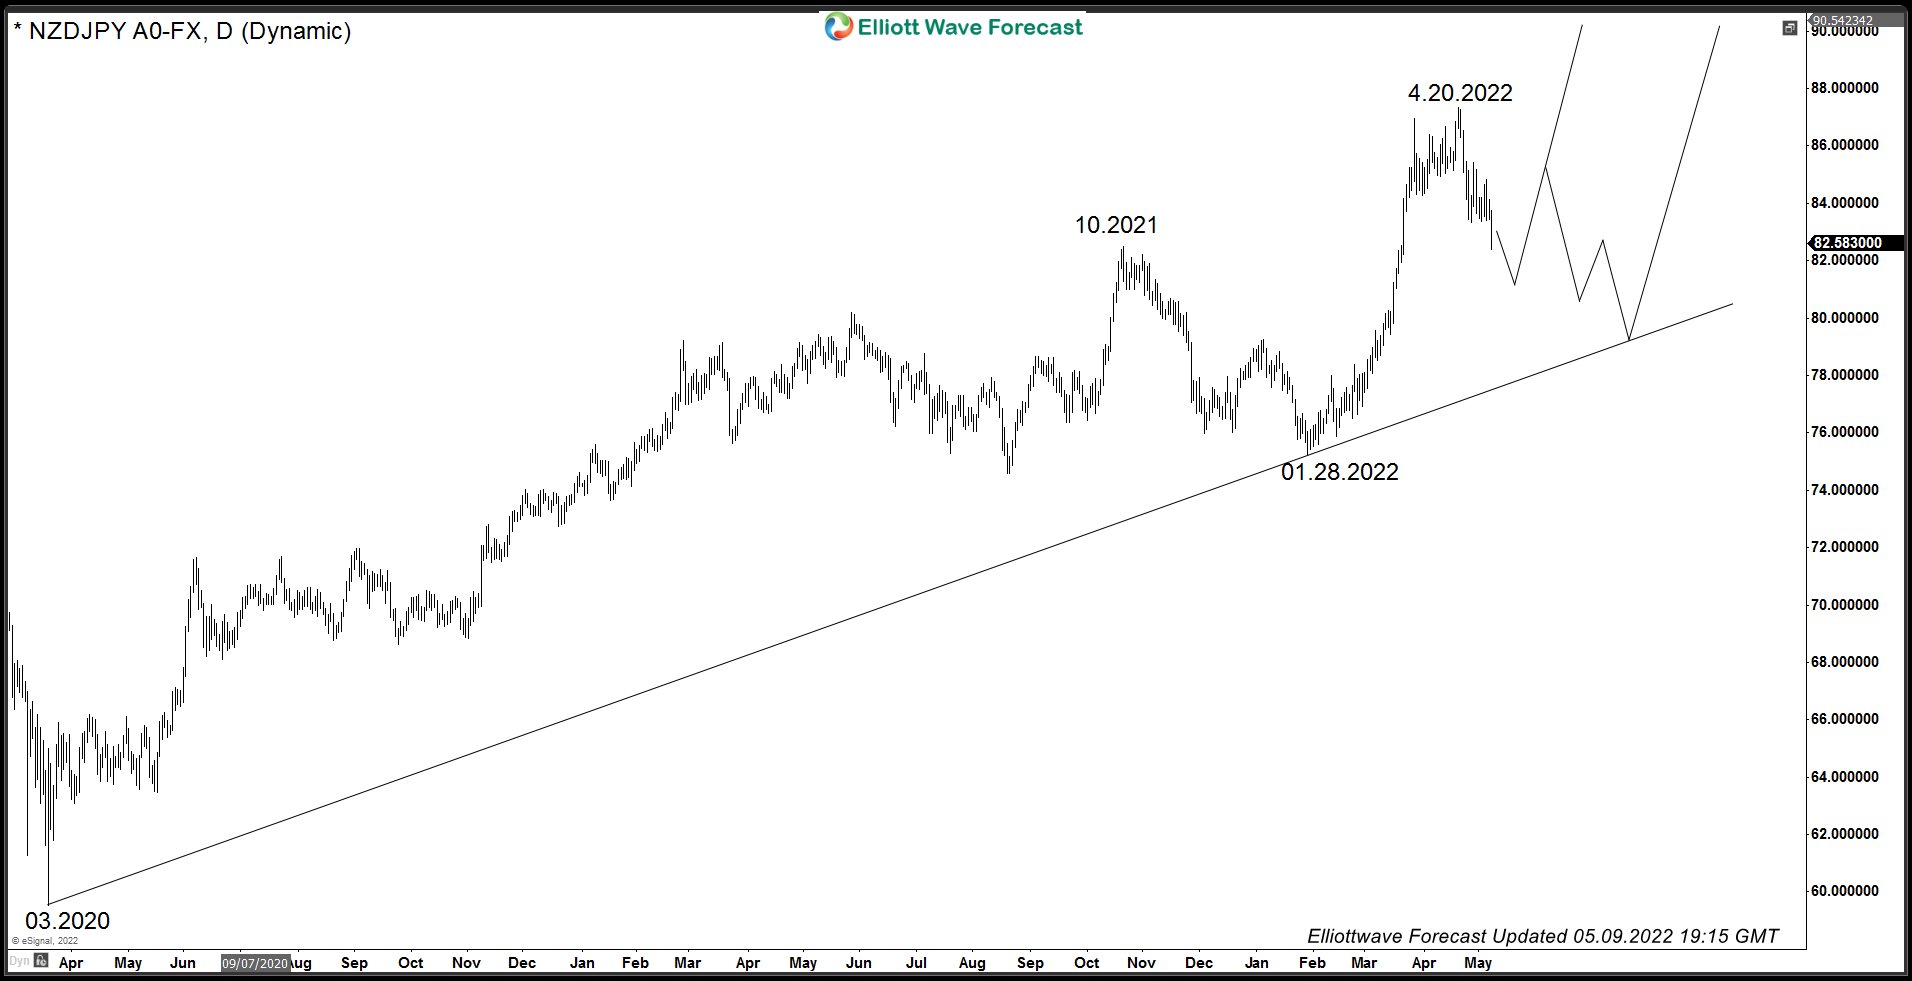
Chart below shows NZDJPY ended a cycle from 03.2020 low at 10.2021 peak. This rally was in 5 waves as we can see a clear impulsive advance. This was followed by a 3 waves pull back which ended at 01.28.2022 low. Then pair resumed the rally and went on to make a new high above 10.2021 peak. Break above 10.2021 peak created an incomplete bullish sequence and opened extension higher. Sequence is bullish against 01.28.2022 low and as dips hold above this level, expect buyers to remain in control and appear in the dips in 3, 7 or 11 swings. While above 01.28.2022 low, next target area remains to be 98.31 – 103.74.
NZDJPY: Elliott Wave Structure Down from April 20, 2022 Peak
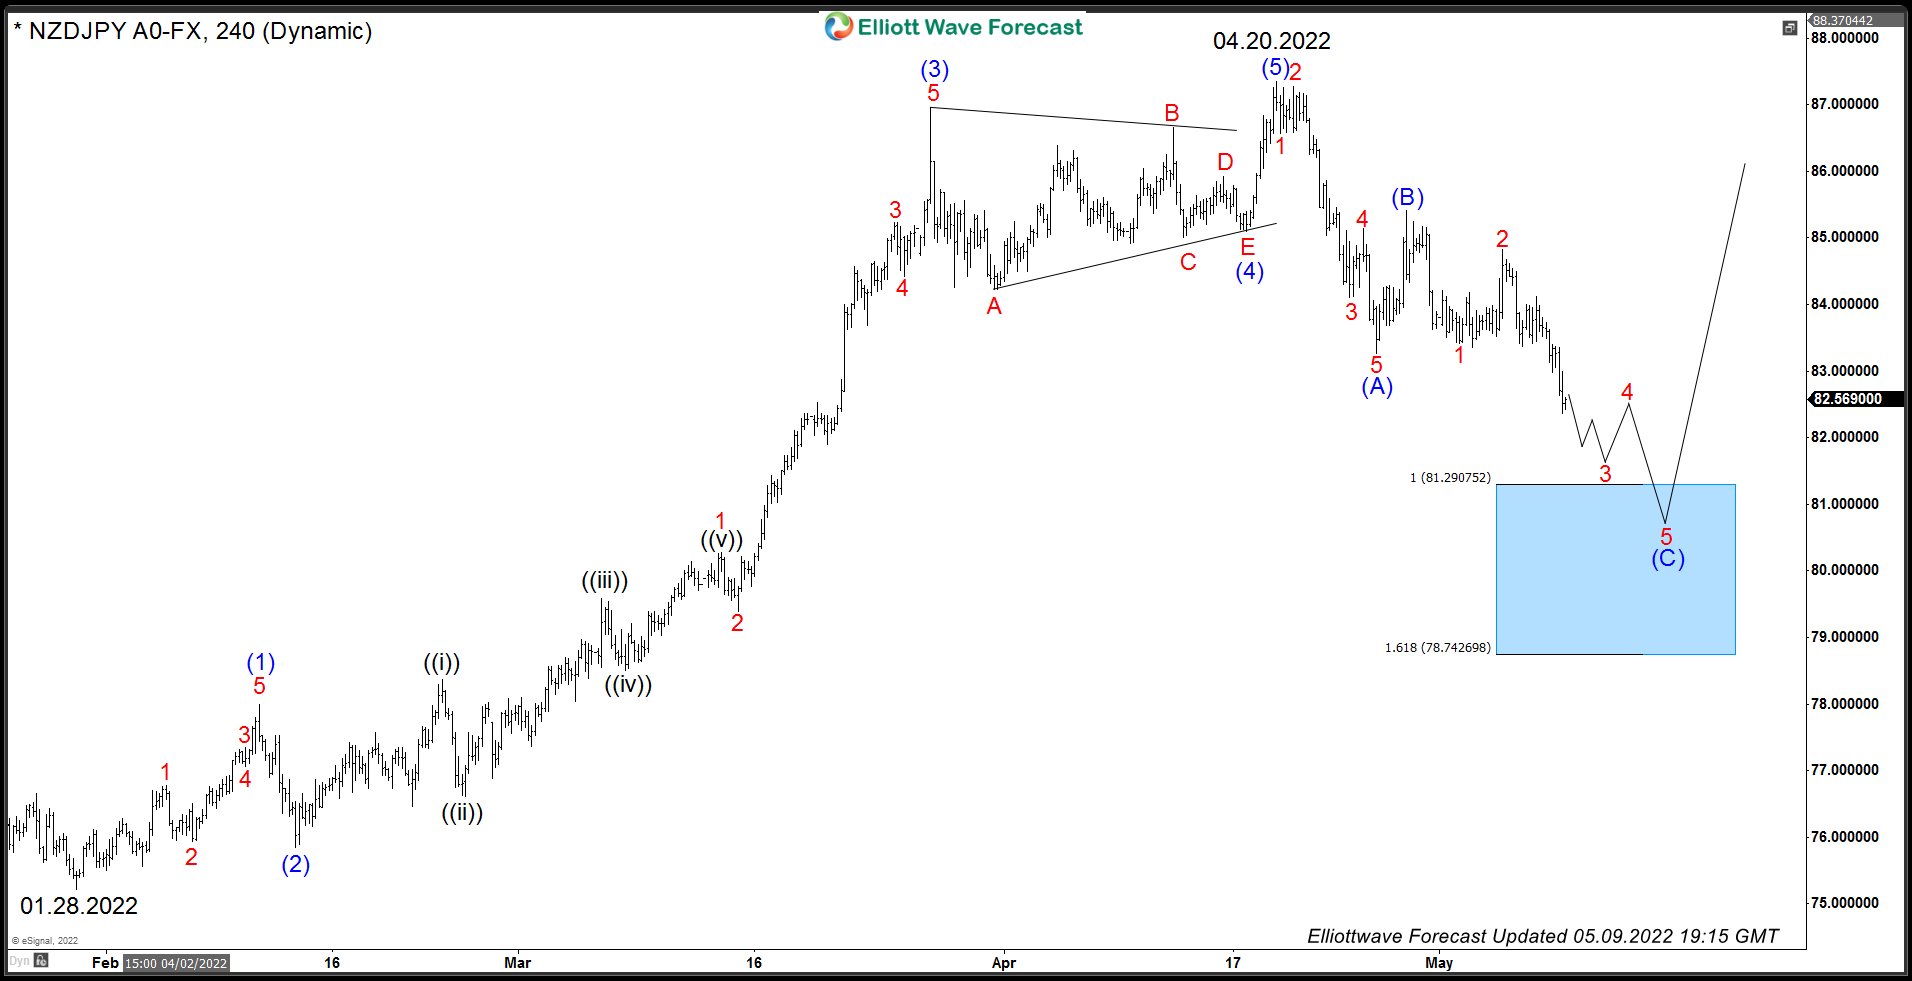
Decline from 04.20.2022 peak is unfolding as a Zigzag Elliott wave structure which is a 5-3-5 structure. In this structure, wave A is in 5 waves, wave B is in 3 waves and wave C is also in 5 waves. Wave B could be any corrective structure. We can see a clear 5 waves decline from 04.20.2022 peak to 04.26.2022 low which we have labelled as wave (A). This was followed by 3 waves bounce to 04.28.2022 peak and now pair has broken below 04.26.2022 low which creates a short-term incomplete bearish sequence. As bounces fail below 05.04.2022 (84.82) and more importantly below 04.28.2022 (85.00), expect more downside towards 81.29 – 78.74 where buyers should appear and resume the rally for next leg or produce 3 waves reaction higher at least. Alternative view is that bounce from the blue box will fail in 3 swings for another 3 swings extension lower to complete a double correction before higher again. Once the reaction from blue box reaches 50% Fibonacci retracement of the decline from 04.28.2022 (85.41), buyers from blue box should be able to eliminate risk on the trade and get into a risk free position and buy then buy again lower at next equal legs area in case of a larger double correction to the downside.
Eco Data 5/10/22
[php_everywhere instance="1"]
BoE Saunders: My preference to move relatively quickly to a more neutral stance
BoE MPC member Michael Saunders said in a speech, "I put considerable weight on risks that, unless checked by monetary policy, domestic capacity and inflation pressures would probably be greater and more persistent than the central forecast."
"As a result, my preference has been to move relatively quickly to a more neutral monetary policy stance," he added.
"The strength of external costs is eroding real incomes and is likely to cap real spending," he explained. "But, by creating a long period of above-target inflation, these external cost increases also may exacerbate the rise in inflation expectations and hence, with the tight labour market, could make it harder to ensure domestic inflation pressures return to a target-consistent pace."
Crude Oil’s Triangle
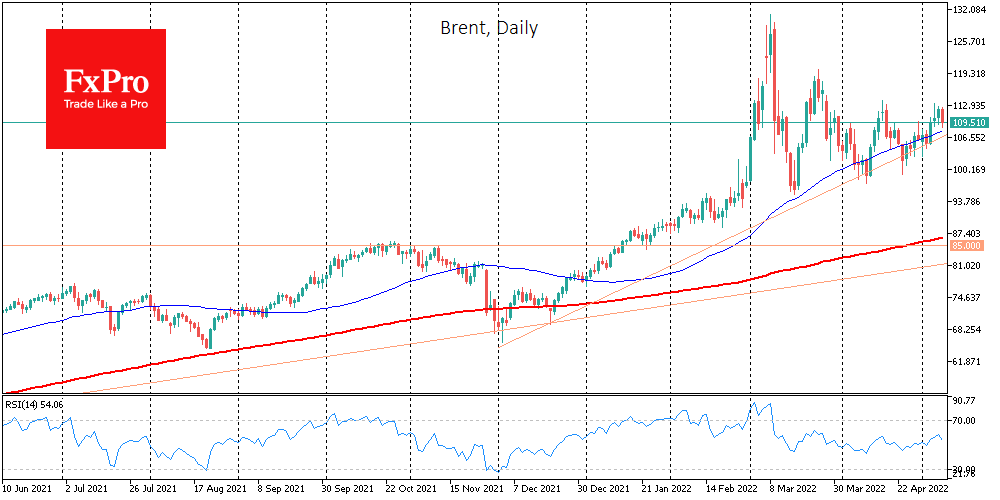
Brent crude is back below $110/bbl, losing 2% since the start of the day on Monday. At the beginning of May, oil largely remained within the trends of previous months. There are still accumulating risks that oil will break down this support, giving the start of a correction.
Brent maintains an upward trend, but it is also running near a line that passes near the lows of the last five months. Since last month, bulls and bears have been concentrating on pulling the tug-of-war near the 50-day average, which has been pointing upwards since the beginning of the year.
Positively for oil, the G7 has declared a phase-out of Russian oil purchases, and OPEC has indicated a commitment to a rate increase of 432k a month.
But at the same time, Saudi Arabia has cut its oil price premium to buyers in Europe and Asia.
Also playing out locally against oil was the news that Russia has stabilised production after a dip in April. In addition, drilling activity is picking up in the US, which promises a rise in output in the next few months. There is also more incentive for Saudi Arabia to increase its production.
Brent remains in a triangle on the technical analysis side, retreating from its upper boundary. Locally, traders should pay attention to the dynamics of Brent near $112, where the area of previous local peaks is located. Bears, for their part, may cheer up in case of consolidation under $104, where purchases were strengthened last week.
A move out of the $104-$112 range could increase volatility in oil.
US 100 Index Extends Losses Within Bear Market
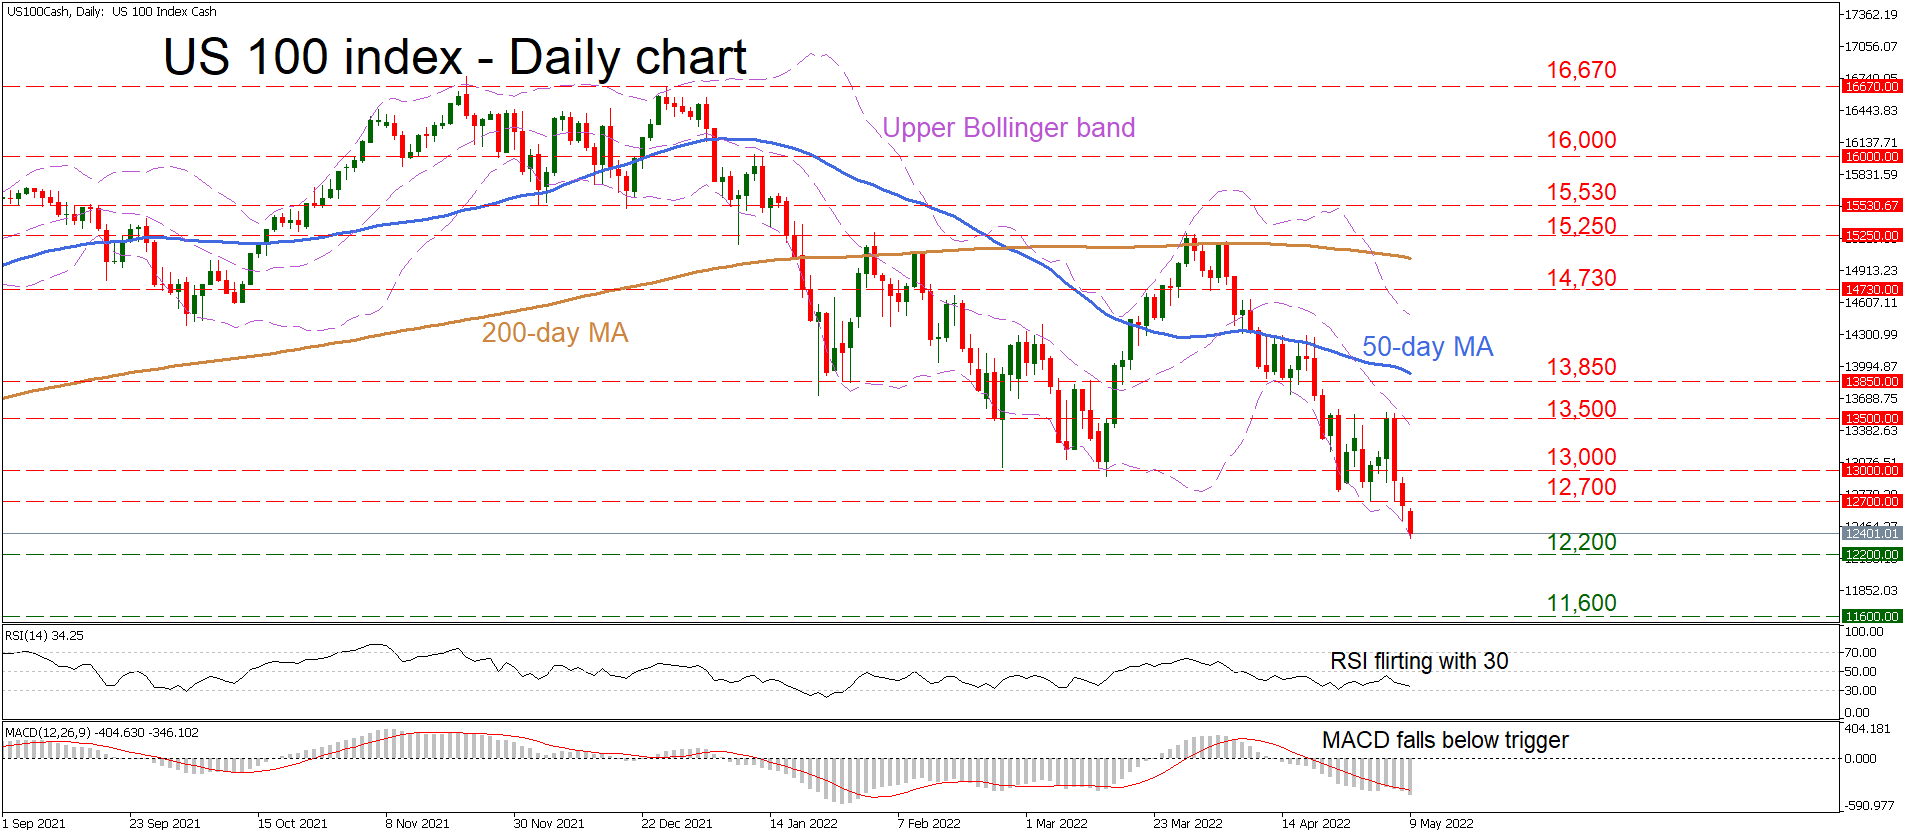
The US 100 cash index (Nasdaq) came under renewed pressure in recent sessions, sinking to a fresh one-year low. Sellers are firmly in control with a series of lower highs and lower lows forming on the daily chart, the moving averages turning lower, and the price testing the lower Bollinger band.
Short-term oscillators reflect the sharp selloff, with the RSI turning lower to approach its 30 zone while the MACD has crossed beneath its red trigger line.
In case the bear market continues, the 12,200 zone could be the next source of support for the index. A deeper slide would turn the spotlight towards 11,600, a region that acted both as support and resistance back in late 2020 and also roughly coincides with the 50% Fibonacci retracement level of the March 2020 - November 2021 rally.
Should the bulls retake the wheel, the initial obstacle to any recovery rallies could be the 12,700 level. If that is overcome, the next barrier would be the round figure of 13,000 that is nearby. Even higher, the recent local highs around 13,500 would attract attention.
All told, the index is down 25% from its record highs. The technical picture continues to favor the downside and a break below 12,200 could re-energize the bears.
EUR/GBP: Can the Good Times Last?
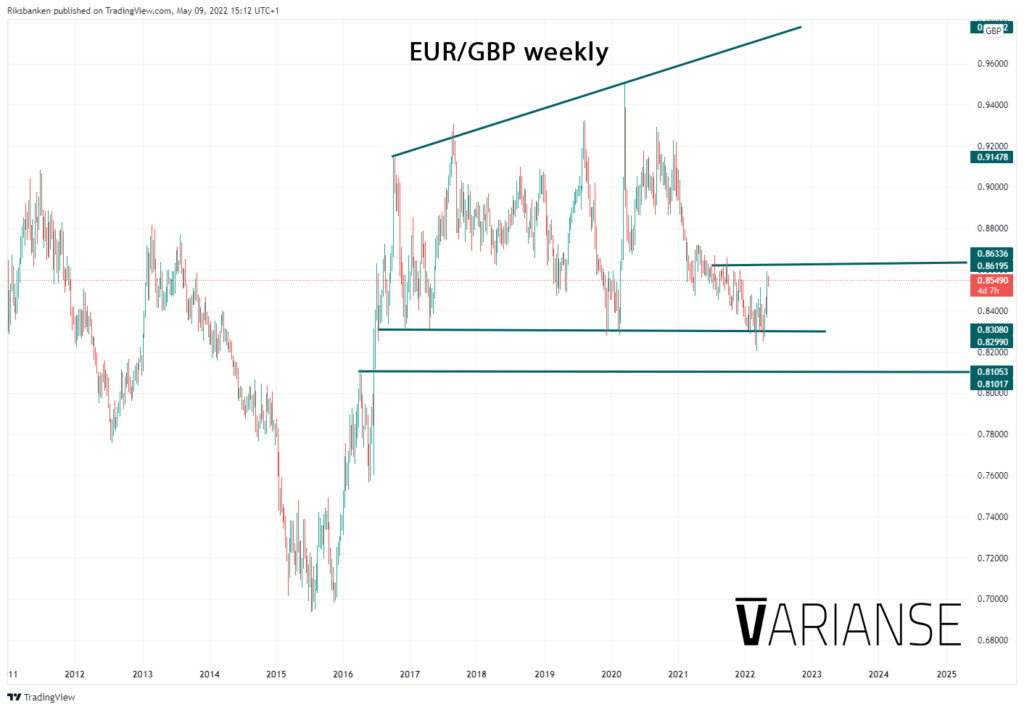
Last week was big for EUR/GBP. The pair ended up by nearly 2% to close at 0.85498 – its largest weekly gain since the week closing 9 April 2021. Back in April 2021, EUR/GBP failed to hold on to those gains and subsequently ground lower to touch a low of 0.8208 by early May 2022. Will the same happen this time around or has there been a seismic shift in EUR/GBP prospects for the better?
What can be said for certain is that market conditions at that time were markedly different than they are today. EUR/GBP gains in April 2021 were largely attributed to profit taking. Prior to the strong weekly gain, EUR/GBP sharply off the back of COVID-19 vaccination rollouts in the UK. Thereafter, EUR/GBP continued to grind lower as the UK economy showed prospects of recovery.
Today, supply-chain issues, elevated global inflation, and war in the Ukraine are taking their toll on the post-COVID global economy. Last week’s Bank of England decision showed trepidation on behalf of the central bank to raise interest rates too aggressively in the future. Meanwhile, the ECB may quicken its end to QE and raise interest rates much sooner than previously thought even a few months ago.
A stronger narrative for EUR/GBP this time around, however, doesn’t necessarily translate into a more positive technical picture. Although last week’s long candle is strong, its body represents just 72% of the total candlestick, shy of the 90% that would be more convincing of a continuation of gains. Furthermore, the pair is sitting at the bottom of a long-term broadening pattern where partial rises could lead to an eventual fall.
In the meantime, keep an eye our for the 0.8600-0.8666 as a key area of resistance both in psychological terms, but also because it marks the start of a resistance region established in the latter half of 2021. From there, a break above 0.87195 would open the window for more substantial gains. To the downside, a break below the 0.830 area would point to a potential drop to the 0.81172.
Japanese Yen Hits 20-Year Low
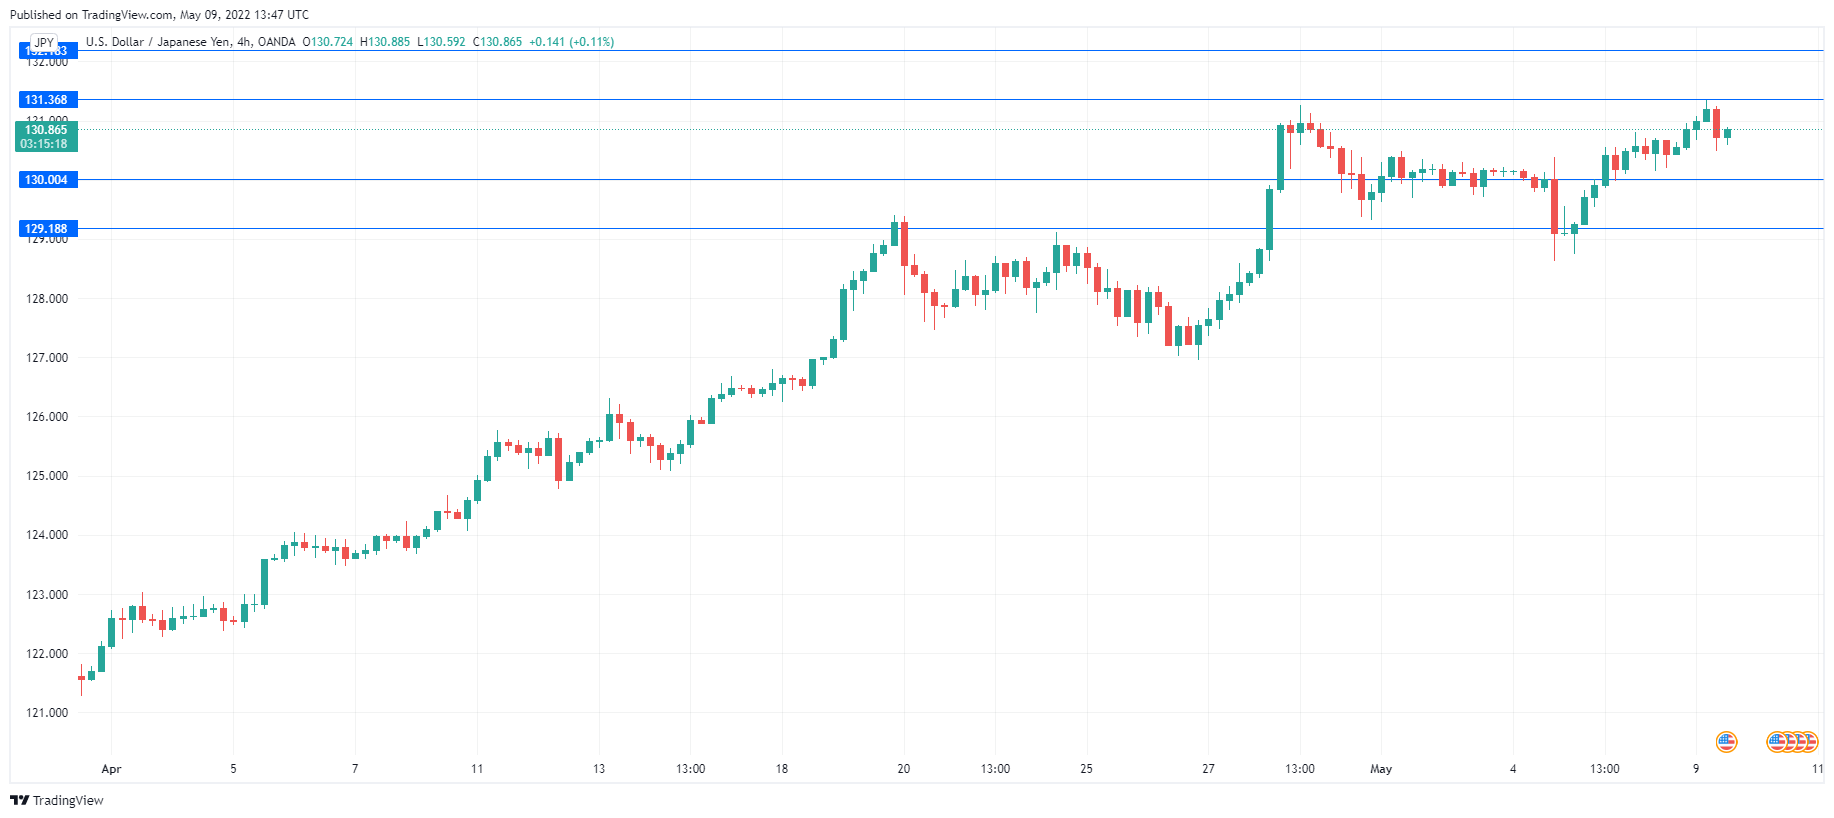
The Japanese yen is slightly lower at the start of the week. In the Asian session, the yen fell as low as 131.35, which marked a 20-year low.
Will BoJ step in to defend the yen?
The speed of the Japanese yen’s depreciation has been remarkable, falling 12% against the US dollar in just three months. The formula for the yen’s slide has been relatively simple – US Treasuries have been moving higher, while the BoJ has fiercely defended its yield control curve, capping the 10-year yield at 0.25%. Since the yen is extremely sensitive to the US/Japan rate differential, the dollar has pummelled the yen.
Moving forward, the BoJ isn’t about to change its stance and allow JGB yields to increase. The central bank is committed to an ultra-loose monetary policy and has been using debt financing, with the government’s debt currently at a staggering 250% above GDP. This means it becomes a huge expense for the government if JGB yields move upwards. US Treasury yields continue to move higher, with the 10-year yield inching higher on Monday to 3.13%. The risk on USD/JPY remains tilted upwards, but the question is whether the BoJ will continue to sit on the sidelines and allow the yen to sink.
Does the BoJ have a ‘line in the sand’ when it comes to the exchange rate? There had been talk of the 130-level triggering intervention, but that hasn’t happened, as the BoJ and Japan’s Ministry of Finance (MoF) have limited themselves to jawboning that they are monitoring the situation and are deeply worried about the yen’s rapid descent. According to a BoFA note on Monday, 140 is a key line that could trigger yen intervention. The 140-level has held since 1998, and if breached, the MoF could respond and buy yen in order to stabilize the currency. In the meantime, the yen will likely continue to lose ground, with the Federal Reserve expected to continue to tighten at an aggressive pace.
USD/JPY Technical
- USD/JPY faces resistance at 1.3136 and 1.3218
- There is support at 1.3000 and 1.2918
Sunset Market Commentary
Markets
Russian President Putin’s speech at Victory Day didn’t deliver the feared escalation in the war against Ukraine. Markets reacted stoic, avoiding the trap to turn positive on the likelihood of a near-term cease-fire. Oil prices cede ground though in a move which was also inspired by a Bloomberg report that the EU will drop a proposed ban on EU-owned vessels transporting Russian oil to third countries. That would be an easing of the latest sanctions package against the country. The final element at play are the continued and stricter Chinese lockdowns (Beijing, Shanghai). Brent crude slid from $113/b to below $110/b after failing to take out $113.61 to $115.73 resistance over the past couple of sessions. Other commodities trade on the back foot as well with most metals losing 2% to 3% and Nickel (-6%) underperforming. Soft commodities paint a more mixed picture.
The setback in commodities didn’t set the stage for a turnaround on other markets. Rate markets remain in the driver’s seat in absence of other eco data and events. The German yield curve steepens with yield changes ranging between -6.1 bps (2-yr) and +3.5 bps (30-yr). We admit that bonds are off worst intraday levels as US investors joined the fray. The German 10-yr yield set a new recovery high at 1.2% with the EU 10y swap rate briefly above the psychologic 2% mark for the first time since end 2014. The same reasoning goes for US Treasuries with US yield changes currently ranging between -8.6 bps (2-yr) and +4.1 bps (30-yr). The US 10-yr yield set a new YTD high at 3.2%. Sentiment on European stock markets remained sour with main indices giving away 1.5% and more. The EuroStoxx50 is dropping towards the YTD sell-off low at 3387. Main US indices open with 1%+ losses.
EUR/USD tested the 1.05 big figure for an eighth session running, but a break lower was again avoided. The risk adverse market setting and decline in commodities might have suggested otherwise. At EUR/USD 1.0542 it’s hard to talk about a sustained rebound either. EUR/GBP is going nowhere near last week’s best levels around 0.8550. Northern Ireland’s election outcome (see below) had no impact. Thursday’s UK Q1 GDP numbers will be closely monitored against the grim eco outlook for the remainder of the year.
News Headlines
UK Secretary of State for Northern Ireland Lewis will meet leaders from the country’s two political parties, Sinn Féin and the DUP, and insist on both to quickly form a government. The DUP came second during last week’s elections for the Stormont assembly which saw the Sinn Féin nationalists become the largest party for the first time since the power-sharing executive was created in 1998. The DUP has refused to join the coalition as long as the NI protocol is in place, saying it disrupts trade with mainland UK. Sinn Féin, looking to unite Ireland, is fine with the arrangement. Except for the political instability this standoff may trigger, it also adds another layer to UK discussions with the EU regarding the protocol. On the EU’s current proposals, PM Johnson’s spokesperson Blain said they “don’t go anywhere near far enough to make the protocol sustainable”. It may eventually lead the UK to trigger Article 16, suspending key parts of the agreement unilaterally.
The Reserve Bank of India intervened in all FX markets to protects the rupee, a person familiar said. The Indian rupee gapped lower to an all-time low (USD/INR >77) this morning before depreciating further to USD/INR 77.46 in the close at noon. The RBI is sitting on a pile of about $600bn in reserves that it will put to use against speculators, the person said, adding that the central bank is seeking an orderly depreciation. High inflation and an aggressive Fed tightening cycle is putting many emerging markets under pressure, including India. The central bank last week raised policy rates at an unscheduled meeting to 4.4% in a vain attempt to stem the currency slide.
USD/JPY Mid-Day Outlook
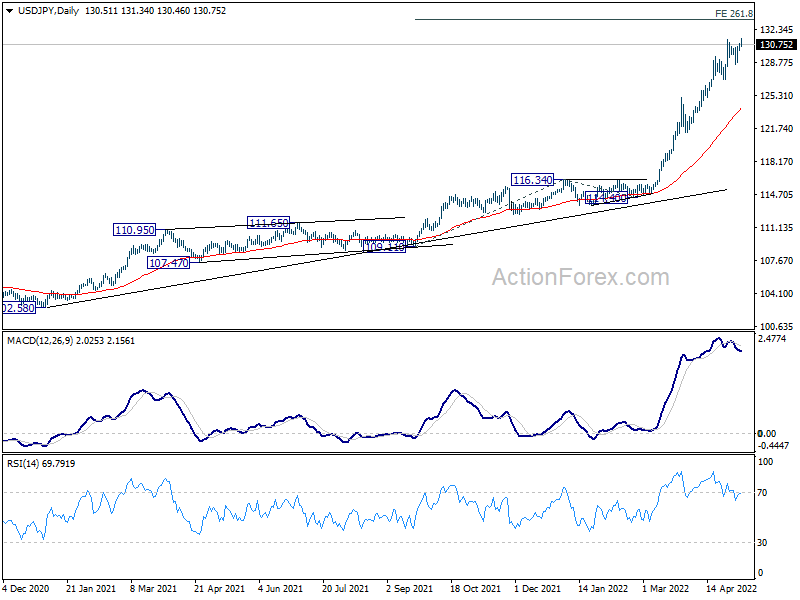
Daily Pivots: (S1) 130.16; (P) 130.49; (R1) 130.87; More...
Breach of 131.24 resistance argues that USD/JPY's up trend is resuming. Intraday bias is mildly on the upside for 261.8% projection of 109.11 to 116.34 from 114.40 at 133.26. For now, outlook will remain bullish as long as 128.61 support holds. However, firm break of 128.61 will indicate short term topping, and turn bias to the downside for deeper pull back.
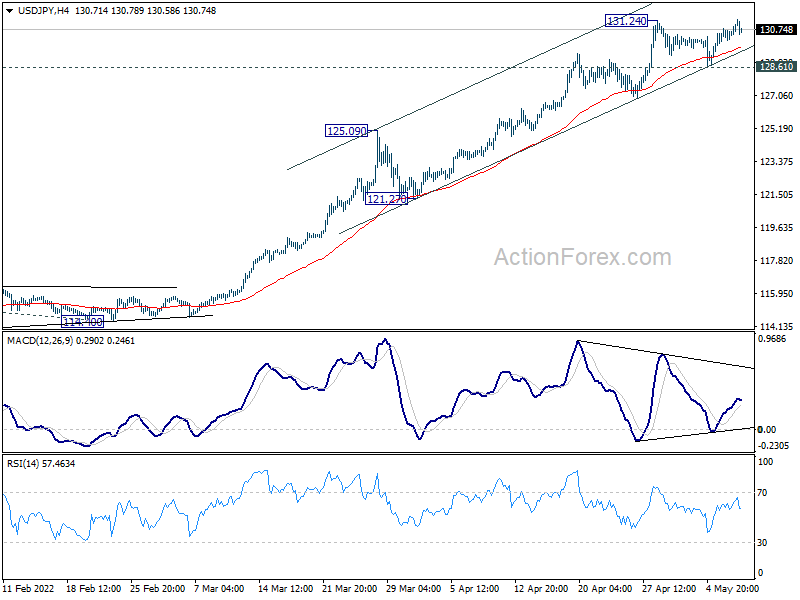
In the bigger picture, current rally is seen as part of the long term up trend form 75.56 (2011 low). Sustained trading above 61.8% projection of 75.56 (2011 low) to 125.85 (2015 high) from 98.97 at 130.04 will pave the way to 100% projection at 149.26, which is close to 147.68 (1998 high). For now, this will remain the favored case as long as 121.27 support holds.
USD/CHF Mid-Day Outlook
Daily Pivots: (S1) 0.9845; (P) 0.9869; (R1) 0.9909; More....
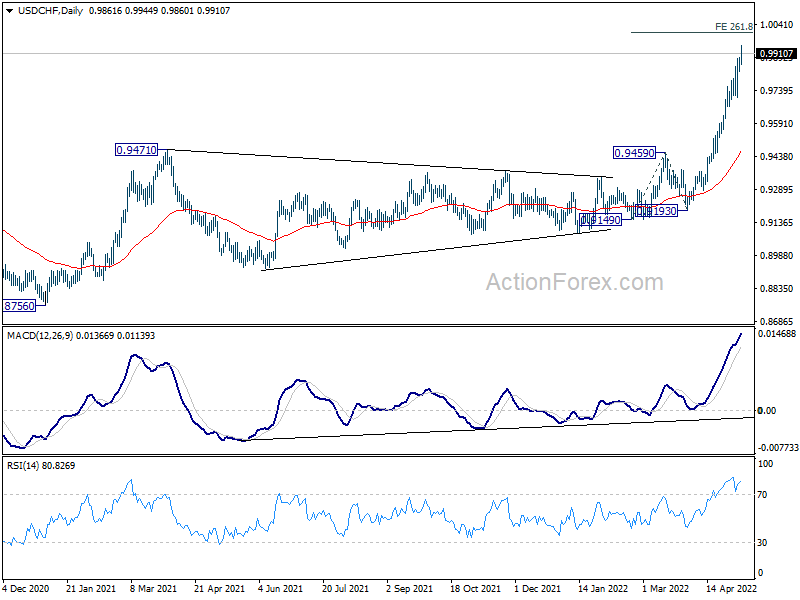
USD/CHF's rally is still in progress and intraday bias remains on the upside for 261.8% projection of 0.9149 to 0.9459 from 0.9193 at 1.0005 next. On the downside, break of 0.9708 support is needed to indicate short term topping. Otherwise, outlook will stay bullish in case of retreat.
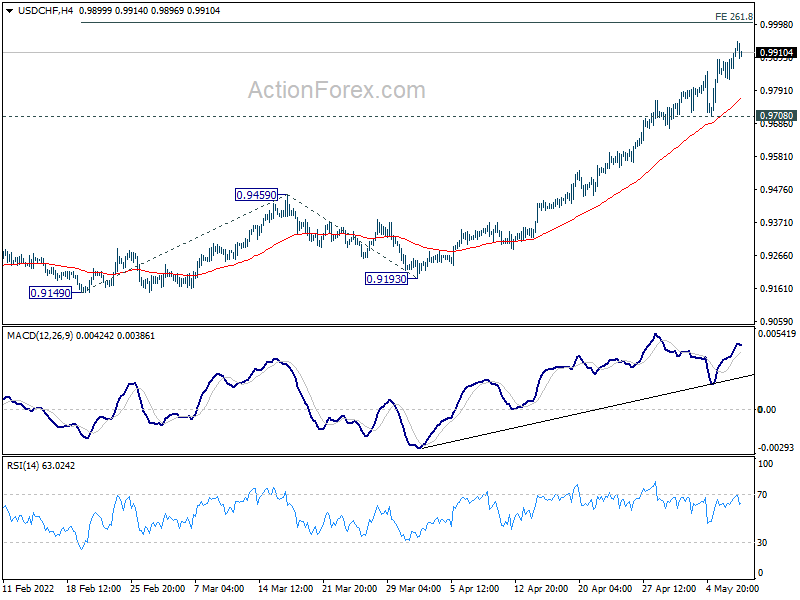
In the bigger picture, down trend from 1.0342 (2016 high) should have completed with three waves down to 0.8756 (2021 low) already. Rise from 0.8756 is likely a medium term up trend of its own. Sustained trading above 100% projection of 0.8756 to 0.9471 from 0.9149 at 0.9864 will pave the way to 161.8% projection at 1.0306, which is close to 1.0342 (2016 high). This will remain the favored case as long as 0.9459 resistance turned support holds.