Sample Category Title
GBP/JPY Daily Outlook
Daily Pivots: (S1) 159.69; (P) 161.64; (R1) 162.80; More...
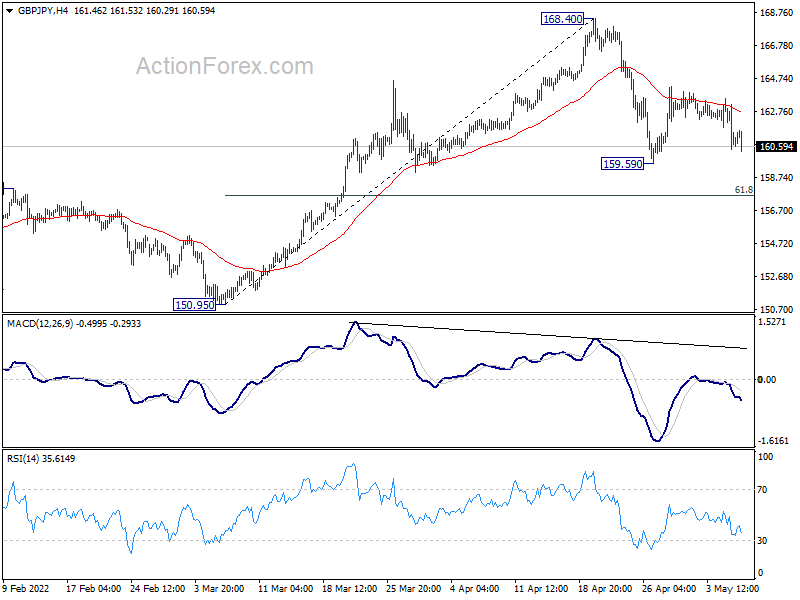
Intraday bias in GBP/JPY remains neutral first. Break of 159.59 will extend the correction from 168.40 lower. But downside should be contained by 61.8% retracement of 150.95 to 168.40 at 157.61 to bring rebound. On the upside, firm break of 168.40 will resume larger up trend.
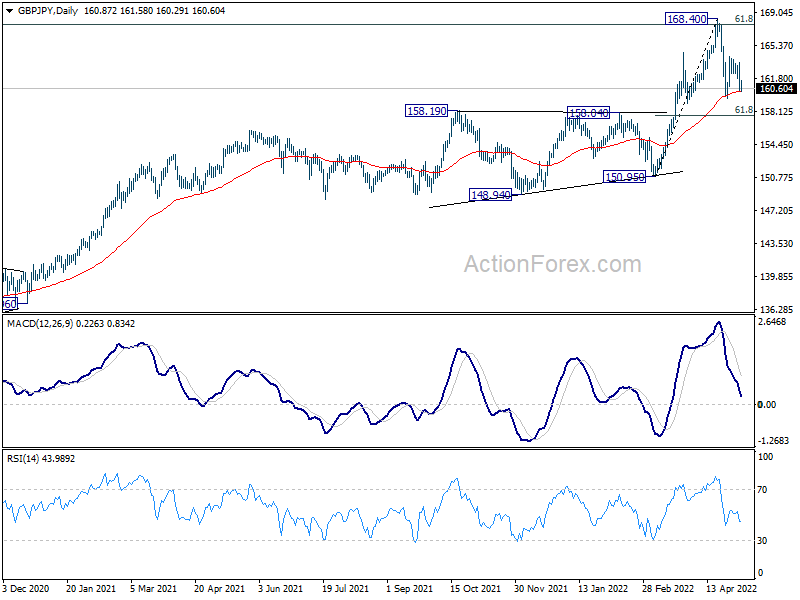
In the bigger picture, up trend from 123.94 (2020 low) is still in progress. Sustained break of 61.8% retracement of 195.86 (2015 high) to 122.75 (2016 low) at 167.93 will be a long term bullish signal, and could pave the way back to 195.86 high. This will now remain the favored case as long as 150.95 support holds, even in case of deep pull back.
EUR/JPY Daily Outlook
Daily Pivots: (S1) 136.84; (P) 137.21; (R1) 137.59; More....
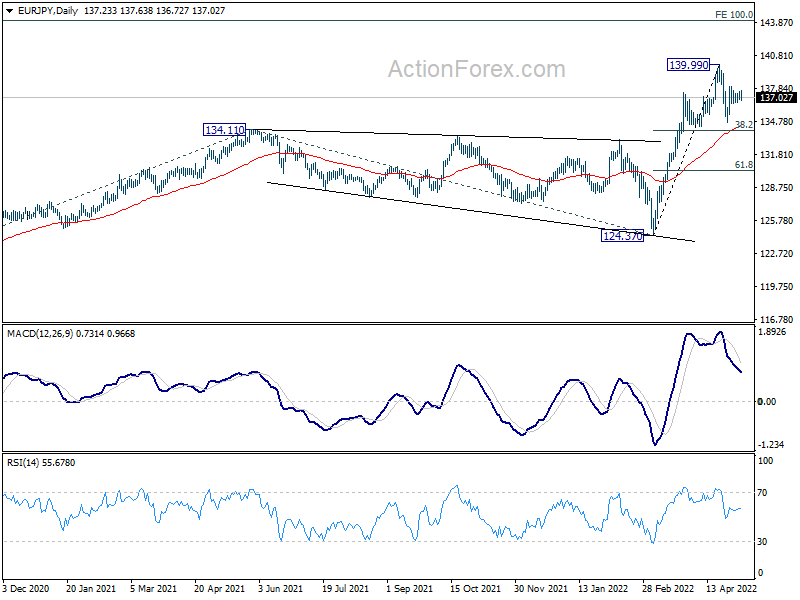
Intraday bias in EUR/JPY remains neutral as consolidation from 139.99 is still extending. Downside of retreat should be contained by 38.2% retracement of 124.37 to 139.99 at 134.02 to bring rebound. On the upside, firm break of 139.99 will resume larger up trend for 144.06 medium term projection level.
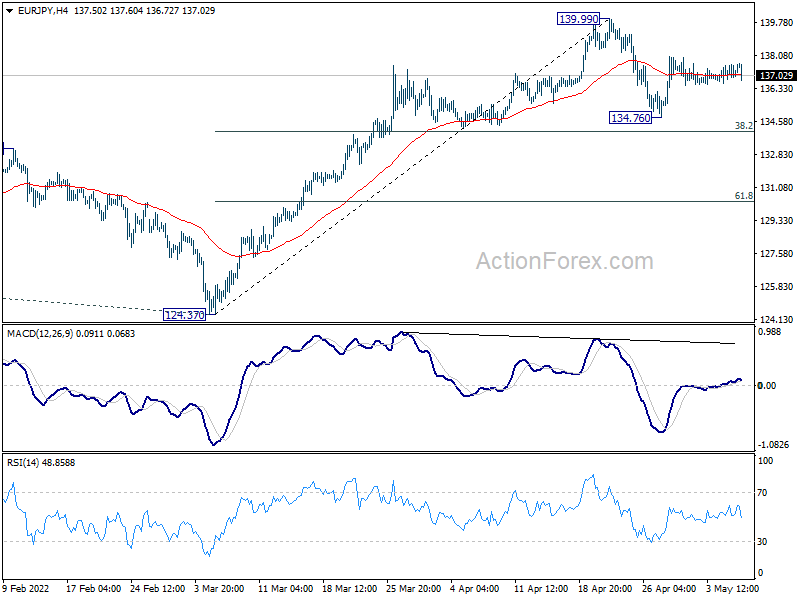
In the bigger picture, up trend from 114.42 (2020 low) is in progress. Such rise is seen as the third leg of the pattern from 109.30 (2016 low). Next target will be 100% projection of 114.42 to 134.11 from 124.37 at 144.06. In any case, outlook will now remain bullish as long as 124.37 support holds, in case of deep pull back.
EUR/GBP Daily Outlook
Daily Pivots: (S1) 0.8443; (P) 0.8494; (R1) 0.8582; More...
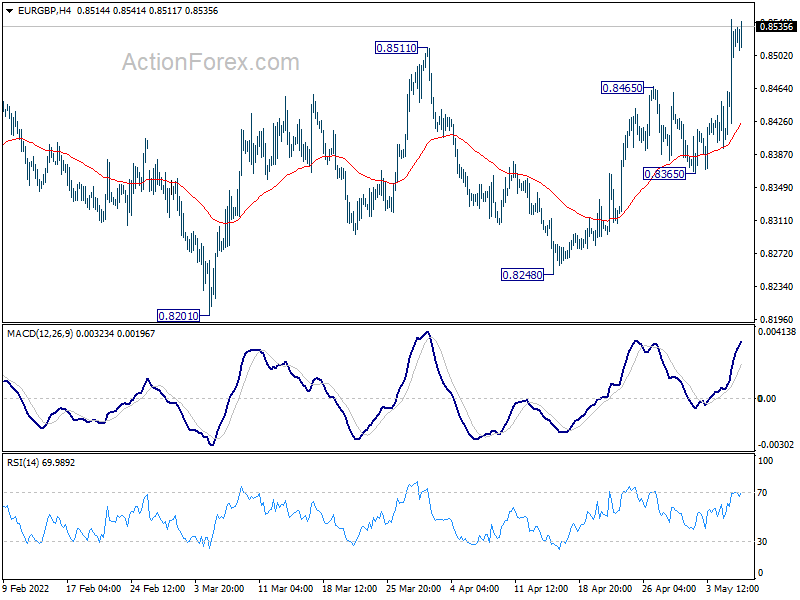
Intraday bias in EUR/GBP remains on the upside for the moment. Current development reaffirms that 0.8201 is a medium term bottom. Further rally should be seen to 0.8697 medium term fibonacci level next. For now, outlook will stay cautiously bullish as long as 0.8365 support holds, in case of retreat.
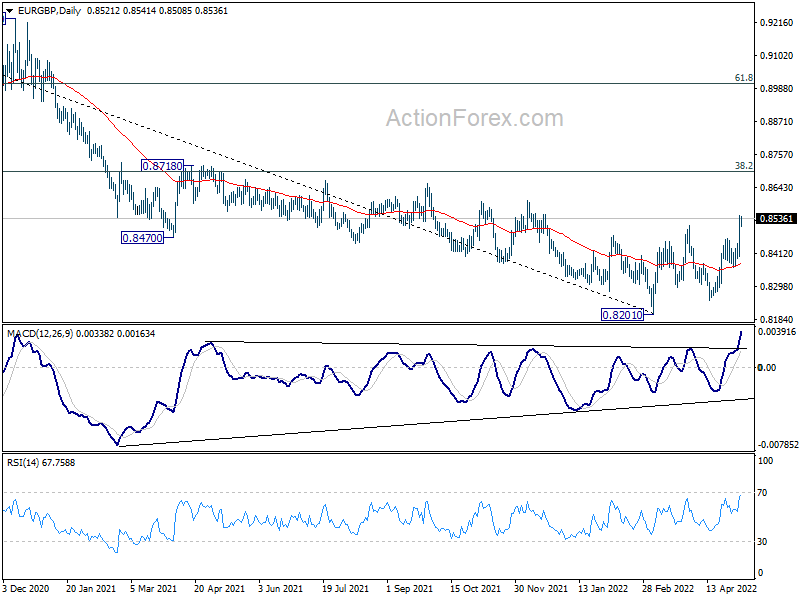
In the bigger picture, a medium term bottom could be in place at 0.8201, on bullish convergence condition in daily and weekly MACD. Rise from there could either be a correction to the down trend from 0.9499 (2020 high), or a medium term up trend itself. In either case, further rise should be seen to 38.2% retracement of 0.9499 to 0.8201 at 0.8697. Sustained break there will target 61.8% retracement at 0.9003.
EUR/AUD Daily Outlook
Daily Pivots: (S1) 1.4678; (P) 1.4766; (R1) 1.4905; More...
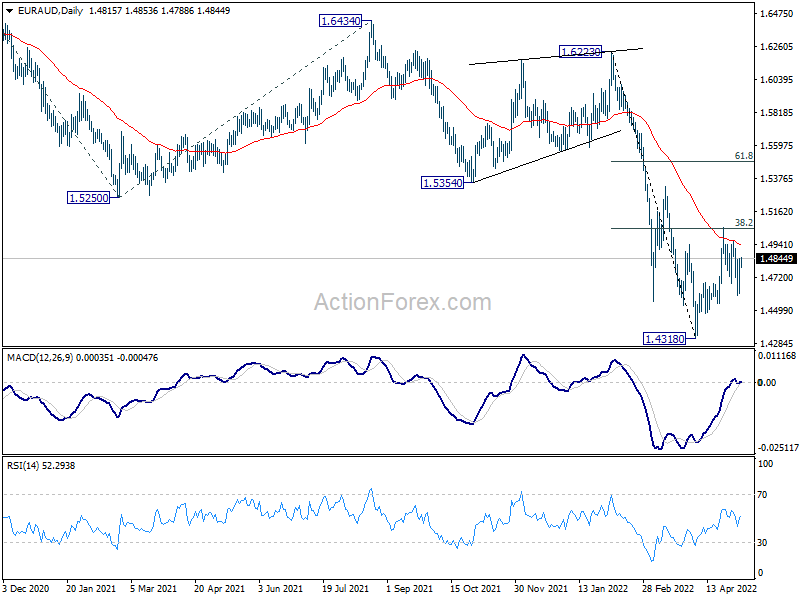
Intraday bias in EUR/AUD is turned neutral as it recovered after hitting 1.4597. On the upside, break of 1.5053 will resume the rebound from 1.4318 to target 61.8% retracement of 1.6223 to 1.4318 at 1.5495. On the downside, break of 1.4597 will bring retest of 1.4318 low.
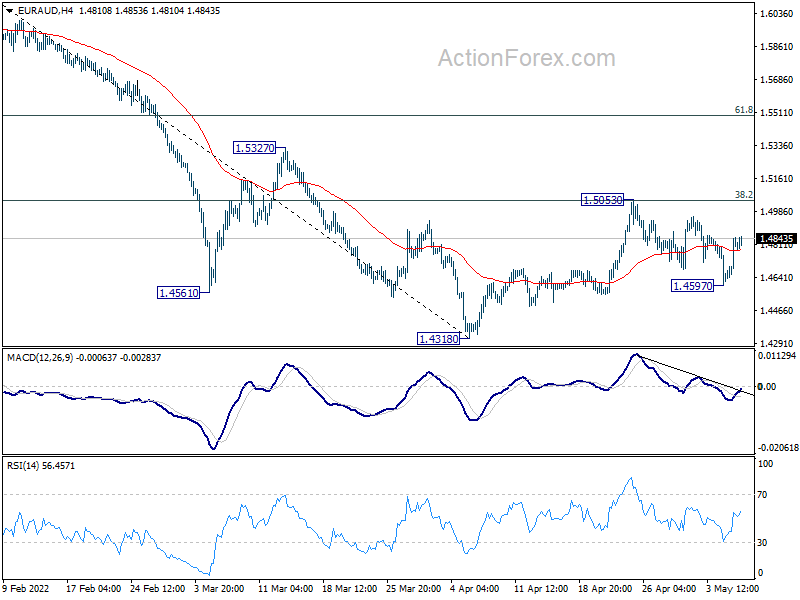
In the bigger picture, as long as 1.5354 support turned resistance holds, larger down trend form 1.9799 (2020 high) is still expected to continue. On resumption, next target is 61.8% projection of 1.9799 to 1.5250 from 1.6434 at 1.3623, which is close to 1.3624 long term support (2017 low). However, firm break of 1.5354 will indicate medium term bottoming and bring stronger rally.
EUR/CHF Daily Outlook
Daily Pivots: (S1) 1.0336; (P) 1.0365; (R1) 1.0412; More....
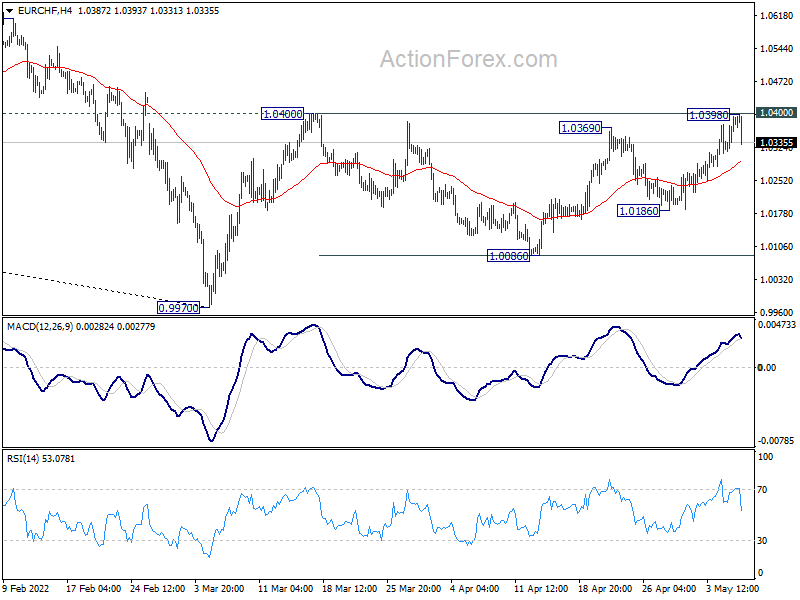
EUR/CHF retreats notably after just missing 1.0400 resistance and intraday bias is turned neutral first. On the upside, Firm break of 1.0400 resistance will resume the rebound from 0.9970 to 1.0610 structural resistance. On the downside, however, break of 4 hour 55 EMA (now at 1.0292) will turn bias to the downside for 1.0186 support and below, to extend the corrective pattern from 1.0400 with another leg.
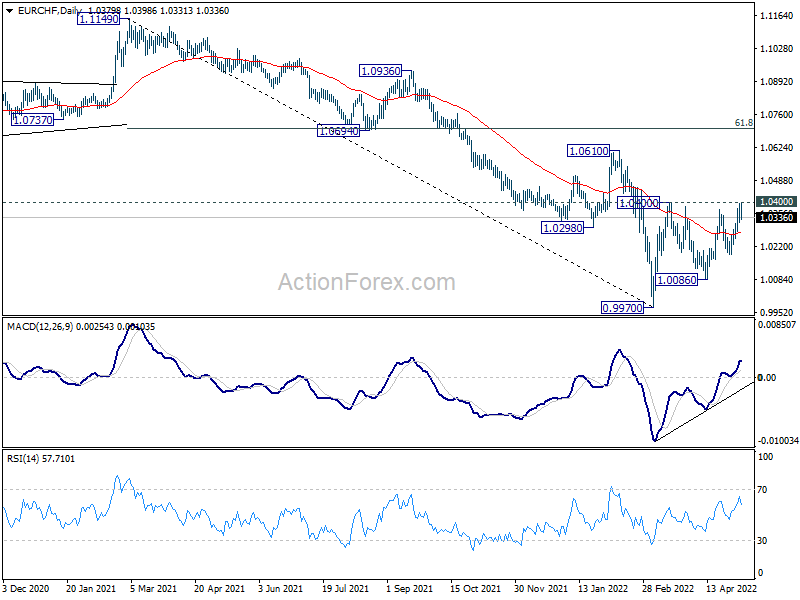
In the bigger picture, as long as 1.0505 support turned resistance (2020 low) holds, long term down trend from 1.2004 (2018 high) is expected to continue. Next target is 100% projection of 1.2004 to 1.0505 to 1.1149 at 0.9650. However, firm break of 1.0505 will suggest medium term bottoming, and bring stronger rebound towards 1.1149 structural resistance.
GBPJPY Erases Some Post-BoE Losses
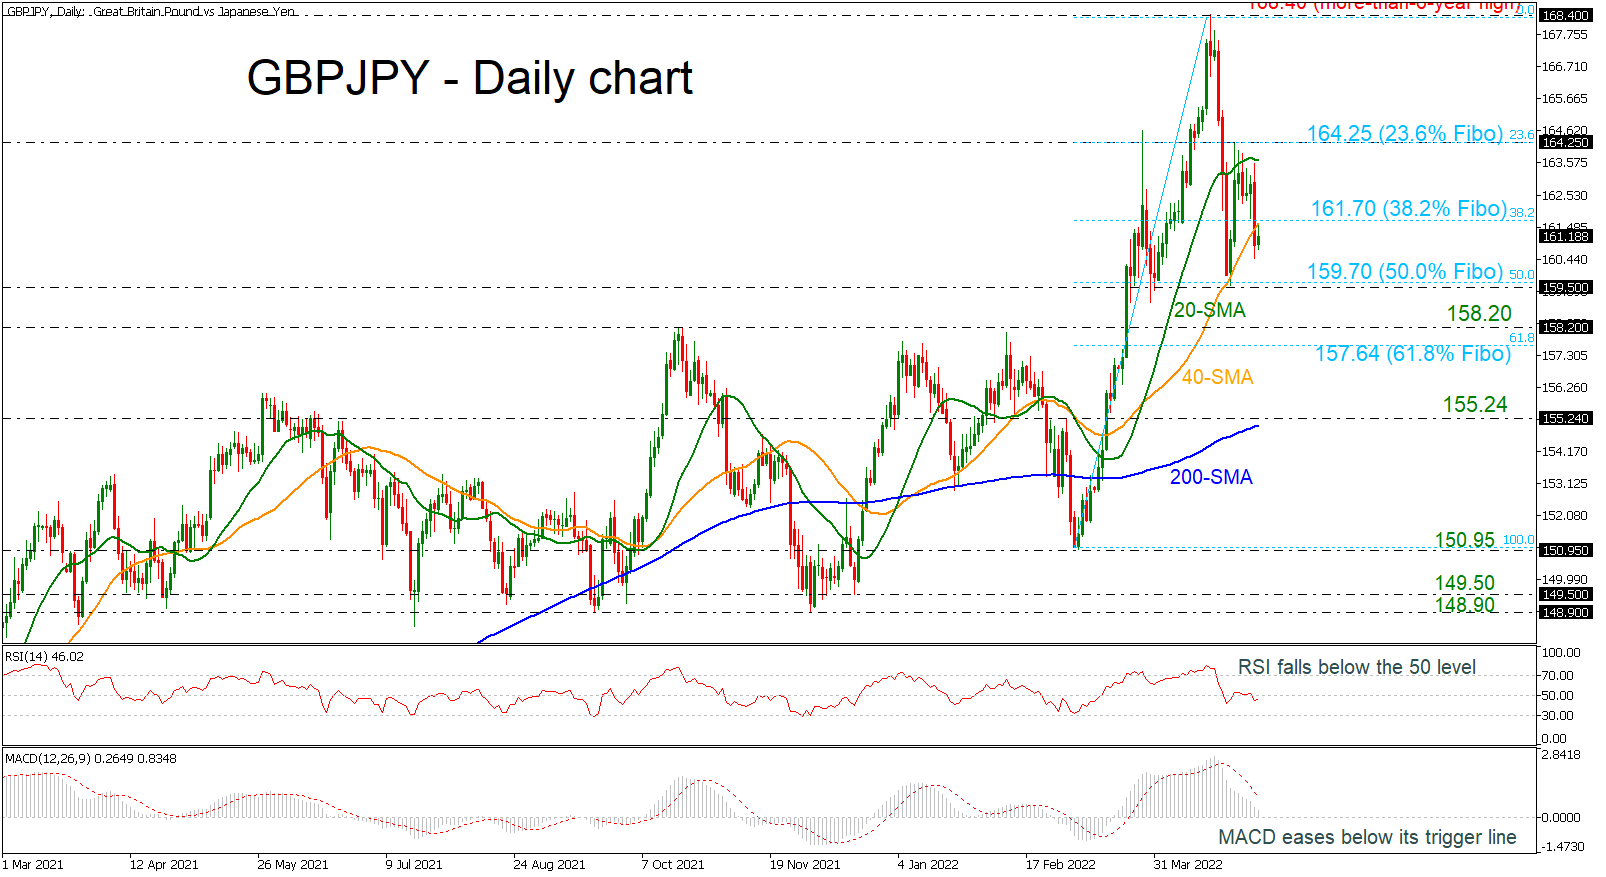
GBPJPY regained some ground after the BoE decision and the losses it caused yesterday, but found resistance at the 20-day simple moving average (SMA). The price plunged beneath the 38.2% Fibonacci retracement level of the upward wave from 150.95 to 168.40 at 161.70 and the 40-day SMA in the daily chart.
The RSI is showing some positive signs below the neutral threshold of 50, while the MACD oscillator is heading south below its trigger line, reducing chances for a meaningful recovery in the short-term.
However, should the price close comfortably above the 38.2% Fibonacci of 161.70 traders could add more positive momentum to the pair, pushing the market up to the 20-day SMA at 163.70. The 23.6% Fibonacci of 164.24 has been strictly a strong resistance for the bulls. More advances could open the way towards the more-than-six-year high of 168.40.
In the negative scenario, the market could retest the 50.0% Fibonacci of 159.70 and the 159.50 support level. Even lower, investors could shift attention to the 61.8% Fibonacci of 157.64 and the 200-day SMA, which holds near the 155.24 barrier.
In brief, GBPJPY is in a bearish mode in the very short-term timeframe and bullish in the bigger picture.
The Stock Market Puts Bitcoin Back in a Downward Trend
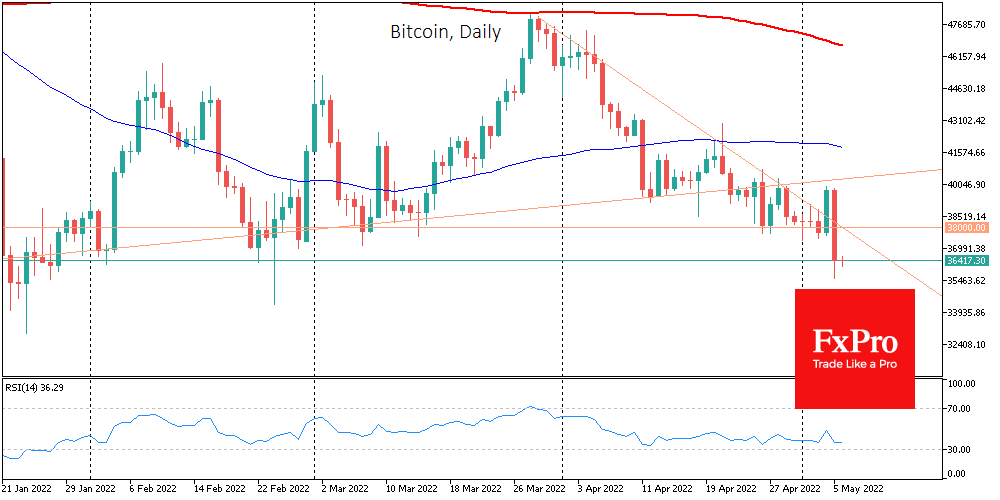
Bitcoin was down more than 10% intraday on Thursday, stabilising at $36.4K from the end of the day and losing 8.3% overnight. Ethereum lost 6.7% in the last 24 hours, while other leading altcoins in the top 10 fell from 5.6% (DogeCoin) to 14% (Avalanche).
Total cryptocurrency market capitalisation, according to CoinMarketCap, fell 7.6% overnight to $1.67 trillion. The Bitcoin Dominance Index fell 0.4% to 41.5%, as the most institutionalised coins took the brunt of the hit.
The cryptocurrency Fear and Greed Index fell 5 points to 22 by Friday and moved back into “extreme fear” status. This indicator has been hovering between the 20 and 30 levels for almost four weeks.
On Thursday, Bitcoin fell sharply in the US session, losing more than $3,000 in a few hours and closing the day at its lowest level since late January. Once again, the pressure came from the US stock and bond market, where traders were furiously pricing in a sharp tightening of the Fed’s monetary policy in June after a day’s break.
The decline in BTC was the highest in the last 3.5 months and was observed simultaneously with the sell-off in the US stock market. Expectations of increasingly steep policy tightening are draining liquidity, primarily hitting risky assets, from equities to commodities to cryptocurrencies.
With yesterday’s sharp collapse, bitcoin confirmed its downtrend in late March and returned to the area of lows at the beginning of the year.
Bitcoin’s supply in the market could increase sharply in the second half of 2022 when a plan to compensate former users of the MtGox cryptocurrency exchange will begin to be implemented. However, the purchase of BTC by algorithmic stack coin issuers could potentially offset the increase in supply, according to Coinbase.
Luna Foundation Guard (LFG), a non-profit organisation, purchased 37,863 BTC on the OTC market, worth approximately $1.5 billion. LFG was one of the top 10 bitcoin holders.
US Yields Stay Upwardly Oriented Going into US Payrolls Report
Markets
On Wednesday the Fed hiked its policy rate 50 bps and signaled more such steps to come. At the same time, chair Powell said that 75 bps steps were not on the table. This message at that time provided comfort with both bonds and equities sharply rebounding. However, 24 hours later investors came to a completely different conclusion.
US Treasuries tumbled sharply in a steepening move with yields rising from 6.1 bps (2-y) to 9.7/10.2 bps for 5/10y sector. At first sight, the moves looked a sign of doubt on the Fed’s commitment as it rejected 75 bps hikes. However, this was at odds with a remarkable rise in US real yields (10y +12.1 bps to 0.175%). Whatever, this jump in (real) yields and lingering doubts on the economy potentially moving to a stagflationary scenario triggered a sharp equity sell-off. US indices tumbled between 3.12% (Dow) and 4.99% (Nasdaq).
Losses in Europe were more modest (EuroStoxx -0.75%). European yields initially corrected lower. ECB’s Lane admitted that inflation is unlikely to revert to a below-target trend, but still advocated a gradual approach. In the meantime other MPC members continued the debate on a July rate hike. German yields later joined the rise in the US closing between 1.4% (2-y) and 9.1 bps (30-y) higher. After the close of the European markets, Austrian ECB member Holzmann formally opened the debate on a JUNE ECB rate hike and suggested such a move was a real option. For now, it’s the idea of only one MPC member, but it needs close monitoring. Several other central banks also immediately raised rates when asset purchases were halted.
On FX markets, the dollar reversed most of Wednesday’s post-Fed setback. The DXY-index again tested the cycle peak just below 104, but no break occurred. Similar picture for USD/JPY with a close at 130.20. EUR/USD dropped to the 1.05 area, but with a close at 1.0542 also avoided a test of the 1.0472 low. The dollar is holding strong, but given the extreme risk-off and the sharp rise in US (real) yields gains could have been even bigger.
The almost impossible task for a central bank to successfully manage a stagflationary environment yesterday appeared at the BoE meeting. With inflation probably still at 10%+ at the end of the year, but growth expected to shrink at that time, the BoE still reached consensus on a 25 bps rate hike. Three members voted for a 50 bps step. At the same time, other members didn’t want to flag further steps. UK yields tumbled (2-y -9.1bps). Sterling fell off a cliff. Cable tumbled from the 1.2575 area to close at 1.2362. EUR/GBP closed north of the 0.8512 resistance (0.8527).
Asian equities also endure substantial losses of 2/3% this morning with Japan the exception (+0.60%) after the WS sell-off. US yields stay upwardly oriented going into the US payrolls report. For once, we doubt the report will have a determining impact on current market dynamics. A poor report, might rekindle stagflationary risk. A strong report will only reinforce the bond market sell-off. A risk-off and higher yields in theory should support the dollar. EUR/USD 1.0472 is still within reach but the US currency over the previous days failed to break some key resistance levels.
In Europe, we look out whether other ECB members will join the ‘Holzmann-debate’ on a potential June rate hike. If so, it won’t pass unnoticed on EMU yields markets and maybe it can even take some pressure off the euro. After yesterday’s break above 0.8512, the technical picture for sterling deteriorated. EUR/GBP 0.8658/67 is next target on the charts.
News Headlines
The National Bank of Poland raised its policy rate yesterday by 75 bps, from 4.5% to 5.25%, the highest level since 2008. NBP governor Glapinski holds a press conference this afternoon. In its policy statement, the central bank vowed to take all necessary actions in order to ensure macroeconomic and financial stability, including above all to reduce the risk of inflation remaining elevated. Polish inflation surged to 12.3% Y/Y in April. In the coming quarters, inflation will remain markedly elevated. The Polish economy extended its strong run from Q4 2021 into Q1 2022. Favourable economic conditions remain in place, though a gradual slowdown might be expected. The Polish zloty lost ground after the release with EUR/PLN rising from 4.65 towards 4.70. The Polish zloty swap bucked the global trend by bull steepening yesterday. Daily yield changes ranged between -13 bps (2-yr) and +1.5 bps (30-yr). Apparently, some expected a stronger signal from the NBP in its inflation fight.
USD/CAD Daily Outlook
Daily Pivots: (S1) 1.2745; (P) 1.2806; (R1) 1.2899; More...
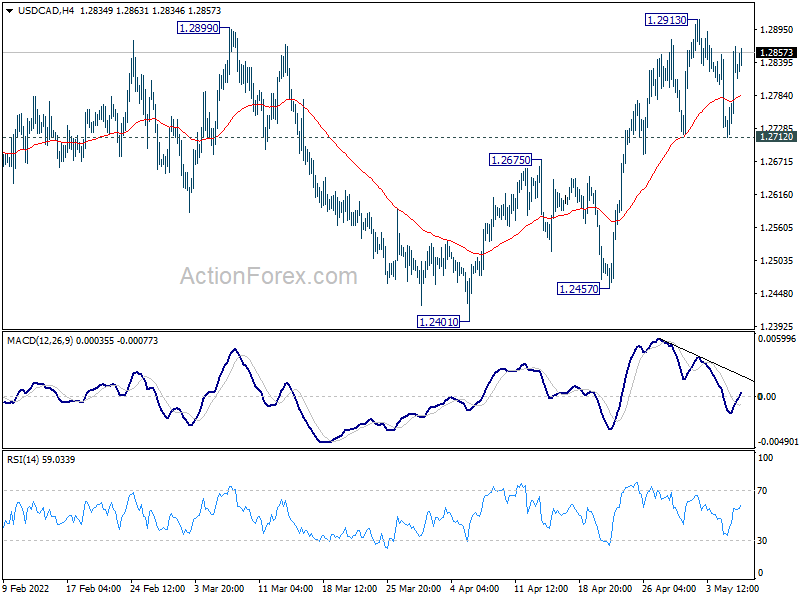
Intraday bias in USD/CAD remains neutral as it rebounded after hitting 1.2712. Further rise is still in favor. Break of 1.2913 will resume recent rally to 1.3022 fibonacci level next. Decisive break there will carry larger bullish implications. On the downside, break of 1.2712 will argue that rebound from 1.2401 has completed at 1.2913, ahead of 1.2963 resistance. Intraday bias will be back on the downside for 1.2401, to extend recent sideway trading.
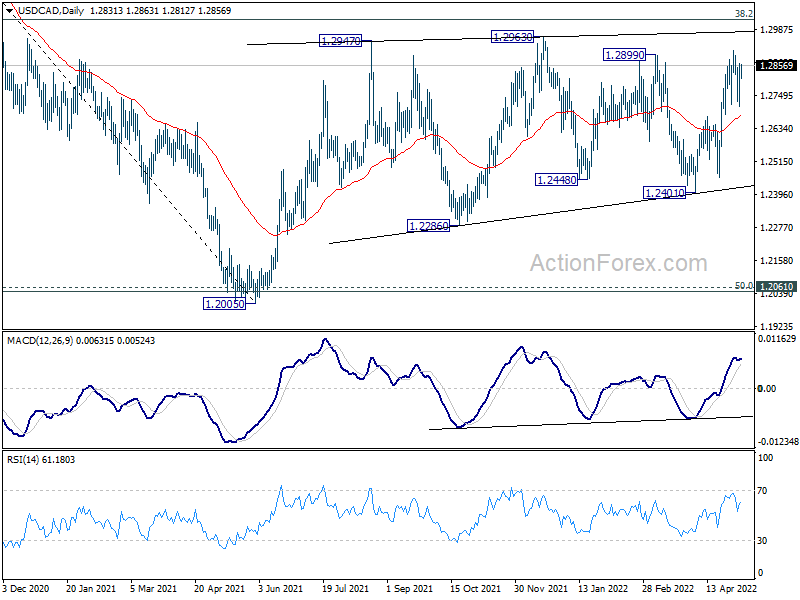
In the bigger picture, focus stays on 38.2% retracement of 1.4667 (2020 high) to 1.2005 (2021 low) at 1.3022. Sustained break there should confirm that the down trend from 1.4667 has completed after defending 1.2061 long term cluster support. Further rise would then be seen towards 61.8% retracement at 1.3650. However, rejection by 1.3022 will maintain medium term bearishness. Break of 1.2005 will resume the down trend from 1.4667 and that carries larger bearish implications too.
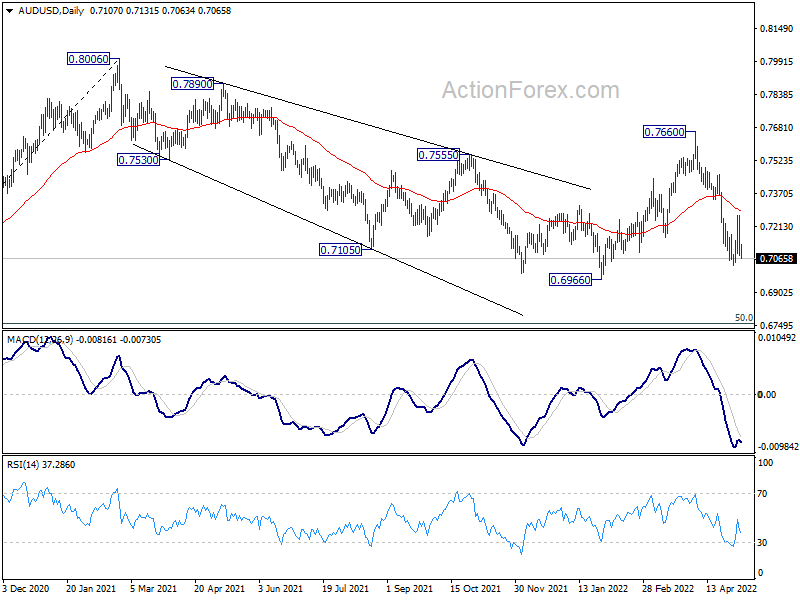
AUD/USD Daily Report
Daily Pivots: (S1) 0.7039; (P) 0.7152; (R1) 0.7227; More...
AUD/USD's rebound lost steam after hitting 0.7265 and retreats sharply. Intraday bias is turned neutral at this point. Outlook is unchanged that fall from 0.7660 is the third leg of the corrective pattern from 0.8006. On the downside, below 0.7029 will target 0.6966 low first. Firm break there will confirm this bearish case and target 0.6756 medium term fibonacci level next.
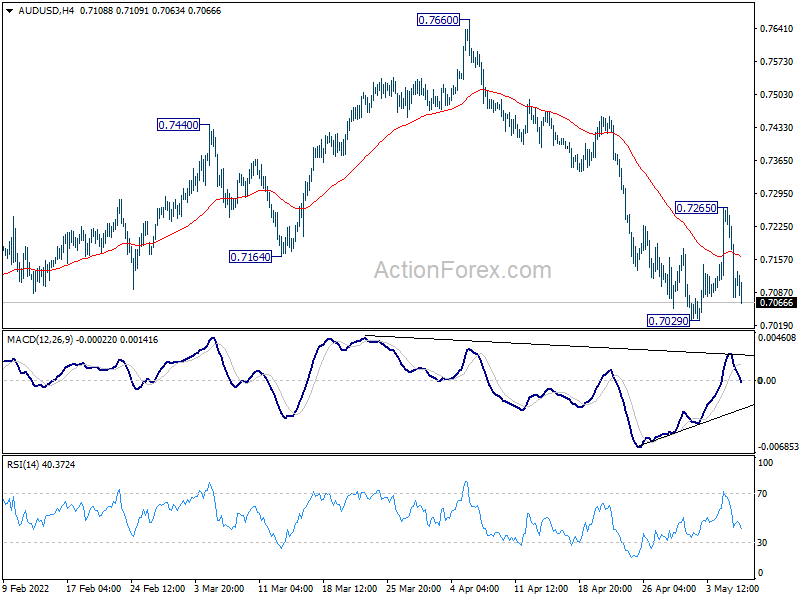
In the bigger picture, price actions from 0.8006 are seen as a corrective pattern to rise from 0.5506 (2020 low). Fall from 0.7660 should be the third leg of this pattern. Break of 0.6966 will target 50% retracement of 0.5506 to 0.8006 at 0.6756. On the upside, break of 0.7660 will revive that case that the correction has already completed at 0.6966.