

Sample Category Title
Bitcoin accelerating down towards 33k low, follow risk-off sentiment
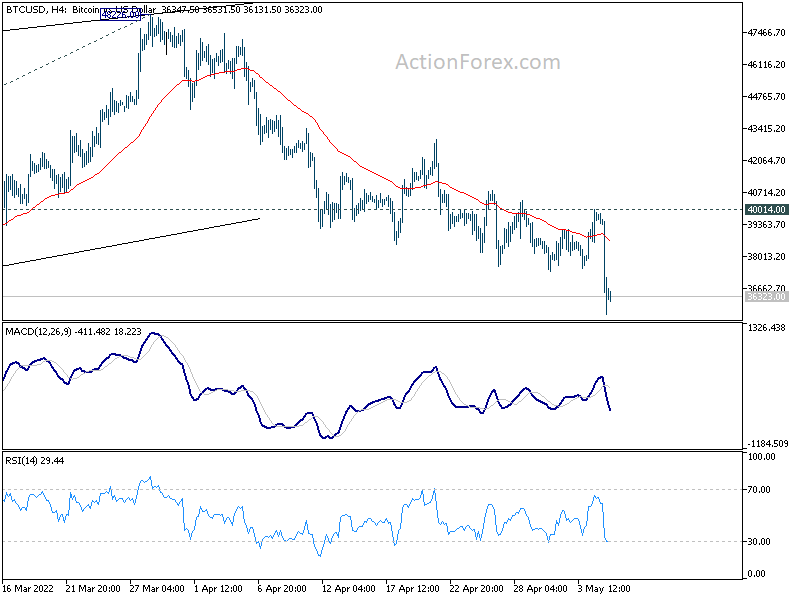
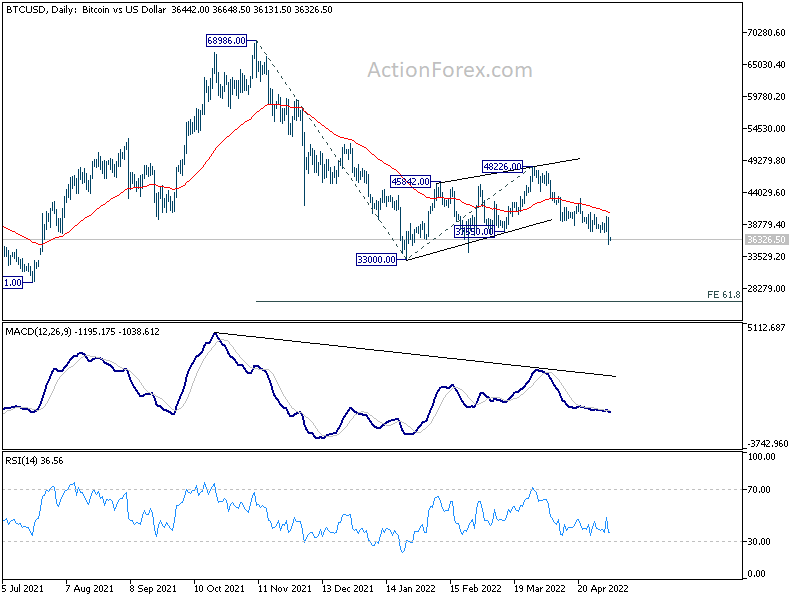
Bitcoin continued to gyrate lower this week and accelerated to as low as 35565 overnight. The move came with broad based risk-off selling in the US markets. Technically, the fall is seen as continuation of the decline from 48226, and outlook will stay bearish as long as 40014 resistance holds. Next near term target is 33000 low.
Structurally, rebound from 33000 to 48226 is seen as a three wave corrective pattern. The current stay below 55 day EMA is also a medium term bearish sign. Decline from 48226 is likely the third leg of the whole down trend from 68986 low. Current downside momentum doesn't warrant a strong break of 33000 yet. But in that happens, bitcoin could easily falls through 30k handle to 61.8% projection of 68986 to 33000 from 48226 at 25986.
RBA SoMP: 2022 GDP forecasts downgraded to 4.5%, CPI raised to 6%
In the Statement on Monetary Policy, RBA reiterated that a further lift in interest rates is required over the period ahead. Also, the Board will continue to closely monitor the incoming information and evolving balance of risks as it assesses the timing and extent of future interest rate increases
In the new economic projections:
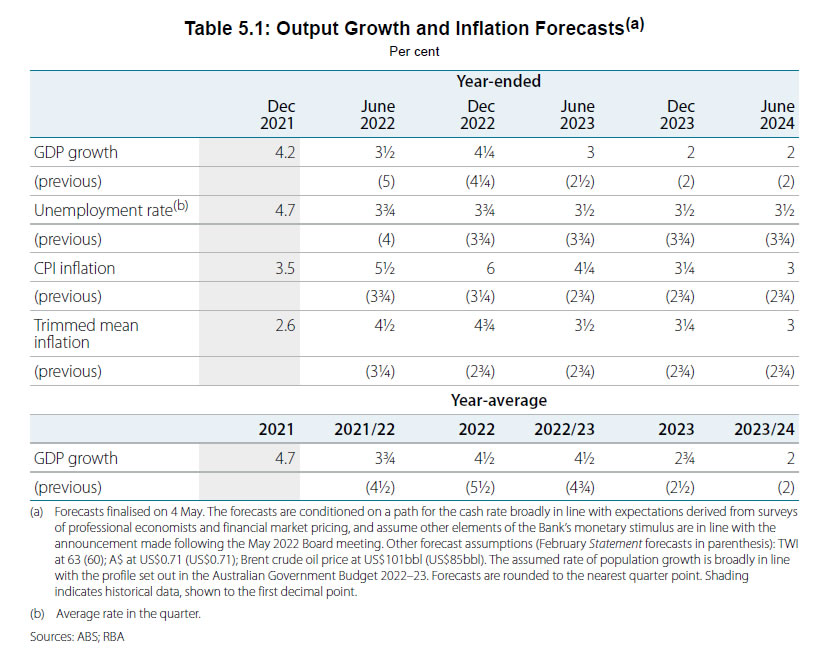
- 2022 GDP growth forecast was downgraded from 5.50% to 4.50%.
- 2023 GDP growth was upgraded from 2.50% to 2.75%.
- 2022 year-end headline CPI forecast was raised form 3.25% to 6%.
- 2023 year-end CPI headline forecast was raised from 2.75% to 3.25%.
- 2022 year-end trimmed mean CPI was raised from 2.75% to 4.75%.
- 2023 year-end trimmed mean CPI was raised from 2.75% to 3.25%.
- 2022 year-end unemployment rate was unchanged at 3.75%.
- 2023 year-end unemployment rate was us lower from 3.75% to 3.50%.
Cliff Notes: Global Central Banks Give the Market a Lot to Consider
Key insights from the week that was.
Three key developed market central banks met this week. All raised rates and, to varying degrees, highlighted the risks pertaining to inflation.
In Australia, the RBA surprised the market consensus by announcing a 25bp increase in the cash rate to 0.35% instead of 15bps. The downward revision in the unemployment rate to 3.5%, a level it expects will be maintained through 2023, emphasises the strength of Australia’s economy and gives cause to begin removing accommodation. Doing so quickly however is justified more by their revised expectations of inflation, the RBA’s view on underlying inflation at end-2022 revised up 2ppts to a materially above-target 4.75%. The full detail of the RBA’s forecasts will be provided today in the May Statement on Monetary Policy (released at 11:30am); but for policy, it is particularly notable that Tuesday’s decision statement reported underlying inflation is still expected to be at the top of the RBA’s target range in mid-2024 (3.0%, previously 2.75%).
As detailed by Chief Economist Bill Evans following the decision, given the RBA’s views and our own, Westpac believes it is appropriate to front-load the normalisation of policy, a 40bp hike to come in June and be followed by a string of 25bp increases in July, August, October, and November, taking the cash rate to 1.75% by year end. In 2023, we see two additional hikes in February and May to a peak cash rate of 2.25%. Given the high debt levels of Australian households, this level of rates is expected to materially reduce momentum through 2023, dissipating demand-driven inflation pressures and allowing the RBA to go on hold.
In the US, a similar perspective of the outlook was presented by the FOMC, albeit while recognising the greater risks the US currently faces from inflation. Very clearly, the FOMC has strong confidence in the US economy thanks to historically-low unemployment and strong consumer balance sheets. They also recognise the scale of the supply-side inflation pressures and the risk to inflation and wage expectations if actual inflation is not reined in quickly from 8.5%yr/6.6%yr on a CPI/PCE basis at March 2022 towards the 2.0%yr medium-term target. Consequently, the FOMC plan an aggressive start to the policy normalisation process, to be followed by ‘fine tuning’ as neutral approaches.
May’s 50bp increase is therefore expected to be followed by two more 50bp hikes in June and July to 1.875% -- the lower-end of the Committee’s neutral range of 2-3%. Thereafter, we believe 25bp increments will be seen to a fed funds peak of 2.625% in December. Combined with the estimated policy impact of the FOMC’s quantitative tightening program, this level of fed funds would result in financial conditions historically consistent with a 3.0% fed funds rate – the top of the FOMC’s neutral range.
Westpac believes this level of rates will instead prove contractionary for the US, particularly after the loss of real income through 2022, and see growth slow below trend in 2023. It is also our expectation that headline inflation will drop from its current level back down to around 3.0% in six-month annualised terms at year end, then into the 2-3% range come 2023. Such an outturn would justify the FOMC going on hold in 2023 and cutting rates in 2024 to a more neutral level once the inflation threat has past.
The outlook for Australia and the US is therefore likely to prove challenging but sanguine, with growth near trend able to be sustained into the medium term and the stance of policy broadly neutral. Unfortunately, increasingly it seems the same cannot be said for Europe and the UK.
As detailed in our latest edition of Market Outlook (due for release on Westpac IQ today), recent developments have created immense uncertainty for Europe, with disruptions to gas supply moving from possible to probable while additional cost pressures are to be imposed on their economies by a phased reduction in coal and oil imports from Russia. The latter is most certainly justified as European authorities seek to force an end to Russia’s invasion of Ukraine through economic means, but nonetheless is another cost for Europe's economy at a particularly trying time.
We have therefore lowered our growth view for the region, expecting the Euro Area economy will stall for the remainder of the year before a moderate recovery builds in 2023. To this revised view, risks arguably still lay to the downside. That said, if the conflict were to cease quickly, the hit to real incomes could reverse and the economy rebound strongly – on this point, it is worth remembering that before the invasion occurred, the Euro Area was primed for growth in 2022 at a multiple of trend.
The response of the market to the Bank of England’s May meeting was diametrically opposed to both the RBA and FOMC decisions, the combination of dramatically weaker growth forecasts and much stronger and persistent inflation expectations not to mention a third of the Committee preferring a 50bp hike to the 25bps agreed seeing risk appetite disappear during the US session.
Specifically on the UK economy, the BoE now forecast annual growth to be flat at Q2 2023 and a mere 0.2% come Q2 2024; while headline inflation is expected to print at 9.1% in Q2 and peak above 10% in Q4 2022 before falling to 6.6% in Q2 2023 and 2.1% in Q2 2024.
This portrait of stagflation signals an incredible challenge for the Bank to anchor longer-term inflation expectations without causing a deep recession. Tightening aggressively from here will produce a significant risk of enduring weakness in domestic demand, threatening a more severe and sustained output gap into the medium-term.
Finally, to China. While the headlines continue to highlight the market's doubts over the ability of Chinese authorities to navigate through the current spate of COVID-19 outbreaks, we remain constructive. A full view is provided in the May Market Outlook. But at a high level, the combination of the resilience shown to March; the ready availability of credit across the economy; and the growing support from policy makers points to underlying strength that will show itself in the second half of the year.
By sector, near-term growth will be concentrated in public and private investment away from the affected regions of Shanghai and Beijing. As restrictions are removed, we hope sooner than later, this momentum will broaden geographically, and consumption will bounce strongly nationwide – with pent-up demand, income, and sentiment all supportive of sustained growth in spending. GDP growth near authorities’ 5.5% target is still readily achievable in 2022 and beyond.
Fed Pretends to Control the Market
On May 4, the US Federal Reserve revealed the federal funds rate for the next two months. Even though a 50 basis points hike was widely expected, the future is not so clear. Let’s figure it out bit by bit!
FOMC statement in a nutshell
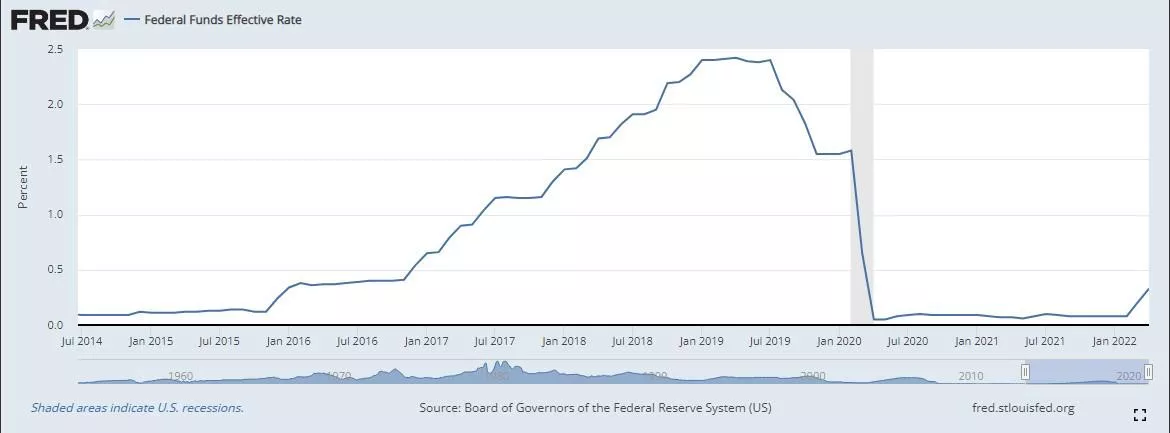
It’s better to start with a retrospective outlook on the funds rate. Since the Covid-19 began, the Fed kept the rates near 0.00% to boost the economy and decrease the negative impact of supply shortages, lockdowns, and slumps in retail sales. You can see a sharp decrease in rates in the figure below.
Low rates, $8 trillion printed over two years, and the slow down of the pandemic created a perfect field for inflation to rise. Now, it’s at a 40-year high, and the time has come for strict monetary tightening.
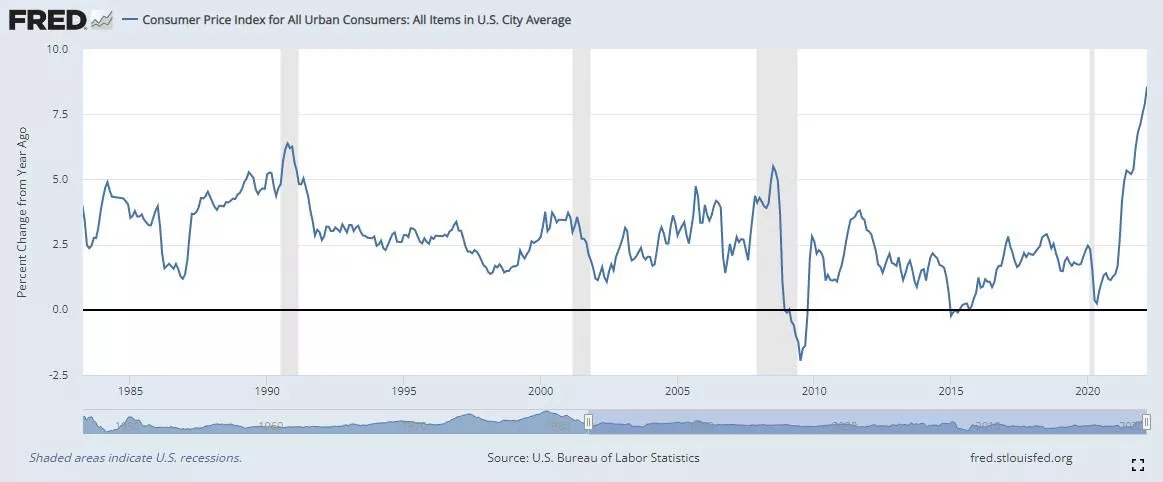
What could go wrong? Well, the war in Ukraine started and caused even more supply shortages. Now, the prices for oil and wheat are rising, so inflation is not likely to end anytime soon. The prices will keep increasing, but here’s the good news. Inflation has probably peaked, and the 8.5% CPI is likely to be the highest point we will see in the next several years. At least, the economy looks this way.
The Fed thinks the same. The Fed stated that inflation has peaked and will decrease over time in their report. Before the FOMC statement came out, the market expected a 50 basis point hike in May and a 75 basis point hike in July 2022. In the statement, Fed chair Jerome Powell said the Fed has no reason to hike rates so aggressively. Thus, the next rate hike will likely be not 75, but 50 basis points increase, which is positive for every risk asset like stocks or crypto.
Stocks’ biggest gain since March
US500 (S&P500) gained almost 3% after the FOMC statement. It’s not a change of the downtrend – the stock market is still under heavy pressure, and there are few positive factors. There is an investment strategy for stocks based on seasonal demand called “Sell in May and go away.” In theory, the period from November to April has significantly stronger stock market growth on average than the other months. Positive news from the Fed will boost the index higher, but not for long.
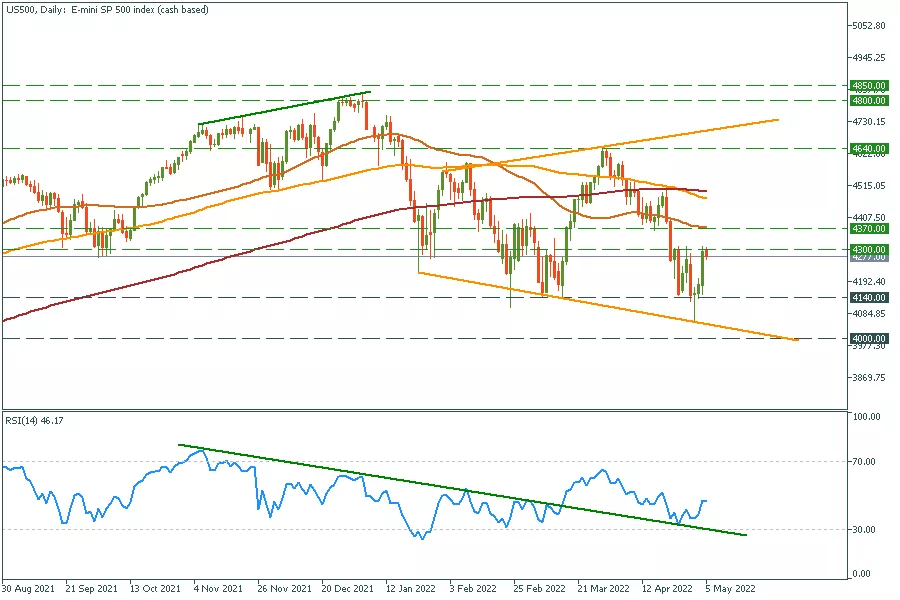
As for the chart, the US500 formed a daily reversal candle on May 2. Also, we see a bounce from the RSI oscillator. Currently, we are at a crossroad, so watch closely after the support of 4000 and resistance of 4370. We bet there will be a volatile move in the direction of the breakout.
US500 daily chart
- Resistance: 4300, 4370, 4640, 4800-4850
- Support: 4140, 4000
Gold and USD outlook
As we stated at the beginning of the article, inflation is here to stay. Most of the time, it’s a bullish factor for the gold price because even with shrinking inflation, prices will keep rising. Thus, the greenback will feel weaker for months, if not years.
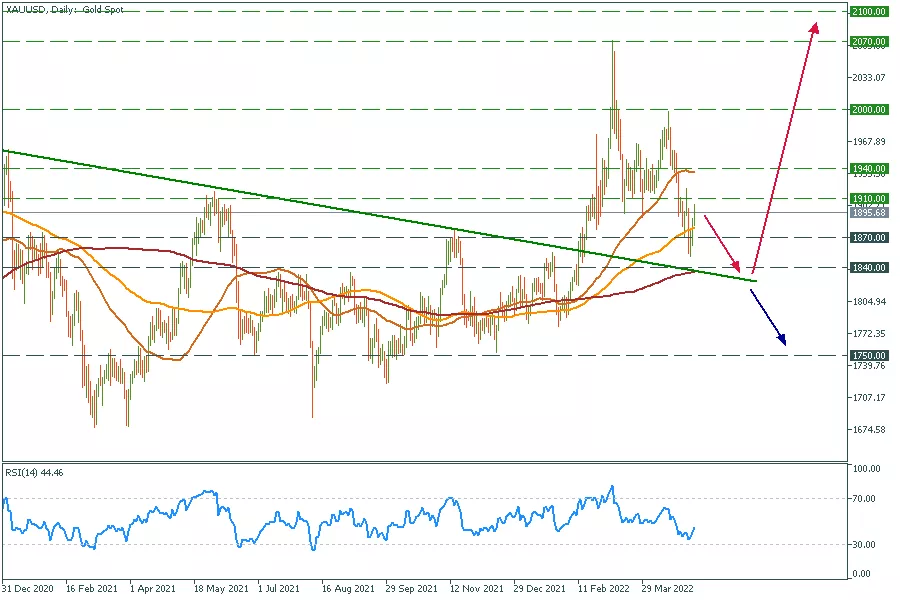
Still, we wait for the gold to touch the $1840 support line and hold in this area. This is a trendline that worked for gold for more than two years. Thus, gold must consolidate for some time near this area and then skyrocket with targets at $2000, $2500, and higher. In the worst scenario, gold may fall below the trendline, and the bearish trend will start.
XAUUSD daily chart
- Resistance: 1910, 1940, 2000, 2070, 2100
- Support: 1870, 1840, 1750
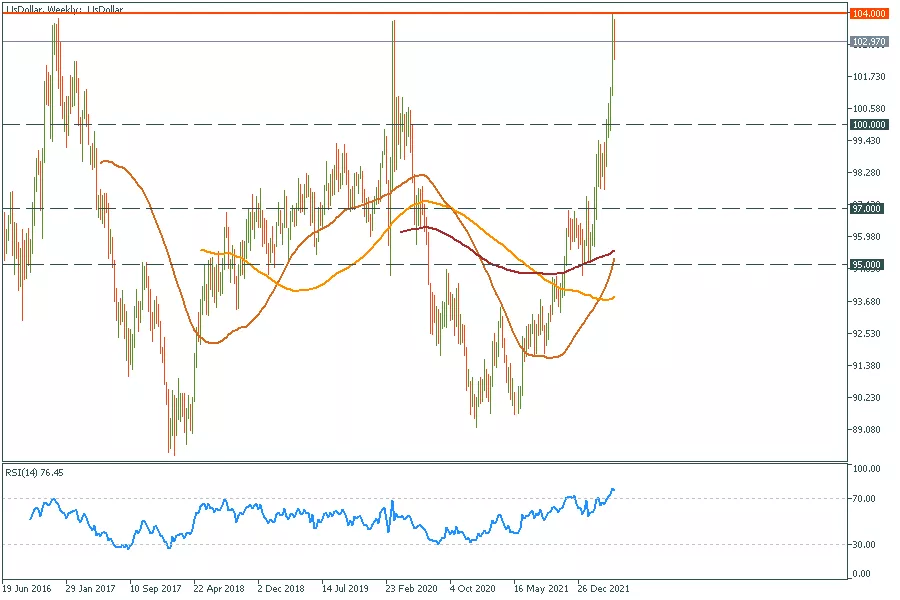
On the contrary, the DXY (the US dollar index) is at the strongest resistance in five years. Thus, we expect a massive reversal from the 104.00 resistance line, another positive factor for gold.
US Dollar weekly chart
- Resistance: 104.00
- Support: 100.00, 97.00, 95.00
Nikkei 225 Wave Analysis
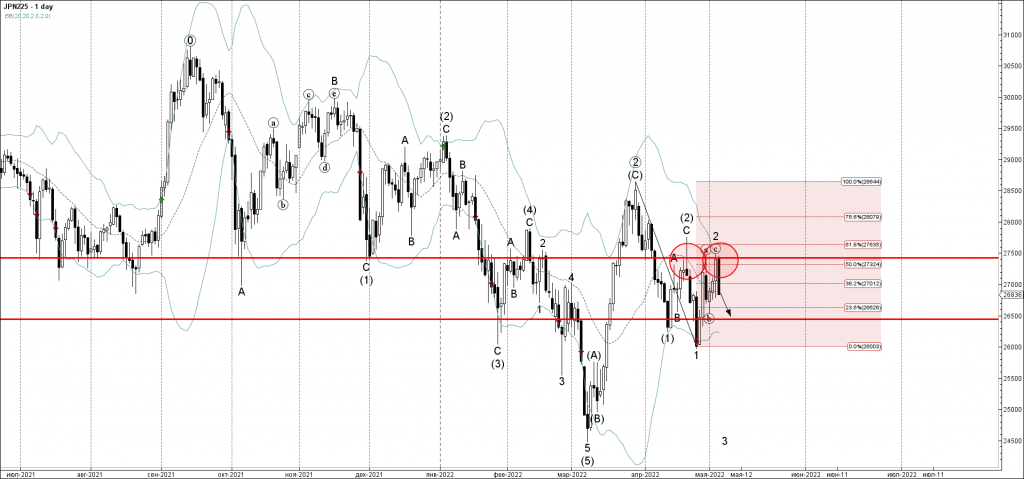
- Nikkei 225 reversed from resistance area
- Likely to test support level 26500.00
Nikkei 225 index recently reversed down from the resistance area located between the key resistance level 27425.00 (which has been reversing the price from last month), upper daily Bollinger Band and the 50% Fibonacci correction of the downward impulse from March.
The downward reversal from this resistance area stopped the previous ABC correction 2.
Nikkei 225 index can be expected to fall further toward the next support level 26500.00.
USDJPY Wave Analysis
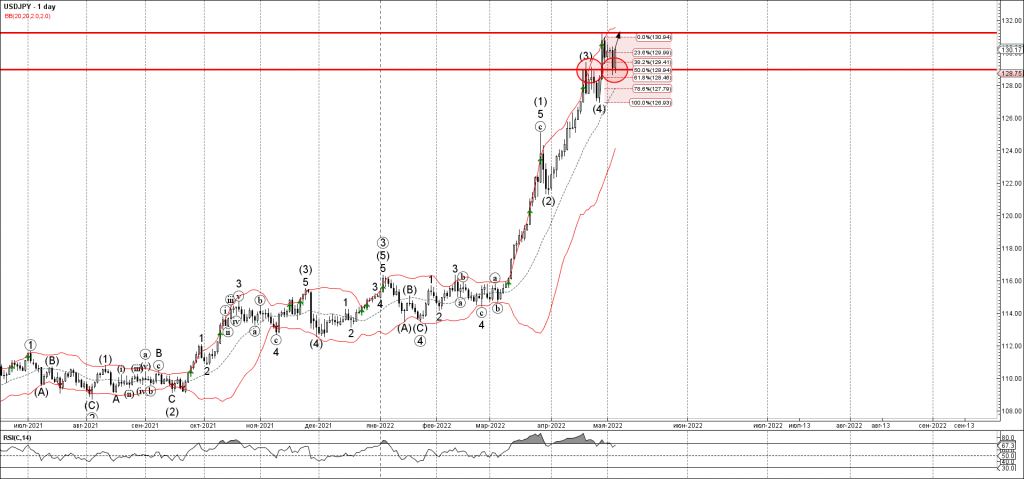
- USDJPY reversed from support area
- Likely to rise to resistance level 131.20
USDJPY recently reversed up strongly from the support area located between the key support level 128.90 (former resistance from last month) and the 50% Fibonacci correction of the upward impulse from April.
The upward reversal from this support area is likely to create the daily candlesticks reversal pattern Bullish Engulfing.
Given the strong daily uptrend – USDJPY can be expected to rise further toward the next resistance level 131.20.
GBPUSD Wave Analysis
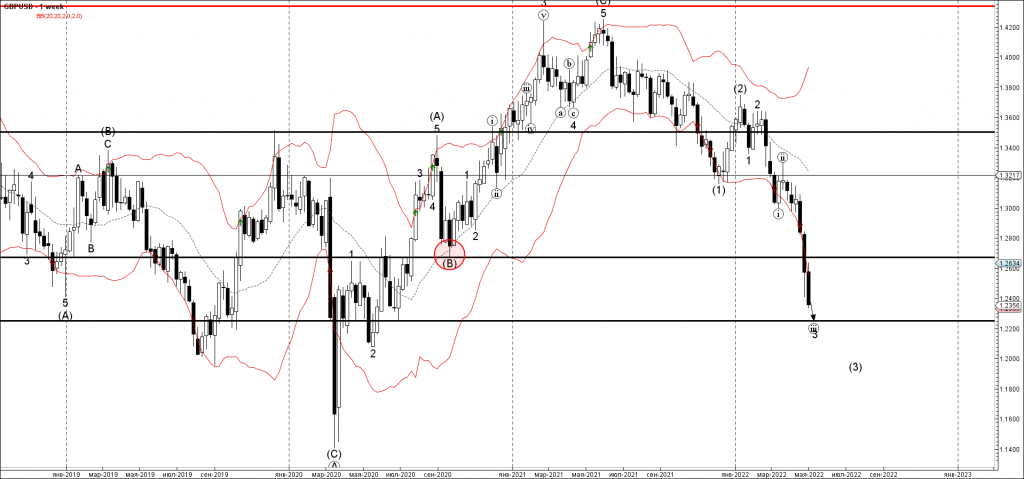
- GBPUSD falling inside impulse waves (iii),3 and (3)
- Likely to fall to support level 1.2250
GBPUSD currency pair recently broke the key support level 1.2670 (low of wave (B) from the end of 2020).
The breakout of the support level 1.2670 accelerated the active weekly downard impulse waves (iii),3 and (3).
Sterling can be expected to fall further toward the next support level 1.2250 (former support pivot from the middle of 2020).
Eco Data 5/6/22
[php_everywhere instance="1"]
EURJPY Remains Above 20-Day SMA With Weak Momentum
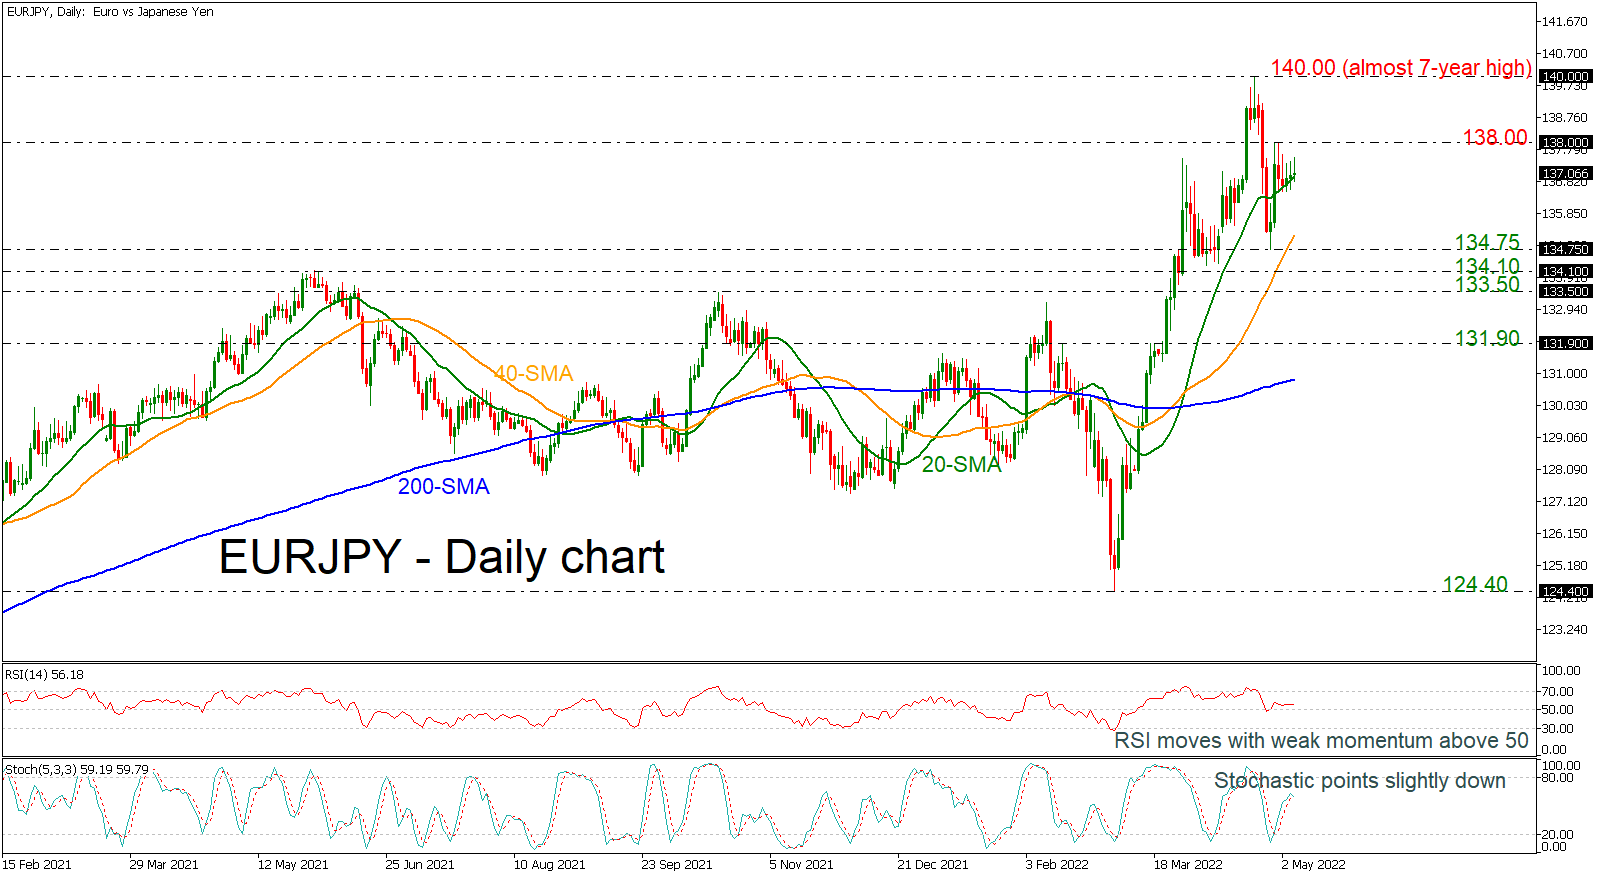
EURJPY has gained little this week, and it managed to hold above the 20-day simple moving average (SMA) and re-enter the 137.00 area, with the RSI feeding some prospects for a possible positive short-term move, as it is holding above the 50 level. On the other hand, the stochastic oscillator is ready to create a bearish cross within the %K and %D lines.
A failure to overcome the 138.00 psychological number could send the price down to the 20-day SMA at 137.00. Lower, support could be next found around the 40-day SMA at 135.15, standing above the 134.75 barrier.
Alternatively, if 138.00 proves easy to get through, the spotlight will turn to the almost seven-year high of 140.00. On top of that, the bulls would need to clear the 141.00 round number, registered in June 2015.
In the short-term picture, EURJPY turned positive after the bounce off 124.40. Should the market continue the upward pattern, the outlook may turn brighter. A run above 140.00 would turn the outlook to strongly bullish.
GBPUSD Losing 2% after BoE with Next Big Stop as at Low as 1.2000
GBPUSD collapsed to 1.2380 by 2% or more than 230 pips from the start of the day on Thursday, with pressure intensifying after the Bank of England’s bank rate decision announcement.
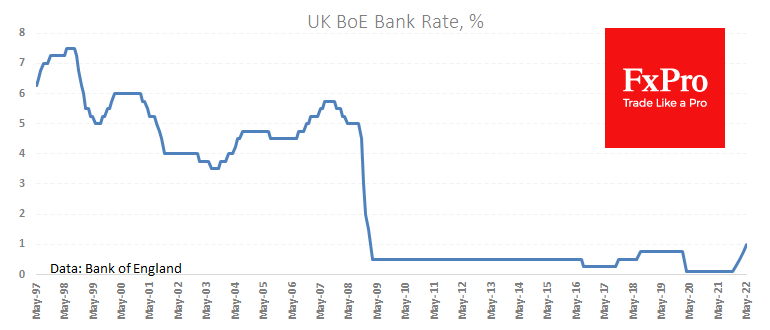
As analysts had expected, the Bank of England raised the rate by 25 points to 1.0%. Three of the nine monetary policy committee members called for a 50-point increase at once, and there were hints in the comments that a 50-point increase could be an option at subsequent meetings.
At the same time, the Bank of England has worsened its economic outlook for 2023, expecting the economy to contract in response to tight financial conditions and the effects of high energy prices. The currency market sees the recession as a notable negative factor, putting pressure on medium and long-term interest rates.
After consolidating over the last few days and attempting a rebound yesterday after the FOMC, GBPUSD has moved sharply back down and updated to lows from June 2020, a strong bearish signal.
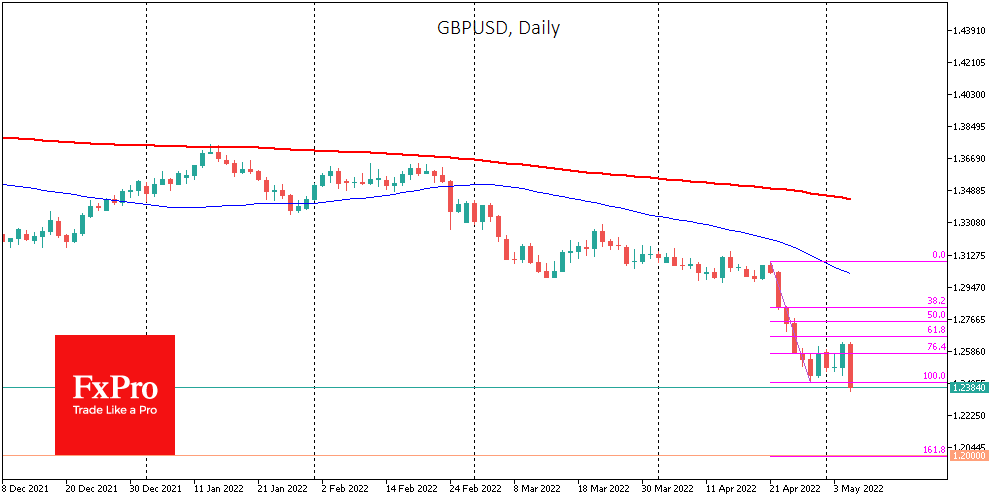
The pair runs the risk of slipping to 1.2000, an area proven to be the Pound’s last line of defence more than once in previous years, without much of a hurdle.
The significant support of the previous six years and the 161.8% Fibonacci target from the last declining momentum since late April are concentrated here.