Sample Category Title
RBA hikes by 25bps to 0.35%, more to come
RBA raises cash rate target by 25bps to 0.35% today, larger than expectation of 15bps to 0.25%. The interest rate on Exchange Settlement balances is also lifted by 25bps to 0.25%. In the forward guidance, RBA said it's committed to "ensure that inflation in Australia returns to target over time". That will "require a further lift in interest rates over the period ahead".
In the accompanying statement, RBA said the economy has "proven to be resilient and inflation has picked up more quickly, and to a higher level, than was expected" while "wages growth is picking up". It's appropriate to start the process of normalizing monetary conditions."
Unemployment rate is expected to decline to around 3.5% by early 2023, hitting the lowest level in almost 50 years. GDP is projected to grow by 4.25% over 2022 and 2% over 2023. Headline expected to rise further from current 5.1% to 5% this year. Underlying inflation is also expected to rise from current 3.7% to 4.75%. By mid-2024, headlines and underlying inflation are projected to have moderated back to around 3%, with assumption of further rate hikes.
(RBA) Statement by Philip Lowe, Governor: Monetary Policy Decision
At its meeting today, the Board decided to increase the cash rate target by 25 basis points to 35 basis points. It also increased the interest rate on Exchange Settlement balances from zero per cent to 25 basis points.
The Board judged that now was the right time to begin withdrawing some of the extraordinary monetary support that was put in place to help the Australian economy during the pandemic. The economy has proven to be resilient and inflation has picked up more quickly, and to a higher level, than was expected. There is also evidence that wages growth is picking up. Given this, and the very low level of interest rates, it is appropriate to start the process of normalising monetary conditions.
The resilience of the Australian economy is particularly evident in the labour market, with the unemployment rate declining over recent months to 4 per cent and labour force participation increasing to a record high. Both job vacancies and job ads are also at high levels. The central forecast is for the unemployment rate to decline to around 3½ per cent by early 2023 and remain around this level thereafter. This would be the lowest rate of unemployment in almost 50 years.
The outlook for economic growth in Australia also remains positive, although there are ongoing uncertainties about the global economy arising from: the ongoing disruptions from COVID-19, especially in China; the war in Ukraine; and declining consumer purchasing power from higher inflation. The central forecast is for Australian GDP to grow by 4¼ per cent over 2022 and 2 per cent over 2023. Household and business balance sheets are generally in good shape, an upswing in business investment is underway and there is a large pipeline of construction work to be completed. Macroeconomic policy settings remain supportive of growth and national income is being boosted by higher commodity prices.
Inflation has picked up significantly and by more than expected, although it remains lower than in most other advanced economies. Over the year to the March quarter, headline inflation was 5.1 per cent and in underlying terms inflation was 3.7 per cent. This rise in inflation largely reflects global factors. But domestic capacity constraints are increasingly playing a role and inflation pressures have broadened, with firms more prepared to pass through cost increases to consumer prices. A further rise in inflation is expected in the near term, but as supply-side disruptions are resolved, inflation is expected to decline back towards the target range of 2 to 3 per cent. The central forecast for 2022 is for headline inflation of around 6 per cent and underlying inflation of around 4¾ per cent; by mid 2024, headline and underlying inflation are forecast to have moderated to around 3 per cent. These forecasts are based on an assumption of further increases in interest rates.
The Bank's business liaison suggests that wages growth has been picking up. In a tight labour market, an increasing number of firms are paying higher wages to attract and retain staff, especially in an environment where the cost of living is rising. While aggregate wages growth was subdued during 2021 and no higher than it was prior to the pandemic, the more timely evidence from liaison and business surveys is that larger wage increases are now occurring in many private-sector firms.
Given both the progress towards full employment and the evidence on prices and wages, some withdrawal of the extraordinary monetary support provided through the pandemic is appropriate. Consistent with this, the Board does not plan to reinvest the proceeds of maturing government bonds and expects the Bank's balance sheet to decline significantly over the next couple of years as the Term Funding Facility comes to an end. The Board is not currently planning to sell the government bonds that the Bank purchased during the pandemic.
The Board is committed to doing what is necessary to ensure that inflation in Australia returns to target over time. This will require a further lift in interest rates over the period ahead. The Board will continue to closely monitor the incoming information and evolving balance of risks as it determines the timing and extent of future interest rate increases.
Gold resume decline, heading to 1817 first
Gold dropped notably this week on the back of strong Dollar. Rising treasury yield, with 10-year yield breaching 3% handle for the first time since 2018, also weigh on the precious metals.
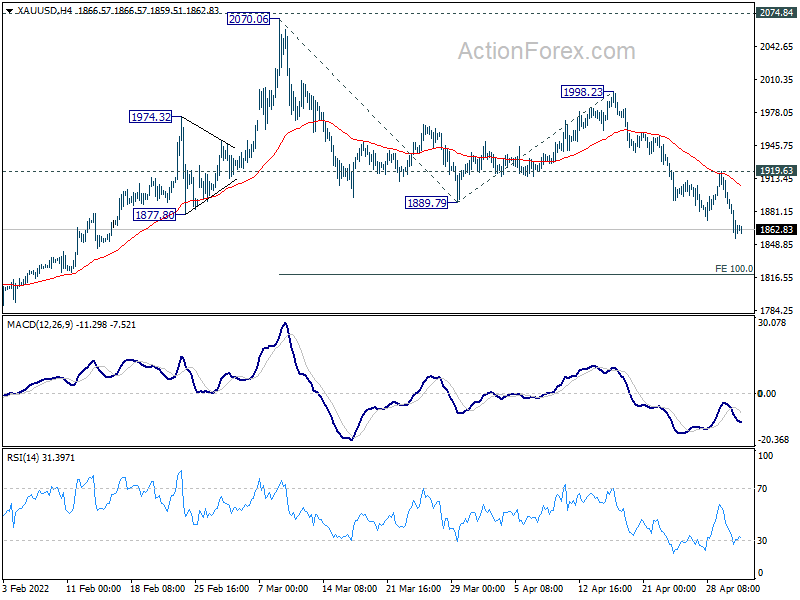
Gold's fall from 1998.23 resumed after slightly stronger than expected recovery last week. Such fall is seen as the third leg of the decline from 2070.06, and should target 100% projection of 2070.06 to 1889.79 from 1998.23 at 1817.86 next. In any case, more downside is expected for the near term as long as 1919.63 resistance holds.
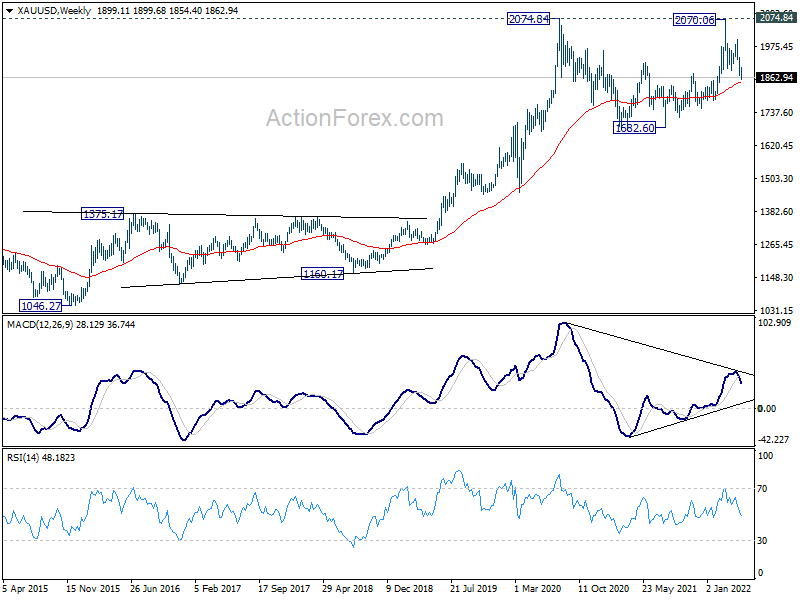
Also, such decline is seen as the third leg of the corrective pattern from 2074.84 (2020 high). Sustained trading below 55 week EMA (now at 1843.71) would pave the way back to 1682.60 support, where is should finish the pattern and bring long term up trend resumption.
GBP/USD Consolidates Losses, Key Hurdles Nearby
Key Highlights
- GBP/USD declined sharply below the 1.2620 support zone.
- It is now attempting a recovery wave above the 1.2550 level.
- EUR/USD is showing signs of more losses below 1.0500.
- The US ISM Manufacturing Index declined from 57.1 to 55.4 in April 2022.
GBP/USD Technical Analysis
The British Pound declined heavily after it broke the 1.2800 support against the US Dollar. GBP/USD traded below the 1.2720 support to enter a bearish zone.
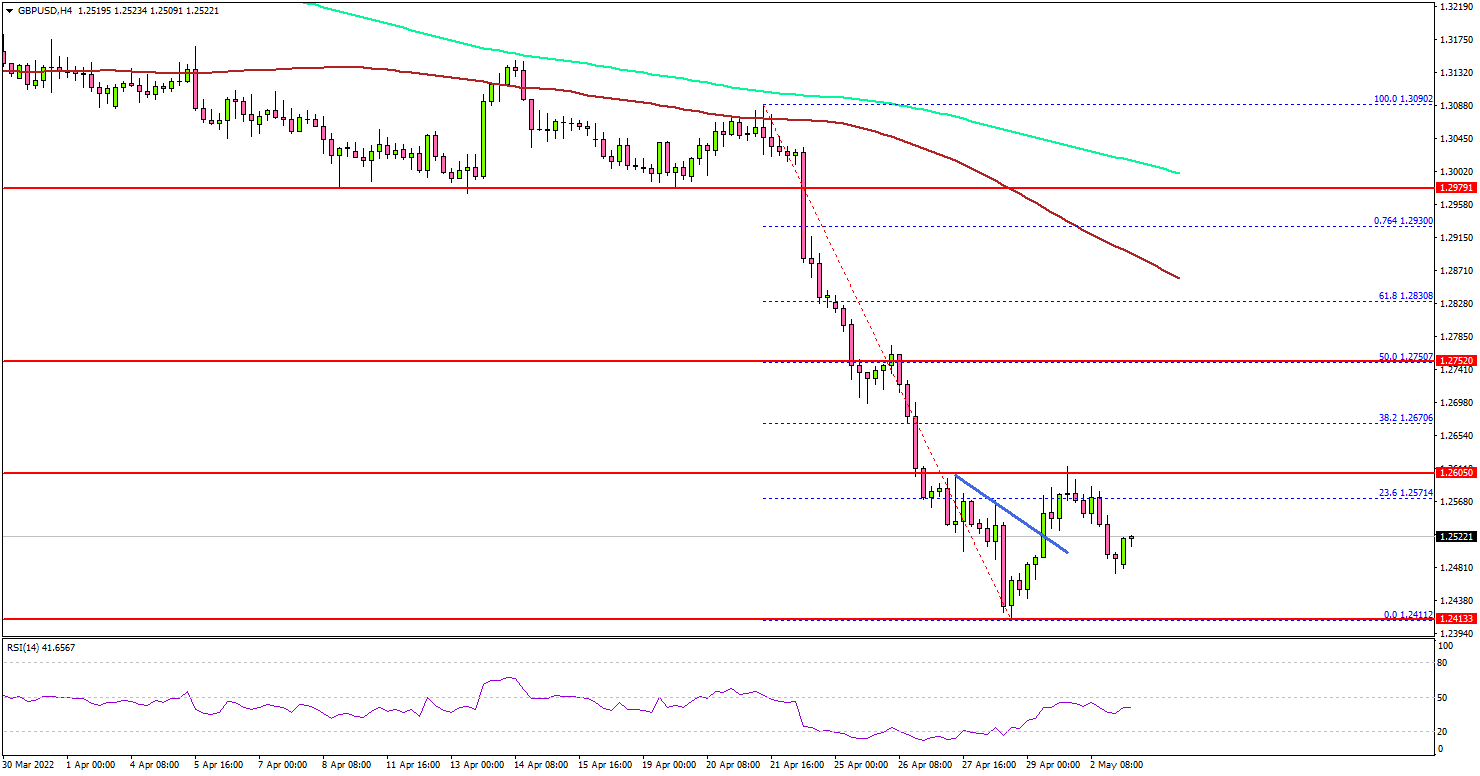
Looking at the 4-hours chart, the pair tumbled below the 1.3620 level. It even settled below 1.3600, the 200 simple moving average (green, 4-hours), and the 100 simple moving average (red, 4-hours).
Finally, there was a move below the 1.2500 level and the pair traded to a new multi-month low at 1.2411. It is now correcting losses above the 1.2500 level. There was a move above a short-term bearish trend line at 1.2520 on the same chart.
An immediate resistance is near the 1.2600 level or the 23.6% Fib retracement level of the key decline from the 1.3090 swing high to 1.2411 low.
The next major resistance is seen near the 1.2750 level or the 50% Fib retracement level of the key decline from the 1.3090 swing high to 1.2411 low. A close above 1.2720 and 1.2750 could open the doors for a move towards the main 1.2920 resistance.
If not, there is a risk of more losses below 1.2500. The next major support is near the 1.2420 level. Any more losses may perhaps open the doors for a move towards the 1.2300 support zone.
Fundamentally, the US ISM Manufacturing Index for April 2022 was released yesterday by the Institute for Supply Management. The market was looking for a rise from 57.1 to 57.6.
The actual result was disappointing, as the US ISM Manufacturing Index declined from 57.1 to 55.4 in April 2022. Besides, the ISM New Orders Index declined from 53.8 to 53.5.
Looking at EUR/USD, the pair is still trading in a bearish zone and there is a risk of a move below the 1.0450 level.
Economic Releases
- Euro Zone Unemployment Rate for March 2022 - Forecast 6.7%, versus 6.8% previous.
Elliott Wave View: CADJPY Zigzag Correction
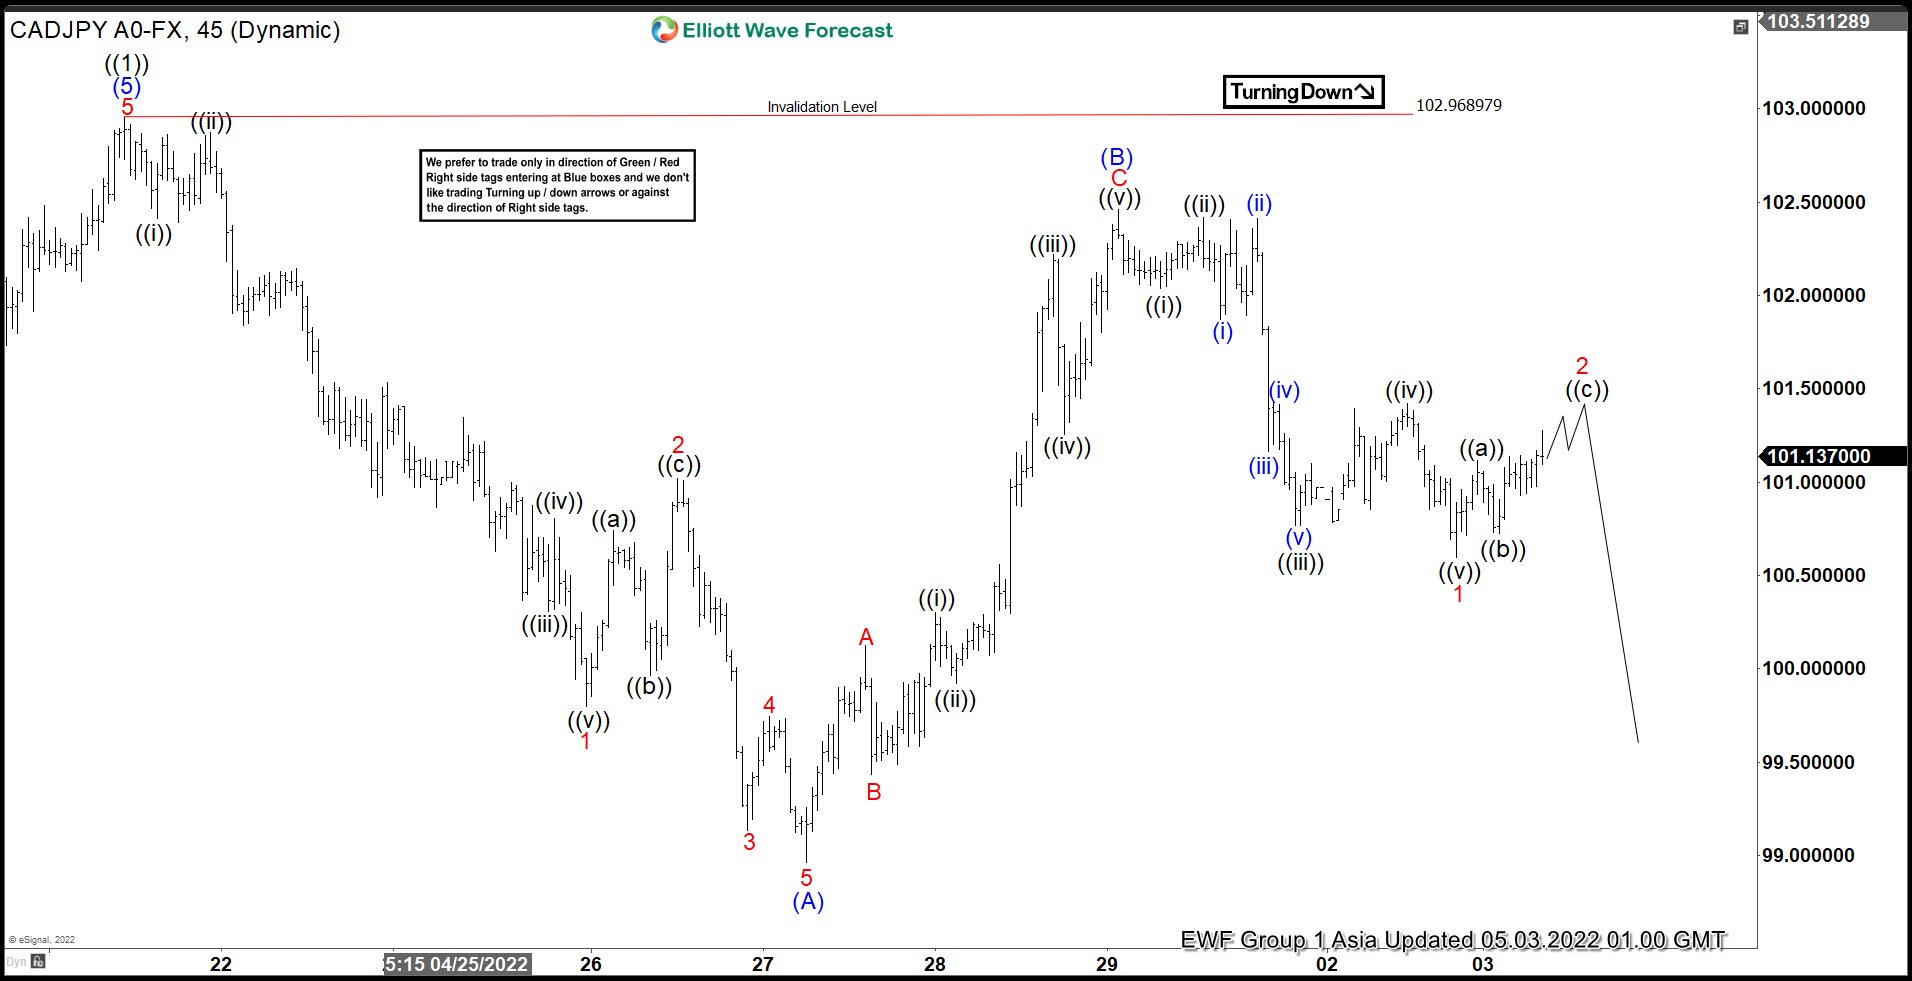
Short Term Elliott Wave View in CADJPY suggests cycle from December 20, 2021 has ended with wave ((1)) at 102.96. Pullback in wave ((2)) is currently in progress to correct that cycle. Internal subdivision of wave ((2)) is unfolding as a zigzag Elliott Wave structure. Down from wave ((1)), wave 1 ended at 99.8 and rally in wave 2 ended at 101.02. Pair resumes lower in wave 3 towards 99.13, wave 4 ended at 99.74, and wave 5 ended at 98.96. This completed wave (A) in higher degree.
Wave (B) rally ended at 102.46 with internal subdivision as a zigzag structure in lesser degree. Up from wave (A), wave A ended at 100.12, pullback in wave B ended at 99.43, and wave C ended at 102.46 which completed wave (B). Expect pair to extend lower in wave (C) with internal subdivision as another 5 waves in lesser degree. Down from wave (B), wave 1 ended at 100.59. While wave 2 rally fails below wave (B) at 102.46, and more importantly below wave ((1)) at 102.96, pair should resume lower. Potential target for wave (C) lower is 100% – 161.8% Fibonacci extension of wave (A) which comes at 96 – 98.4.
CADJPY 45 Minutes Elliott Wave Chart
Eco Data 5/3/22
[php_everywhere instance="1"]
Oil Preparing for Sharp Moves
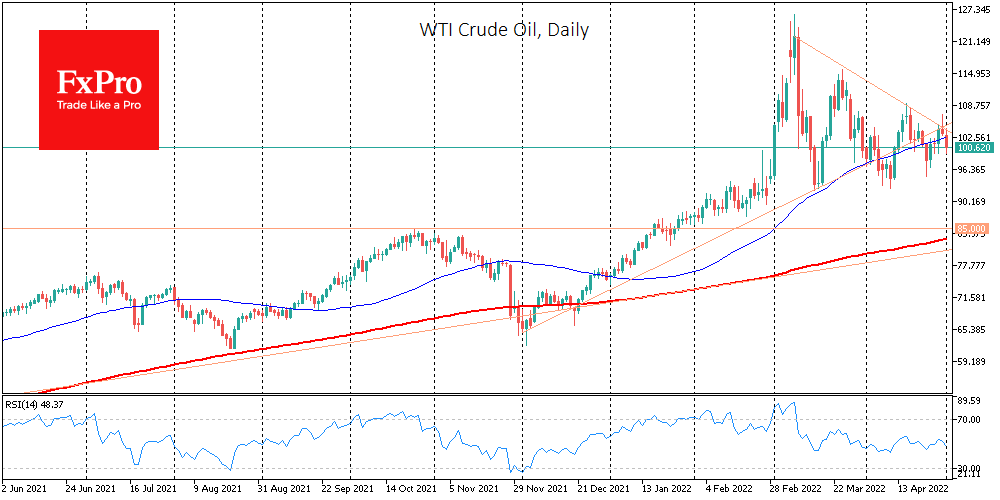
The price of crude is down more than 3% by the start of the New York trading session with a tug-of-war around $100 a barrel of WTI. And this is a rather remarkable market reaction, given reports that EU countries are dropping their veto on the Russian oil embargo one by one.
Germany, followed by Austria, Hungary, and Slovakia, have withdrawn their vetoes to ban oil purchases from Russia. Moreover, the German finance minister has pointed to the technical possibility of an immediate embargo.
This news, in practice, has not triggered a new wave of oil purchases by speculators. A stronger dollar and signs of slowing activity in China and the US continue to weigh on global demand for risky assets and oil.
Global investor wariness is preventing oil from making full use of market conditions, raising questions about the sustainability of the latest rally in December.
The signal for a break in the uptrend would be for oil to consolidate below the area of previous local lows at $95. However, one can draw a downtrend through the March and April peaks. Potentially, this situation leads to a strong move after exiting the two-month consolidation.
The week ahead is full of critical macro events that could throw the markets off their fragile balance, from the OPEC+ meeting and EU sanctions to the announcement of FOMC decisions and the monthly US employment statistics.
US: ISM Manufacturing Index Registers 23rd Consecutive Month of Expansion
The March ISM manufacturing index registered 55.4, missing expectations of a 57.6 print. The index fell 1.7 percentage points from the March reading of 57.1.
New orders fell by 0.3 percentage points to 53.5, while new export orders fell by 0.5 percentage points to 52.7.
The backlog of orders sub-index came in at 56.0, falling 4.0 percentage points from March's 60.0 print.
The production index decreased 0.9 percentage points to 53.6, while the employment index fell 5.4 percentage points to 50.9.
The supplier deliveries sub-index rose to 67.2 points from 65.4 in March. The sub-index continues to reflect difficulties in improving delivery rates due to production issues related to the pandemic.
17 of 18 manufacturing industries reported growth in January. Growth was led by Apparel, Leather & Allied Products; Machinery; Plastics & Rubber Products; Nonmetallic Mineral Products; Computer Electronic Products; and Food, Beverage & Tobacco Products.
Key Implications
The manufacturing sector continues to expand but the PMI has now contracted for the second consecutive month and has recorded its lowest reading since July 2020.
On the supply side, inventories expanded at their slowest rate since July 2021 and supplier delivery times expanded at their fastest pace since last November. Looking forward, the ongoing lockdowns in China threaten to renew bottlenecks in deliveries, raising the prospect of renewed inventory drawdowns. Moreover, rising energy prices are helping push transportation and production costs higher. With strong wage growth supporting demand, these costs will continue to be passed on to consumers, adding pressure to goods inflation.
April's ISM reflects an economy that continues to expand despite facing increasing headwinds. Employment in the manufacturing sector registered only a moderate expansion while the production subindex has continued to trend downwards. With the global outlook becoming increasingly gloomy and U.S. consumers shifting spending away from manufactured goods, it could be a bumpy ride over the coming months.
Euro Struggles at 5-Year Lows
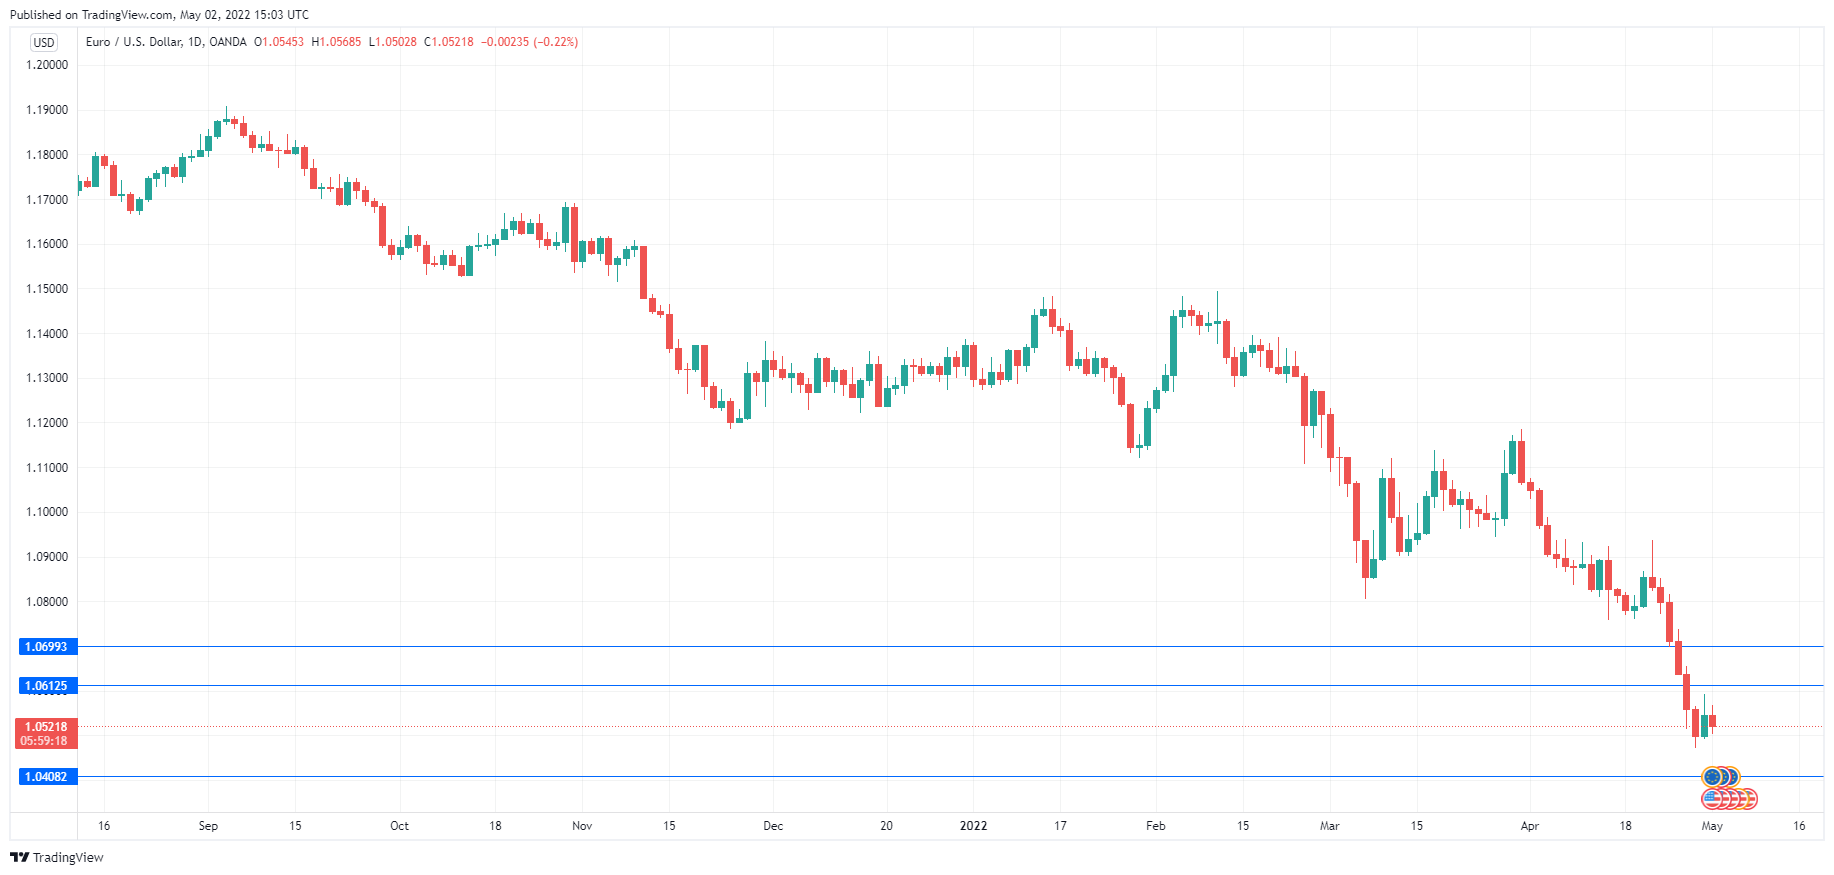
EUR/USD suffered a dismal week, plunging 2.33%. The euro broke below the 1.05 line on Thursday but has managed to recover.
The ECB doesn’t meet until June, but policy makers will be closely monitoring eurozone inflation, which continues to climb. It was only a few months ago that ECB President Lagarde was dismissive about rising inflation, saying that it was a transient development (readers will recall the exact same stance from Fed Chair Powell). We certainly won’t be hearing the ‘T” word anymore with regard to eurozone inflation, which hit a massive 7.5% in April. The ECB may not stay in sync with the pace of tightening by the Fed and other major central banks, but the ECB is signalling that the issue is not whether to hike, but when and by how much. There are hawkish voices within the ECB calling for a June hike, but September could be the month to circle in the calendar, which will give policy makers additional data to review before making any moves.
In the case of the Fed, tighter rates are a given, with spiralling inflation, a tight labor market and robust growth. It’s a trickier scenario for the ECB, as eurozone growth has not been as strong and the Ukraine war and Russian sanctions have dampened economic growth. There are concerns about stagflation, and these risks will rise as the ECB raises rates. We can expect the ECB to tighten policy in the coming months, but at a much slower pace than the Fed.
The FOMC meets on Wednesday and a half-point hike from the Fed is practically a done deal. This will be a significant move, as the Fed hasn’t delivered such a large rate increase in 20 years. The Fed has hinted at additional half-point rates in June and July, and some analysts are even predicting super-supersize hikes of 0.75%, which hasn’t happened since 1994. The Fed is in full throttle trying to catch up to the inflation curve, and this widening of the US/Europe rate differential could push the euro to 1.03 and perhaps even to parity in the coming months.
EUR/USD Technical
- There is resistance at 1.0612 and 1.0699
- 1.0408 is providing support, followed by 1.0321
WTI Oil Outlook: Oil Price Drops as Concerns about China’s Demand Offset Supply Fears
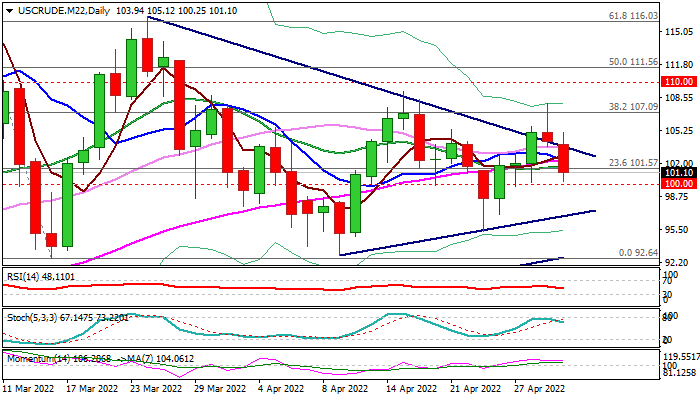
WTI oil price fell near $100 support on Monday, extending weakness after Friday’s rally stalled, ending trading in bearish candle with long upper shadow and closing below the upper boundary line of the triangle, formed on daily chart.
Fresh weakness was sparked by renewed fears about demand from China, the world’s biggest oil importer, that sidelined fears about stronger supply disruption by potential EU ban on Russian crude oil.
Near-term price action continues to move within the narrowing range, limited by a triangle and without clear direction, with mixed daily techs adding to the picture.
Bearish scenario would be activated on firm break of $100 level, but initial signal would look for confirmation on extension below triangle support line ($96.92) that would expose key supports at $92.92/64 (Mar / Apr higher base).
On the other side, sustained break above cracked triangle’s upper boundary ($103.59) would generate initial bullish signal which would look for verification on lift $107.09 (Fibo 38.2% of $130.48/$92.64), with bulls to tighten grip and sideline downside risk on lift above $110 barrier.
Res: 103.59; 105.12; 107.09; 107.95.
Sup: 100.25; 100.00; 96.92; 95.27.