Sample Category Title
AUD/USD Outlook: Aussie Bounces After Hawkish RBA Hike, But Recovery So Far Limited
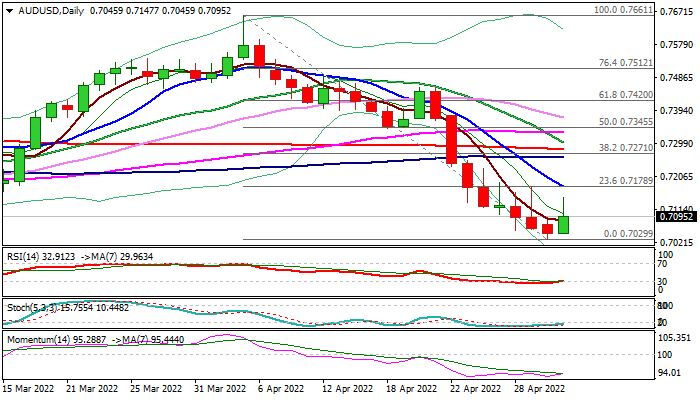
The AUDUSD jumped to two-day high (0.7147) after being in red for the seven consecutive days, lifted by the Reserve Bank of Australia rate hike on Tuesday.
The RBA surprised markets by raising interest rate by 25 basis points to 0.35%, as most of analysts were betting for a 15 basis points increase, and some expected the central bank to stay on hold ahead of Australia’s election on May 21.
The RBA said it is committed to do what is necessary to return soaring inflation to its target and signaled more action in the near future, marking today’s decision as a hawkish hike that would lift the Australian dollar, which fell over 5% in April.
Although the Aussie jumped around one full-figure in reaction to RBA’s decision, bulls lost traction ahead of initial resistance at 0.7178 (falling 10DMA / Fibo 23.6% of 0.7661/0.7029), where the recovery attempts were repeatedly rejected last week.
Break and close above this level is needed to generate initial reversal signal and open way for stronger recovery towards next targets at 0.7243/53 (daily Tenkan-sen / cloud base).
Daily studies show 14-d momentum turning north, deeply in the negative territory and RSI emerging from oversold zone, but near-term structure is expected to remain weak while the action is limited under 0.7178 pivot.
Res: 0.7147; 0.7178; 0.7228; 0.7243.
Sup: 0.7045; 0.7029; 0.7000; 0.6967.
Gold and Silver at the Lower Limits
Gold and silver have come under increased pressure in the last two weeks. Silver has ten sessions of back-to-back decline, from $25 to $22.5, and is back near the lower end of its trading range since July 2020.
In the middle of last month, the pressure on gold intensified after a failed attempt to climb above $2000.
There was a similar disappointment for the bulls in silver when they failed once again to consolidate the price above the meaningful $25 round level.
The US dollar has strengthened by 5.8% since April, contributing significantly to the base appreciation in metals and other commodities.
In our view, gold and silver might continue their downward trend until FOMC comments or until the monthly labour market report.
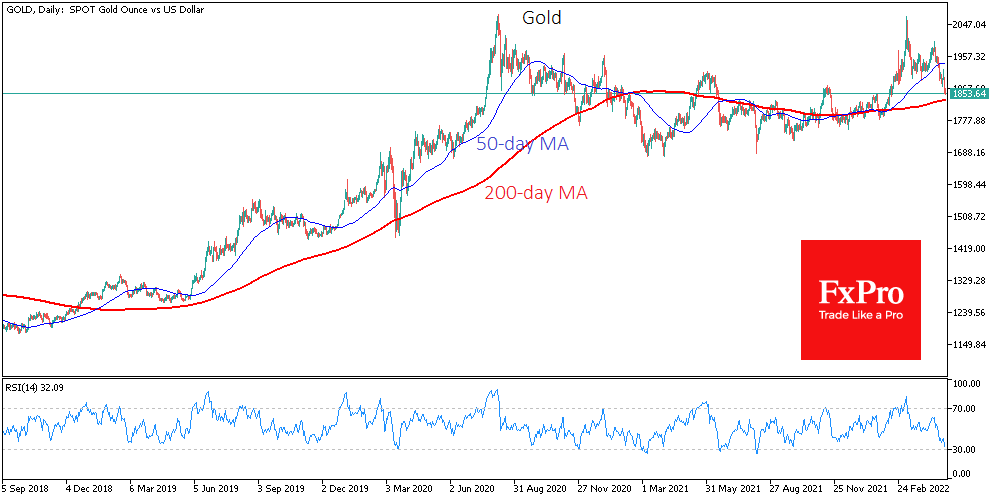
The potentially important support is around $1835, the 200 SMA. The performance of gold near that mark could lay the foundations for a prolonged trend, whether it is a reversal to the upside or a final capitulation of the buyers.
For silver, the following potential support line looks at $22.
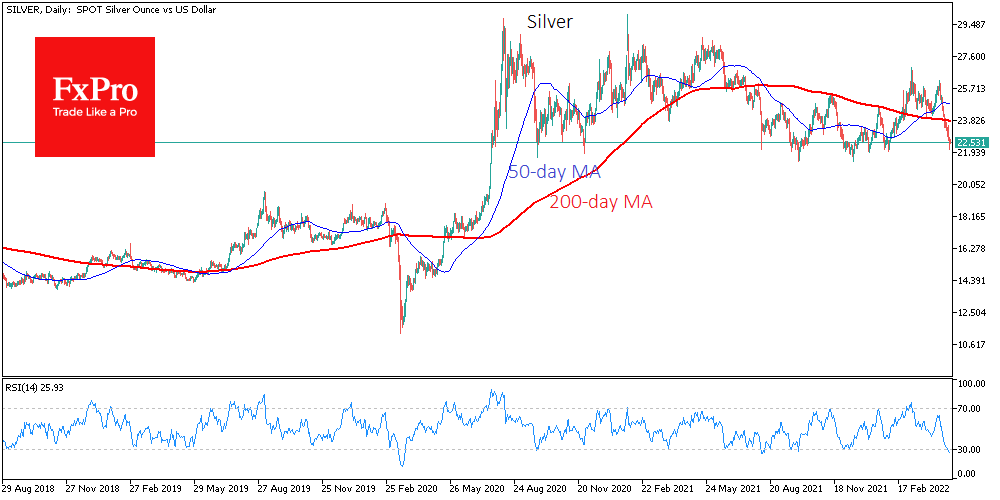
A sharp drop from $1830 in gold or below $22 in silver would confirm a break-up of the established ranges and promises to be the harbinger of an even more furious and prolonged decline.
In a pessimistic scenario, the gold price could retreat below $1500 by the end of the third quarter and to $16 in silver.
But suppose the Fed comments return demand for risk. In that case, the momentum in the precious metals could renew and give an informal start to the rally to update historical highs in gold and above $30 in silver.
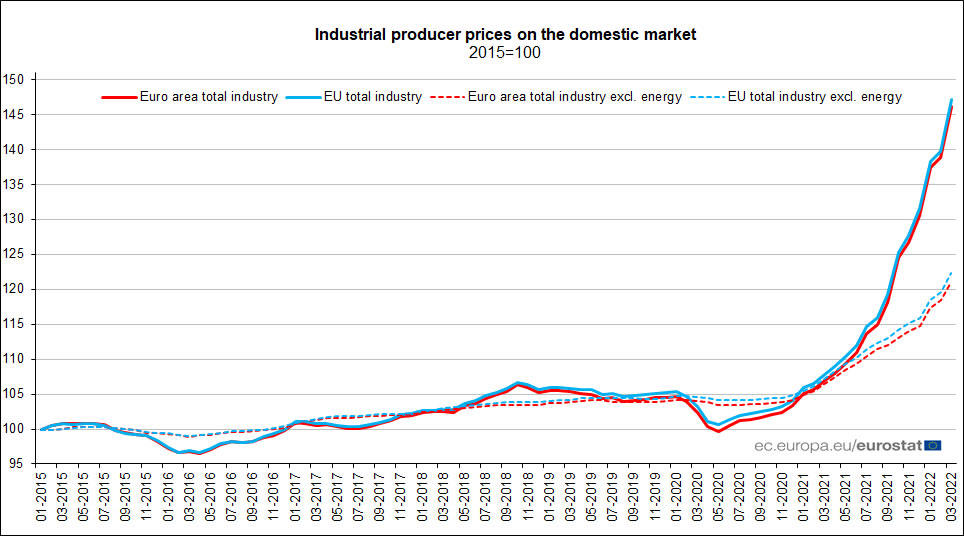
Eurozone PPI rose 5.3% mom, 36.8% yoy in Mar
Eurozone PPI rose 5.3% mom, 36.8% yoy in March, above expectation of 4.9% mom, 36.3% yoy. For the month, industrial producer prices increased by 11.1% in the energy sector, by 2.8% for intermediate goods, by 2.4% for non-durable consumer goods and by 0.8% for capital goods and durable consumer goods. Prices in total industry excluding energy increased by 2.1%.
EU PPI rose 4.% mom, 36.5% yoy. The highest monthly increases in industrial producer prices were recorded in Ireland (+36.1%), Greece (+8.8%) and Portugal (+8.4%). The only decrease was observed in Slovakia (-1.1%) while in Malta the industrial producer prices remained unchanged.
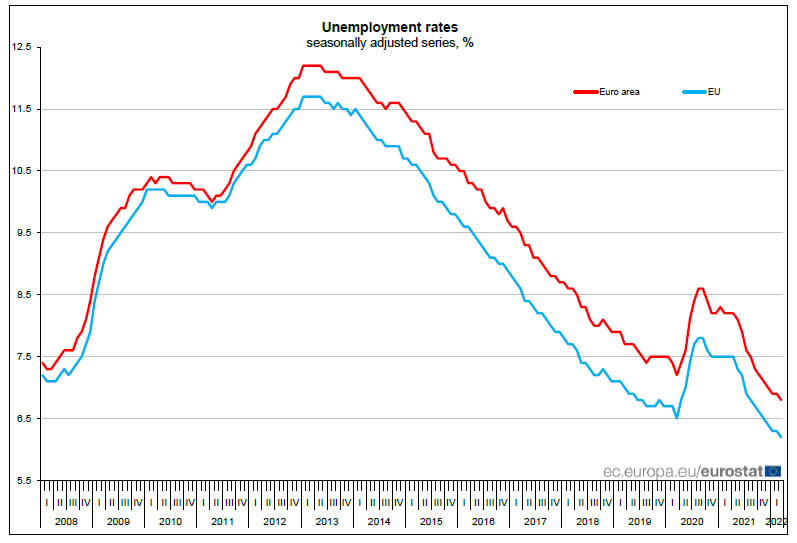
Eurozone unemployment rate dropped to 6.8% in Mar, EU dropped to 6.2%
Eurozone unemployment rate dropped from 6.9% to 6.8% in March, matched expectations. EU unemployment rate dropped from 6.3% to 6.2%.
Eurostat estimates that 13.374m men and women in EU, of whom 11.274m in Eurozone, were unemployed. Compared with February, the number of persons unemployed decreased by -85k in EU and by -76k in Eurozone .
Will EURUSD Resume its Bearish Pattern?
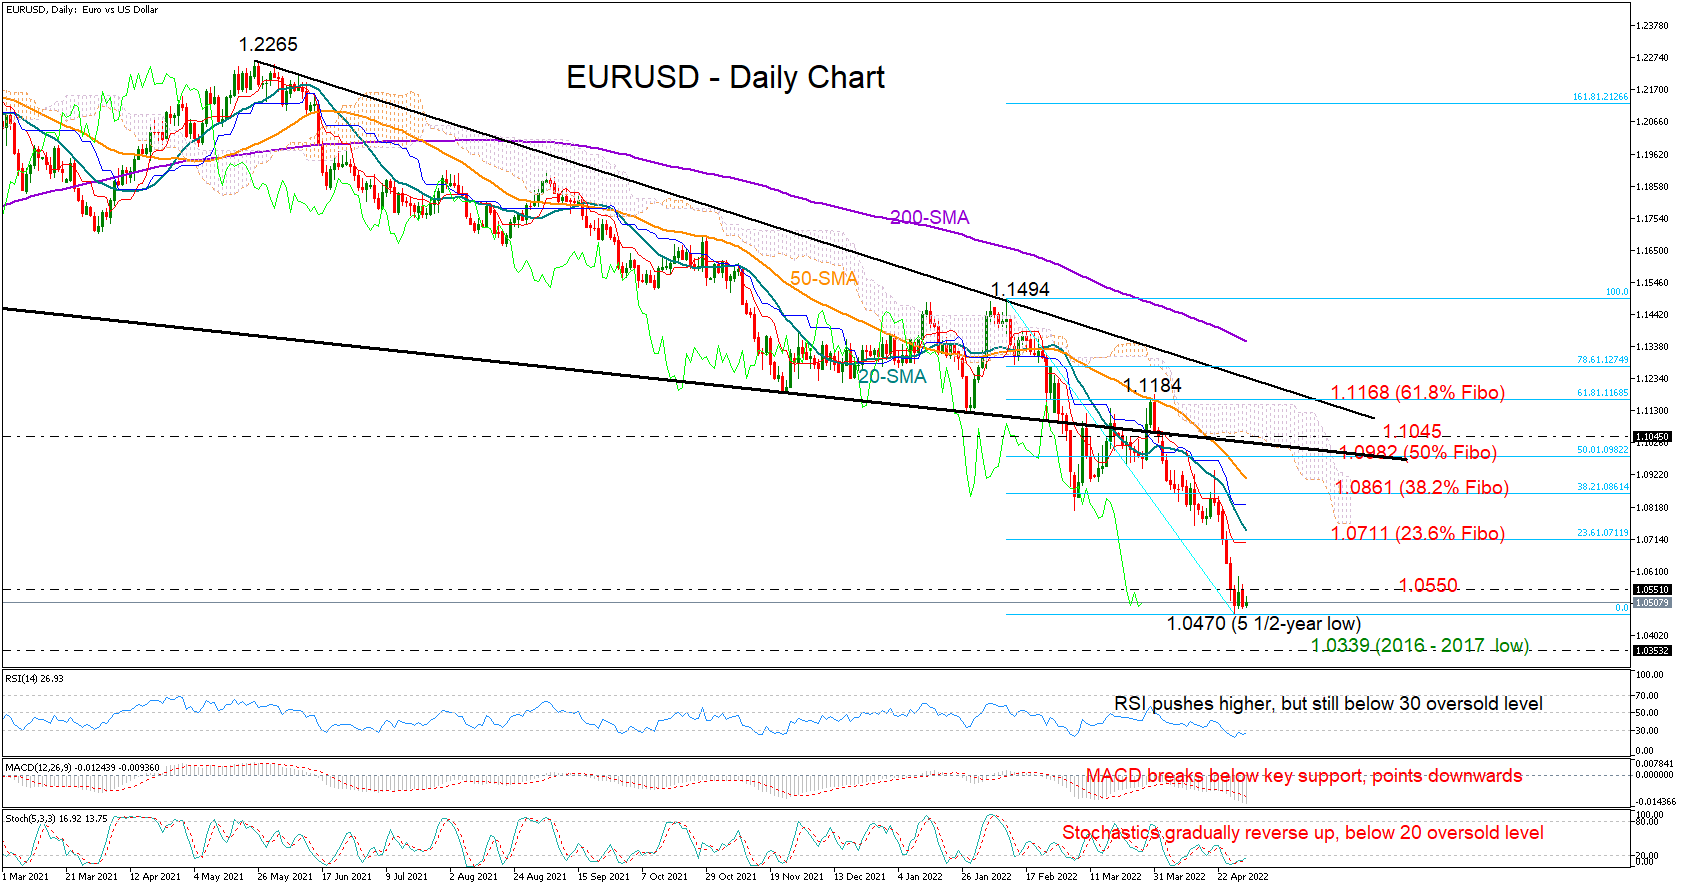
EURUSD switched to consolidation following the dip to a 5 ½-year low of 1.0470 last week, ranging quietly between the 1.0550 resistance and the 1.0497 support for the fourth consecutive day.
The RSI and the Stochastics are making efforts to exit the oversold territory, though they need more convincing upside moves to signal the end of April’s sell-off, especially as the MACD remains negatively charged after crossing below a key base.
In terms of the market trend, the downward-sloping simple moving averages (SMAs) are endorsing the negative direction in the market. Also, horizontal trading at the bottom of a downtrend is usually considered a signal of the continuation of the original bearish pattern.
Hence, the risk is still skewed to the downside and, as long as the 1.0550 cap holds firm, a tumble towards the 2016 - 2017 bottom of 1.0339 is possible. Lower, all eyes will turn to the 1.0133 barrier, which was last active during the 1999 – 2002 period.
Should buying interest grow above 1.0550 instead, the price may ascend towards the red Tenkan-sen line at 1.0711. This is where the 23.6% Fibonacci retracement of the 1.1494 – 1.0470 is positioned, while the 20-day SMA is nearing that zone as well. Therefore, a step above that bar could navigate the pair directly to the 38.2% Fibonacci of 1.0860. Higher, a tougher battle could start between the 50% Fibonacci of 1.0982 and the broken restrictive surface of the 2008 bearish channel at 1.1045. A close above the latter is expected to clear the way towards the 61.8% Fibonacci of 1.1168 and the previous peak of 1.1184.
In brief, EURUSD is neutral-to-bearish in the short-term picture. Any violation above 1.0550 or below 1.0497 could set the tone in the market accordingly.
Gold Remains Under Pressure, Unlocking 2½-Month Low
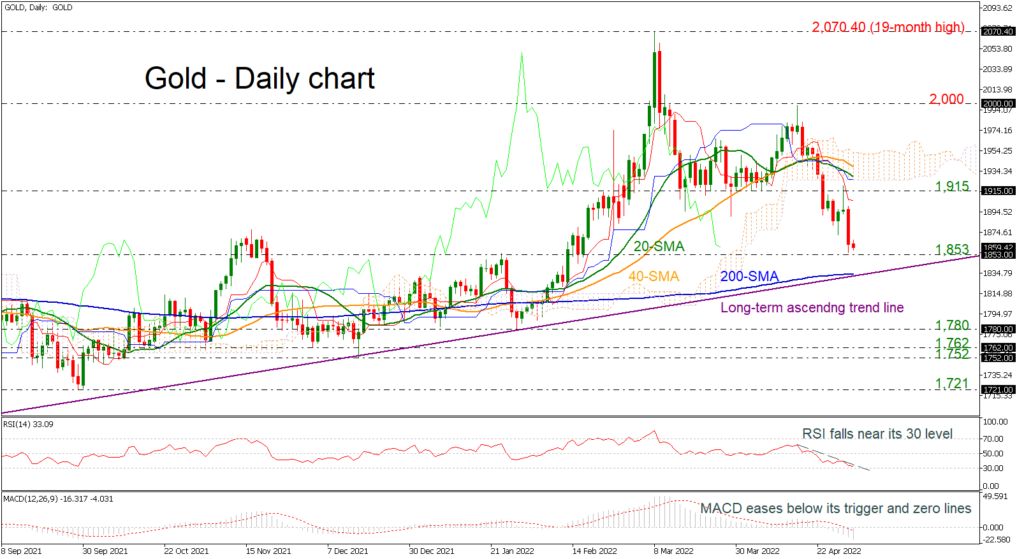
Gold prices are declining near the new two-and-a-half-month low of 1,853. The price is continuing its move lower after the pullback off the 2,000 psychological mark. If the commodity declines further, immediate support could come from the 200-day simple moving average (SMA) near 1,834, which hovers near the long-term uptrend line. Any steeper downside movements may change the broader outlook to neutral, hitting the 1,780 support and the 1,752-1,762 zone.
Having a look at the technical indicators, they both confirm the recent bearish structure. The RSI is approaching the oversold zone continuing the descending move from the positive region, while the MACD is extending its negative momentum below its trigger and zero lines. Also, the 20- and 40-day SMAs posted a bearish crossover in the previous sessions, and the red Tenkan-sen line is standing below the blue Kijun-sen line of the Ichimoku cloud.
Otherwise, any rebound off the recent low may help the price to gain some ground, reaching the 1,915 resistance and the short-term SMAs, inside the Ichimoku cloud around 1,929 and 1,937. Even higher, the 2,000 round number may halt the bullish actions.
All in all, the precious metal is in a bearish mode in the short-term, but in the bigger view, the picture is still positive.
UK PMI manufacturing finalized at 55.8, failed to mask the continued headwinds
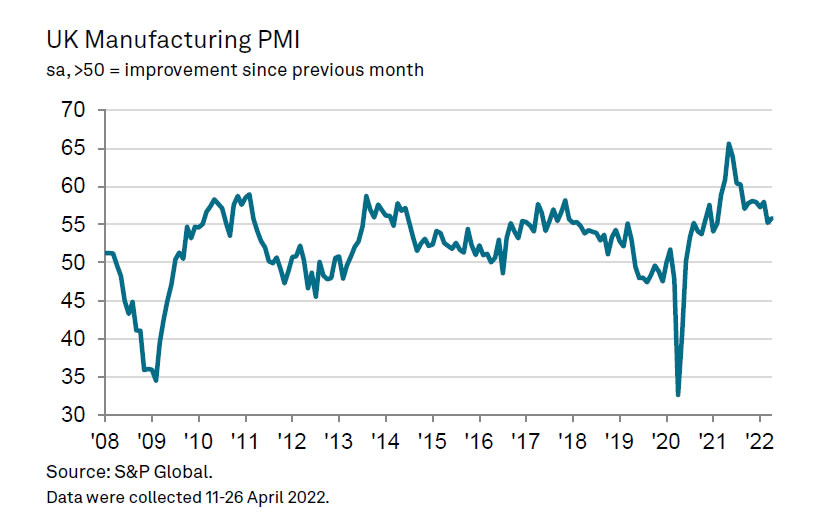
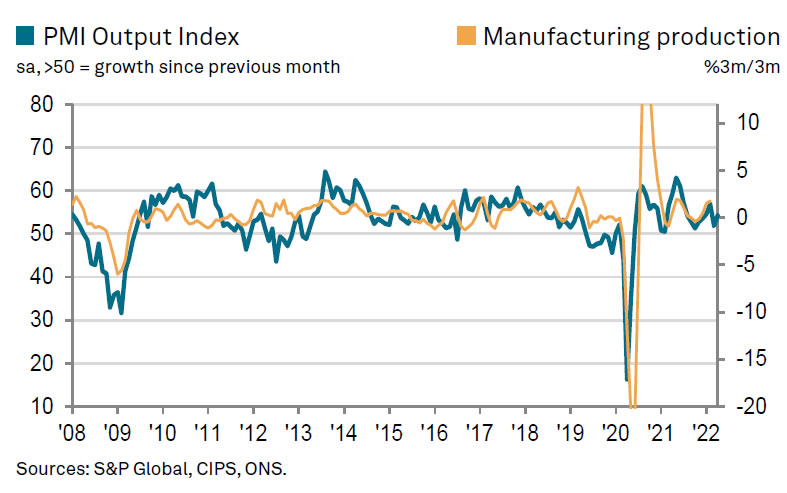
UK PMI Manufacturing was finalized at 55.8 in April, up slightly from march's 55.2. S&P Global said production growth improved slightly. New orders rose at slower pace as new export business retreated. Selling prices rose at record pace as cost inflation accelerated.
Rob Dobson, Director at S&P Global, said: "The improved expansion of output at manufacturers, while positive in itself, failed to mask the continued headwinds buffeting the sector... Manufacturers and their clients are struggling as lockdowns in China and the Ukraine war exacerbate stretched global supply chains, the inflationary picture worsens and geopolitical tensions rise. Specific to the UK, Brexit represents an additional headwind...
"Business optimism has fallen to a 16-month low as companies become more cautious about the future outlook... The inflationary situation is getting increasingly fraught. Input costs rose to the second-greatest extent in the 30-year survey history, leading to a record increase in factory gate selling prices."
Aussie Jumps after RBA Rate Surprise
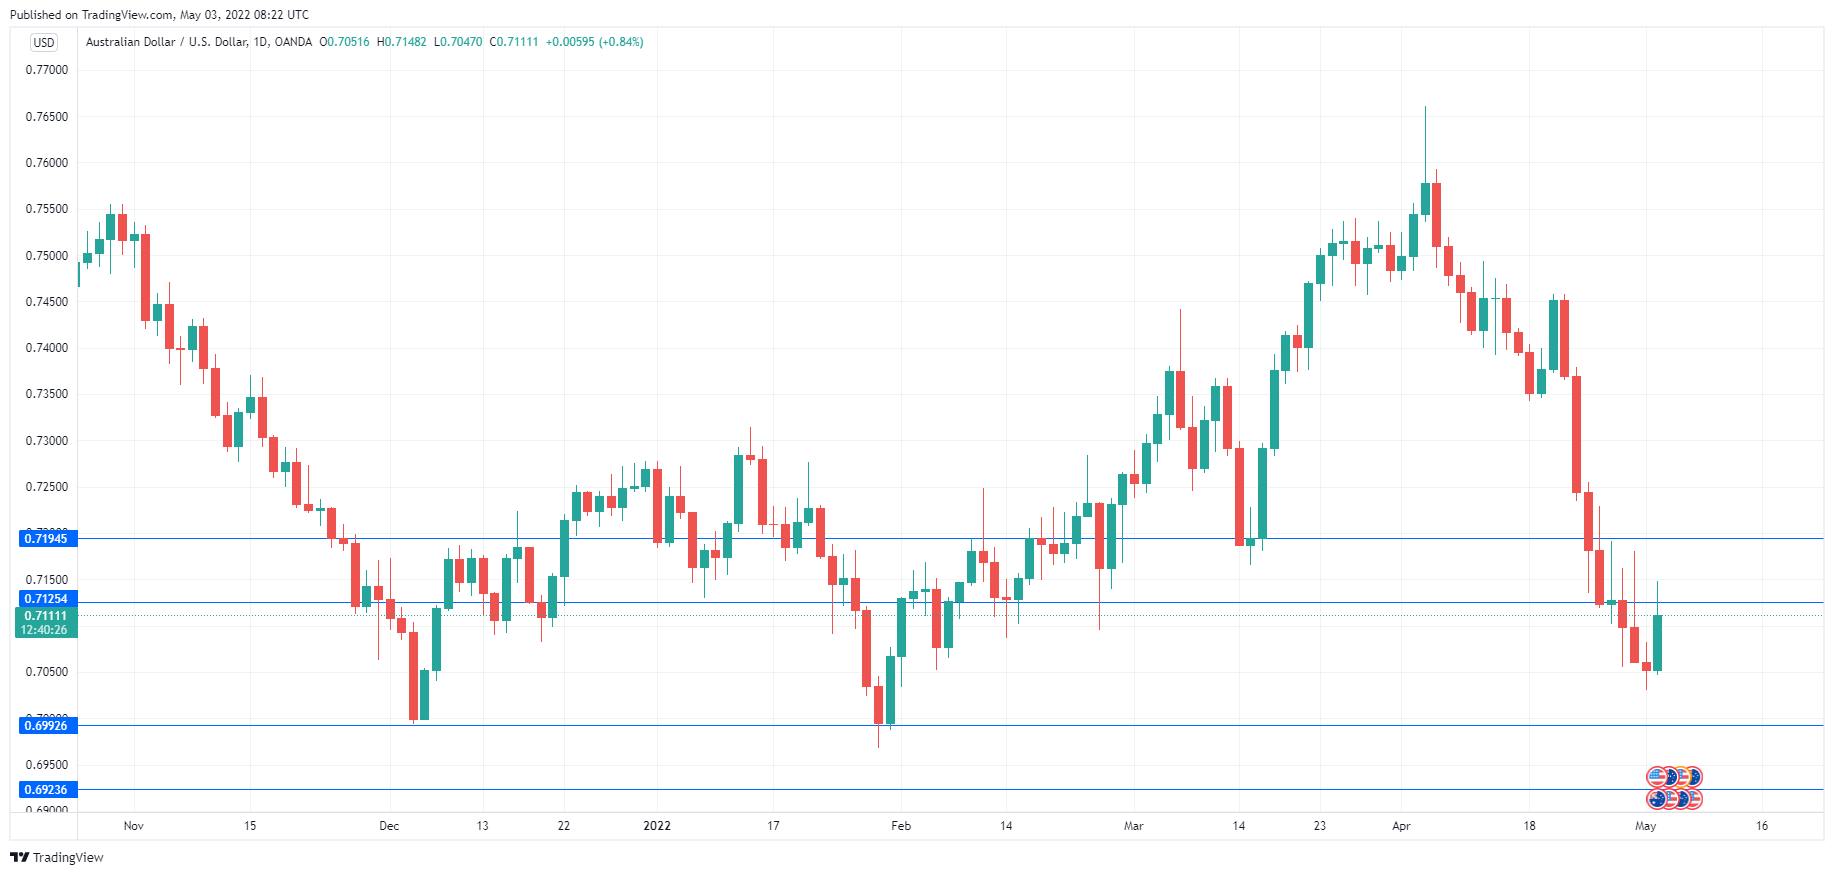
After a nasty slide over the past two weeks, the Australian dollar has rebounded sharply on Tuesday. AUD/USD is trading at 0.7111 in the European session, up 0.84% on the day.
RBA surprises with 0.25% hike
As expected, the RBA raised rates for the first time since November 2011. The 0.25% hike was larger than expected, as the markets had priced in a 0.15% increase. A headline I read this morning exclaimed, ‘RBA shocks market!’ This sounded to me like hyperbole, as the difference between 0.15% and 0.25% is not earth-shattering. Still, I can’t argue with the fact that the Australian dollar has responded with sharp gains, as investors are clearly pleased by the RBA move.
There had been talk that the RBA might stay on the sidelines until June, not wishing to make any moves in the midst of the Australian election campaign. However, spiralling inflation has become a major problem and the central bank clearly did not want to wait another month, given the risk that inflation would accelerate even higher. The RBA will likely continue to tighten policy until inflation begins to ease, although at a slower pace than the aggressive Fed rate-tightening cycle.
The market’s attention will now shift to the Federal Reserve later on Wednesday. The Fed is almost certain to hike rates by 0.50%, although there have been predictions of a super-supersize increase of 0.75%. The June and July meetings will likely see further hikes, as the Fed has pledged to wrestle down inflation. The markets are uneasy that the Fed’s aggressive stance could send the US economy into a recession, which has led to sharp volatility on the stock markets.
Equally as important as the rate hikes, the FOMC is expected to announce a reduction in bonds holdings, and the pace of the balance sheet normalization will be closely watched. If the Fed delivers a larger cap on holdings than expected, this would be bullish for the US dollar.
AUD/USD Technical
- There is support at 0.6992 and 0.6923
- AUD/USD has resistance at 0.7125 and 0.7194
American Stocks Volatility Continues ahead of FOMC Decision
American stocks were relatively mixed on Monday as the earnings season and worries about the Federal Reserve continued. The Dow Jones declined by 60 points while the tech-heavy Nasdaq 100 index rose by 30 points. Some of the top companies that announced mixed results on Monday were Moody’s, Clorox, and Global Payments. Others to watch this week will be Airbnb, Pfizer, Apollo Global, and Moderna among others. Meanwhile, the Federal Reserve will start its meeting today and then deliver its interest rate on Wednesday. Analysts expect that the bank will hike interest rates and start its quantitative tightening policy. The decision comes as data continues to show that the American economy is slowing. For example, the ISM manufacturing PMI fell from 57.1 to 55.4.
The euro was little changed against the US dollar ahead of important economic data from Europe. On Monday, data revealed that the Euro area consumer and business confidence declined in April as inflation concerned continued. These numbers mean that the European Central Bank (ECB) will have a difficult time hiking interest rates this year. Later today, the key European data to watch will be the latest German unemployment rate. Analysts expect that the unemployment rate moved from 5.0% to 4.9%. Other important data to watch will be producer price index (PPI) and the unemployment rate from the European Union. Christine Lagarde will also deliver a speech.
The Australian dollar rose after the latest interest rate decision by the Reserve Bank of Australia (RBA). The RBA decided to hike interest rate for the first time in years. It increased rates to 0.35%, which was higher than the expected 0.25%. The bank also signaled that it would keep hiking interest rates later this year in a bid to lower inflation. The decision came a week after data by the Australian Bureau of Statistics (ABS) showed that inflation rose to the highest level in years. Like in the United States, there are signs that the country’s inflation is peaking. Also, there are concerns about the Chinese economy as the government persists with covid-19 lockdowns.
EURUSD
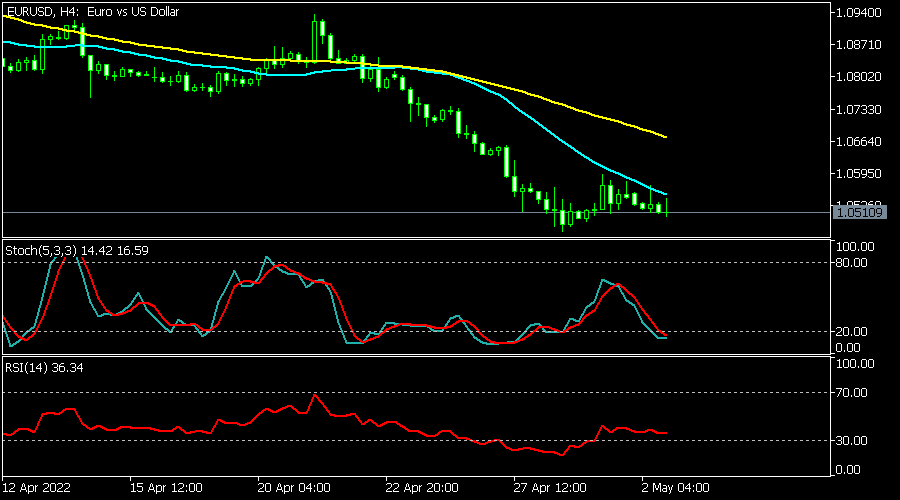
The EURUSD pair declined slightly as focus shifted to the upcoming Fed interest rate decision. It dropped to a low of 1.0560, which was slightly lower than last Friday’s high of 1.0570. It has moved slightly below the 25-day and 50-day moving averages while the Stochastic Oscillator has moved below the oversold level. The Relative Strength Index is moving sideways. The pair will likely keep falling ahead of the Fed decision.
GBPUSD
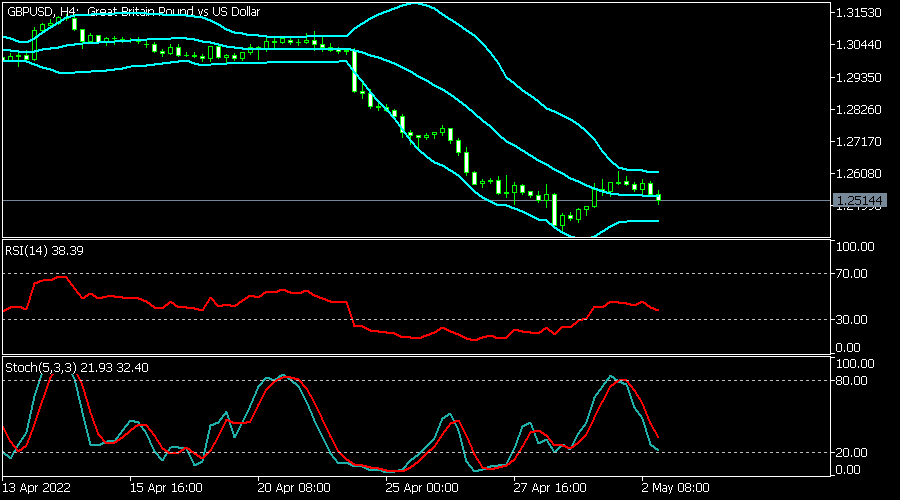
The GBPUSD pair retreated to 1.2511, which was slightly lower than last week’s high of 1.2618. It declined slightly below the middle line of the Bollinger Bands. It has also moved slightly below the 25-day moving average while the Stochastic oscillator is moving downwards. The Relative Strength Index has also dropped below the neutral point at 50. The pair will likely keep falling as bears target the support at 1.2460.
EURCHF
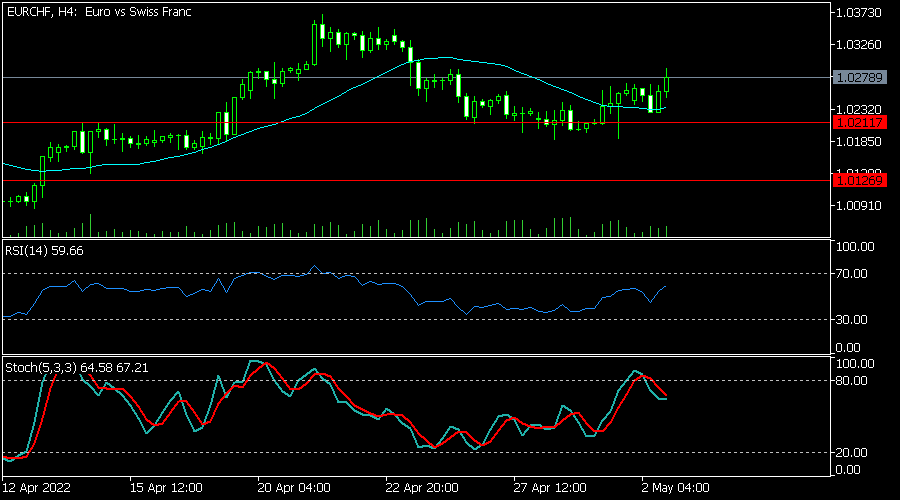
The EURCHF pair rose to a high of 1.0292, which was the highest level since April 27. The pair has moved above the important support at 1.0200 and risen above the 25-day and 50-day moving averages. The Relative Strength Index has moved close to the overbought level while the Stochastic Oscillator is pointing lower. The pair will likely keep rising as bulls target the key resistance level at 1.03200.
GBP/JPY Daily Outlook
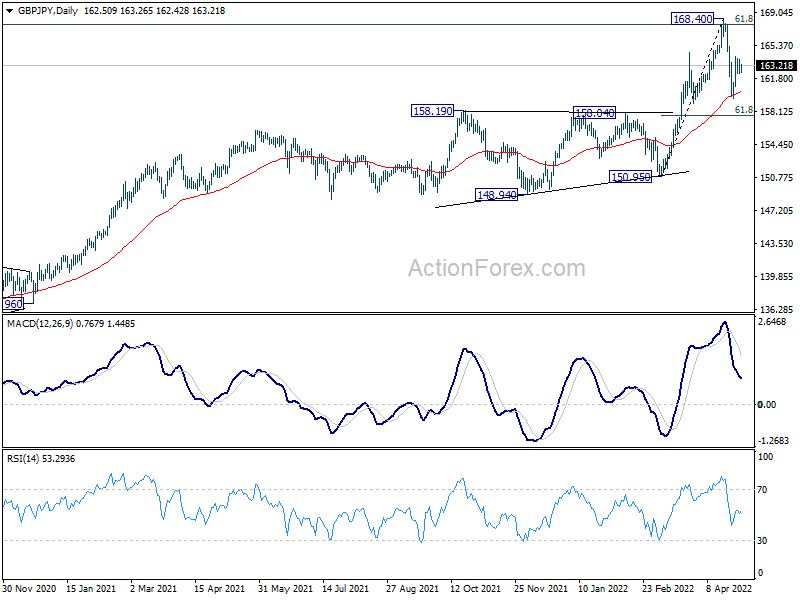
Daily Pivots: (S1) 161.96; (P) 162.94; (R1) 163.58; More...
Intraday bias in GBP/JPY stays neutral as correction from 168.40 is extending. In case of another fall, downside should be contained by 61.8% retracement of 150.95 to 168.40 at 157.61 to bring rebound. On the upside, firm break of 168.40 will resume larger up trend.
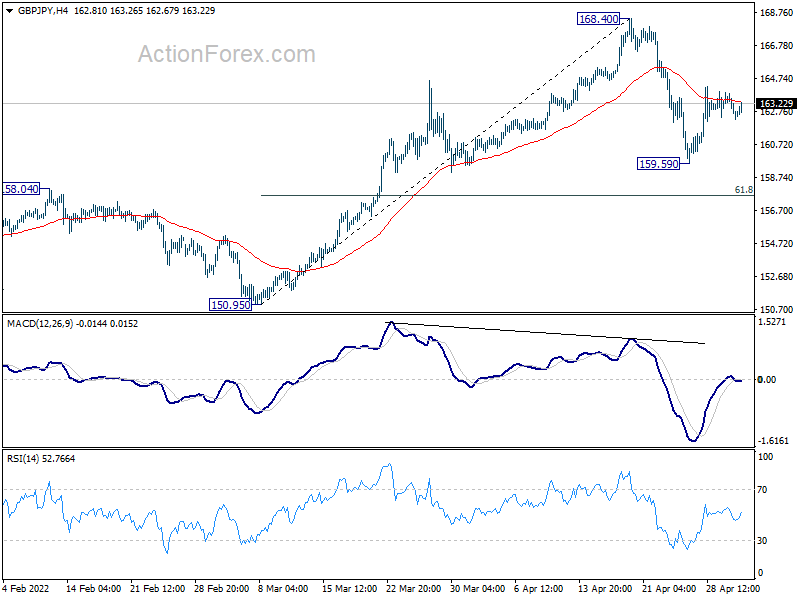
In the bigger picture, up trend from 123.94 (2020 low) is still in progress. Sustained break of 61.8% retracement of 195.86 (2015 high) to 122.75 (2016 low) at 167.93 will be a long term bullish signal, and could pave the way back to 195.86 high. This will now remain the favored case as long as 150.95 support holds, even in case of deep pull back.