Sample Category Title
Platinum Wave Analysis
- Platinum reversed from support zone
- Likely to rise to resistance level 960.00
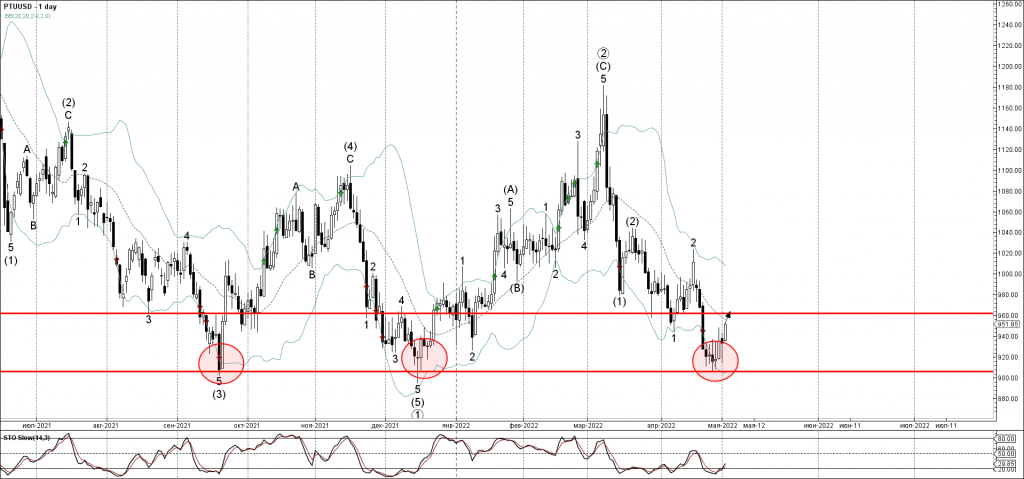
Platinum recently reversed up strongly from the powerful long-term support level 900.00 (which has been reversing the price from last September), standing near the lower daily Bollinger Band.
The upward reversal from support level 900.00 stopped the previous short-term impulse wave 3 of the higher impulse wave (3) from last month.
Given the strength of the nearby support level 900.00 – Platinum can be expected to rise further toward the next resistance level 960.00 (the former monthly low from March).
Sunset Market Commentary
Markets
Another dropout in the monetary policy ultimate survivor this morning. The Reserve Bank of Australia made a Swedish Riksbank-style sudden policy U-turn, leaving the ECB flanked by only the Swiss National Bank and the Bank of Japan. The RBA wrongfooted many both with the timing of the hike (ahead of Q1 wage growth and ahead of parliamentary elections) and with the size of the inaugural move (25 bps vs 10 bps outside chance discounted). European interest rate markets immediately added to their bets that the ECB will follow swiftly with a July rate hike. The EU 2y swap rate temporarily traded above the psychologic 1% mark for the first time since 2012. The German 10-yr yield crossed that same number for the first time since 2015. The 2015 top at 1.06% remained just out of reach. This time around, the sell-off didn’t last though. We’re probably too close to the FOMC meeting to add to directional bets from current levels. Core bonds recovered intraday losses and even eked out some gains as the European trading session evolved. The EMU unemployment rate declined from an upwardly revised 6.9% in February to 6.8% in March – an EMU record low – but didn’t impact trading. The German yield curve bull flattens at the time of writing with yields falling by 0.7 bps (2-yr) to 7.6 bps (30-yr). The US yield curve moves in similar fashion with yields 2.7 bps (2-yr) to 6.8 bps (20-yr) lower. The US 10-yr yield earlier on the day for a second straight session failed to take out the 3% mark. European stock market record small gains on a daily basis, but their performance remains unconvincing.
In FX space, the dollar’s multisession attempt to take out EUR/USD 1.05 failed again. It caused some rebound action north of 1.055, but the short term rebound high at 1.0593 remained out of reach. The trade-weighted dollar currently changes hands at 103.15 from an open at 103.60. Moves on FX markets probably fit in the general cautiousness ahead of tomorrow’s FOMC gathering. Rien ne va plus. EUR/GBP seemed trapped in a kind of similar paralysis ahead of Thursday’s Bank of England meeting with the pair hovering around the 0.84 big figure. EUR/GBP 0.8420 is currently on the charts. News Headlines
Hong Kong’s economy contracted by much more than expected in the first quarter of this year. GDP was down 2.9% q/q (-4% y/y) vs -0.9% (-1.3% y/y) expected. It’s the biggest setback since Q1 of 2020. The coronavirus is again responsible. Tough restrictions to beat down a fifth wave made domestic household spending collapse. These effects should ease going forward thanks to the accelerated reopening plans. Externally, moderating global demand growth and China’s zero-Covid strategy hampering trade flows from and to the mainland posed substantial drags to exports, a government spokesperson said. The person added that the global economic outlook is being challenged by central banks expediting monetary policy tightening. The HK dollar loses against most peers but the market reaction in USD/HKD is limited. This may be because the pair is stomping at the upper bound of the 7.80 +/- 0.05 peg lately. Losses beyond that level could trigger 2018-2019 style FX interventions by the Hong Kong Monetary Authority.
Italy’s PM Draghi called on the EU to address soaring energy costs and the economic impact of the Ukraine war the way it did with handling Covid, saying individual national budgets won’t make the cut. He argued for the SURE unemployment scheme to be extended in scope so that it eg. can be used to finance tax relief measures to support lower real wages. For long-term investments in areas such as defense, energy and food, NextGenEU offers inspiration.
DXY: Knocking on Heavens Door
When it comes to foreign exchange markets, it has been the US dollar that has reigned supreme. Last week, the US dollar index (DXY) capped of its fourth consecutive week of gains, rising by 2.10%. In level terms, the pair quickly breached the March 2020 high of 102.992 and had a brief dalliance at 103.928, just above the January 2017 high of 103.820, before closing at 103.212. This positive momentum has carried into this week as the index looks set to retest the 103.820 level and traders eye further upside.
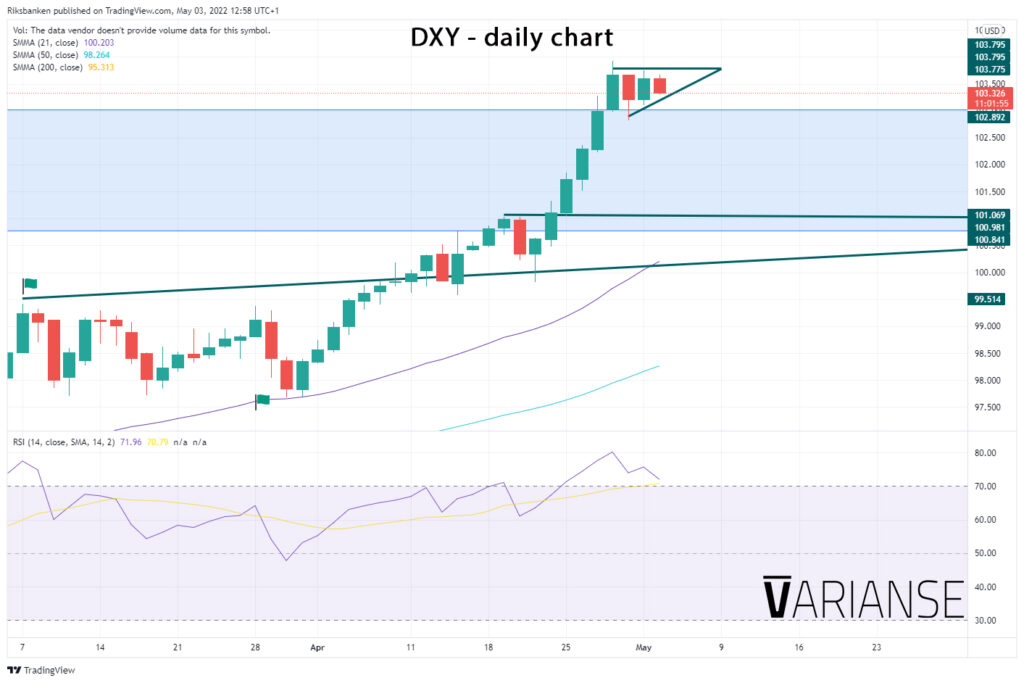
At the time of writing, daily price action has formed what could be construed as an ascending triangle pattern, which would suggest a continuation of the current uptrend. Furthermore, despite the daily RSI being above 70 – the level which traditionally demarcates overbought conditions – sings of divergence that would allude to a potential reversal are absent. A sustained break above 103.820, would leave every opportunity for the index to rise above the 105.40-60 region. The latter acted as prior support in 2020 and could easily prove areas of resistance.
That said, the 103.820 level remains a key area of resistance and the DXY’s rise over recent week has been aggressive. There is every risk the DXY could trade sideways within a big range from these levels. As a result, buyers may be tempted to wait for better levels before carrying the DXY higher. Based on prior congestion zones, 100 to 101, could be key buy zones if that does prove to be the case. Either way, it will likely take a break below 99.818 to really convince market participants that the DXY has shifted from its current uptrend into a downtrend.
Euro Rises, Fed Meeting Looms
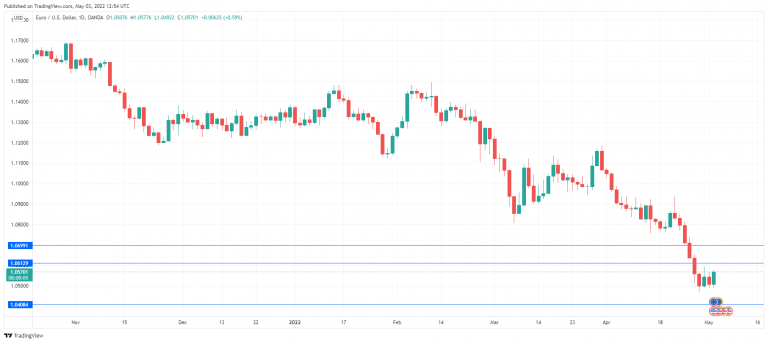
The euro is in positive territory on Wednesday. EUR/USD is trading at 1.0568 in the European session, up 0.57% on the day.
Fed likely to raise rates by half-point
All eyes are on the Fed, which is expected to raise rates by a half-point, which would be the largest rate hike in 20 years. Fed Chair Powell and other FOMC members have been telegraphing their newfound hawkishness to the markets and receive full marks for being transparent, assuming that there are no last-minute surprises. There have been calls for a massive 0.75% rate, which is unlikely. Still, the mere fact that such massive increases are being suggested indicates just how badly the Fed miscalculated inflation and has fallen behind on the inflation curve.
We are likely to see additional 0.50% hikes in upcoming meetings, as the Fed comes out swinging against inflation, which has become Public Enemy No. 1. This aggressive stance has boosted the US dollar against the major currencies, as Treasury yields continue to climb higher. However, there are growing concerns that sharp rises in rates will choke growth and result in a recession.
Equally as important as the rate hikes, the FOMC is expected to announce a reduction in bond holdings, and the pace of the balance sheet normalization will be closely watched. If the Fed delivers a larger cap on holdings than expected, this would be bullish for the US dollar.
The eurozone remains vulnerable to the war in Ukraine, and the manufacturing sector continues to struggle with supply chain disruptions and price pressures. German factories are reporting a loss of momentum due to weaker economic activity, and if the EU were to place an embargo on Russian oil, it would likely lead to a recession in Germany. Inflation has been soaring, which is weighing on growth in the bloc. Last week, the German government cut its growth forecast for 2022 to 2.2%, down sharply from 3.6% in a previous forecast.
With the ECB still stuck in accommodative mode while the Fed is getting ever more hawkish, the US/Europe rate differential is widening, which spells more trouble for the euro.
EUR/USD Technical
- There is resistance at 1.0612 and 1.0699
- 1.0408 is providing support, followed by 1.0321
USD/CHF Mid-Day Outlook
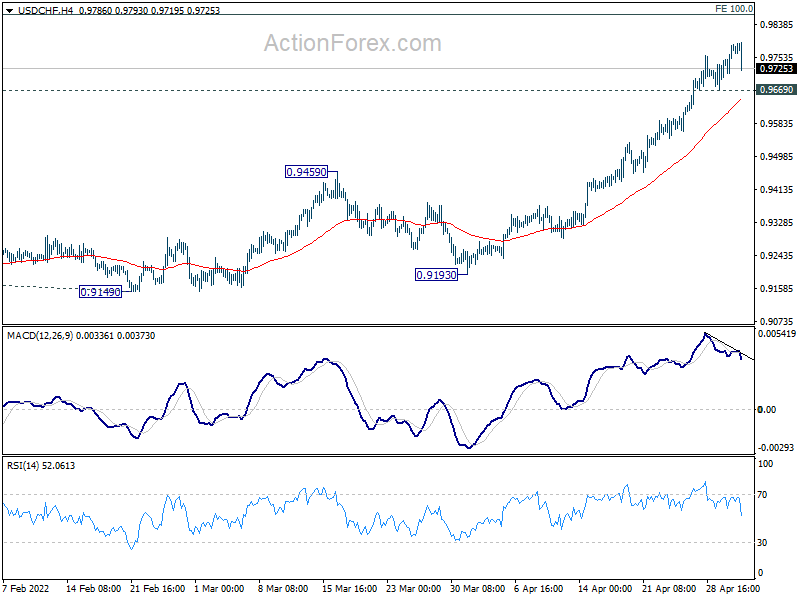
Daily Pivots: (S1) 0.9727; (P) 0.9758; (R1) 0.9807; More....
USD/CHF retreats notably today, but further rise is expected with 0.9669 minor support intact. Current rally should target next medium term projection level at 0.9864. On the downside, however, considering bearish divergence condition in 4 hour MACD, break of 0.9669 minor support should indicate short term bottoming, and turn bias back to the downside for deeper pull back.
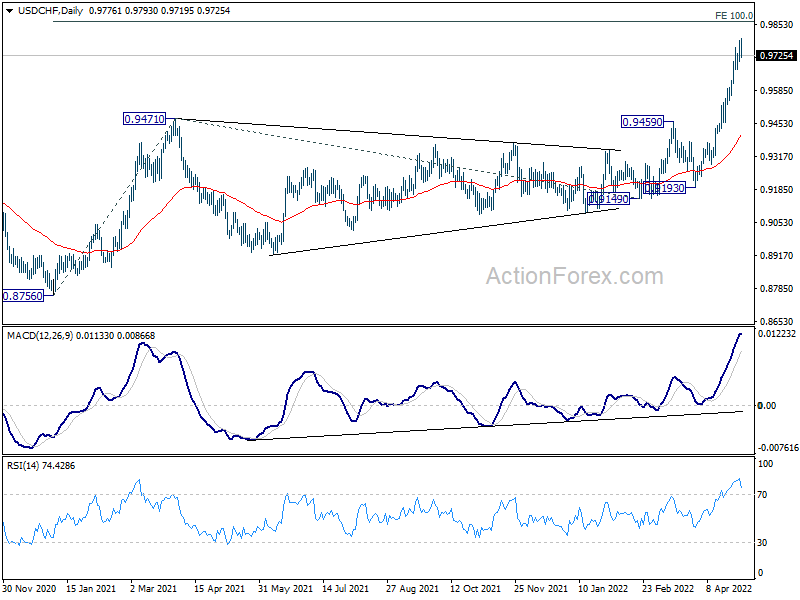
In the bigger picture, down trend from 1.0342 (2016 high) should have completed with three waves down to 0.8756 (2021 low) already. Rise from 0.8756 is likely a medium term up trend of its own. Next target is 100% projection of 0.8756 to 0.9471 from 0.9149 at 0.9864. This will now remain the favored case as long as 0.9459 resistance turned support holds.
USD/JPY Mid-Day Outlook
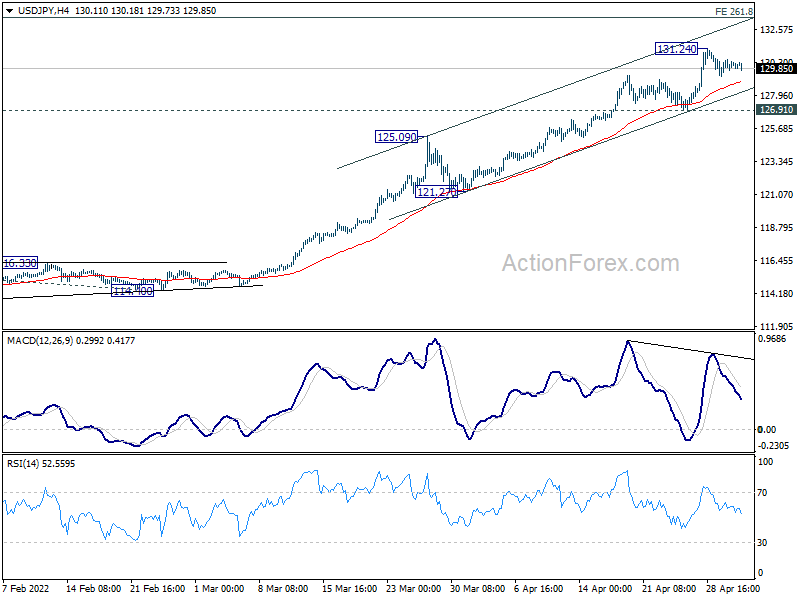
Daily Pivots: (S1) 129.71; (P) 130.09; (R1) 130.57; More...
USD/JPY is still bounded in consolidation from 131.24 and intraday bias remains neutral first. Near term outlook remains bullish with 126.91 support intact. Break of 131.24 will resume recent up trend to 261.8% projection of 109.11 to 116.34 from 114.40 at 133.26. However, considering bearish divergence condition in 4 hour MACD, break of 126.91 will confirm short term topping and turn bias back to the downside for a correction.
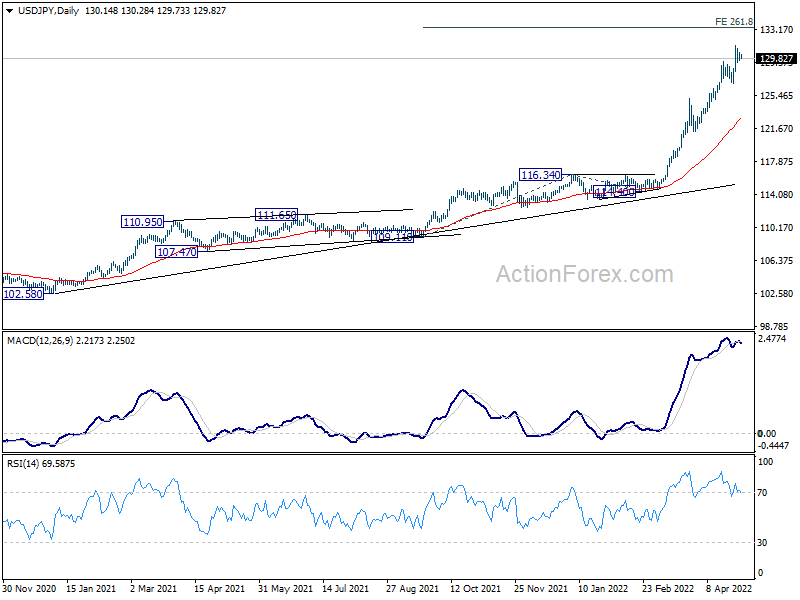
In the bigger picture, current rally is seen as part of the long term up trend form 75.56 (2011 low). Sustained trading above 61.8% projection of 75.56 (2011 low) to 125.85 (2015 high) from 98.97 at 130.04 will pave the way to 100% projection at 149.26, which is close to 147.68 (1998 high). For now, this will remain the favored case as long as 121.27 support holds.
GBP/USD Mid-Day Outlook
Daily Pivots: (S1) 1.2444; (P) 1.2521; (R1) 1.2568; More...
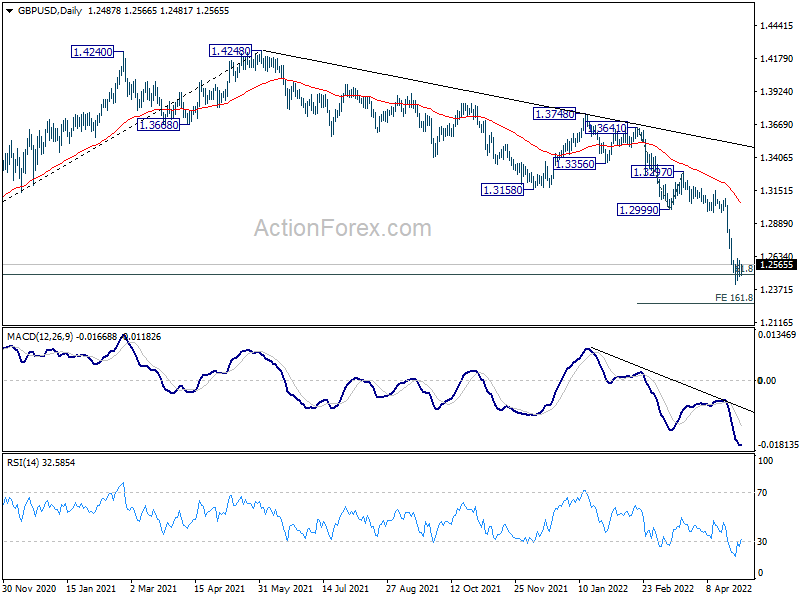
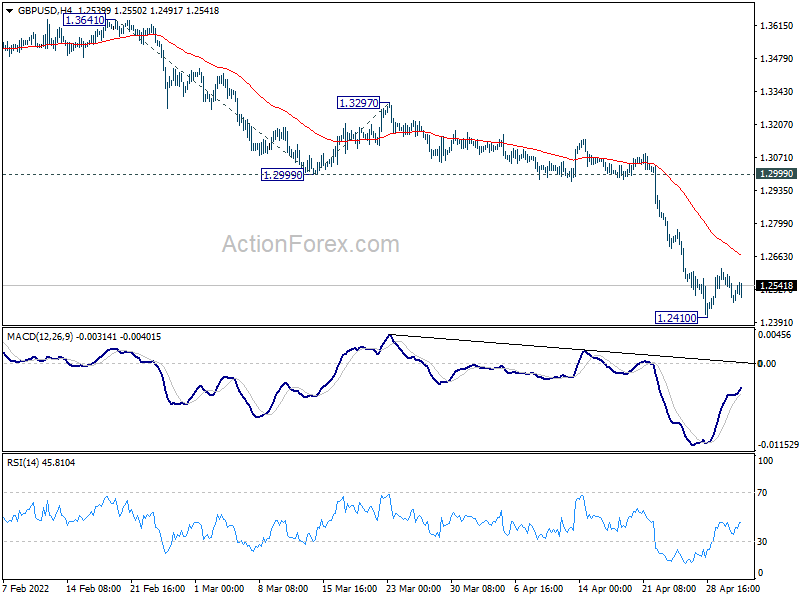
Intraday bias in GBP/USD remains neutral as it's still extending the consolidation from 1.2410. In case of stronger recovery, upside should be limited below 1.2999 support turned resistance. On the downside, break of 1.2410 will target 161.8% projection of 1.3641 to 1.2999 from 1.3297 at 1.2258.
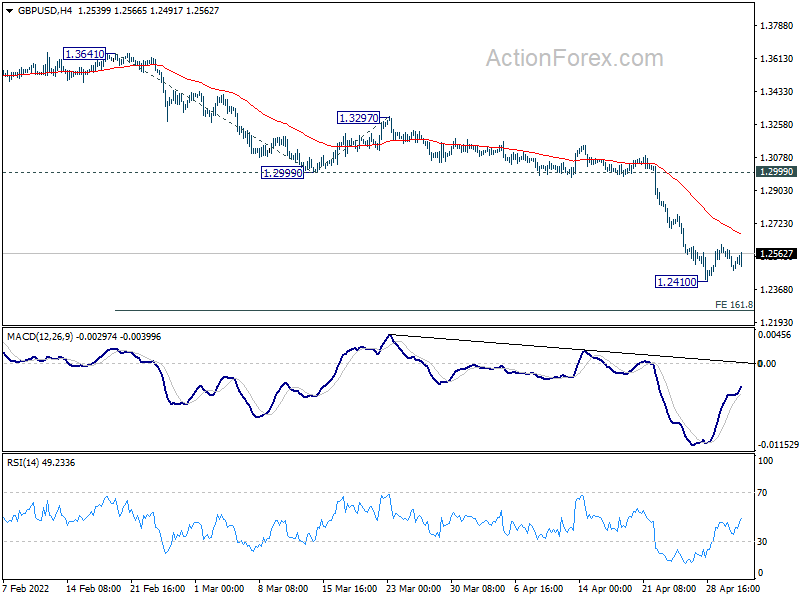
In the bigger picture, rise from 1.1409 (2020 low) has completed at 1.4248, ahead of 1.4376 long term resistance (2018 high). Based on current momentum, fall from 1.4248 is probably the start of a long term down trend. The break of 61.8% retracement of 2.1161 to 1.1409 at 1.2493 is affirming this bearish case too. For now, deeper decline would be seen as long as 1.3158 support turned resistance holds. Next target is 1.1409 low.
EUR/USD Mid-Day Outlook
Daily Pivots: (S1) 1.0476; (P) 1.0523 (R1) 1.0555; More...
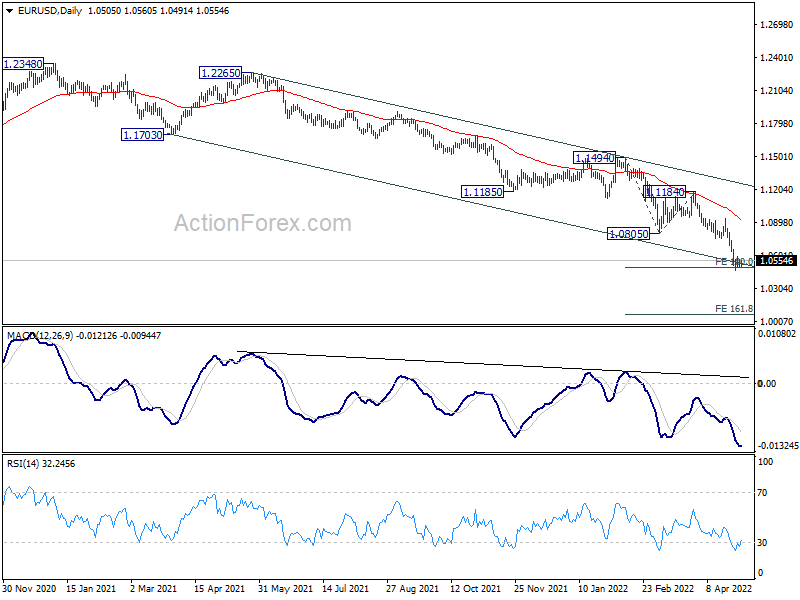
EUR/USD recovers mildly as consolidation from 1.0470 extends. But intraday bias remains neutral for the moment. Upside of recovery should be limited by 1.0756 support turned resistance to bring fall resumption. Break of 1.0470 will resume larger down trend and target 161.8% projection of 1.1494 to 1.0805 from 1.1184 at 1.0069.
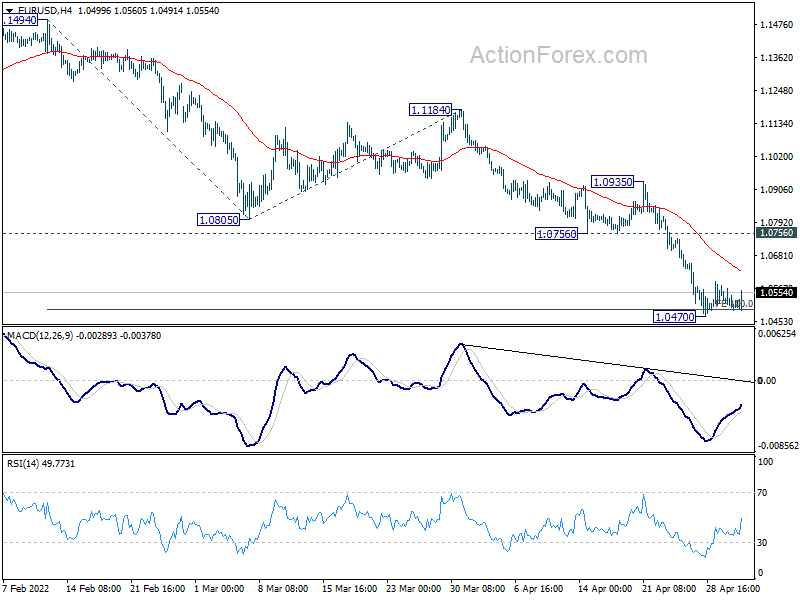
In the bigger picture, the decline from 1.2348 (2021 high) is expected to continue as long as 1.1185 support turned resistance holds. The break of 1.0635 (2020 low) now raises the chance that it's resuming long term down trend from 1.6039 (2008 high). Retest of 1.0339 (2017 low) low should be seen next. Decisive break there will confirm this bearish case.
Dollar Softer Slightly, European Majors Trying a Rebound
Dollar is turning softer entering into US session, as traders might start to lighten up position ahead tomorrow's FOMC rate decision. Commodity currencies are also soft, except Aussie which is supported by RBA's hawkish rate hike. Yet, there is no clear follow through buying in Aussie. European majors, on the other hand, are trying to rebound.
Technically, some focuses will be on whether European majors build on current recovery to develop more sustainable rebound. The levels to watch include 4 hours 55 EMA in EUR/USD at 1.0626, 4 hours 55 EMA in GBP/USD at 1.2667, and 4 hours 55 EMA in USD/CHF at 0.9646. Without breaking these level, the rebound in European majors wouldn't last long.
In Europe, at the time of writing, FTSE is down -0.48%. DAX is up 0.33%. CAC is up 0.41%. Germany 10-year yield is down -0.028 at 0.942. Earlier in Asia, Hong Kong HSI rose 0.06%. Singapore Strait Times rose 0.65%. Japan and China were on holiday.
Eurozone PPI rose 5.3% mom, 36.8% yoy in Mar
Eurozone PPI rose 5.3% mom, 36.8% yoy in March, above expectation of 4.9% mom, 36.3% yoy. For the month, industrial producer prices increased by 11.1% in the energy sector, by 2.8% for intermediate goods, by 2.4% for non-durable consumer goods and by 0.8% for capital goods and durable consumer goods. Prices in total industry excluding energy increased by 2.1%.
EU PPI rose 4.% mom, 36.5% yoy. The highest monthly increases in industrial producer prices were recorded in Ireland (+36.1%), Greece (+8.8%) and Portugal (+8.4%). The only decrease was observed in Slovakia (-1.1%) while in Malta the industrial producer prices remained unchanged.
Eurozone unemployment rate dropped to 6.8% in Mar, EU dropped to 6.2%
Eurozone unemployment rate dropped from 6.9% to 6.8% in March, matched expectations. EU unemployment rate dropped from 6.3% to 6.2%.
Eurostat estimates that 13.374m men and women in EU, of whom 11.274m in Eurozone, were unemployed. Compared with February, the number of persons unemployed decreased by -85k in EU and by -76k in Eurozone.
UK PMI manufacturing finalized at 55.8, failed to mask the continued headwinds
UK PMI Manufacturing was finalized at 55.8 in April, up slightly from march's 55.2. S&P Global said production growth improved slightly. New orders rose at slower pace as new export business retreated. Selling prices rose at record pace as cost inflation accelerated.
Rob Dobson, Director at S&P Global, said: "The improved expansion of output at manufacturers, while positive in itself, failed to mask the continued headwinds buffeting the sector... Manufacturers and their clients are struggling as lockdowns in China and the Ukraine war exacerbate stretched global supply chains, the inflationary picture worsens and geopolitical tensions rise. Specific to the UK, Brexit represents an additional headwind...
"Business optimism has fallen to a 16-month low as companies become more cautious about the future outlook... The inflationary situation is getting increasingly fraught. Input costs rose to the second-greatest extent in the 30-year survey history, leading to a record increase in factory gate selling prices."
RBA hikes by 25bps to 0.35%, more to come
RBA raises cash rate target by 25bps to 0.35% today, larger than expectation of 15bps to 0.25%. The interest rate on Exchange Settlement balances is also lifted by 25bps to 0.25%. In the forward guidance, RBA said it's committed to "ensure that inflation in Australia returns to target over time". That will "require a further lift in interest rates over the period ahead".
In the accompanying statement, RBA said the economy has "proven to be resilient and inflation has picked up more quickly, and to a higher level, than was expected" while "wages growth is picking up". It's appropriate to start the process of normalizing monetary conditions."
Unemployment rate is expected to decline to around 3.5% by early 2023, hitting the lowest level in almost 50 years. GDP is projected to grow by 4.25% over 2022 and 2% over 2023. Headline expected to rise further from current 5.1% to 5% this year. Underlying inflation is also expected to rise from current 3.7% to 4.75%. By mid-2024, headlines and underlying inflation are projected to have moderated back to around 3%, with assumption of further rate hikes.
EUR/USD Mid-Day Outlook
Daily Pivots: (S1) 1.0476; (P) 1.0523 (R1) 1.0555; More...
EUR/USD recovers mildly as consolidation from 1.0470 extends. But intraday bias remains neutral for the moment. Upside of recovery should be limited by 1.0756 support turned resistance to bring fall resumption. Break of 1.0470 will resume larger down trend and target 161.8% projection of 1.1494 to 1.0805 from 1.1184 at 1.0069.
In the bigger picture, the decline from 1.2348 (2021 high) is expected to continue as long as 1.1185 support turned resistance holds. The break of 1.0635 (2020 low) now raises the chance that it's resuming long term down trend from 1.6039 (2008 high). Retest of 1.0339 (2017 low) low should be seen next. Decisive break there will confirm this bearish case.
Economic Indicators Update
| GMT | Ccy | Events | Actual | Forecast | Previous | Revised |
|---|---|---|---|---|---|---|
| 22:45 | NZD | Building Permits M/M Mar | 5.80% | 10.50% | 12.20% | |
| 04:30 | AUD | RBA Interest Rate Decision | 0.35% | 0.25% | 0.10% | |
| 07:55 | EUR | Germany Unemployment Change Apr | -13K | -15K | -18K | |
| 07:55 | EUR | Germany Unemployment Rate Apr | 5.00% | 5.00% | 5.00% | |
| 08:30 | GBP | Manufacturing PMI Apr F | 55.8 | 55.3 | 55.3 | |
| 09:00 | EUR | Eurozone Unemployment Rate Mar | 6.80% | 6.80% | 6.80% | 6.90% |
| 09:00 | EUR | Eurozone PPI M/M Mar | 5.30% | 4.90% | 1.10% | |
| 09:00 | EUR | Eurozone PPI Y/Y Mar | 36.80% | 36.30% | 31.40% | 31.50% |
| 14:00 | USD | Factory Orders M/M Mar | 1.20% | -0.50% |
AUDUSD Around 0.7100 Mark But Bearish Risks Linger
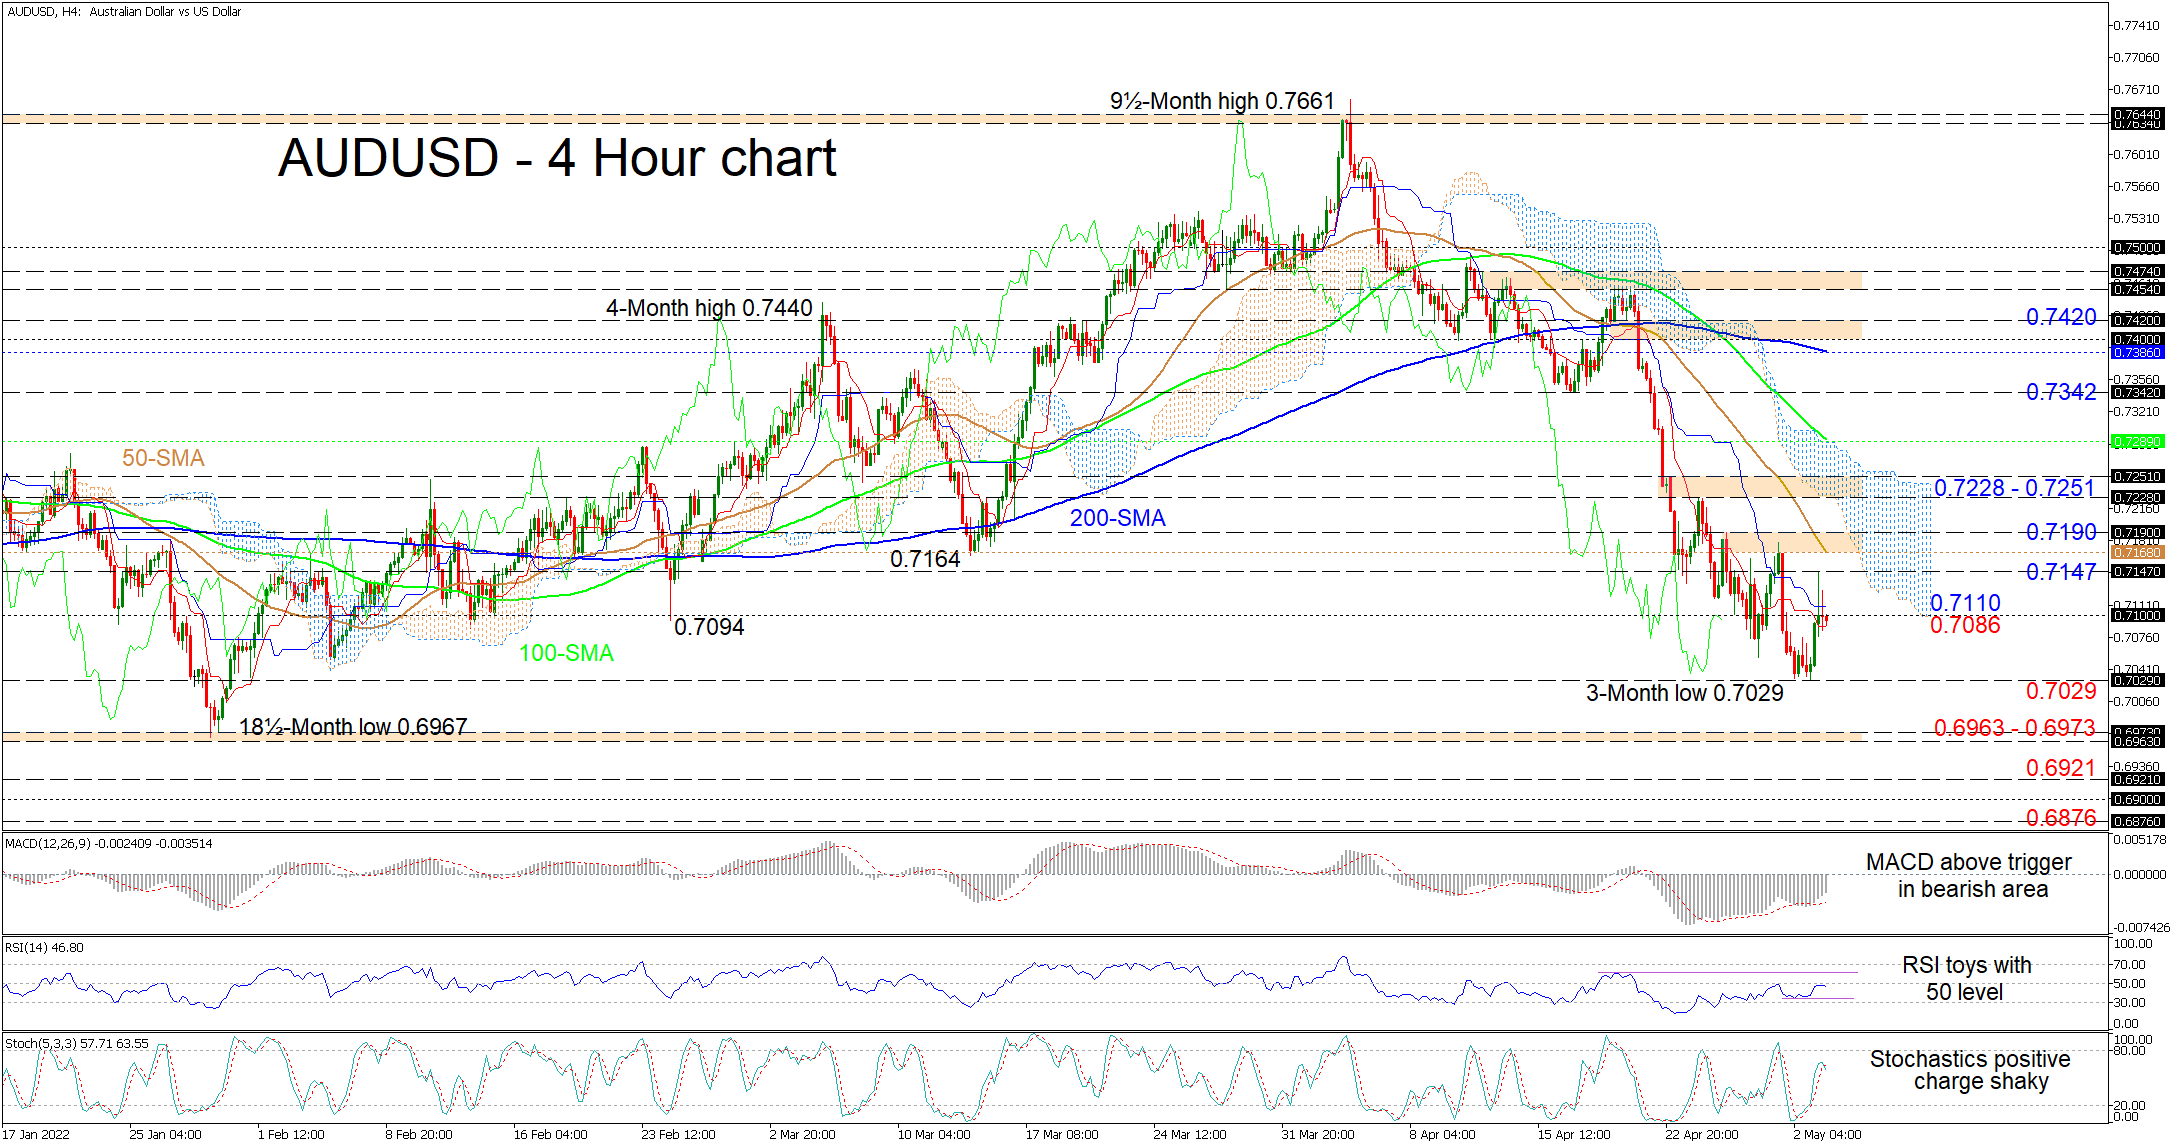
AUDUSD has snagged around the 0.7100 handle, trading in between the Ichimoku lines, after the pair’s fresh bounce in the vicinity of three-month lows at 0.7029. The pair is finding difficulty to reach yesterday’s intraday high of 0.7147 despite the Reserve Bank of Australia’s larger interest rate hike earlier today, which kept the pair bid in the Asian session. That said, the bearish simple moving averages (SMAs) are endorsing the negative trajectory in the pair.
Currently, the Ichimoku lines indicate a pause in the negative forces, while the short-term oscillators are painting a conflicting picture in directional momentum. The MACD is strengthening over its red trigger line in the negative region, while the stochastic %K line has dipped back below the %D line, promoting growing downward momentum. Meanwhile, after a retest of the 50 level, the now neutral RSI is struggling to push clearly into the bullish zone.
If the 0.7100 hurdle obstructs gains in the pair and sellers steer the price visibly underneath the red Tenkan-sen line at 0.7086, the door could then open for a retest of the three-month trough of 0.7029. If the downward bearing is rekindled, the bears may target the 0.6963-0.6973 support band, formed by the mid-July 2020 lows and the January 28 trough. Should the descent endure, the price could seek out the key 0.6921 support base, shaped by multiple lows over the first half of July 2020. From here, a deeper move could then encounter downside friction within the 0.6900 and the 0.6876 support barriers.
Otherwise, if buyers re-emerge and drive the pair past the blue Kijun-sen line at 0.7110, they could then meet initial resistance at 0.7147. The path higher is paved with congested obstacles, starting with a resistance area linking the descending 50-period SMA at 0.7168 with the 0.7190 high, coinciding with the Ichimoku cloud’s lower band. Climbing further, the bulls may then face the 0.7228-0.7251 resistance band. Overstepping the cloud and approaching 100-period SMA, currently at 0.7289, buyers could aim for the 0.7342 border before attempting to challenge the 200-period SMA.
Summarizing, AUDUSD is sustaining a bearish bias beneath the falling SMAs and the 0.7190 high. That said, a climb in the price above the 0.7228-0.7251 resistance barrier could likely feed positive prospects.