Sample Category Title
EUR/USD Mid-Day Outlook
Daily Pivots: (S1) 1.0804; (P) 1.0835 (R1) 1.0887; More...
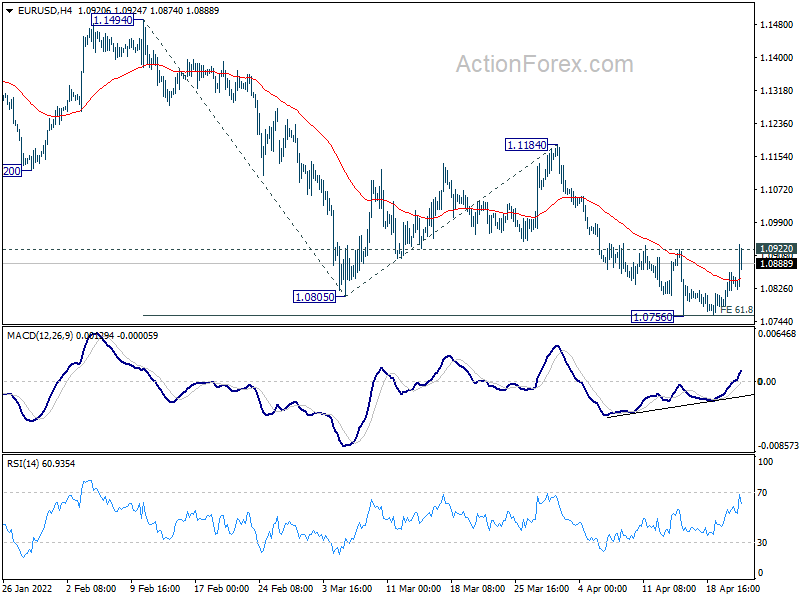
EUR/USD breached 1.0922 earlier today but quickly retreated. Intraday bias remains neutral for the moment. On the upside, firm break of 1.0922 should confirm short term bottoming at 1.0756. Intraday bias will be back on the upside for 1.1184 structural resistance next. On the downside, though, break of 1.0756 will resume larger down trend.
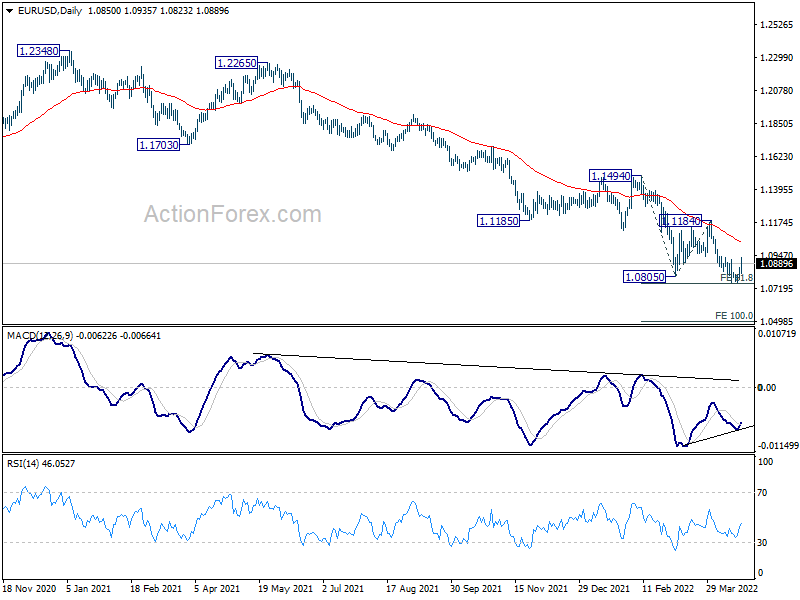
In the bigger picture, the decline from 1.2348 (2021 high) is expected to continue as long as 1.1494 resistance holds. Firm break of 1.0635 (2020 low) will raise the chance of long term down trend resumption and target a retest on 1.0339 (2017 low) next. Nevertheless, break of 1.1494 will maintain medium term neutral outlook, and extending term range trading first.
Euro Rebounds as Some ECB Members Talk Up July Rate Hike
Euro rebounds strongly today as some ECB policymakers continued to talk up the chance of a July rate hike. Canadian Dollar is following as second strongest, continuing to be supported by strong inflation data. Dollar is not performing too badly for now, as third strongest. On the other hand, New Zealand Dollar remains under pressured after CPI missed expectation. Yen is staying in consolidations in general despite decline attempt against some rivals. Sterling and Swiss Franc are mixed, with Aussie.
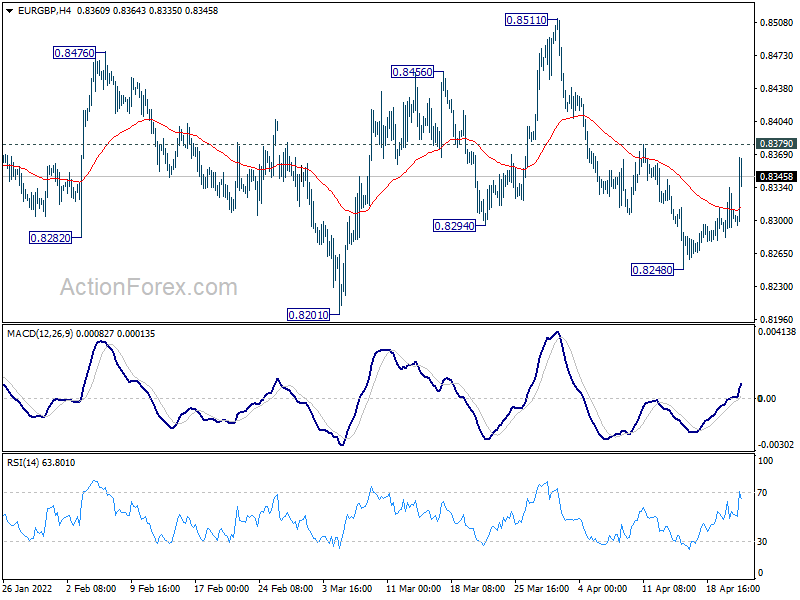
Technically, EUR/USD breached 1.0922 minor resistance but lacks follow through buying. Firm break of this level should confirm short term bottoming and bring stronger rebound back towards 1.1184 resistance. Similarly, firm break of 0.8379 minor resistance in EUR/GBP would bring further rebound back to 0.8511 structural resistance. Developments in these two pairs will be watched to gauge the underlying strength in Euro.
In Europe, at the time of writing, FTSE is up 0.32%. DAX is up 1.41%. CAC is up 1.88%. Germany 10-year yield is up 0.0197 at 0.875. Earlier in Asia, Nikkei rose 1.23%. Hong Kong HSI dropped -1.25%. China Shanghai SSE dropped -2.26%. Singapore Strait times rose 0.39%. Japan 10-year JGB yield dropped -0.0004 to 0.255.
US initial jobless claims dropped to 184k
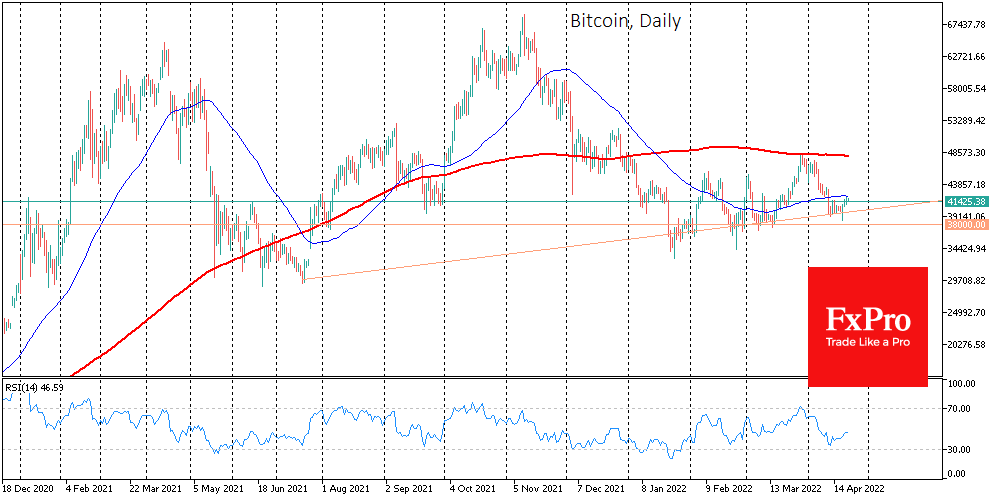
US initial jobless claims dropped -2k to 184k in the week ending April 16, above expectation of 177k. Four-week moving average of initial claims rose 4.5k to 177k.
Continuing claims dropped -58k to 1417k in the week ending April 9, lowest since February 21, 1970. Four-week moving average of continuing claims dropped -31k to 1482k, lowest since March 21, 1970.
Also released, Philly Fed manufacturing survey dropped from 27.4 to 20.9 in April, below expectation of 20.9.
ECB Lagarde reiterates optionality, gradualism and flexibility in monetary policy
ECB President Christine Lagarde said in a speech, the impact of the factors driving up inflation currently "should fade over time". But for the near term, "inflationary risks are tilted to the upside". Over the medium-term, " risks to the inflation outlook could arise if wages rise by more than anticipated, longer-term inflation expectations move above target or supply conditions durably worsen".
But so far, "wage growth has remained muted – despite a strong labour market – and inflation expectations in the euro area stand around our target".
On monetary policy, Lagarde said it will "depend on the incoming data and our evolving assessment of the outlook". ECB would maintain "optionality, gradualism and flexibility" in the conduct of monetary policy.
ECB de Guindos: July is possible for first hike
ECB Vice President Luis de Guindos said in an interview, the consequences of invasion of Ukraine are "quite clear", as higher inflation and lower growth. That should be reflected in in June outlook.
He sees "no reason why we should not discontinue our APP programme in July". But the timing for the first rate hike will depend on the economic projections. "Nothing has been decided so far," he said.
"From today's perspective, July is possible and September, or later, is also possible. We will look at the data and only then decide," he added. Then, the rate hike cycle will "depend on the data" and the "evolution of inflation.
ECB Wunsch: July rate hike is a scenario to consider
ECB Governing Council member Pierre Wunsch said, "without any really bad news coming from that front, hiking by the end of this year to zero or slightly positive territory for me would be a no brainer."
Also, Wunsch doesn't rule out ending the asset purchases in June, and raise interest rate in July. "It's going to of course depend on data," he said. "If we have another inflation surprise, it's certainly a scenario that I would consider."
"There are of course situations where if the shock is very big on the real economy, we would feel more comfortable looking through the inflation development," he said. But "we're still in a situation where we're supportive in terms of monetary policy. Real rates are today very, very negative. So the beginning of the normalization process should be relatively independent of the real economy."
"We're still talking about normalization, but I wouldn't exclude that at some point, if we have second-round effects, wages going up, that monetary policy would have to become restrictive," he said. "What's priced in by the markets today to me is on the low side of what might be required to get inflation under control."
Eurozone CPI finalized at 7.4% yoy in Mar, EU at 7.8% yoy
Eurozone CPI was finalized at 7.4% yoy in March, up from February's 5.9% yoy. The highest contribution to the annual euro area inflation rate came from energy (+4.36%), followed by services (+1.12%), food, alcohol & tobacco (+1.07%) and non-energy industrial goods (+0.90%).
EU CPI was finalized at 7.8% yoy, up from February's 6.2% yoy. The lowest annual rates were registered in Malta (4.5%), France (5.1%) and Portugal (5.5%). The highest annual rates were recorded in Lithuania (15.6%), Estonia (14.8%) and Czechia (11.9%). Compared with February, annual inflation fell in two Member States and rose in twenty-five.
NZ CPI rose to 6.9% yoy in Q1, highest since 1990
New Zealand CPI rose 1.8% qoq in Q1, below expectation of 2.0% qoq. For the 12-month period, CPI accelerated from 5.9% yoy to 6.9% yoy, below expectation of 7.1% yoy. That's nonetheless still the highest annual rate since June 1990 quarter.
StatsNZ said: "The main driver for the 6.9 percent annual inflation to the March 2022 quarter was the housing and household utilities group, influenced by rising prices for construction and rentals for housing."
"Construction firms have been experiencing many supply-chain issues, higher labour costs, and also higher demand, which have pushed up the cost of building a new house," senior prices manager Aaron Beck said.
EUR/USD Mid-Day Outlook
Daily Pivots: (S1) 1.0804; (P) 1.0835 (R1) 1.0887; More...
EUR/USD breached 1.0922 earlier today but quickly retreated. Intraday bias remains neutral for the moment. On the upside, firm break of 1.0922 should confirm short term bottoming at 1.0756. Intraday bias will be back on the upside for 1.1184 structural resistance next. On the downside, though, break of 1.0756 will resume larger down trend.
In the bigger picture, the decline from 1.2348 (2021 high) is expected to continue as long as 1.1494 resistance holds. Firm break of 1.0635 (2020 low) will raise the chance of long term down trend resumption and target a retest on 1.0339 (2017 low) next. Nevertheless, break of 1.1494 will maintain medium term neutral outlook, and extending term range trading first.
Economic Indicators Update
| GMT | Ccy | Events | Actual | Forecast | Previous | Revised |
|---|---|---|---|---|---|---|
| 22:45 | NZD | CPI Q/Q Q1 | 1.80% | 2.00% | 1.40% | |
| 22:45 | NZD | CPI Y/Y Q1 | 6.90% | 7.10% | 5.90% | |
| 09:00 | EUR | Eurozone CPI Y/Y Mar F | 7.40% | 7.50% | 7.50% | |
| 09:00 | EUR | Eurozone CPI Core Y/Y Mar F | 2.90% | 3.00% | 3.00% | |
| 12:30 | USD | Initial Jobless Claims (Apr 15) | 184K | 177K | 185K | 186K |
| 12:30 | USD | Philadelphia Fed Manufacturing Survey Apr | 17.6 | 20.9 | 27.4 | |
| 14:00 | EUR | Eurozone Consumer Confidence Apr P | -20 | -19 | ||
| 14:30 | USD | Natural Gas Storage | 40B | 15B |
US initial jobless claims dropped to 184k
US initial jobless claims dropped -2k to 184k in the week ending April 16, above expectation of 177k. Four-week moving average of initial claims rose 4.5k to 177k.
Continuing claims dropped -58k to 1417k in the week ending April 9, lowest since February 21, 1970. Four-week moving average of continuing claims dropped -31k to 1482k, lowest since March 21, 1970.
Canadian Dollar Eyes Retail Sales
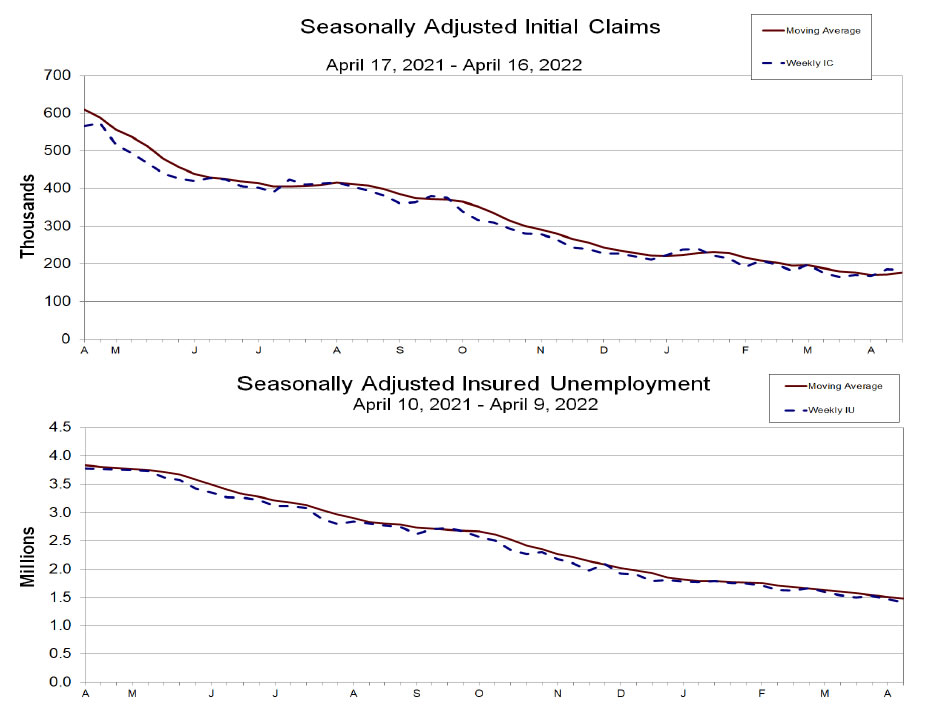
The Canadian dollar is unchanged in the European session, as USD/CAD trades at 1.2491. It was a banner day for the currency on Wednesday, as USD/CAD plunged 0.94%, its sharpest one-day loss since August 2021. The Canadian dollar took advantage of broad US dollar weakness as well as the Canadian CPI report.
Higher oil prices are also providing a boost to the Canadian dollar. There is a shortage in US oil inventories and tight supplies due to cutbacks in Russia and Libya. Oil has pushed above the USD 100 level, despite growth concerns in China, and the outlook for oil remains bright.
Hot inflation report puts pressure on BoC
Canada’s inflation levels continue to accelerate and show no sign of easing. In March, CPI jumped 6.7% YoY, higher than the 5.7% gain in February and above the consensus of 6.1%. Inflation is widespread throughout the economy, and the BoC is under pressure to get things under control, with CPI at a 30-year high.
The BoC is fortunate in that the ingredients are right for a strong dose of rate hikes to rein in inflation. The labour market is robust and the economy is showing solid growth. This means that the economy will be able to withstand a series of rate hikes, although the central bank will face the challenge of making sure it’s a soft landing for the economy. The BoC holds its next meeting in June, and a second straight hike of 0.50% is a strong possibility, barring any unexpected weak numbers or a sudden drop in inflation.
The BoC appears to be in sync with the Federal Reserve, as the BoC’s rate-tightening cycle could see rates rise as high as 3% by the end of the year. This should help the Canadian dollar keep pace as the Fed continues its own rate-hike cycle.
USD/CAD Technical
- USD/CAD has support at 1.2451 and 1.2379
- There is resistance at 1.2533 and 1.2605
ECB Lagarde reiterates optionality, gradualism and flexibility in monetary policy
ECB President Christine Lagarde said in a speech, the impact of the factors driving up inflation currently "should fade over time". But for the near term, "inflationary risks are tilted to the upside". Over the medium-term, " risks to the inflation outlook could arise if wages rise by more than anticipated, longer-term inflation expectations move above target or supply conditions durably worsen".
But so far, "wage growth has remained muted – despite a strong labour market – and inflation expectations in the euro area stand around our target".
On monetary policy, Lagarde said it will "depend on the incoming data and our evolving assessment of the outlook". ECB would maintain "optionality, gradualism and flexibility" in the conduct of monetary policy.
Euro Breaks above 1.09 as CPI Surges
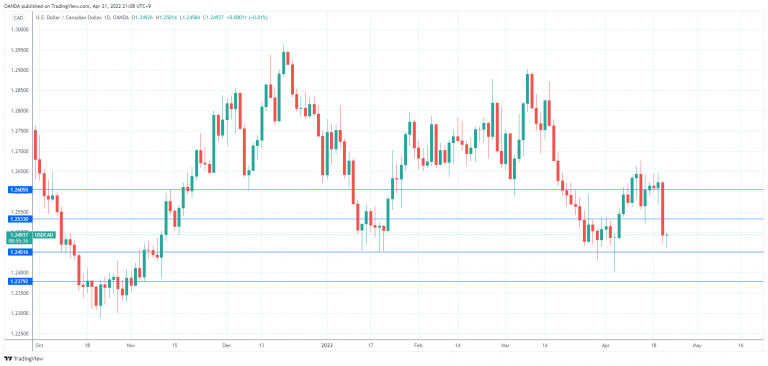
The euro has posted considerable gains on Thursday. In the European session, EUR/USD is trading at 1.0906, up 0.47% on the day.
Eurozone CPI hits 7.4%
The euro has rebounded nicely as it trades at the 1.09 line. Less than a week ago, EUR/USD broke below a major support line at 1.0800, raising concerns that the currency could continue to fall. Investors have reacted favourably to the March inflation report, which showed a gain of 7.4% YoY (5.9% prior). Inflation has skyrocketed in the eurozone in recent months – in March 2021, the inflation rate was a measly 1.3%.
Despite the sharp rise in inflation, the ECB has adhered to a dovish monetary policy. ECB President Lagarde disappointed the markets when she sidestepped providing any meaningful guidance at the April meeting, which sent the euro lower. Still, there are reports that the ECB is moving in the direction of raising rates in the third quarter of 2022, most likely by 0.25%. On Wednesday, hawkish comments by an ECB member pushed the euro higher. Martins Kazaks, head of the Latvia central bank said that a rate increase was possible in July, adding that he would not challenge market pricing, which has forecast that the ECB’s deposit rate of 0.50% will rise to zero, with a 0.25% increase in September and December.
Talk of one or more rate hikes later this year is bullish for the euro, but there are headwinds that could impede any upward movement. The main obstacle is the war in Ukraine and the issue of sanctions against Russia. As the war continues, there is more pressure on Western Europe to tighten sanctions, but moves such as an embargo on Russian oil will hurt the eurozone economies, which are largely dependent on Russian energy.
EUR/USD Technical
- There is resistance at 1.0923 and 1.1008
- 1.0790 is a weak support level. Below, there is support at 1.0705
Bitcoin’s Struggle to Break Away from Support
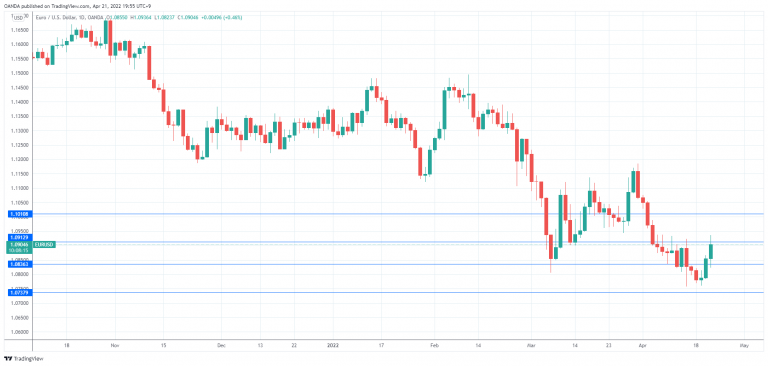
Bitcoin added 0.3% on Wednesday, ending the day around $41,400, and is adding another 0.6% since Thursday morning to $41,630. Ethereum has gained 0.2% in the past 24 hours, while other top 10 altcoins have shown mixed dynamics, ranging from a 1.7% decline (XRP) to a 3.6% gain (Polkadot).
Total crypto market capitalisation, according to CoinMarketCap, rose 0.4% overnight to $1.92 trillion. Bitcoin’s dominance index added 0.1 p. p. to 41.1%.
The cryptocurrency Fear & Greed Index is now in its third day, staying at 27 points (fear), but we see a slight upward movement in the market.
In the crypto market, as in the high-tech Nasdaq, we can call it cautious demand from buyers of the deep, but this support is not turning into a rally. The strong correlation between the tech sector and bitcoin is holding the latter back.
That said, the very fact that bitcoin has managed to lock in an uptrend and attempts to push back from that support is setting up positives for the coming days.
Bitcoin’s uptrend of the last four months can be extended to the left, and then it appears to be close to the July 2021 low, which was then near 30k. If we are right, bitcoin, and subsequently the entire crypto market, are saved from falling into a crypto winter by long-term buyers who find the current levels quite attractive.
Glassnode does not rule out that bitcoin has already formed its “bottom”, although it cannot yet break out of its range formed since February. The process of redistributing coins from speculative investors to “hodlers” is likely already complete, which will reduce selling pressure going forward.
According to BitInfoCharts, the world’s third-largest bitcoin whale has acquired 2,822 BTC worth $117 million in the past seven days. In 2022, 3.6 million Americans will use cryptocurrency to make purchases, a report by research firm Insider Intelligence predicts. The number of cryptocurrency users in the US is expected to rise to 33.7 million by the end of this year.
Oil Clinging to the Uptrend on Low Supply
Oil gained 1.5% on Thursday morning to $103.75 per barrel for WTI and $108.2 for Brent, continuing to cling to the uptrend since December. Over the past six weeks, oil price movements are no longer unidirectional, but the market remains in ‘crisis mode’. In April, oil is supported on the declines towards the 50-day moving average, as we saw yesterday.
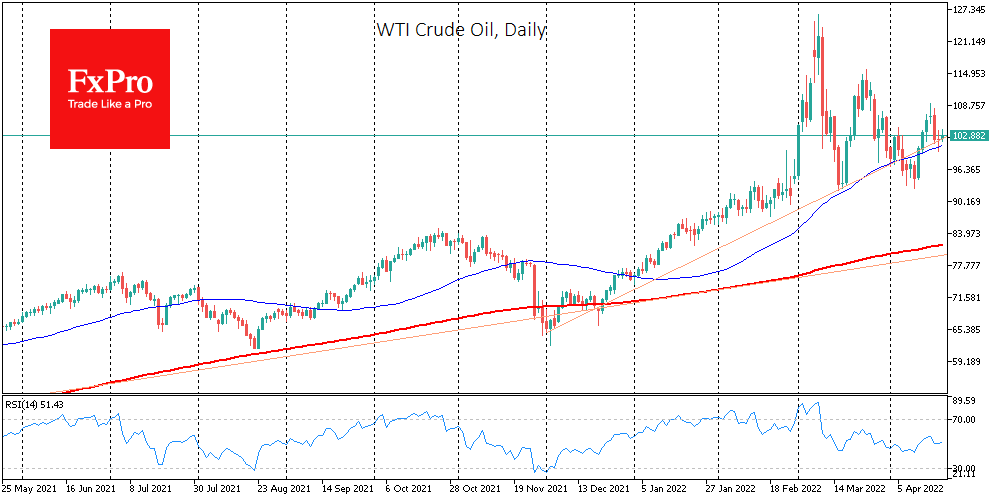
The uptrend is not only supported by the abrupt withdrawal of oil from Russia and the accompanying decline in production there. There are also shipment problems in Libya and prolonged pipeline repairs in Kazakhstan.
Oil producers in the US seem to be stepping up. Last week saw production increase to 11.9M barrels per day – a new high since May 2020 – from 11.8M.
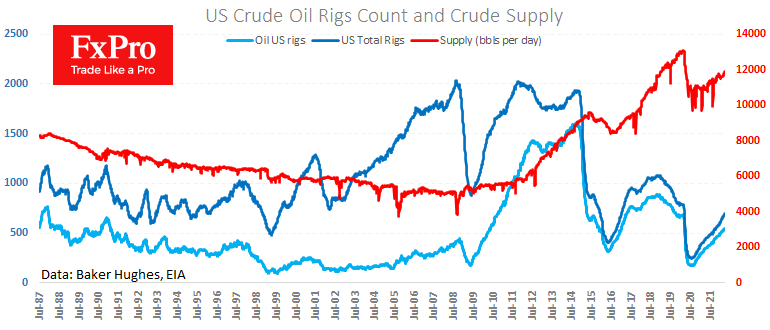
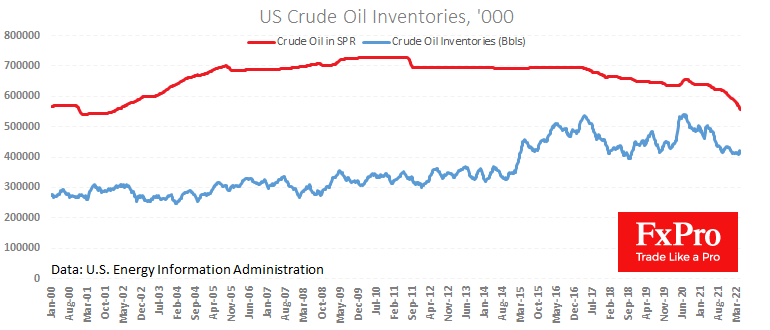
Meanwhile, US oil stocks and production data remain volatile. Commercial inventories collapsed by 8M barrels after jumping by 9.4M last week. Such fluctuations could prove to be a manifestation of the supply shifting to Europe.
Strategic stocks showed a net decline of 4.7M after 3.9m the previous week. The volume of oil in strategic storage fell to the lows in the last 20 years. However, it is not yet enough to turn around commercial inventories.
Oil supply constraints continue to put together a relatively bullish picture for oil, preventing a price reversal to the downside. A real bearish victory requires either a sharp increase in production in the US or OPEC countries or a dramatic fall in demand. We see no clear signals for either direction.
Another potential area of pressure on the oil price – a strengthening dollar – is also failing for the second day in a row, temporarily working on the bulls’ side.
New Zealand Dollar Edges Lower after CPI
New Zealand rises to 6.9%
There was plenty of anticipation ahead of the New Zealand inflation report, which is released each quarter. The consensus was a sharp rise of 7.1% YoY in Q4, compared to the Q3 reading of 5.9%. To the relief of investors, the actual reading was a bit less than expected, at 6.9%, and the New Zealand dollar’s response has been muted. Still, this gain is the fastest pace in 32 years, which means that soaring inflation remains a headache for consumers, businesses and the RBNZ, which is tasked with containing inflation.
In fairness, high inflation is a worldwide problem. The RBNZ can’t be faulted for being aggressive, as it delivered a super-size rate hike of 0.50% last week. The central bank can, however, be criticized for falling behind the inflation curve, and investors voiced their displeasure with the RBNZ’s rate policy when they sent the New Zealand dollar sharply lower after the rate hike. Clearly, Governor Orr has some work to do in order to regain the confidence of the markets, otherwise, NZD/USD could continue to lose ground.
Clear guidance is critical, and earlier this week Orr was crystal clear, saying that further rate rises were planned in the coming quarters. The RBNZ is concerned that rising inflation manifests into long-term inflation expectations and is hoping that additional tightening will dampen inflationary pressures, which have been felt throughout the economy.
NZD/USD enjoyed a spectacular session yesterday, which was more about US dollar weakness than the strength of the New Zealand dollar. Markets were in a profit-taking mood, as US Treasury bonds gave up some ground after the sharp gains we’ve seen recently. This resulted in broad US weakness, with NZD/USD posting a sparkling 1.13% gain.
NZD/USD Technical
- There is resistance at 0.6856 and 0.6953
- NZD/USD is putting pressure on 0.6774, a monthly support line. Next, there is support at 0.6709
AUDUSD Bullish Bearing Intact with Bounce Off 50-day SMA
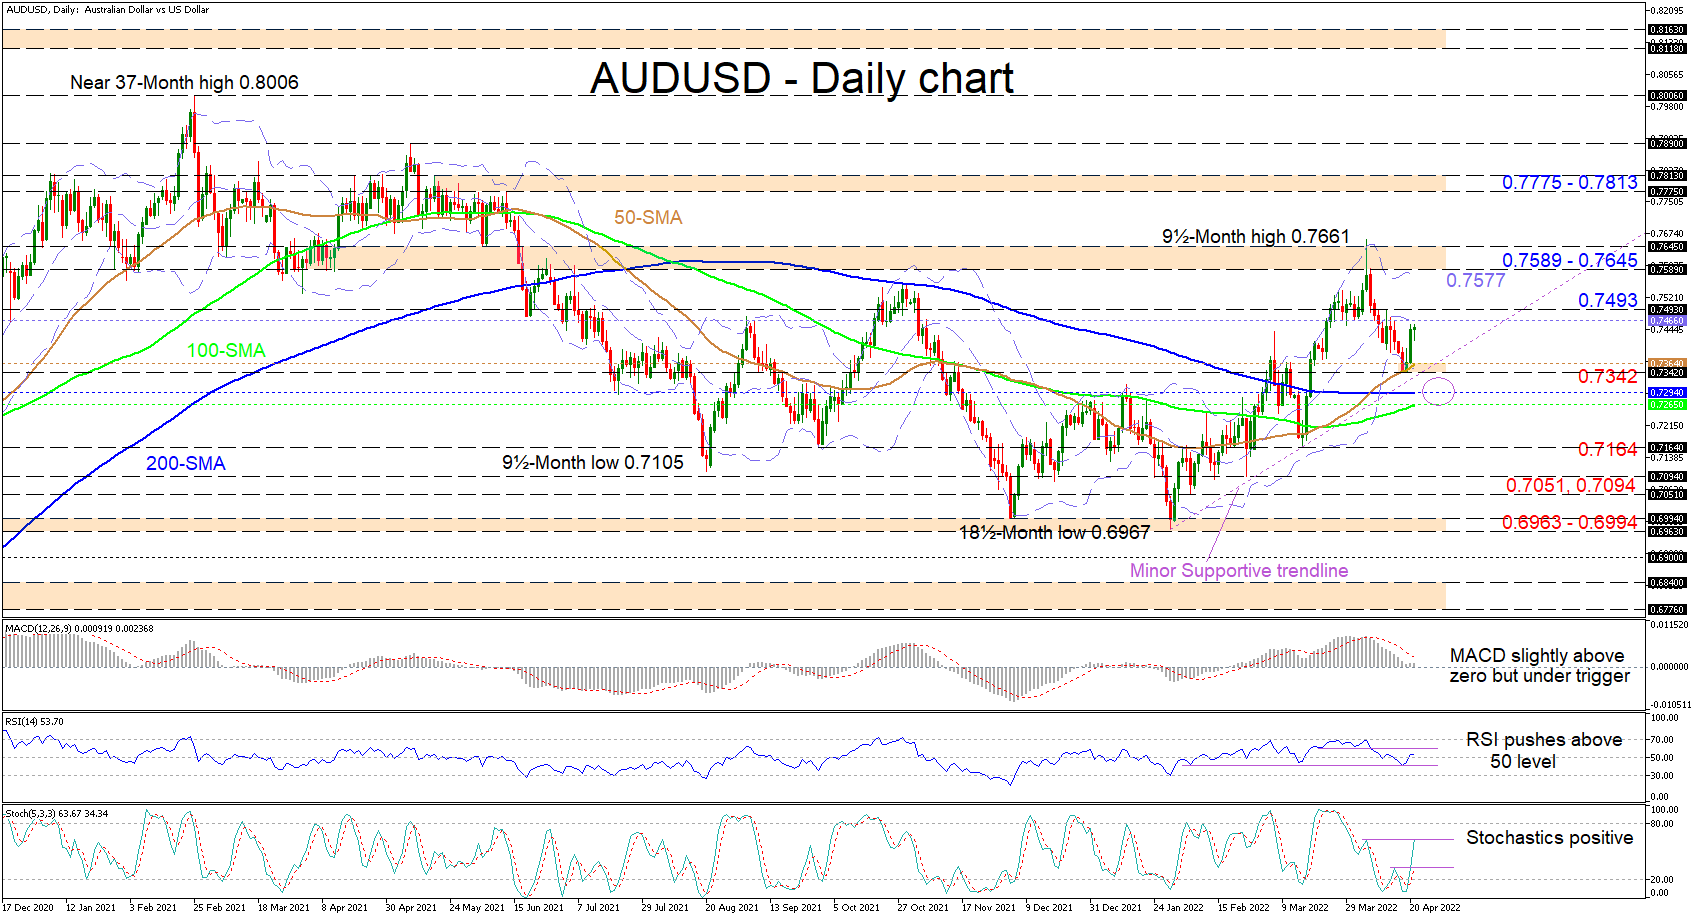
AUDUSD is confronting the mid-Bollinger band at 0.7466 after unearthing fresh positive traction off the rising 50-day simple moving average (SMA), which appears to have rescued the minor twelve-week uptrend that evolved from the 0.6963-0.6994 support base that stretches back to July 2020. While the 200-day SMA proposes a more neutral trajectory, the rising 50- and 100-day SMAs are endorsing the upward trend in the pair.
Currently, the short-term oscillators are suggesting that recent negative momentum in the pair has yet to dominate. The MACD, which is in the positive region and beneath its red trigger line, is strengthening a tad north of the zero threshold, while the positively charged stochastic oscillator is also promoting additional upward moves in the pair. That said, the RSI has nudged into the bullish territory but is struggling to gain more positive ground.
To the upside, prompt resistance could originate from the mid-Bollinger band at 0.7466 and the nearby 0.7493 high. Overrunning these obstacles, the bulls may then aim for a critical region of resistance involving the upper Bollinger band at 0.7577 and the 0.7589-0.7645 barricade overhead. Should sturdy bullish forces navigate beyond these deterrents too and overshoot the nine-and-a-half-month spike of 0.7661, the 0.7775-0.7813 mid-May until mid-June area of highs could come under fire.
Alternatively, if bullish pressures fade around the mid-Bollinger band, initial downside constraints could transpire between the 50-day SMA at 0.7364 and the 0.7342 trough. If this critical zone, which includes the lower Bollinger band and a potential supportive trendline pulled from the 0.6967 low, fails to uphold the positive trend, sellers may then face a support section linking the 200- and 100-day SMAs at 0.7294 and 0.7265. If the pair dives past the longer-term 200- and 100-day SMAs, it could test the March 15 trough of 0.7164 before sinking towards the vicinity of the 0.7094 and the 0.7051 lows.
Summarizing, AUDUSD is sustaining a minor 12-week uptrend, which may endure should the price remain north of the SMAs and the 0.7342 trough. A successful close this time above the 0.7589-0.7645 border could reinforce upside momentum. Yet, a drop in the price underneath the 0.6963-0.6994 base could trigger worries about negative tendencies regaining a lead.