Sample Category Title
EUR/AUD Daily Outlook
Daily Pivots: (S1) 1.4596; (P) 1.4662; (R1) 1.4769; More...
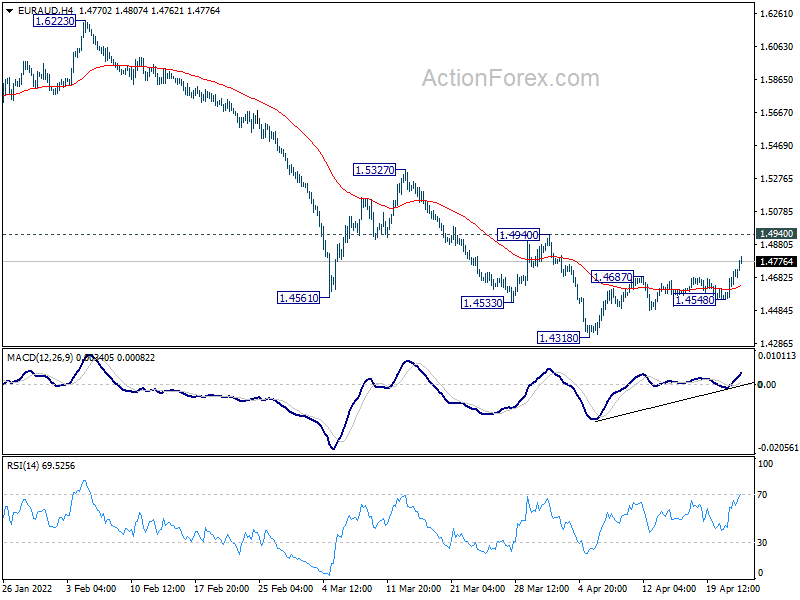
EUR/AUD's rebound from 1.3418 extends higher today but stays well below 1.4940 resistance. Intraday bias remains neutral and outlook stays bearish too. On the downside, below 1.4548 support will bring retest of 1.4318 low. Decisive break there will resume larger down trend to 1.3624 long term support next. On the upside, however, firm break of 1.4940 will indicate short term bottoming and turn bias back to the upside for 1.5327 resistance instead.
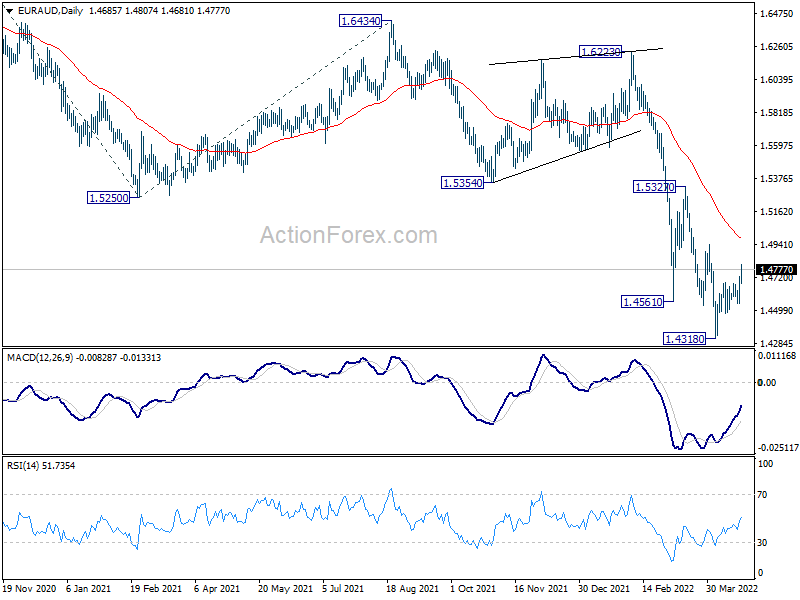
In the bigger picture, fall from 1.9799 is seen as a long term impulsive move. Next target is 61.8% projection of 1.9799 to 1.5250 from 1.6434 at 1.3623, which is close to 1.3624 long term support (2017 low). Some support could be seen there to bring interim rebound. But overall, break of 1.5354 support turned resistance is needed to be the first sign of medium term bottoming. Otherwise, outlook will stay bearish in case of recovery.
EUR/CHF Daily Outlook
Daily Pivots: (S1) 1.0288; (P) 1.0330; (R1) 1.0373; More....
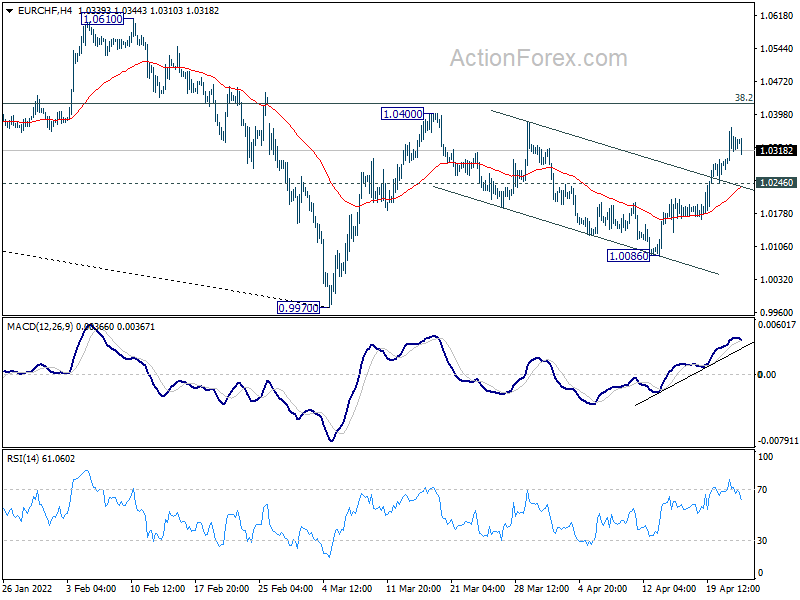
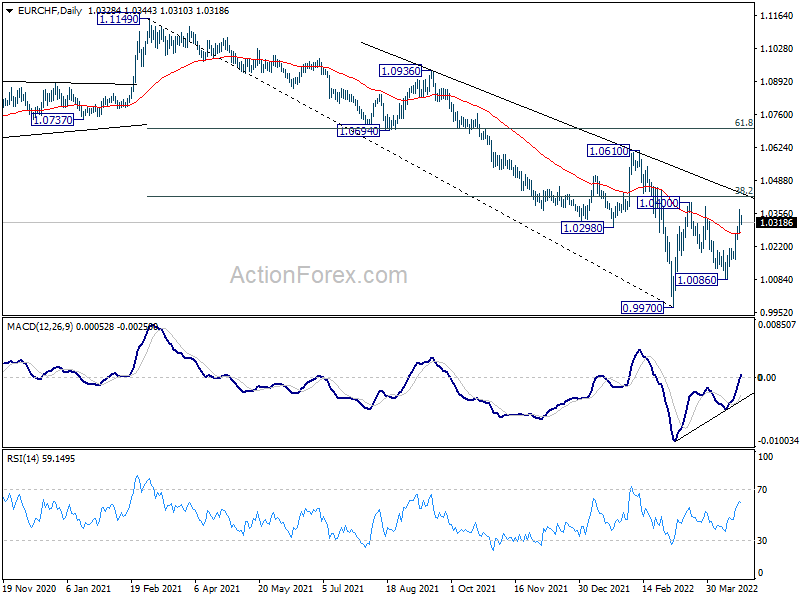
Intraday bias in EUR/CHF stays on the upside for 1.0400 resistance. Firm break there will resume whole rebound from 0.9970, and target 1.0610 resistance next. On the downside, below 1.0246 minor support will turn intraday bias neutral first. But further rally is expected as long as 1.0086 support holds.
In the bigger picture, long term down trend from 1.2004 (2018 high) is still in progress. Next target is 100% projection of 1.2004 to 1.0505 to 1.1149 at 0.9650. In any case, sustained break of 1.0505 support turned resistance (2020 low) is needed to be the first sign of medium term bottoming. Otherwise, outlook will remain bearish.
GBP/USD dives through 1.3, risking more downside acceleration
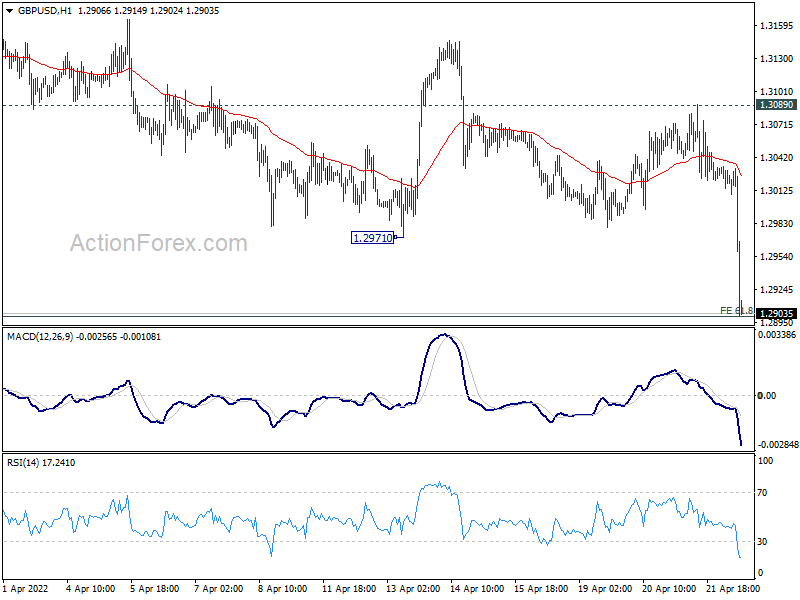
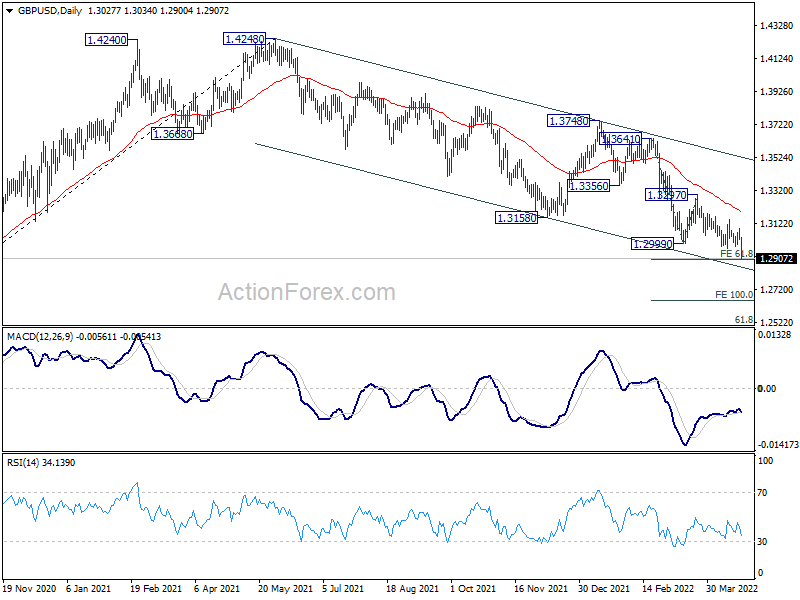
GBP/USD dives sharply through 1.3 handle today, breaking through 1.2971 low too. Immediate focus is now on 61.8% projection of 1.3641 to 1.2999 from 1.3297 at 1.2900. Firm break there could trigger more downside acceleration to 100% projection at 1.2655. Watch out!
UK retail sales dropped -1.4% mom in Mar, led by non-store retailing
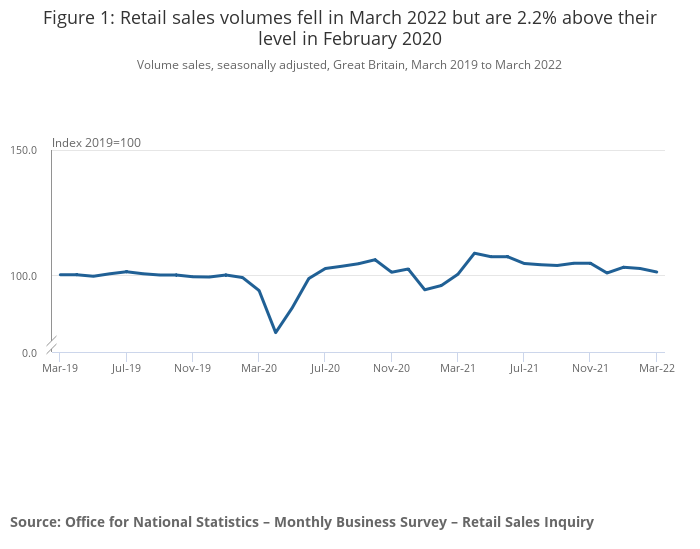
UK retail sales dropped -1.4% mom in March, much worse than expectation of -0.3% mom. The largest contribution to the fall came from non-store retailing in which sales volumes fell by -7.9% mom. Food store sales volumes fell by -1.1% mom. Automotive fuel sales volumes fell by -3.8% mom.
Overall, sales volumes were still 2.2% above their pre-coronavirus level in February 2020.
A 50bp Hike by the Fed in May Looks Like a Done Deal
Market movers today
Today's key releases are the preliminary S&P Global PMIs (formerly known as Markit PMIs) for the euro area (including country-specific indices for Germany and France), the UK and the US covering April.
Besides that it is another quiet day in terms of economic data releases. This morning, UK retail sales for March are due out.
On Sunday, the French presidential election run-off takes place, which will be important for market developments Monday. Polls still favour Macron, but it's going to be a tight race with left-wing voters as the kingmakers. A Le Pen win would trigger a negative market reaction in our view, but even if Macron is re-elected, France is facing increasing headwinds, both from the economy and political fragmentation.
Also notice that the Fed's blackout period begins tomorrow, so it is the last day that the Fed can send any new signals ahead of the meeting in early May. While it seems like a 50bp rate hike is a done deal by now, the Fed has not really talked about a bigger 75bp rate hike, which seems unlikely at this point.
The 60 second overview
Market sentiment: Risk sentiment soured yesterday evening as concerns over a monetary-policy-triggered recession dominated. A 50bp hike by the Fed at its upcoming May 4 meeting now seems like a done deal, but yesterday, Powell abstained from suggesting that a more aggressive 75bp hike would be on the table. About 80% of the US firms reporting earnings thus far have beaten estimates but the strength in earnings seems to be outweighed by recession concerns, yet again reflected by the US 5s30s inversion yesterday. China's COVID-lockdowns also continue to weigh on Asian markets. On Thursday, China's securities regulator issued guidance urging institutional investors to buy more domestic shares.
Two months of war: On Sunday, it will be two months since Russia started its large-scale attack on Ukraine. Against expectations by many, Ukrainian resistance remains strong, and despite broad-based devastation, Russia has failed in achieving any remarkable victories. The battle over Mariupol continues. Yesterday, President Putin declared that Russia had secured control over the city, but Defence Minister Shoigu said more than 2,000 opposing troops remain holed up in the Azovstal plant. Russia's new strategy regarding the plant seems to be to seal it off, instead of storming in. Yesterday, the World Bank estimated that physical damage in Ukraine's infrastructure amounts to USD 60bn and will continue to rise as fighting continues. Ukrainian estimates are far more substantial. At the WB/IMF spring meetings, Ukraine's prime minister said that the country would need USD 4-5 billion per month in funding, and that reconstruction after the war would cost USD 600bn.
Equities: What looked like a risk on session turned to the opposite at the US opening bell. Rising short end rates (more below) challenged US equities, with all sectors lower. Investors sold off all cyclicals, but specifically growth and rich valued ones. S&P 500 -1.5%, Dow -1.1%, Nasdaq -2.1% and Russell 2000 -2.3%. US futures are slightly lower this morning.
FI: It has been a volatile week with global bond yields trading in a wide range such as 10Y US Treasuries which have moved up and down between 2.80% and 3.00% during the week. Bunds have traded between 0.80% and 1.00%. Yesterday, yields rose again on the back of hawkish central bank comments from ECB, Federal Reserve and BoE. ECB's Lagarde will round off central bank speeches in the afternoon today. The market is now pricing 50bp from the Federal Reserve at the next three meetings and the US yield curve is again inverting between 5Y and 30Y after it had begun steepening.
FX: Initially, EUR/USD moved higher to above 1.09 supported by hawkish ECB comments suggesting a rate hike may come as early in July but it did not last long, as the cross ended the day nearly where it started. We are sceptical as to the ECB's ability to strengthen broad EUR to dampen imported inflation, as EUR remains overvalued from a medium-term valuation perspective. Oil moved sideways around USD108/barrel.
Credit: Yesterday, credit markets had a mixed session and concluded in a mild risk-off mode. CDS indices were both wider with iTraxx Main 0.7bp higher at 78.8bp, while Xover was 4.3bp higher at 376.1bp.
ECB Hawks are Waking Up
Data confirmed yesterday that inflation in the Eurozone advanced to 7.4%, a tick lower than the 7.5% expected by analysts. Yet the German producer prices jumped more than 30% year-on-year in March, the fastest rise in 73 years. And the main responsible for soaring producer prices was the soaring energy costs, which rose 84% and natural gas prices, that skyrocketed 145% since last year. And the situation may get worse before it gets better as tensions in Ukraine escalate with Russia congratulating itself for the fall of Mariupol, while Ukrainian leaders say the city has not completely fallen. On the other hand, the Russian oil production is down by 10% from the pre-war levels, and further decline is expected. Meanwhile, Europeans are not ready to walk away from the Russian oil and gas, but the warning against making ruble payments, and the rising nuclear threat could call for further sanctions.
For now, the barrel of crude consolidates a touch above the $100pb mark. The rising hawkish expectations for the Federal Reserve (Fed) and the European Central Bank (ECB), combined with the China lockdown keep oil bulls back from adding fresh positions.
Speaking of hawkish expectations
Although Christine Lagarde promised gradual tightening at the latest ECB meeting, the hawkish comments from the other members hint that the ECB may not wait too long before raising the interest rates to tame inflation. Swap contracts linked to the short-term euro rates price in a 75bp hike by December, hinting that the ECB would end the bond purchases by July, and hike the rates the same month for the first time, then keep hiking at each meeting until December – unless the economy suffers a severe shock. Due today, the flash PMI data should hint at slowdown in European economic activity due to war.
The hawkish shift in ECB expectations suggests that the upside risks are building for the euro. The EURUSD jumped above the 1.09 yesterday, though the pair is back to 1.0843 at the time of writing. This weekend the final tour of French elections is expected to result in a second term for Emmanuel Macron. If this is the case, we could see the euro gain on Monday, but the upside potential against the US dollar depends on the dollar appetite.
And the Fed is not twiddling its fingers. Jerome Powell said yesterday that a 50bp hike is on the table for the May FOMC meeting, and hinted that the Fed may get even more aggressive in next meetings, backing Bullard’s words that a 75bp hike should not be ruled out earlier this week.
Hot potato game
The US equities were set for a bullish session, but Powell’s speech dampened the mood and sent the S&P500 1.50% lower on Thursday. Nasdaq lost more than 2% to a fresh five-week low. The only thing that could reverse the US equity selloff is earnings. The earnings expectations are certainly pessimistic enough to allow positive surprise on average for the first quarter.
So far, 13% of the S&P 500 companies have reported earnings, and 80% of those who revealed Q1 results surprised to the upside. A strong earnings season could help bulls gaining confidence.
What will certainly make a difference is companies’ ability to pass higher costs on to their clients. The ones that could reflect the higher costs on their final products should outperform.
Technical Outlook and Review
DXY:
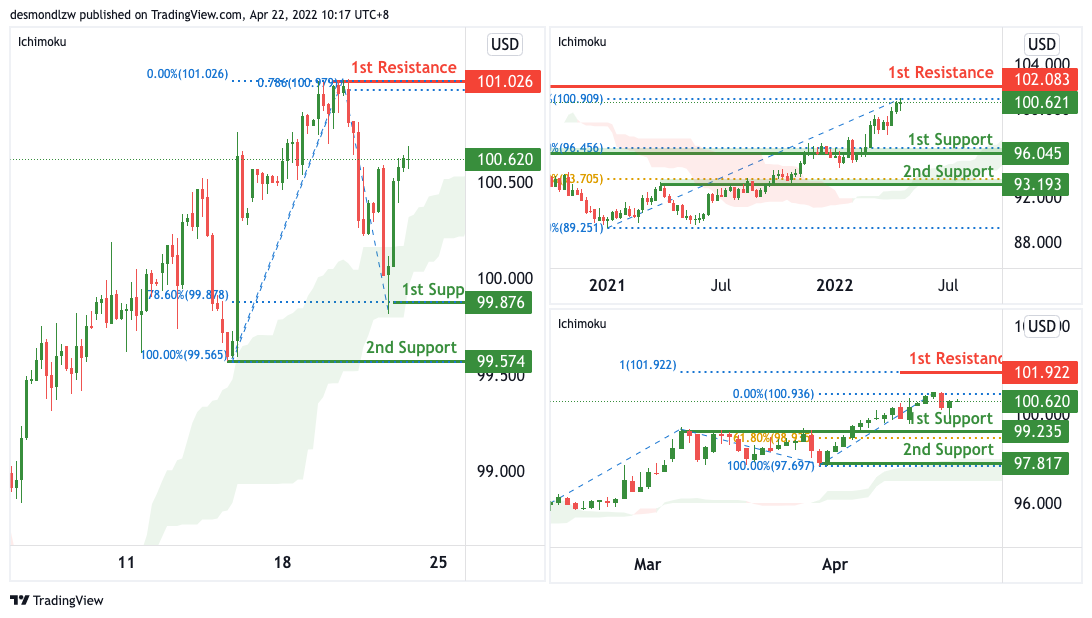
On the Weekly, with price moving above the ichimoku cloud, we have a bullish bias that price will rise to our 1st resistance where the swing high resistance is from our 1st support in line with the horizontal pullback support. Alternatively, price may break 1st support structure and head for 2nd support where the horizontal swing low support is.
On the Daily, with price moving above the ichimoku cloud, we have a bullish bias that price will rise to our 1st resistance where the swing high resistance is from our 1st support in line with the horizontal pullback support. Alternatively, price may break 1st support structure and head for 2nd support where the horizontal swing low support is.
On the H4, with price moving above the ichimoku cloud, we have a bullish bias that price will rise to our 1st resistance of 101.026 in line with the swing high resistance and 78.6% Fibonacci projection from our 1st support of 99.876 in line with the 78.6% Fibonacci retracement. Alternatively, price may break 1st support and head for 2nd support at 99.574 in line with the 50% Fibonacci retracement. Our bullish bias is further supported by how price is expected to respect our ascending channel.
Areas of consideration:
- H4 time frame, 1st resistance at 101.026
- H4 time frame, 1st support at 99.876
XAU/USD (GOLD):
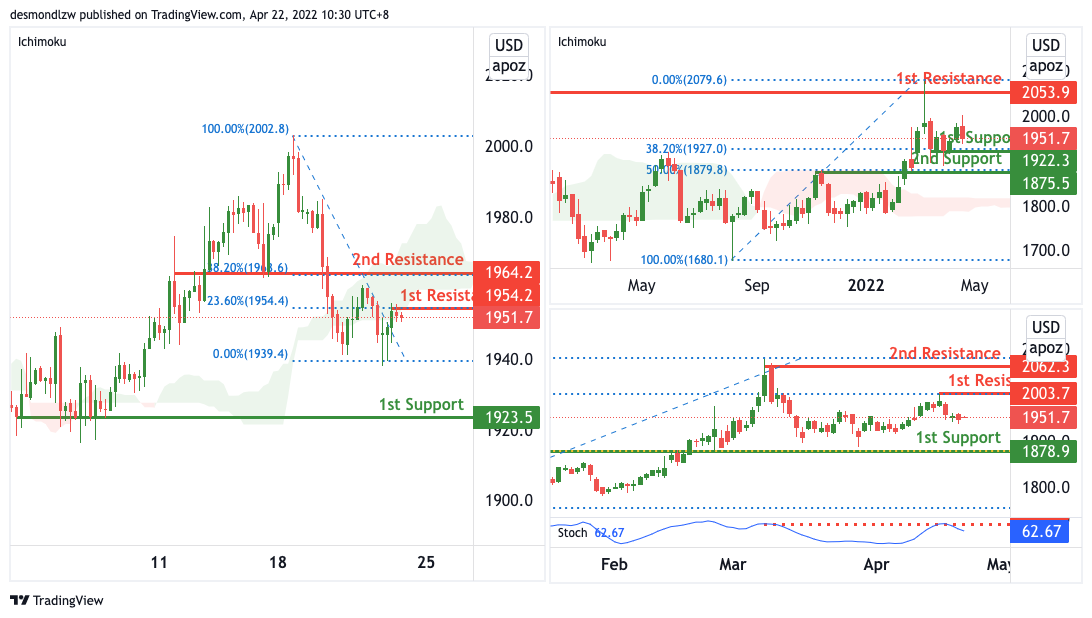
On the Weekly, with price moving above the ichimoku cloud, we have a bullish bias that price will rise to our 1st resistance where the swing high resistance is from our 1st support in line with the horizontal pullback support. Alternatively, price may break 1st support structure and head for 2nd support where the horizontal swing low support is.
On the Daily, with price moving below the ichimoku cloud, we have a bearish bias that price will drop from our 1st resistance where the swing high resistance is to our 1st support in line with the horizontal pullback support. Alternatively, price may break 1st resistance structure and head for 2nd resistance where the horizontal swing high resistance is.
On the H4, We are expecting price to potentially dip from 1st resistance level of 1954.2 which is line with 23.6% Fibonacci retracement, along with a graphical pullback resistance towards the 1st support level of 1923.5 in line with a horizontal swing low support. Otherwise, price might break the 1st resistance level and head towards the 2nd resistance level of 1964.2.
Areas of consideration:
- H4 time frame, 1st Resistance at 1954.2
- H4 time frame, 1st Support at 1923.5
GBP/USD:
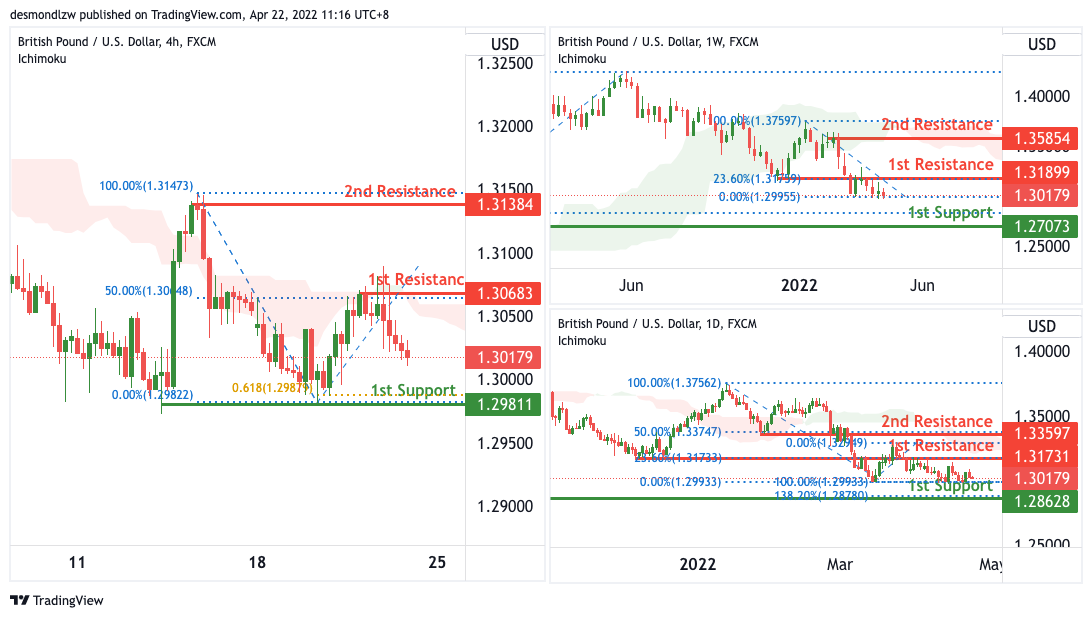
On the Weekly, with price moving below the ichimoku cloud, we have a bearish bias that price will drop from our 1st resistance where the swing high resistance is to our 1st support in line with the horizontal pullback support. Alternatively, price may break 1st resistance structure and head for 2nd resistance where the horizontal swing high resistance is.
On the Daily, with price moving below the ichimoku cloud, we have a bearish bias that price will drop from our 1st resistance where the swing high resistance is to our 1st support in line with the horizontal pullback support. Alternatively, price may break 1st resistance structure and head for 2nd resistance where the horizontal swing high resistance is.
On the H4, with price moving below the ichimoku cloud, we have a bearish bias that price will drop from our 1st resistance where the swing high resistance is to our 1st support in line with the horizontal pullback support. Alternatively, price may break 1st resistance structure and head for 2nd resistance where the horizontal swing high resistance is.
Areas of consideration:
- H4 1st resistance at 1.30683
- H4 1st support at 1.29811
USD/CHF:
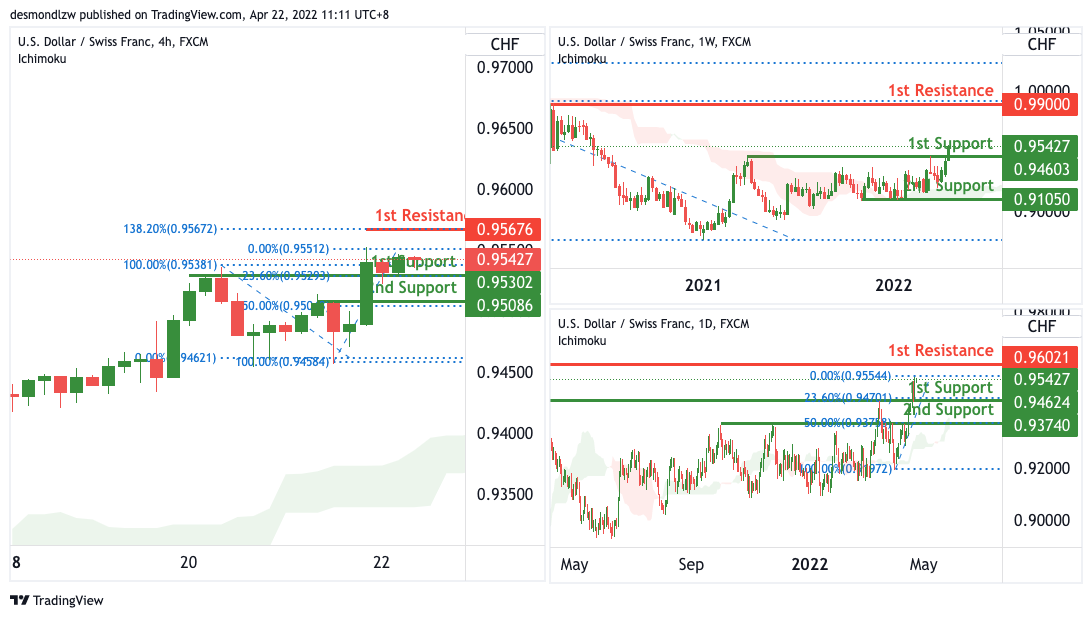
On the Weekly, with price moving above the ichimoku cloud, we have a bullish bias that price will rise to our 1st resistance where the swing high resistance is from our 1st support in line with the horizontal pullback support. Alternatively, price may break 1st support structure and head for 2nd support where the horizontal swing low support is.
On the Daily, with price moving above the ichimoku cloud, we have a bullish bias that price will rise to our 1st resistance where the swing high resistance is from our 1st support in line with the horizontal pullback support. Alternatively, price may break 1st support structure and head for 2nd support where the horizontal swing low support is.
On the H4, with price moving above the ichimoku cloud, we have a bullish bias that price will rise to our 1st resistance of 0.95676 in line with the 138.2% Fibonacci extension from our 1st support of 0.95302 in line with the 23.6% Fibonacci retracement. Alternatively, price may break 1st support and head for 2nd support at 0.94104 in line with the 50% Fibonacci retracement.
Areas of consideration
- 1st support level at 0.95302
- 1st resistance level at 95676
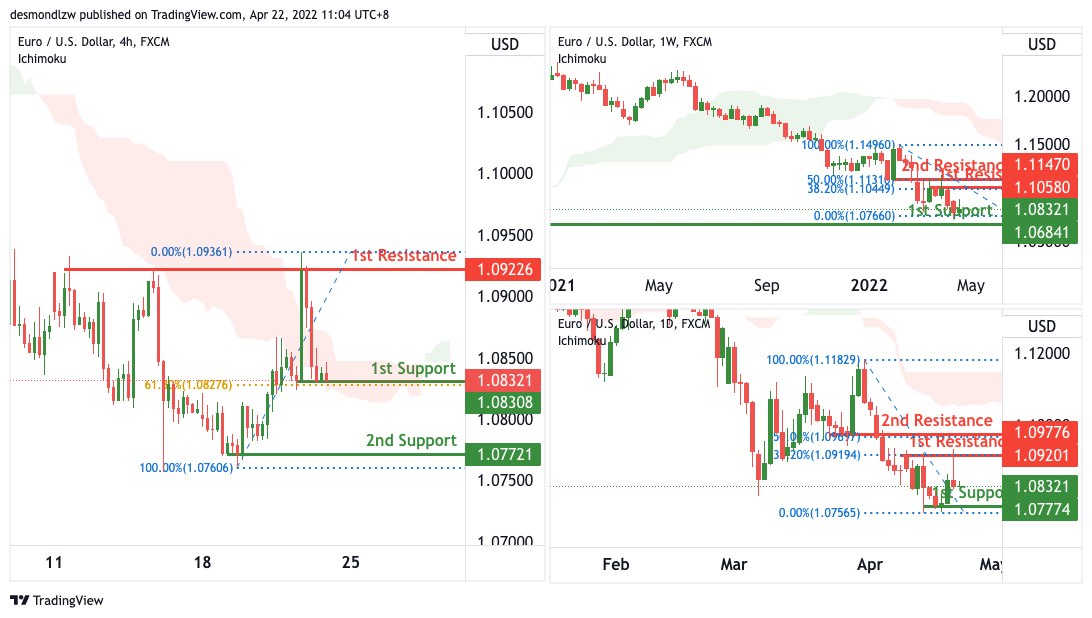
EUR/USD :
On the Weekly, with price moving below the ichimoku cloud, we have a bearish bias that price will drop from our 1st resistance where the swing high resistance is to our 1st support in line with the horizontal pullback support. Alternatively, price may break 1st resistance structure and head for 2nd resistance where the horizontal swing high resistance is.
On the Daily, with price moving below the ichimoku cloud, we have a bearish bias that price will drop from our 1st resistance where the swing high resistance is to our 1st support in line with the horizontal pullback support. Alternatively, price may break 1st resistance structure and head for 2nd resistance where the horizontal swing high resistance is.
On the Daily, with price expected to bounce off the ichimoku cloud support, we have a bullish bias that price will rise to our 1st resistance where the swing high resistance is from our 1st support in line with the horizontal pullback support. Alternatively, price may break 1st support structure and head for 2nd support where the horizontal swing low support is.
Areas of consideration :
- H4 1st resistance at 09226
- H4 1st support at 1.08308
USD/JPY:
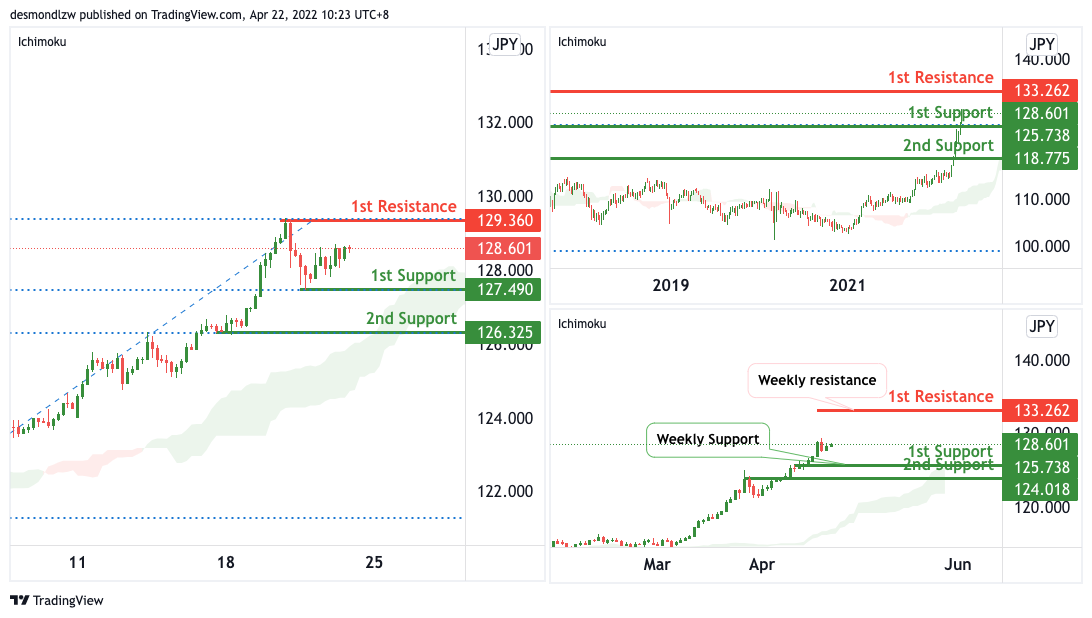
On the Weekly, with price moving above the ichimoku cloud, we have a bullish bias that price will rise to our 1st resistance where the swing high resistance is from our 1st support in line with the horizontal pullback support. Alternatively, price may break 1st support structure and head for 2nd support where the horizontal swing low support is.
On the Daily, with price moving above the ichimoku cloud, we have a bullish bias that price will rise to our 1st resistance where the swing high resistance is from our 1st support in line with the horizontal pullback support. Alternatively, price may break 1st support structure and head for 2nd support where the horizontal swing low support is.
On the H4, with price moving above the ichimoku cloud, we have a bullish bias that price will rise to our 1st resistance where the swing high resistance is from our 1st support in line with the horizontal pullback support. Alternatively, price may break 1st support structure and head for 2nd support where the horizontal swing low support is.
Areas of consideration:
- H4 time frame, 1st resistance at 129.360
- H4 time frame, 1st support at 127.490
AUD/USD:
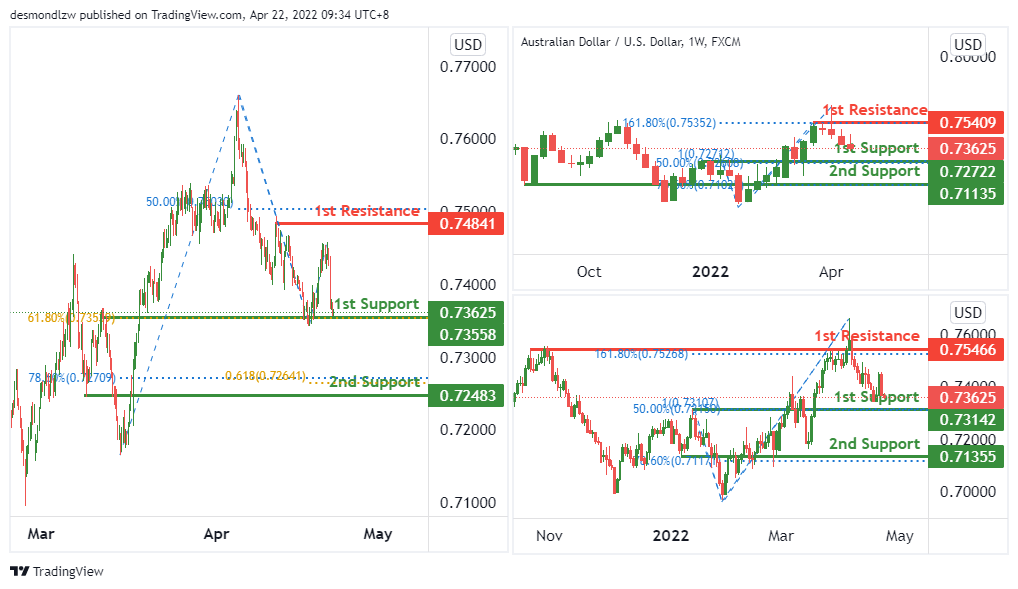
On the weekly timeframe, price is near to the key support level. We see the potential of a bullish bounce from 1st support level of 0.72722 in line with 50% fibonacci retracement and 100% fibonacci projection towards the 1st resistance level of 0.75409 in line with 161.8% fibonacci extension.
On the daily timeframe, price is near the key support level, We see the potential of a bullish bounce from 1st support level of 0.73142 in line with 50% fibonacci retracement and 100% fibonacci projection towards the 1st resistance level of 0.75466 in line with 161.8% fibonacci extension.
On the H4 timeframe, price is near the key support level, We see the potential of a bullish bounce from 1st support level of 0.73558 in line with 61.8% fibonacci retracement towards the 1st resistance level of 0.74841 in line with 50% fibonacci retracement. Otherwise, price might break the key support level and head towards the 2nd support of 0.72483 which is in line with 78.6% fibonacci retracement and 61.8% fibonacci projection.
Areas of consideration
- H4 1st resistance at 74841
- H4 1st support at 73625
NZD/USD:
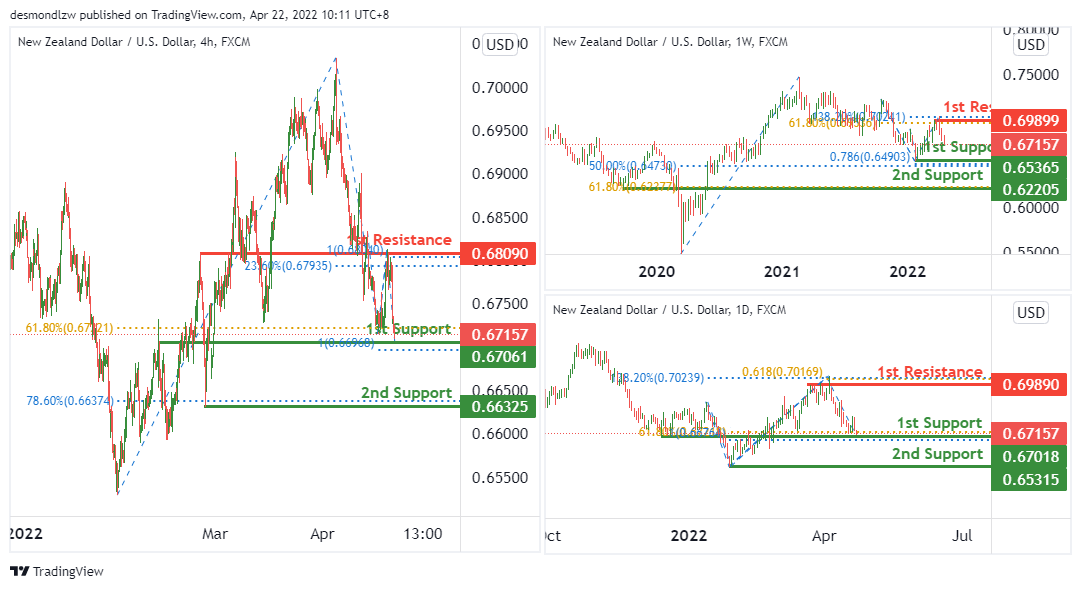
On the weekly, we see the potential of bullish bounce from 1st support level of 0.65365 line up with 50% fibonacci retracement and 78.6% fibonacci projection towards the 1st resistance level of 0.69899 in line with 38.2% fibonacci retracement and 61.8% fibonacci projection.
On the daily, we see the potential of bullish bounce from 1st support level of 0.67018 line up with 61.8% fibonacci retracement and 100% fibonacci projection towards the 1st resistance level of 0.69890 in line with 138.2% fibonacci extension and 61.8% fibonacci projection.
On the H4, we see the potential of bullish bounce from 1st support level of 0.67061 line up with 61.8% fibonacci retracement and 100% fibonacci projection towards the 1st resistance level of 0.68090 in line with 23.6% fibonacci retracement and 100% fibonacci projection.
Areas of consideration:
- H4 time frame, 1st support at 67061
- H4 time frame, 1st resistance at 0.68090
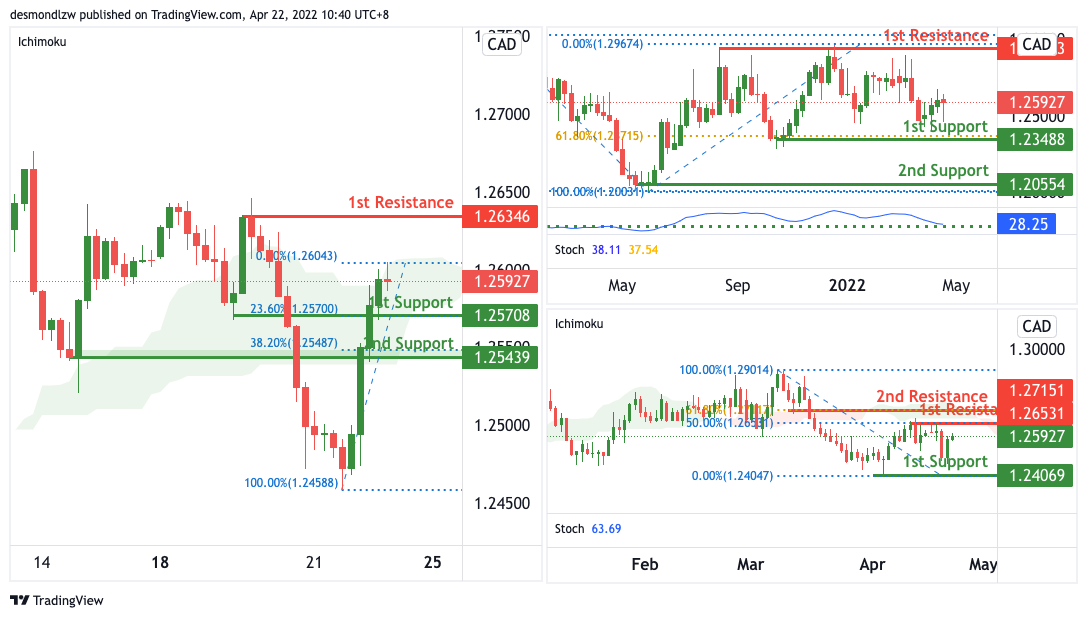
USD/CAD:
On the Weekly, with price moving above the ichimoku cloud, we have a bullish bias that price will rise to our 1st resistance where the swing high resistance is from our 1st support in line with the horizontal pullback support. Alternatively, price may break 1st support structure and head for 2nd support where the horizontal swing low support is.
On the Daily, with price moving below the ichimoku cloud, we have a bearish bias that price will drop from our 1st resistance where the swing high resistance is to our 1st support in line with the horizontal pullback support. Alternatively, price may break 1st resistance structure and head for 2nd resistance where the horizontal swing high resistance is.
On the H4, with price moving above the ichimoku cloud, we have a bullish bias that price will rise to our 1st resistance where the swing high resistance is from our 1st support in line with the horizontal pullback support. Alternatively, price may break 1st support structure and head for 2nd support where the horizontal swing low support is.
Areas of consideration:
- H4 time frame, 1st resistance at 1.26346
- H4 time frame, 1st support at 1.25708
OIL:
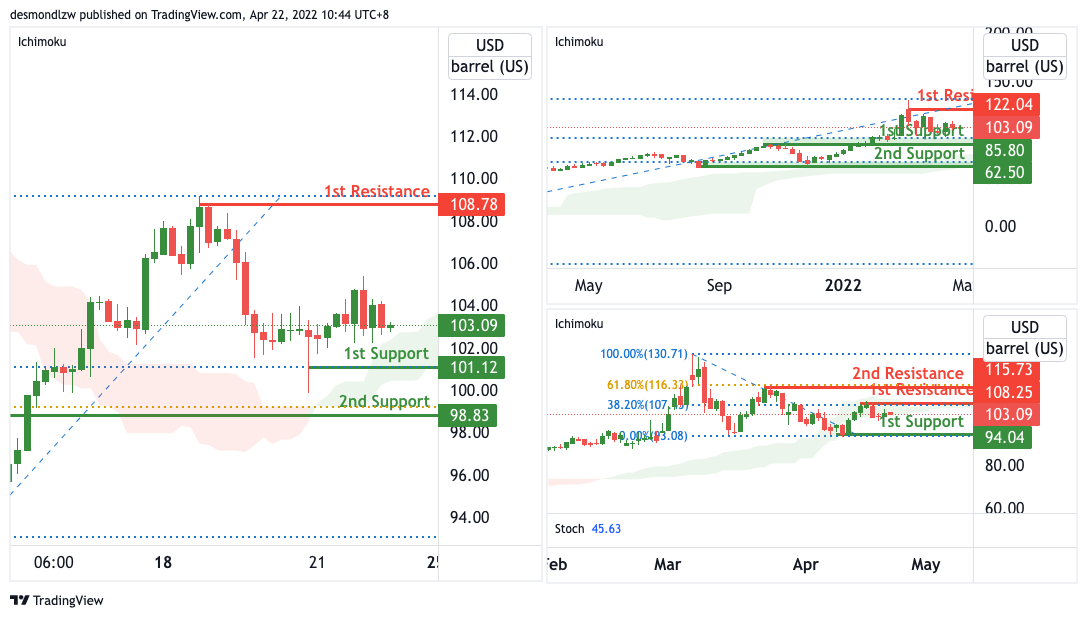
On the Weekly, with price moving above the ichimoku cloud, we have a bullish bias that price will rise to our 1st resistance where the swing high resistance is from our 1st support in line with the horizontal pullback support. Alternatively, price may break 1st support structure and head for 2nd support where the horizontal swing low support is.
On the Daily, with price moving below the ichimoku cloud, we have a bearish bias that price will drop from our 1st resistance where the swing high resistance is to our 1st support in line with the horizontal pullback support. Alternatively, price may break 1st resistance structure and head for 2nd resistance where the horizontal swing high resistance is.
On the H4, with price moving above the ichimoku cloud, we have a bullish bias that price will rise to our 1st resistance where the swing high resistance is from our 1st support in line with the horizontal pullback support. Alternatively, price may break 1st support structure and head for 2nd support where the horizontal swing low support is.
Areas of consideration:
- H4 time frame, 1st resistance of 108.78
- H4 time frame, 1st support of 101.12
Dow Jones Industrial Average:
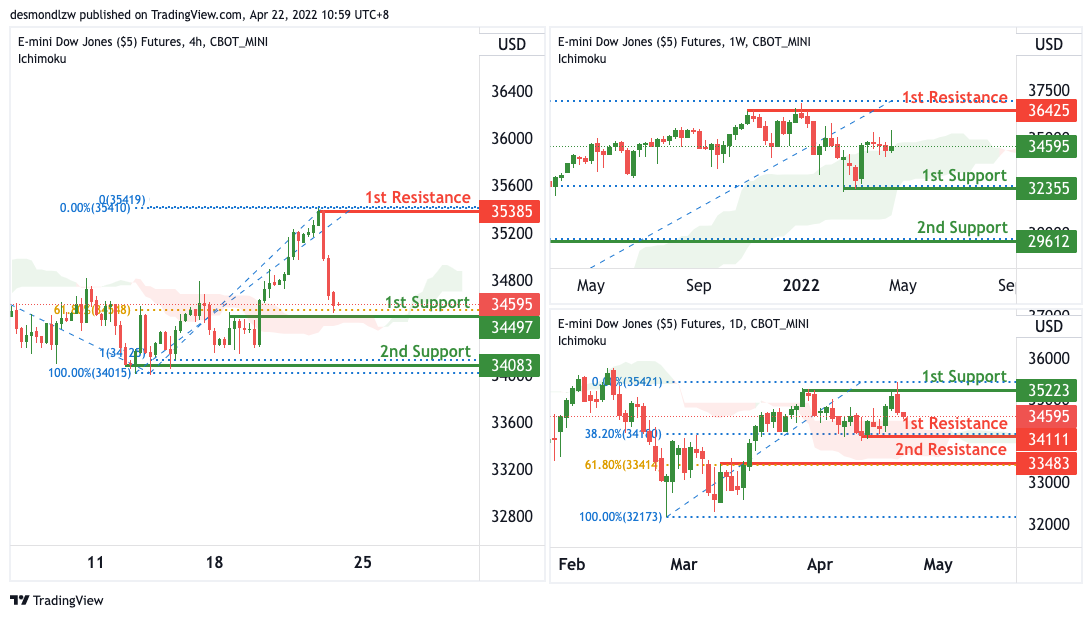
On the Weekly, with price moving above the ichimoku cloud, we have a bullish bias that price will rise to our 1st resistance where the swing high resistance is from our 1st support in line with the horizontal pullback support. Alternatively, price may break 1st support structure and head for 2nd support where the horizontal swing low support is.
On the Daily, with price moving above the ichimoku cloud, we have a bullish bias that price will rise to our 1st resistance where the swing high resistance is from our 1st support in line with the horizontal pullback support. Alternatively, price may break 1st support structure and head for 2nd support where the horizontal swing low support is.
On the H4, with price moving above the ichimoku cloud, we have a bullish bias that price will rise to our 1st resistance where the swing high resistance is from our 1st support in line with the horizontal pullback support. Alternatively, price may break 1st support structure and head for 2nd support where the horizontal swing low support is.
Areas of consideration :
- H4 time frame, 1st resistance at 35385
- H4 time frame, 1st support at 34497
USD/CAD Daily Outlook
Daily Pivots: (S1) 1.2498; (P) 1.2544; (R1) 1.2630; More...
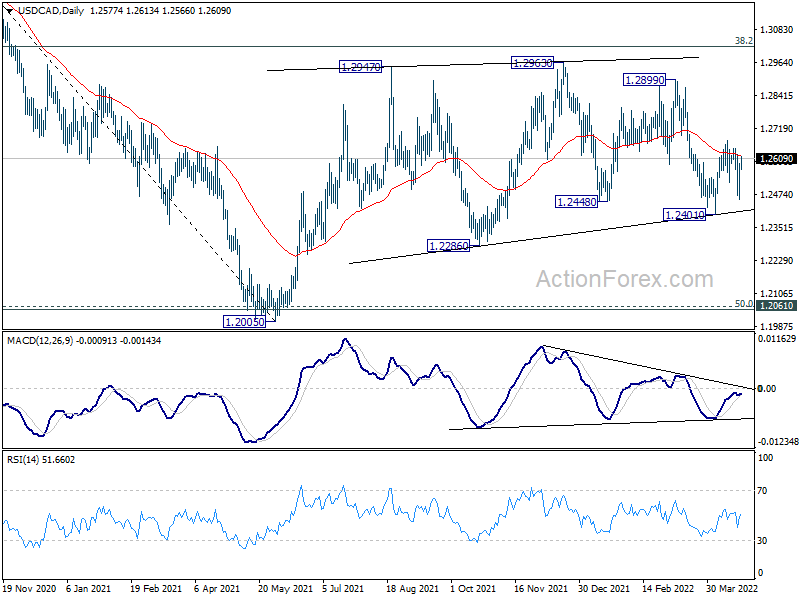
USD/CAD rebounded strongly after dipping to 1.2457 and intraday bias is turned neutral. On the upside, break of 1.2675 will resume the rebound from 1.2401 towards 1.2899 resistance. On the downside, below 1.2457 will bring retest of 1.2401 support.
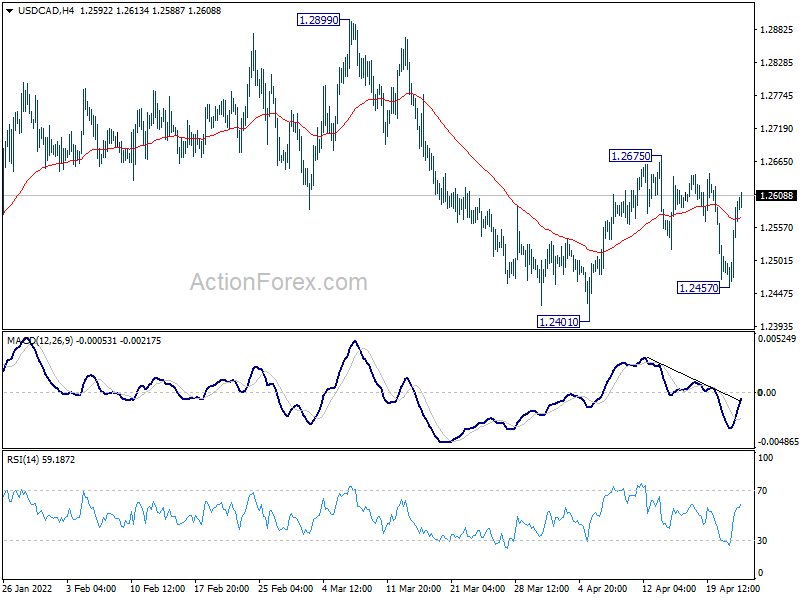
In the bigger picture, focus stays on 38.2% retracement of 1.4667 (2020 high) to 1.2005 (2021 low) at 1.3022. Sustained break there should confirm that the down trend from 1.4667 has completed after defending 1.2061 long term cluster support. Further rise would then be seen towards 61.8% retracement at 1.3650. However, rejection by 1.3022 will maintain medium term bearishness. Break of 1.2005 will resume the down trend from 1.4667 and that carries larger bearish implications too.
AUD/USD Daily Report
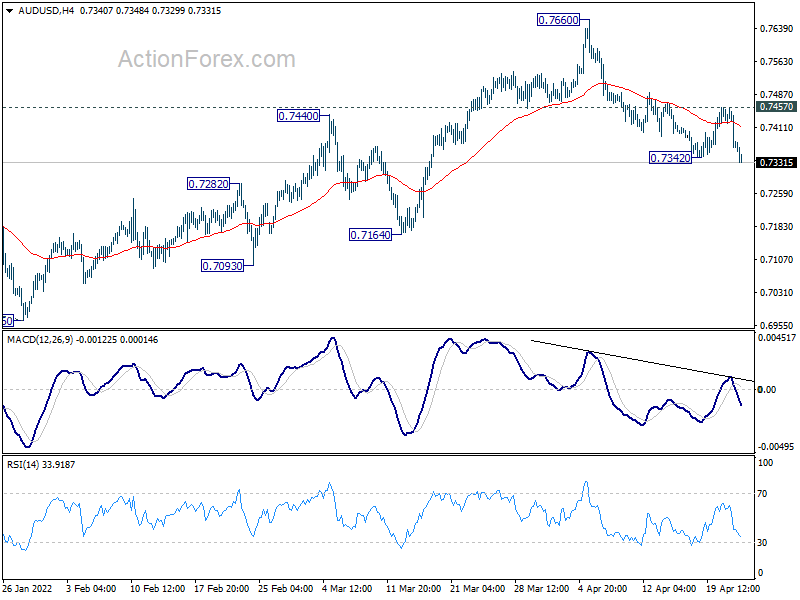
Daily Pivots: (S1) 0.7338; (P) 0.7398; (R1) 0.7431; More...
AUD/USD's fall from 0.7660 resumed by breaking 0.7342 temporary low. Intraday bias is back on the downside for 0.7164 support next. On the upside, above 0.7457 minor resistance will flip bias back to the upside for retesting 0.7660 resistance instead.
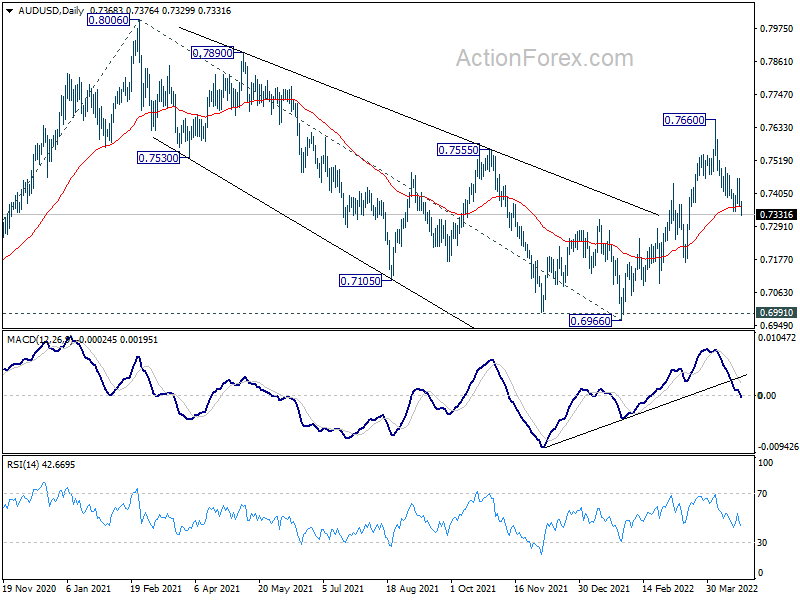
In the bigger picture, correction from 0.8006 could have completed at 0.6966, after drawing support from 0.6991. That is, up trend from 0.5506 (2020 low) might be ready to resume. Firm break of 0.8006 will target 61.8% projection of 0.5506 to 0.8006 from 0.6966 at 0.8511 next. This will remain the favored case as long as 0.7164 support holds.
USD/JPY Daily Outlook
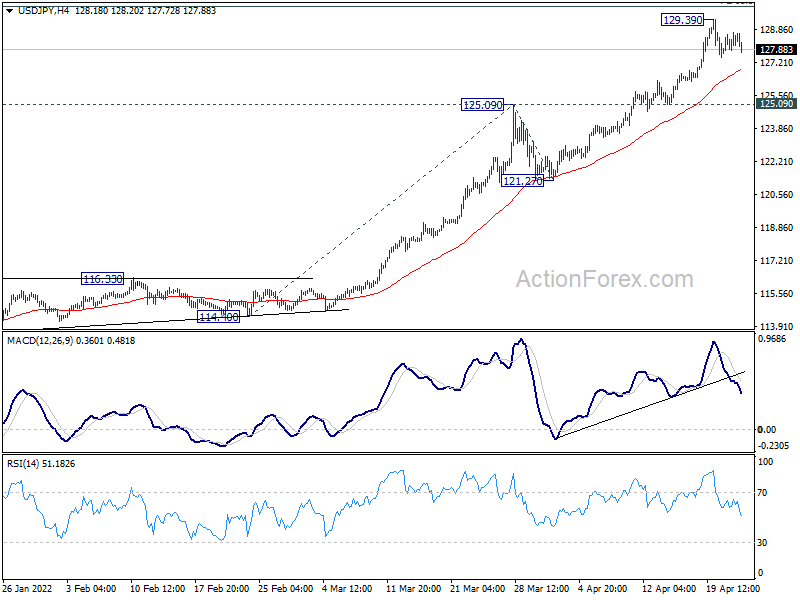
Daily Pivots: (S1) 127.89; (P) 128.30; (R1) 128.79; More...
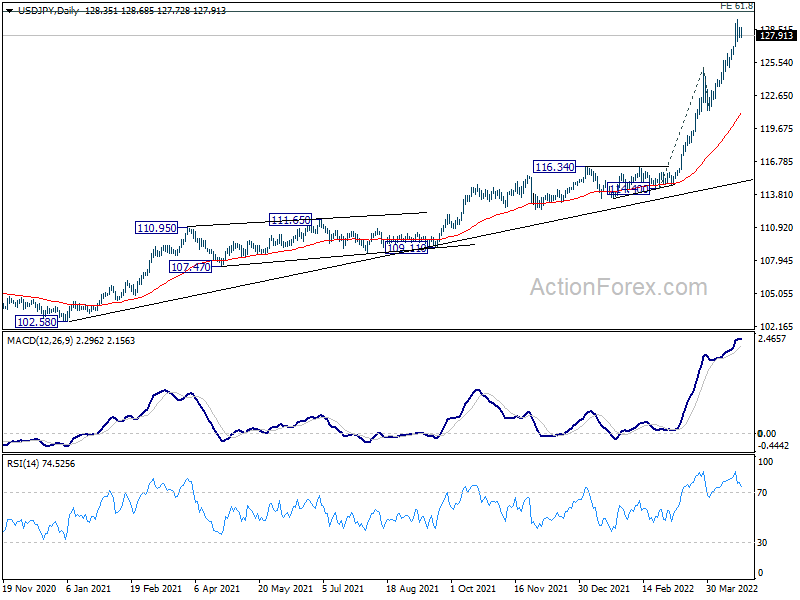
Intraday bias in USD/JPY remains neutral and consolidation from 129.39 could extend further. Deeper retreat cannot be ruled out but downside should be contained above 125.09 resistance turned support to bring another rally. On the upside, above 129.39 will resume larger up trend to 130.04 long term projection level next.
In the bigger picture, the break of 125.85 resistance (2015 high) suggests that whole up trend from 75.56 (2011 low) is resuming. Further rise should be seen to 61.8% projection of 75.56 (2011 low) to 125.85 (2015 high) from 98.97 at 130.04. Sustained break there wave the way to 147.68 (1998 high). For now, this will remain the favored case as long as 121.27 support holds.