Sample Category Title
China PPI slowed to 8.3% yoy, CPI rose to 1.5% yoy in Mar
China PPI slowed from 8.8% yoy to 8.3% yoy, but still beat expectation of 7.9% yoy. However, the monthly rise of 1.1% mom in PPI was the fastest in five months, driven by surges in oil prices and non-ferrous metals.
CPI accelerated from 0.9% yoy to 1.5% yoy in March, above expectation of 1.2% yoy. Core CPI, excluding food and energy, rose 1.1% yoy, unchanged from February's reading. Prices of some food like flour, vegetable oil, fresh vegetables and eggs rose and were "affected by the rise in international prices of wheat, corn and soybeans and the domestic [coronavirus] outbreaks", noted senior NBS statistician Dong Lijuan.
BoJ Kuroda: Economy to continue to recover despite rising commodity prices
BoJ Governor Haruhiko Kuroda said in the quarterly branch manager meeting, "Japan's economy has picked up as a trend, although some weakness has been seen in part, mainly due to the impact of COVID-19."
"As downward pressure on service consumption and the impact of supply shortages diminish, a pickup in overseas demand, accommodative monetary policy, and the government's economic stimulus will likely help the Japanese economy recover despite being affected by rising commodity prices," he added.
Kuroda also cautioned that "extremely high uncertainties" remain over how the crisis in Ukraine will impact commodity prices and the Japanese economy. But he also indicated that commodity inflation is unlikely to trigger a change in the central bank's ultra-loose policy, because it wouldn't last long.
Technical Outlook and Review
DXY:
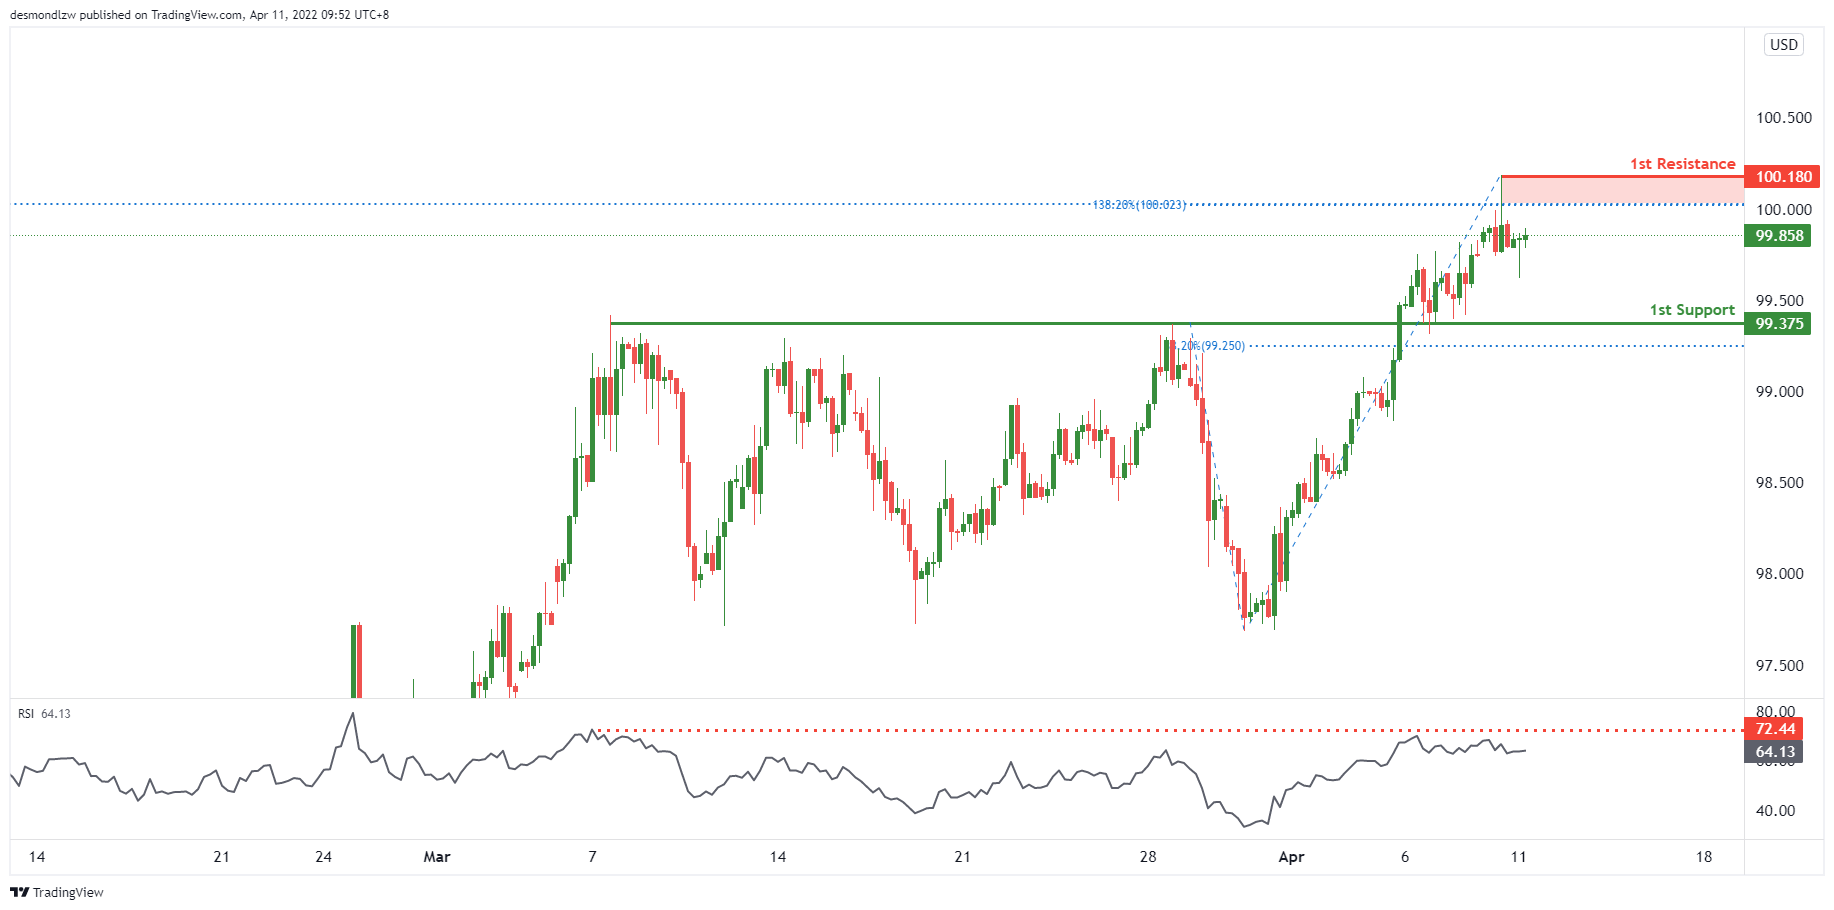
On the H4 timeframe, prices are consolidating in a swing high and an area of Fibonacci confluences. We see the potential for a dip from our 1st resistance at 100.180 in line 138.2% Fibonacci extension towards our 1st support at 99.375 in line with 38.2% Fibonacci retracement. RSI is at levels where dips previously occurred, further supporting our bearish bias.
Areas of consideration:
- H4 time frame, 1st resistance at 100.180
- H4 time frame, 1st support at 99.375
XAU/USD (GOLD):
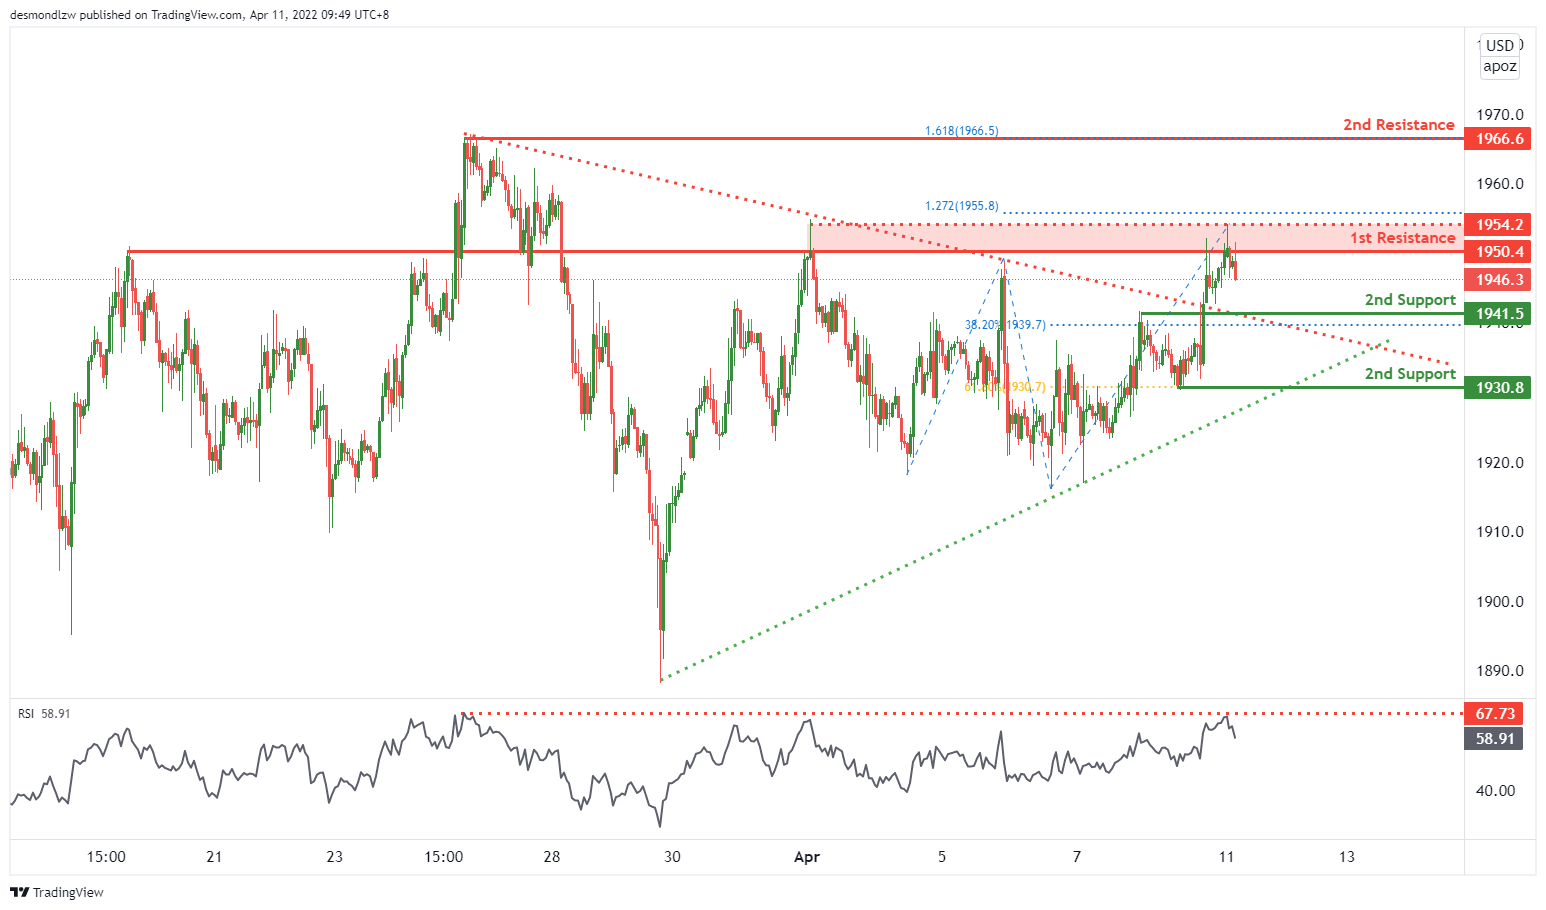
On the weekly, prices are on bullish momentum and abiding by an ascending trendline support. We see the potential for a bounce from our 1st support at 1875.057 in line with 161.8% Fibonacci Projection. Prices are trading above our ichimoku clouds, further supporting our bullish view. On the daily, prices are on a support. We see the potential for a bounce from our 1st support at 1910.811 in line with 50% Fibonacci retracement towards our 1st resistance at 1910.811 in 100% Fibonacci Projection. Prices are trading above our Ichimoku clouds, further supporting our bullish bias. On the H4, prices are consolidating in a triangle pattern. We see the potential for a dip from our 1st resistance at 1937.627 which is an area of Fibonacci confluences towards our 1st support at 1915.592 in line which is a graphical overlap and in line with 61.8% Fibonacci Projection. RSI is at levels where dips previously occurred, further supporting our bearish view.
Areas of consideration:
- 4h 1st support at 1915.592
- 4h 1st resistance at 1937.627
GBP/USD:
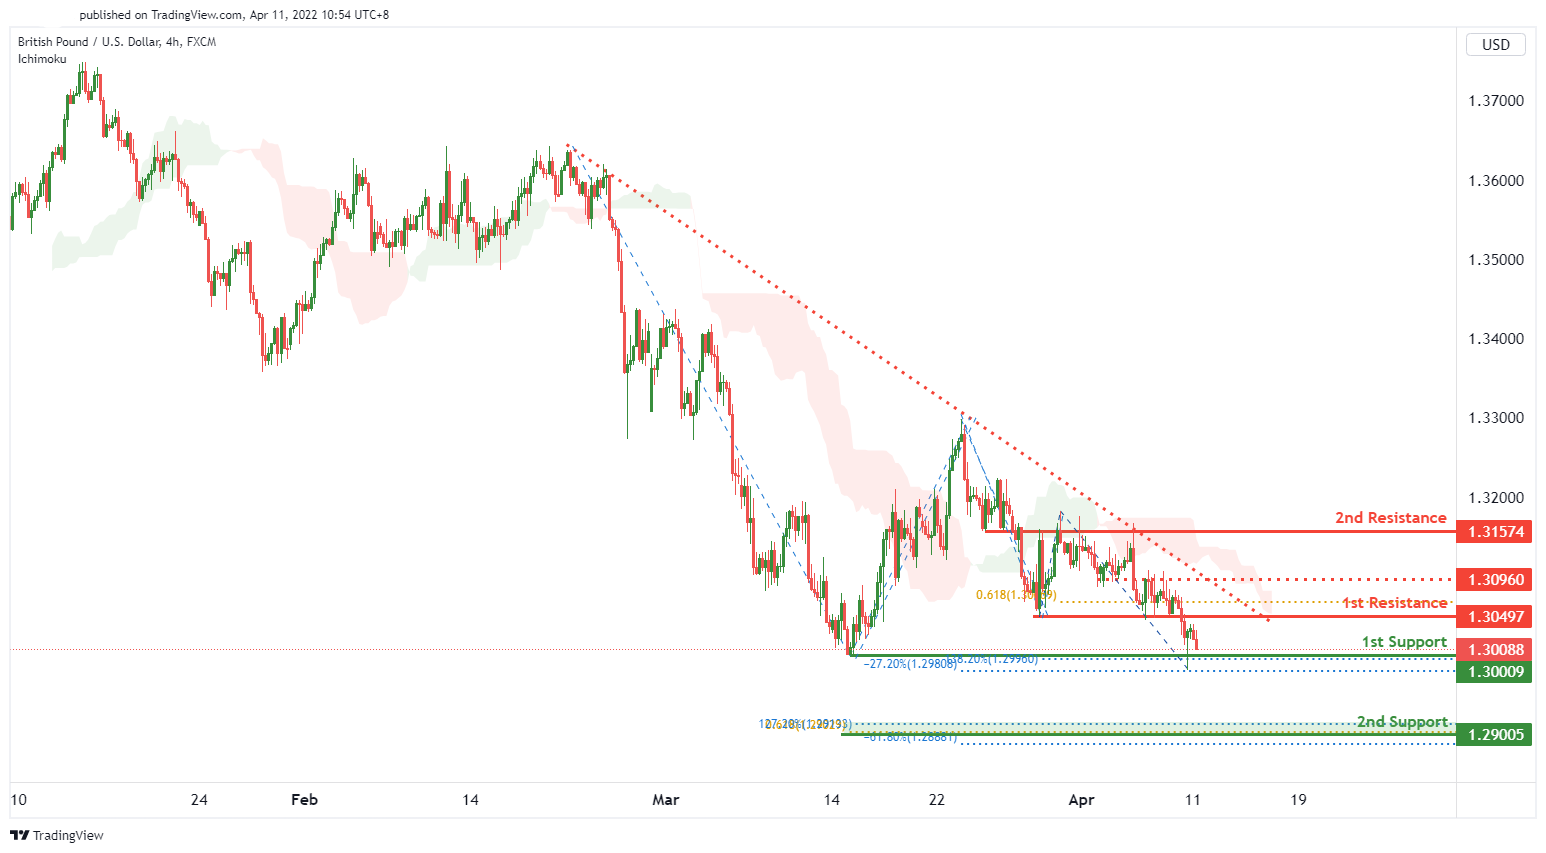
On the H4 timeframe, we expect to see a potential for bullish bounce from our 1st support level of 1.30009 in line with 138.2% Fibonacci extension and -27.2% Fibonacci expansion towards the 2nd resistance level of 1.31574 in line with a graphical overlap resistance. Alternatively, price might potentially dip from 1st resistance level of 1.30497 in line with 61.8% Fibonacci projection towards the 2nd support level of 1.29005 in line with Fibonacci confluence (61.8% Fibonacci projection, 127.2% Fibonacci extension and -61.8% fibonacci expansion). We have a neutral bias as we are waiting for price confirmation.
Areas of consideration:
- H4 1st resistance at 1.30497
- H4 1st support at 1.30009
USD/CHF:
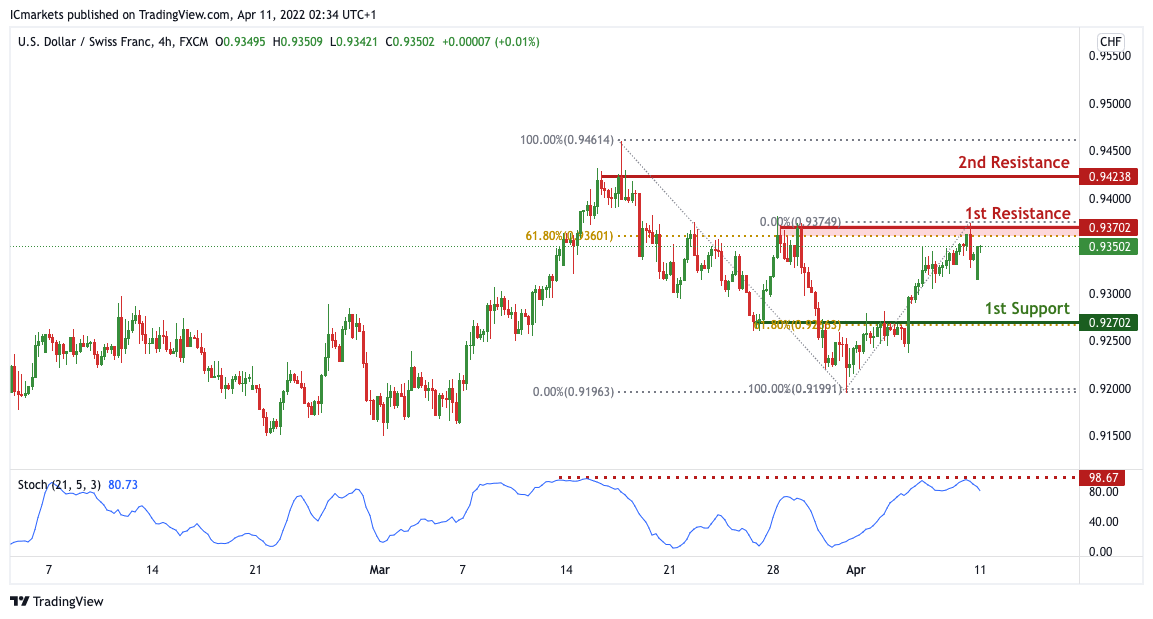
On the H4, with price expected to reverse off the stochastic indicator, we expect to see a potential for bearish drop from our 1st resistance of 0.93702 in line with the 61.8% fibonacci retracement towards our 1st support level at 0.92702 in line with 61.8% Fibonacci retracement. Alternatively, If price breaks out, it can potentially move towards our 2nd resistance level at 0.94238 which is in line with the swing high resistance.
Areas of consideration
- 1st support level at 0.92702
- 1st resistance level at 0.93702
EUR/USD :
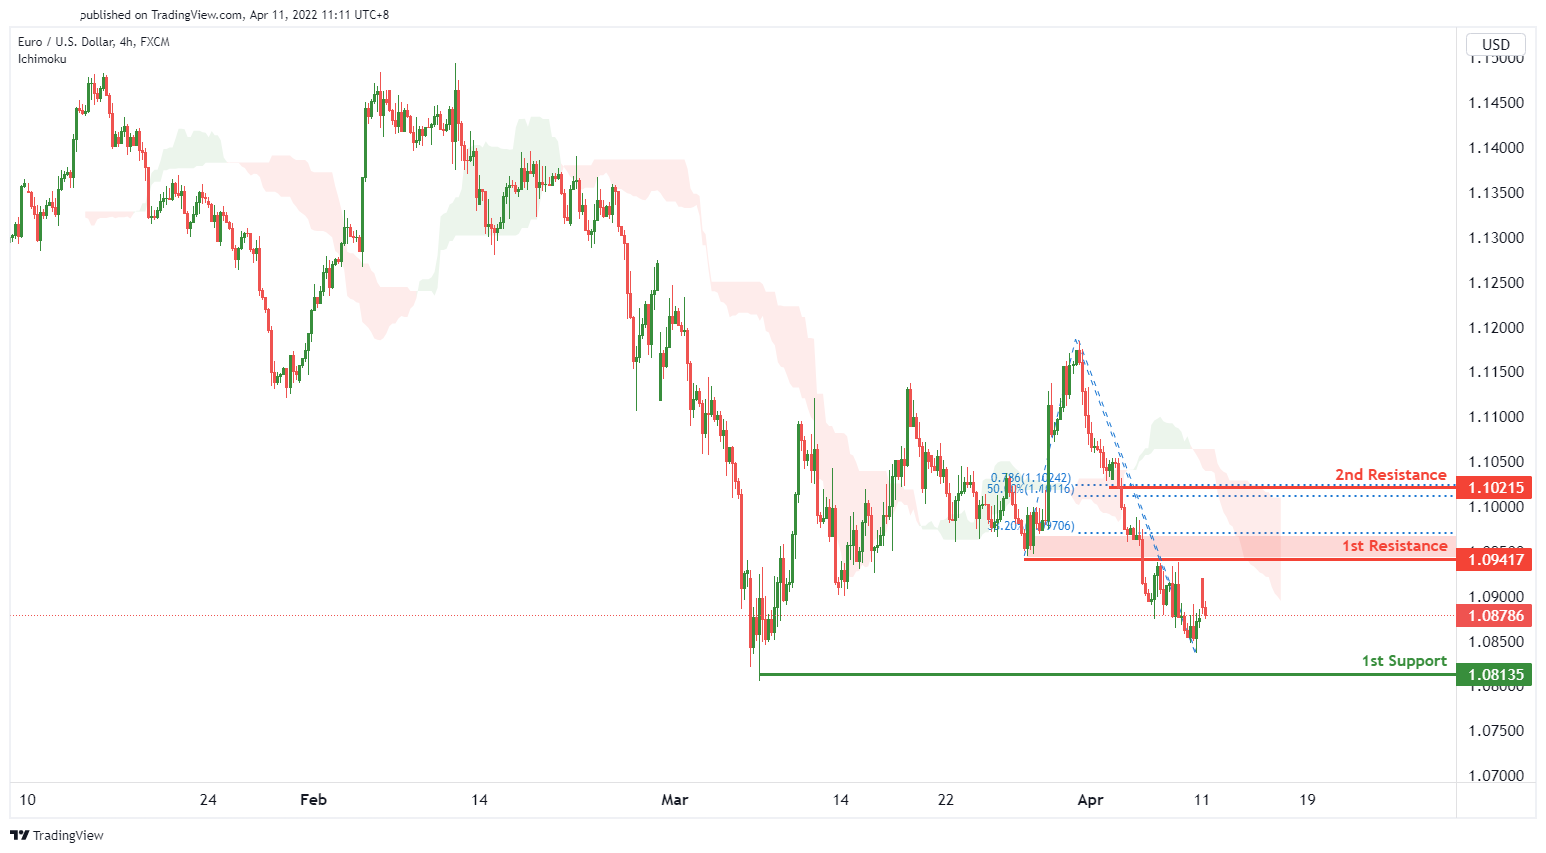
On the H4 timeframe, price is near a key pivot. We see the potential for a bearish reversal from our 1st resistance level of 1.09471 in line with 38.2% Fibonacci retracement towards our 1st support level of 1.08135 in line with a graphical swing low support. Our bearish bias is supported by price trading below the ichimoku cloud indicator.
Areas of consideration :
- H4 1st resistance at 1.09417
- H4 1st support at 1.08135
USD/JPY:
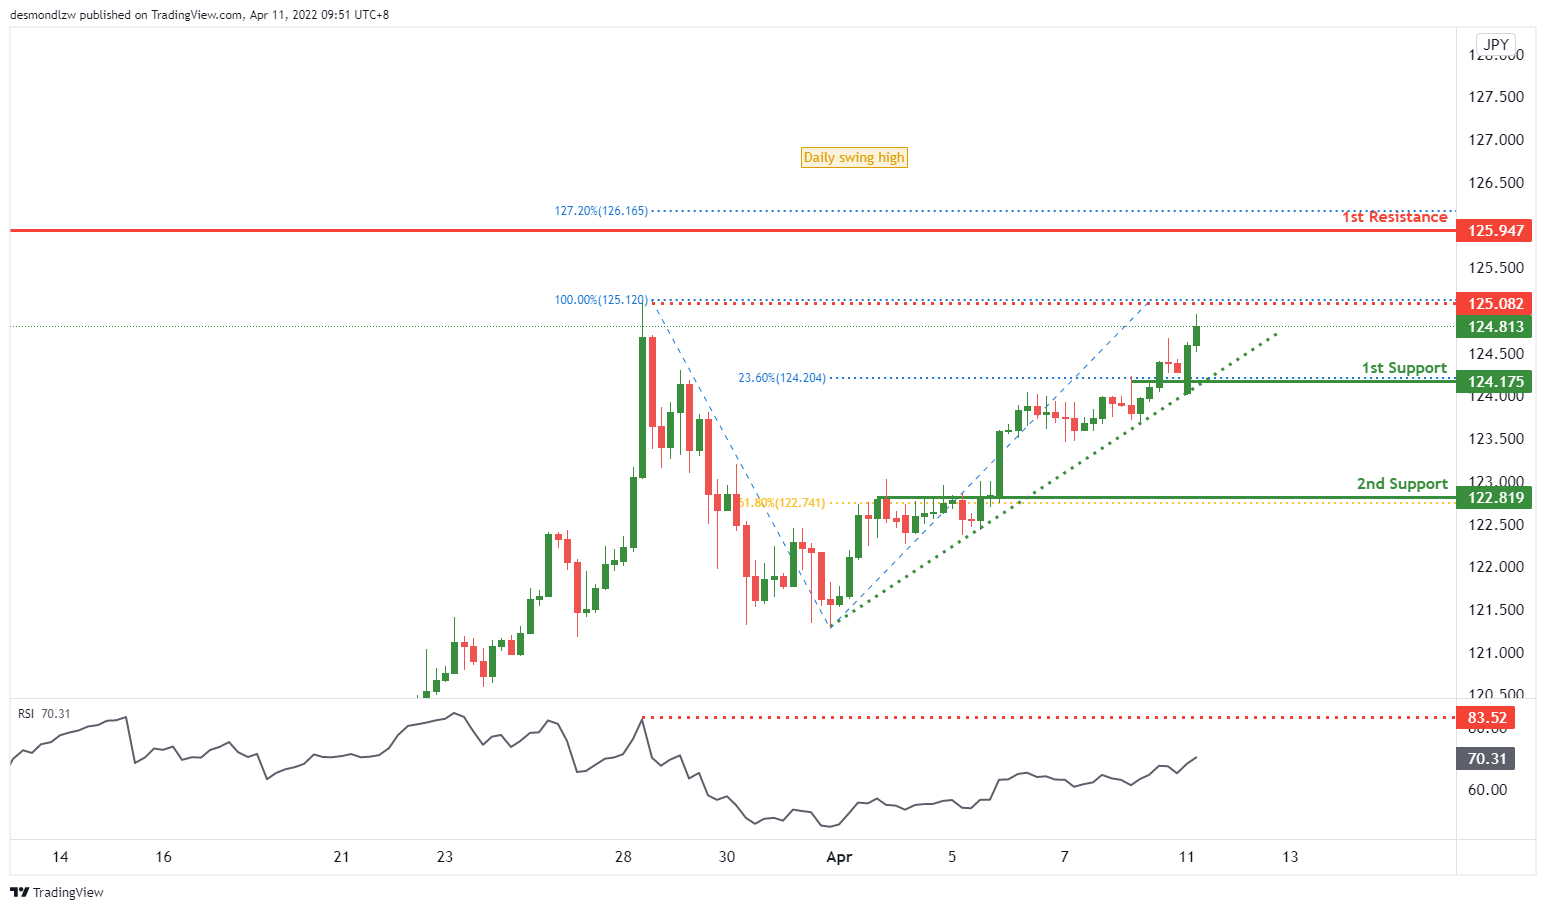
On the H4 timeframe, prices are on bullish momentum and abiding by an ascending trendline support. We see the potential for a bounce from our 1st support at 124.175 in line with 23.6% Fibonacci retracement. A break from our intermediate resistance at 125.082 in line with 100% Fibonacci Projection will find prices climbing towards our 1st resistance at 125.947 in line with 127.2% Fibonacci Extension and also daily swing high. Prices are trading above our ichimoku clouds, further supporting our bullish bias.
Areas of consideration:
- H4 time frame, 1st resistance at 125.947
- H4 time frame, 1st support at 124.175
AUD/USD:
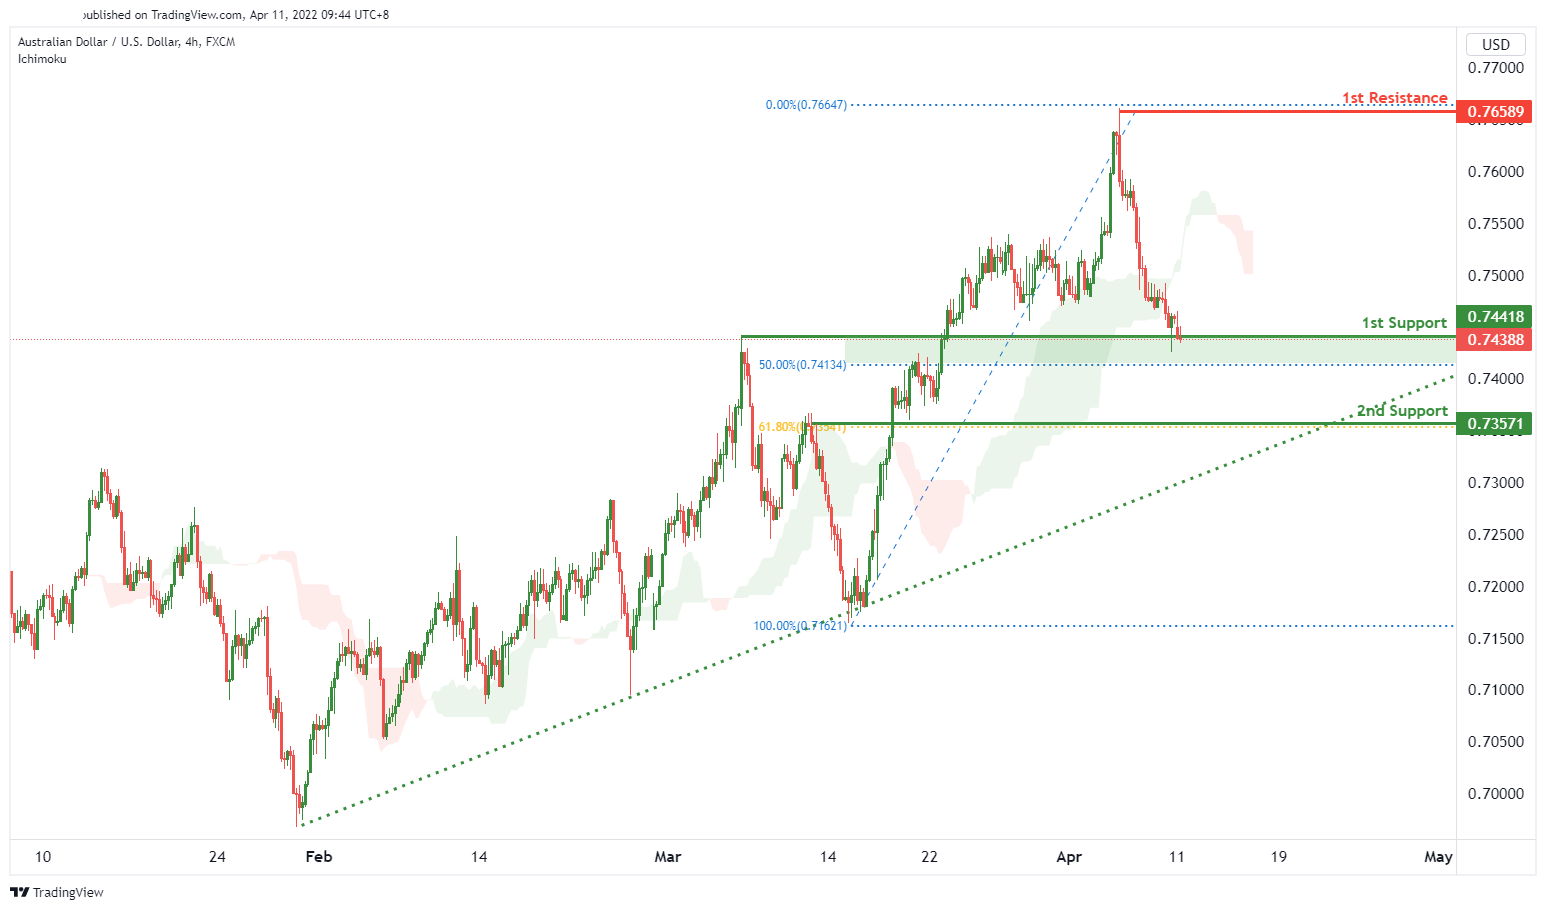
On the H4 timeframe, we see the potential for a bullish bounce from our 1st support level at 0.74261 in line with 50% Fibonacci retracement towards our 1st resistance at 0.75406 in line with 50% Fibonacci retracement and 61.8% Fibonacci projection. Our bullish bias is supported by price trading above the ichimouku cloud indicator.
Areas of consideration
- H4 1st resistance at 0.75406
- H4 1st support at 0.74261
NZD/USD:
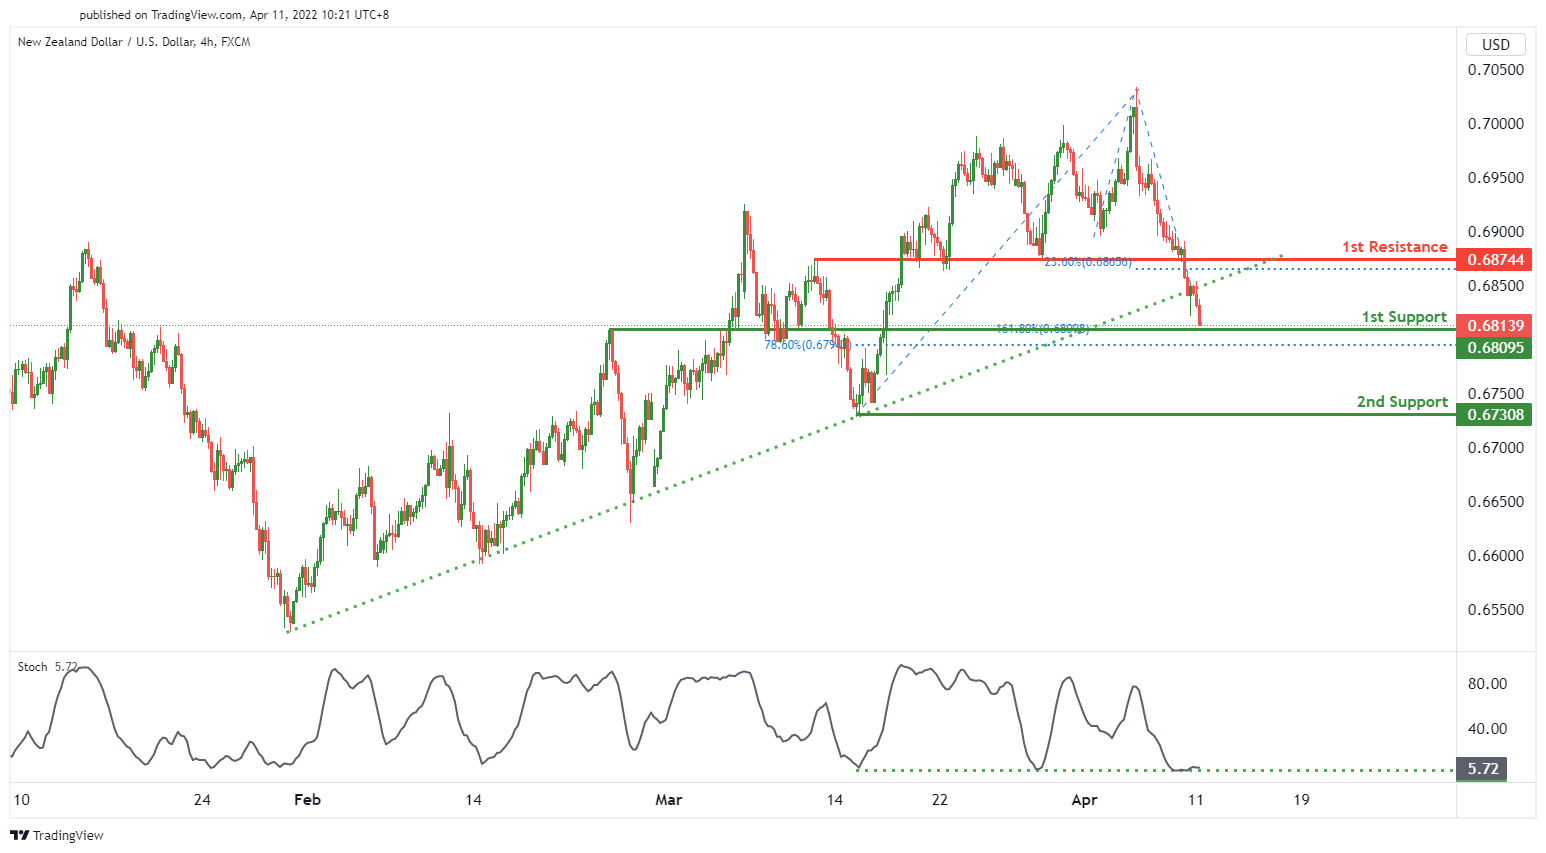
On the H4, we expect to see a potential for a bullish bounce from our 1st support of 0.68095 in line with the 78.6% fibonacci retracement and 161.8% Fibonacci extension towards our 1st resistance level at 0.68744 in line with the 23.6% Fibonacci retracement. Our bullish bias is supported by the stochastic indicator where price is at support level. Alternatively, If price breaks out, it can potentially move towards our 2nd support level at 0.67308 which is in line with the swing low support.
Areas of consideration:
- H4 time frame, 1st support at 0.68095
- H4 time frame, 1st resistance at 0.68744
USD/CAD:
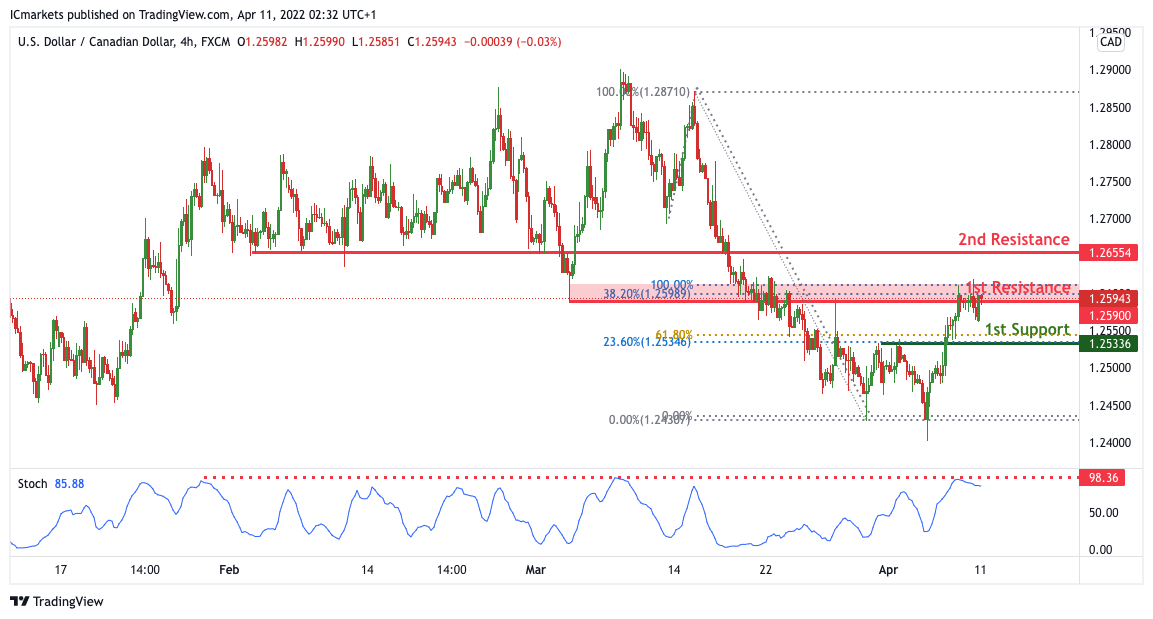
On the H4, with price expected to reverse off the stochastic indicator, we expect to see a potential for bearish drop from our 1st resistance of 1.25943 in line with the 38.2% fibonacci retracement and 100% Fibonacci projection towards our 1st support level at 1.25336 in line with 23.6% Fibonacci retracement and 61.8% Fibonacci retracement. Alternatively, If price breaks out, it can potentially move towards our 2nd resistance level at 1.26554 which is in line with the pullback support.
Areas of consideration:
- H4 time frame, 1st support at 1.25336
- H4 time frame, 1st resistance at 1.25811
OIL:
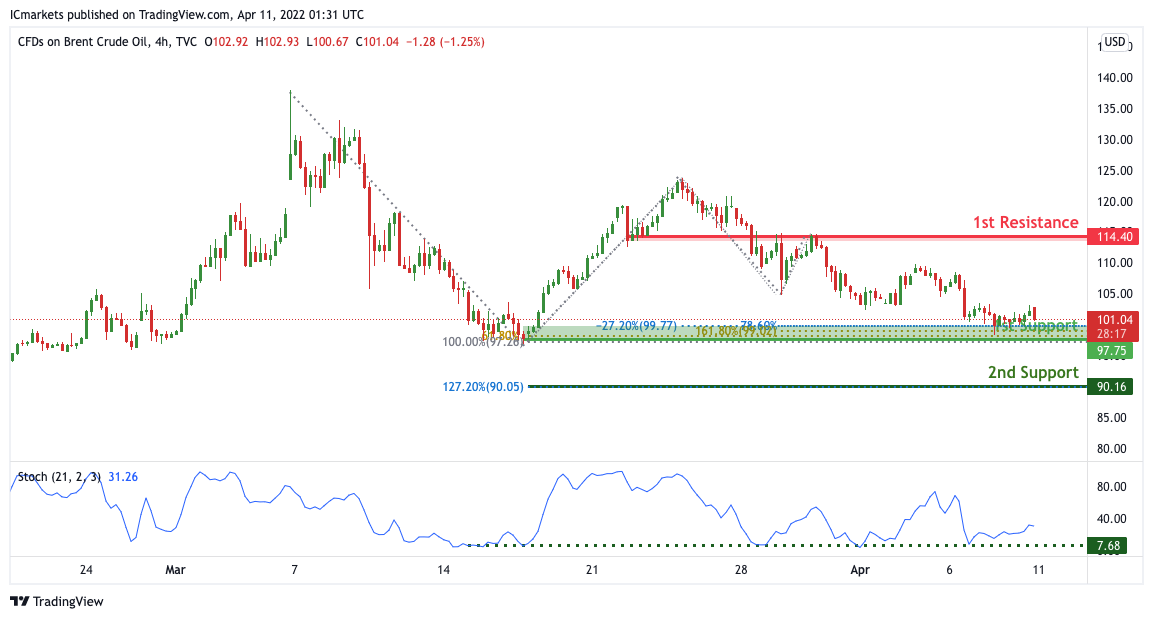
On the H4, with price expected to bounce off the support of the stochastics indicator, we have a bias that price will rise to our 1st resistance at 114.40 in line with the horizontal pullback resistance from our 1st support at 97.75 in line with the horizontal pullback support, 78.6% Fibonacci projection, 161.8% Fibonacci extension and -27.2% Fibonacci expansion. Alternatively, price may break 1st support structure and head for 2nd support at 90.16 in line with the 127.2% Fibonacci extension
Areas of consideration:
- H4 time frame, 1st resistance of 114.40
- H4 time frame, 1st support of 97.75
Dow Jones Industrial Average:
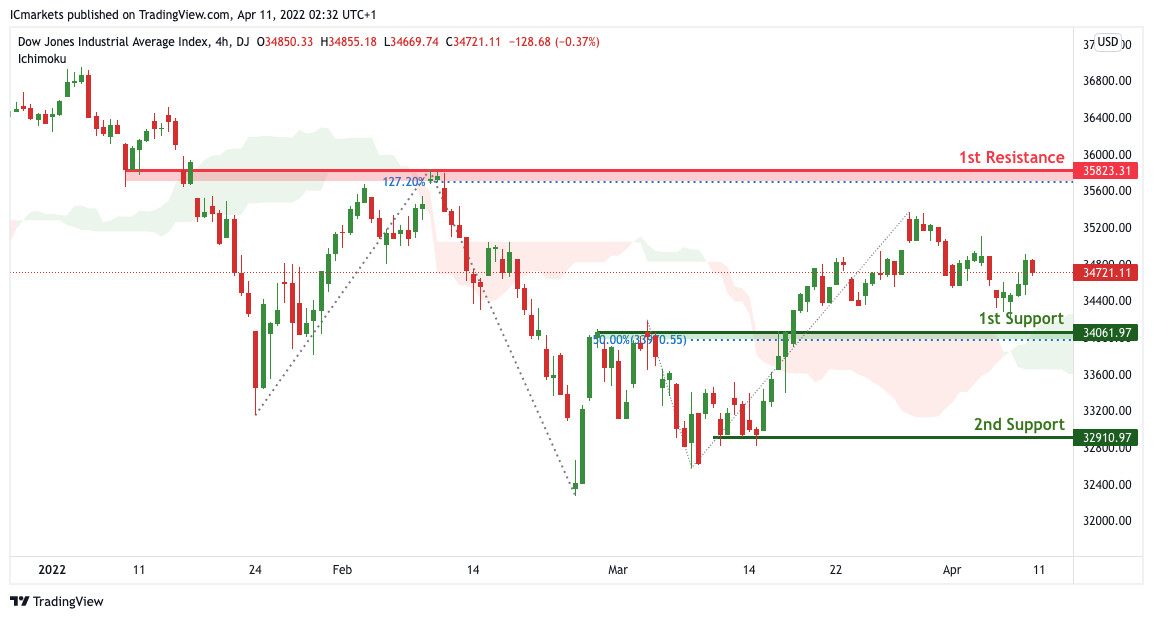
On the H4, with price moving above the ichimoku cloud, we have a bias that price will rise to our 1st resistance at 35823 in line with the 127.2% Fibonacci extension from our 1st support at 34061 in line with the horizontal pullback support and 50% Fibonacci retracement. Alternatively, price may break 1st support structure and head for 2nd support at 32910 in line with the horizontal swing low support.
Areas of consideration :
- H4 1st support at 34569
- H4 1st resistance at 35823
EUR/USD Resumes Decline, Upsides Could Be Limited
Key Highlights
- EUR/USD extended decline below the 1.0950 support.
- It broke a key bullish trend line with support near 1.0980 on the 4-hours chart.
- GBP/USD dived and tested the 1.2980 support zone.
- Gold price could attempt a move above the $1,950 resistance.
EUR/USD Technical Analysis
The Euro started a fresh decline from well above the 1.1150 level against the US Dollar. EUR/USD declined below the 1.1050 support to move into a bearish zone.
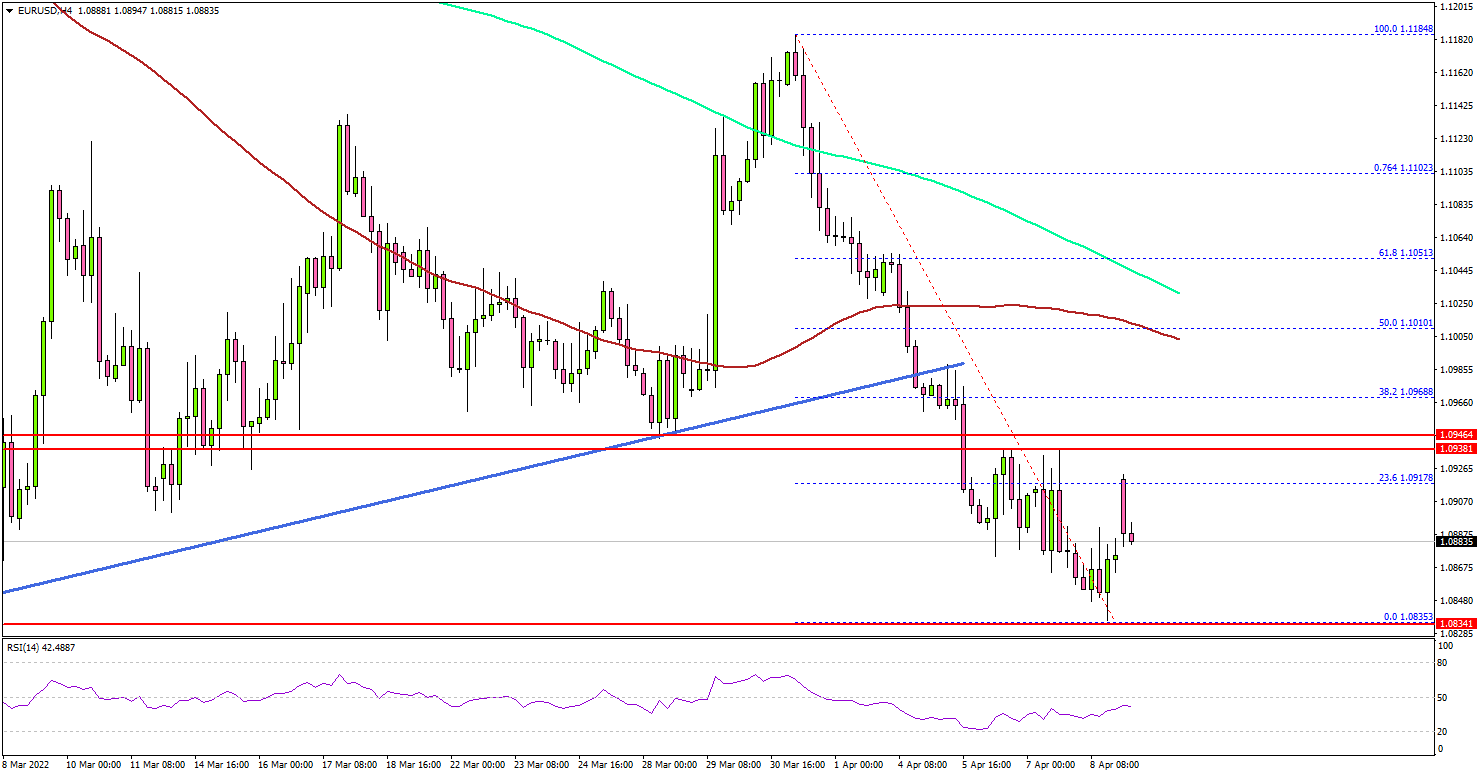
Looking at the 4-hours chart, the pair even traded below the 1.1000 level, the 200 simple moving average (green, 4-hours), and the 100 simple moving average (red, 4-hours).
There was a break below a key bullish trend line with support near 1.0980 on the same chart. The pair traded as low as 1.0835 and is currently consolidating losses. An immediate resistance on the upside is near the 1.0915 level.
The first major resistance is near the 1.0950 level (the previous support zone). The next major resistance is near the 1.1000 level. Any more gains might send the pair towards the 1.1050 level in the coming sessions.
On the downside, an immediate support is near the 1.0840 level. The next major support is near the 1.0820 level. A downside break below the 1.0820 support level might send the pair towards the 1.0750 level.
Looking at GBP/USD, the declined sharply and even spiked below the 1.3000 level. However, the bulls took a stand and protected the 1.2980 level.
Economic Releases
- UK Industrial Production for Feb 2022 (MoM) - Forecast +0.4%, versus +0.7% previous.
- UK Manufacturing Production for Feb 2022 (MoM) – Forecast +0.4%, versus +0.8% previous.
Eco Data 4/11/22
[php_everywhere instance="1"]
Forex and Cryptocurrencies Forecast
EUR/USD: Three reasons for the Strengthening of the Dollar
The proponents of a stronger dollar won by a very small margin in the previous forecast. 50% of analysts voted for its growth, 40% were against and 10% took a neutral position. The reason for such uncertainty and disagreement was that the market seemed to have already taken into account the increase in the dollar interest rate in 2022 for the quotes. However, despite this, the US currency has continued its growth. The DXY index has gained about 2% over the last week, and the EUR/USD pair, as predicted by bearish supporters, has broken through the support in the 1.0950-1.1000 zone and is aiming at the March 07 low of 1.0805. True, it has not yet managed to reach it, and the pair finished at 1.0874.
So why is the dollar continuing to gain strength? There are three reasons for this. The first is the Fed's monetary policy, which is becoming increasingly tight. We are now talking about reducing the balance sheet, which the US regulator intends to reduce by more than $1 trillion a year. And this is equivalent to an additional 3-4 increases in the refinancing rate in 2022-23, 25 basis points each. US Treasury yields will also rise, making the dollar more attractive.
The second and third causes are located on the other side of the Atlantic, in Europe. These are the presidential elections in France and new sanctions against Russia because of the armed conflict in Ukraine.
The first round of elections will be held on Sunday 10 April. French opposition leader Marine Le Pen is Eurosceptic. Please note that she almost called for the exit of the country from the Eurozone in 2017. And even if the opposition loses the election, it will still put a spoke in the wheels of European integration. But if Marine Le Pen comes to power, the pan-European currency will certainly not do well. According to some analysts, the EUR/USD pair may fall to the level of 1.0500 or even lower.
As for sanctions, we have repeatedly said that they negatively affect not only the Russian economy, but also the EU. First of all, because of the strong dependence of the European Union on Russian energy resources. In addition, one can add here the risks of Russia using nuclear weapons and the fact that military operations could turn into a catastrophe many times greater than Chernobyl.
The most important event of the coming week will be the ECB meeting and the subsequent press conference of its leadership on Thursday April 14. The probability that the interest rate will remain at the previous zero level is very high. However, investors hope to receive signals on how the European regulator plans to respond to internal and external challenges.
In the meantime, 45% of analysts vote for further strengthening of the dollar. The opposite opinion is shared by 35% and the remaining 20% of experts have taken a neutral position. All trend indicators and oscillators on D1 are colored red, although 25% of the latter give signals that the pair is oversold.
The nearest target for EUR/USD bears will be March 7 low 1.0805. And if they manage to break through this support, they will then aim for the 2020 low of 1.0635 and the 2016 low of 1.0325.
The bulls will try to lift the pair above the level of 1.1000, to overcome the resistance at 1.1050 and, if possible, to reach the zone of 1.1120-1.1137. Their next target is the March 31 high of 1.1184.
In addition to the European Central Bank meeting, next week's economic calendar includes the release of German consumer data on Tuesday, April 12 and US consumer data on April 12 and 14. April 15 in the United States and most European countries is a day off, Good Friday.
GBP/USD: Fed Hawks and Bank of England Doves
The key and very strong support for the pair is the low of March 15 (and at the same time of 2021-2022), 1.3000. The GBP/USD bears went to break through it, reaching 1.2981 on April 08 during the US session. It seems that European traders, including British ones, are hesitant. But the Americans treat European currencies with disdain, to put it mildly, and continue to put pressure on them against the backdrop of the hawkish minutes of the Fed meeting and the comments of the top leaders of this regulator. As for their colleagues from the Bank of England, the latest comments of these officials were very soft, and raised doubts in the market as to whether the Bank will be able to justify the expectations of tightening monetary policy.
The last chord of the week after the rebound sounded at 1.3031. If the GBP/USD pair still manages to consolidate below 1.3000, this will open the way for it to the November 2020 lows around 1.2850, and then to the lows of September 2020 in the 1.2700 zone. This development is supported by only 35% of analysts. The remaining 65% are waiting for a correction to the north, and here the levels 1.3050, 1.3100 and the zone 1.3185-1.3215 will act as resistance, then 1.3270-1.3325 and 1.3400. All indicators on D1, as in the case of EUR/USD, point south, 15% of oscillators signal the pair is oversold.
As for the events concerning the economy of the United Kingdom, we can highlight the publication of data on the country's GDP and industrial production on Monday April 11, as well as on retail sales on Tuesday April 12. We will receive a package of information from the UK labor market on the same day, and we will get information from its consumer market on Wednesday, April 13.
USD/JPY: Japanese Are Against A Weak Yen
We titled our previous review as "125.09: No More Anti-Records?". After a week, we can say that not yet, there will not be. And although the USD/JPY pair was moving north for a while, it fixed a local maximum at 124.67 this time, and ended the trading session at 124.36.
Recall that due to the super-soft monetary policy of the Bank of Japan, the yen continued to weaken, and the USD/JPY pair reached a record multi-year level of 125.09 on March 28, which is not far from the 2015 high of 125.86.
There are no expected releases of any important statistics on the state of the Japanese economy this week. The only thing that can be noted is the speech of the head of the Bank of Japan, Haruhiko Kuroda, on Wednesday, April 13. But it is unlikely to pull on a sensation. Although here one should take into account the statement of Hideo Hayakawa, the former chief economist of this organization, that against the background of the weakening yen, the Japanese Central Bank may adjust the parameters of monetary policy in July. "While the Bank of Japan has repeatedly said that the weak yen is positive for the economy as a whole, in reality this impact is close to 50/50, and household discomfort will increase further as inflation in Japan rises as well. The vast majority of Japanese do not welcome the weak yen," Hideo Hayakawa said on April 8. In his opinion, "it is too naive for the Bank of Japan to say that a weak yen is good when the government takes measures to solve the problem of rising prices and limiting gasoline prices."
Strategists at Rabobank also believe that a quick USD/JPY jump above 125.00 increases seriously the likelihood that the Japanese regulator will revise its quantitative easing (QE) program.
At the moment, the probability that the pair will try a second test of resistance in the 125.00-125.09 area is estimated as 50/50. However, when moving from a weekly forecast to a forecast for the second half of April and May, the vast majority (85%) of experts predict the strengthening of the Japanese currency and expect to see the pair in the 115.00-117.00 zone.
Among the indicators on D1, as in the previous two cases, there is complete unanimity: 100% of trend indicators and 100% of oscillators look up, although 25% of the latter are in the overbought zone. Given the high volatility of the pair, the zones 123.65-124.05, 122.35-123.00 and 121.30 can be identified as supports. Then follow the zones 120.60-121.30, 119.00-119.40, 118.00-118.35.
CRYPTOCURRENCIES: Correction or the Beginning of a New Collapse
Miners mined the anniversary 19 millionth bitcoin On Friday, April 01, out of the 21 million provided by the algorithm. That is, less than 10% is left to be mined. And this is it. Thanks to this, bitcoin, as conceived by its creator (or creators), will become a super-scarce asset, which will push its value further and further up. This is what many market participants are counting on.
The trend towards the accumulation of digital gold has continued lately. Analysts from the Glassnode company noticed that, in addition to the "whales", the so-called "shrimp" (addresses with a balance of less than 1 BTC) also contributed to the accumulation. Since the January 22 low, they have accumulated 0.58% of the market supply, bringing their share to 14.26%.
The volumes of accumulation began to exceed emission many times over. According to Glassnode, the rate of outflow of coins from centralized platforms has increased to 96,200 BTC per month, which is extremely rare in historical retrospect. Exchange balances fell to the levels of August 2018, breaking through the plateau observed since September 2021. The number of coins in bitcoin addresses that tend to accumulate rose by 217,000 BTC since December 04, 2021 to a record 2,854,000 BTC. Based on the figures presented, it is possible to obtain a daily accumulation rate of 1800 BTC, which is twice the emission rate.
This trend is confirmed by the report of the analytical company IntoTheBlock. According to it, the total amount of coins in the wallets of long-term investors reached a record 12 million BTC in Q1 2022 worth more than $551 billion. "This indicates a phase of accumulation, which can help strengthen faith in bitcoin as a store of value," IntoTheBlock believes.
The most fantastic forecast regarding the future of the main cryptocurrency has been given by analysts from the investment company VanEck. According to their calculations, the price of bitcoin could reach $4.8 million if the cryptocurrency becomes a global reserve asset. Such a forecast was obtained taking into account the M2 money supply, that is, the amount of cash in circulation and all kinds of non-cash funds. There is also a lower range - $1.3 million per 1 BTC, calculated based on the M0 money supply, which does not include non-cash funds.
VanEck analysts warn that their forecast is only intended to serve as a starting point for investors who want to estimate the possible value of bitcoin in one of the unlikely scenarios. At the same time, according to the authors of the forecast, it is not bitcoin at all, but the Chinese yuan that is the primary contender for the status of world reserve currency.
Even the most notorious crypto fans understand that millions of dollars per coin are still infinitely far away. However, as for the foreseeable future, a number of scenarios look quite optimistic here. Thus, Galaxy Digital CEO Mike Novogratz believes that the arrival of new investors and innovations, developments in politics and the economy, and the acceptance of bitcoin by the authorities improve the forecasts for BTC for 2022. "Initially, I said that bitcoin would have an unstable year, that the price would fluctuate in the range of $30,000 to $50,000. But given how the markets are trading, new investors and innovation, the development of the Web3 and the metaverse, I'm more optimistic. Therefore, I won't be surprised if cryptocurrencies grow significantly by the end of 2022," the billionaire said.
In his opinion, the adoption of bitcoin will continue as everyone understands what an unstable world we live in. "Bitcoin began to write a new history at a time when Europe and the United States blocked Russia's financial flows. The military action in Ukraine creates a lot of inflationary pressure, generates a lot of risks and worries, but adds confidence to crypto investors and accelerates the adoption of digital assets," the CEO of Galaxy Digital said.
Raoul Pal, a former Goldman Sachs employee and current Real Vision CEO, shares a similar opinion. He said in the MetaLearn podcast that the world is ready for a new wave of bitcoin adoption, and a further fall in the market will have a beneficial effect on its growth. "Sovereign states, especially wealth funds, will start looking for a long-term asset that will provide some security. Therefore, bitcoin will be studied by them and we will see its further adoption - not necessarily as a currency, but as an asset. I think this is a very interesting solution: the global use of bitcoin as a protective collateral reserve asset."
According to Raul Pal, the macroeconomic situation suggests that the chances of another bitcoin sell-off are slim. Therefore, most market participants are likely to stick to a long-term strategy and not actively trade cryptocurrencies.
However, digital gold stopped rising after reaching a high of $48,156 on March 28. The bulls have not been able to push the BTC/USD pair above the 200-day moving average, and at the time of writing, on the evening of April 08, it is trading around $43,000. The total market capitalization is below the important psychological level of $2 trillion, having fallen from $2.140 trillion to $1.985 trillion during the week. The Crypto Fear & Greed Index also began to feel worse, falling from neutral 50 to 37 points, which are already in the Fear zone.
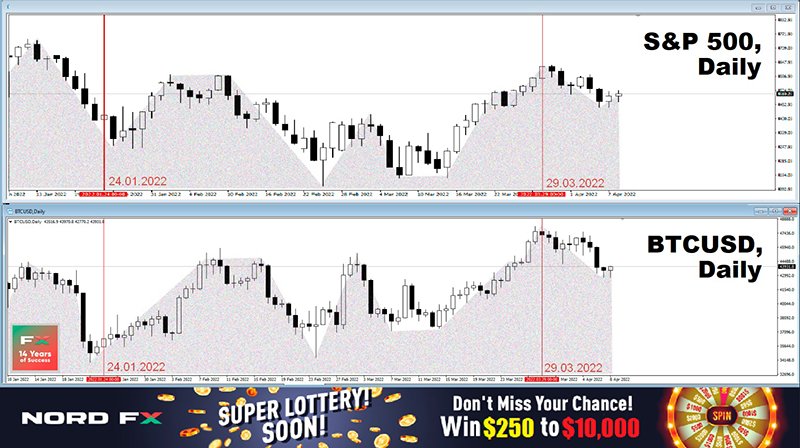
Renowned analyst and trader Cheds views the ascending triangle that has been forming since January 24 as a bullish sign. Such a triangle, he says, is usually a bullish continuation pattern. And in the event of an upside breakout, "the measurable move will be the height of the triangle, which will bring from $56,000 to $58,000."
At the same time, the expert advises traders to keep a close eye on the 200-day moving average as this technical indicator is currently acting as resistance. Chads believes that if the bulls manage to keep BTC above $45,000, the cryptocurrency will be ready to storm the SMA-200 resistance for a further 26% gain. Otherwise, the bulls face the risk of a sell-off.
As mentioned, BTC/USD is currently trading at $43,000, below Cheds' support. However, given the volatility of the flagship cryptocurrency, the victory of the bears cannot yet be considered complete. A breakthrough to the south may be false. Moreover, bitcoin has ceased to be independent. It was in 2010, when 10,000 BTC could buy two pizzas, when it lived its own life. Now it has matured and become part of the global economy. Bitcoin is now showing an almost complete cyclical correlation with the S&P 500, which has recently hit 0.9. And it falls after the US stock market. And the latter, in turn, depends on the risk appetites of global investors.
If the craving for risky assets recovers, the crypto market will also go up. Otherwise, according to some experts, we can expect the BTC/USD pair to decline to March lows near $37,000 per coin. The probability of quotes falling even lower, to $30,000, is also quite high.
EUR/USD Weekly Outlook
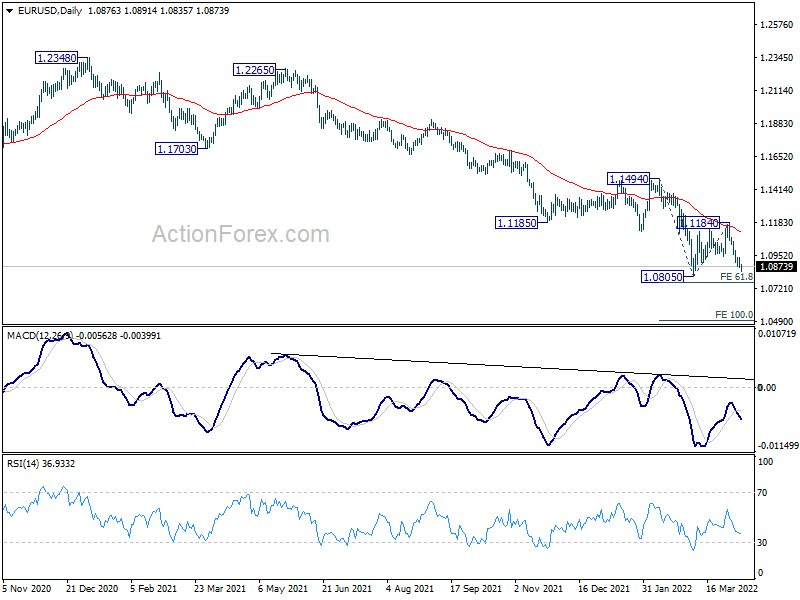
EUR/USD's fall from 1.1184 extended lower last week and the development suggests that corrective rebound from 1.0805 has completed. Initial bias remains on the downside this week first. Break of 1.0805 will resume larger down trend. Next target is 61.8% projection of 1.1494 to 1.0805 from 1.1184 at 1.0758, and then 100% projection at 1.0495. On the upside, above 1.0987 minor resistance will mix up the outlook and bring recovery.
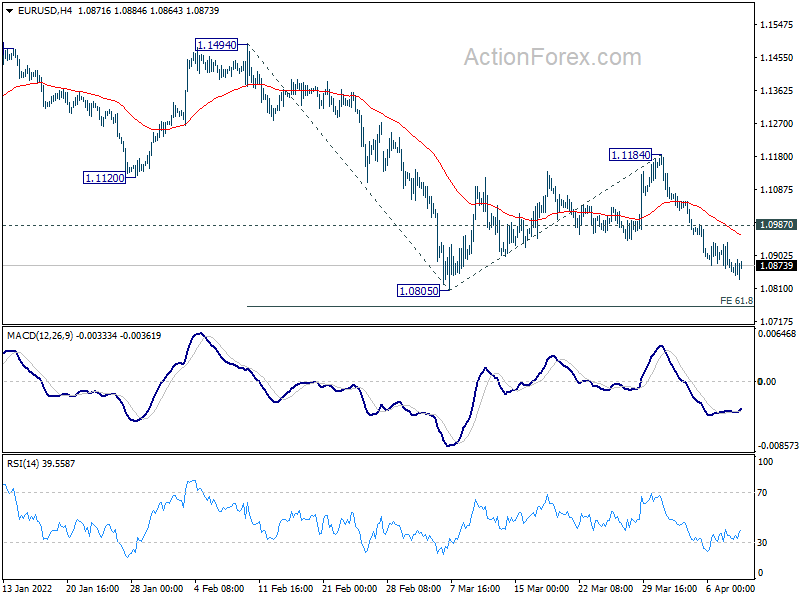
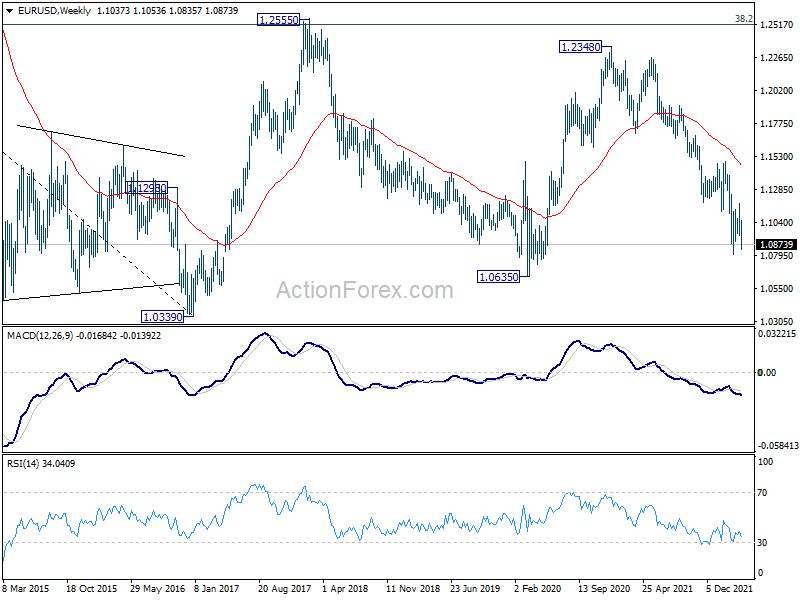
In the bigger picture, the decline from 1.2348 (2021 high) is expected to continue as long as 1.1494 resistance holds. Firm break of 1.0635 (2020 low) will raise the chance of long term down trend resumption and target a retest on 1.0339 (2017 low) next. Nevertheless, break of 1.1494 will maintain medium term neutral outlook, and extending term range trading first.
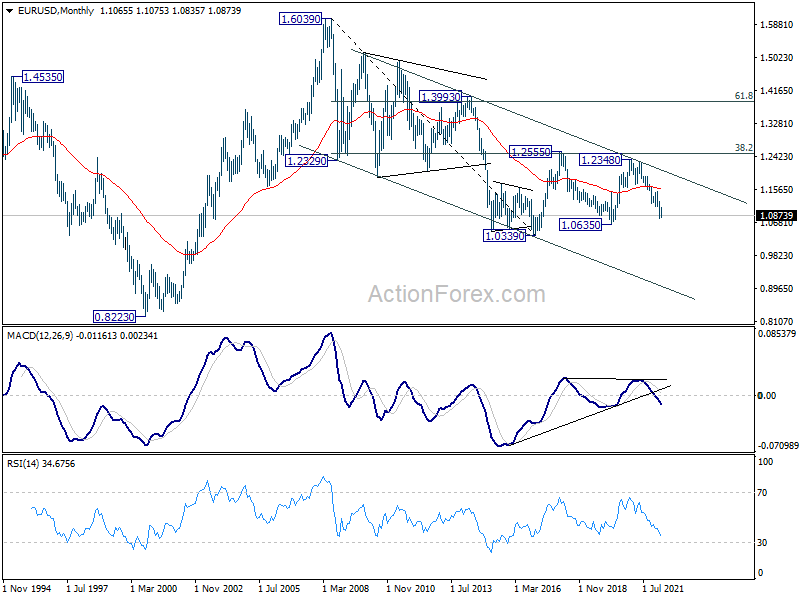
In the long term picture, in any case, as long as 38.2% retracement of 1.6039 (2008 high) to 1.0339 (2017 low) at 1.2516 holds, the down trend from 1.6039 could still resume through 1.0339 low. However, sustained trading above 1.2516 will argue that the long term trend has reversed.
USD/JPY Weekly Outlook
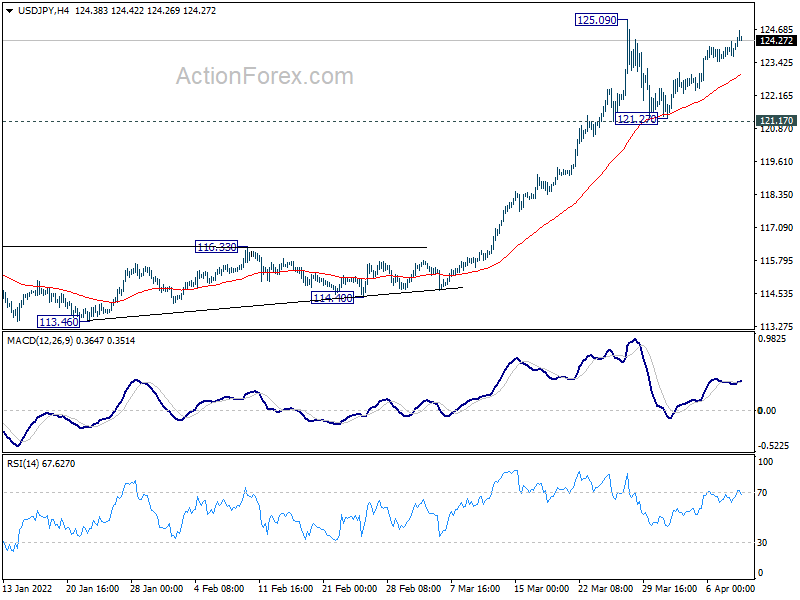
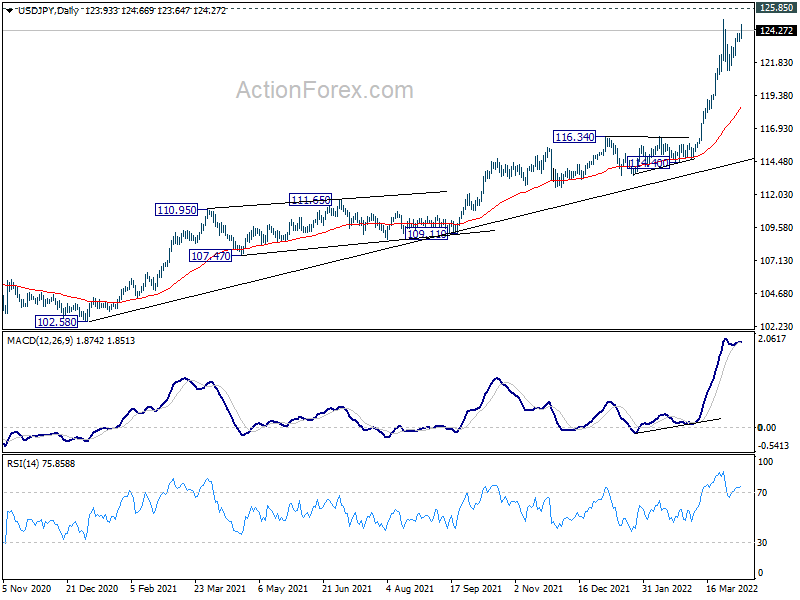
USD/JPY's rebound from 121.27 extended higher last week but upside was capped below 125.09 resistance. Initial bias remains neutral this week first. On the upside, firm break of 125.09 will resume larger up trend from 102.58. Further break of 125.85 long term resistance will pave the way to 130.04 long term projection level. Consolidation from 125.09 could still extend with another falling leg. But overall outlook will remain bullish as long as 121.17 support holds.
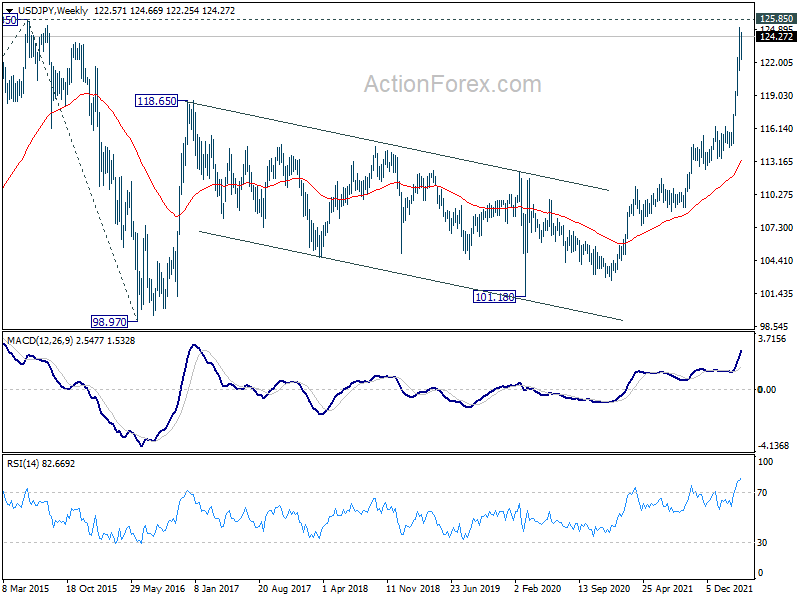
In the bigger picture, up trend from 98.97 (2016 low) is in progress for retesting 125.85 (2015 high). Sustained break there will confirm long term up trend resumption. Next target will be 61.8% projection of 75.56 (2011 low) to 125.85 (2015 high) from 98.97 at 130.04. This will now remain the favored case as long as 116.34 resistance turned support holds.
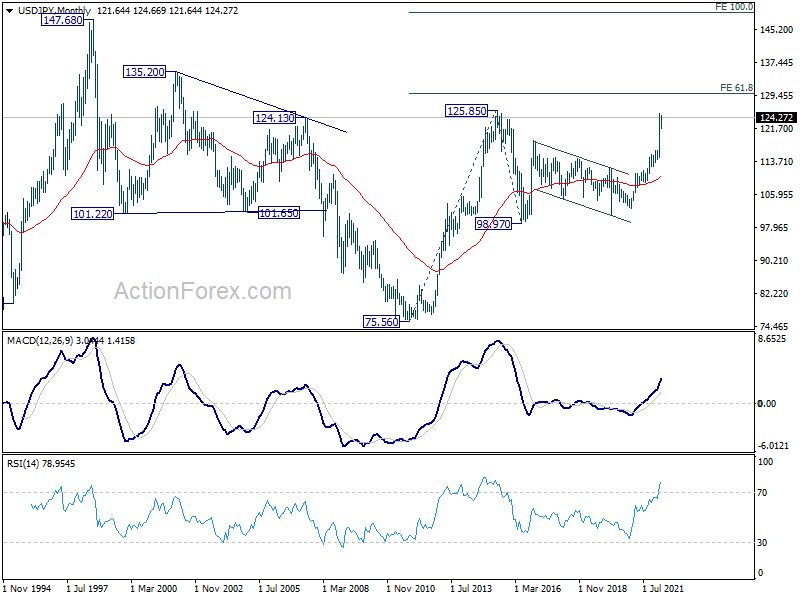
In the long term picture, the rise from 75.56 (2011 low) long term bottom to 125.85 (2015 high) is viewed as an impulsive move, no change in this view. Price actions from 125.85 are seen as a corrective pattern that might have completed at 98.97 already. Firm break of 125.85 will target 61.8% projection of 75.56 to 125.85 from 98.97 at 130.04. Next is 100% projection at 149.26, which is close to 147.68 (1998 high).
GBP/USD Weekly Outlook
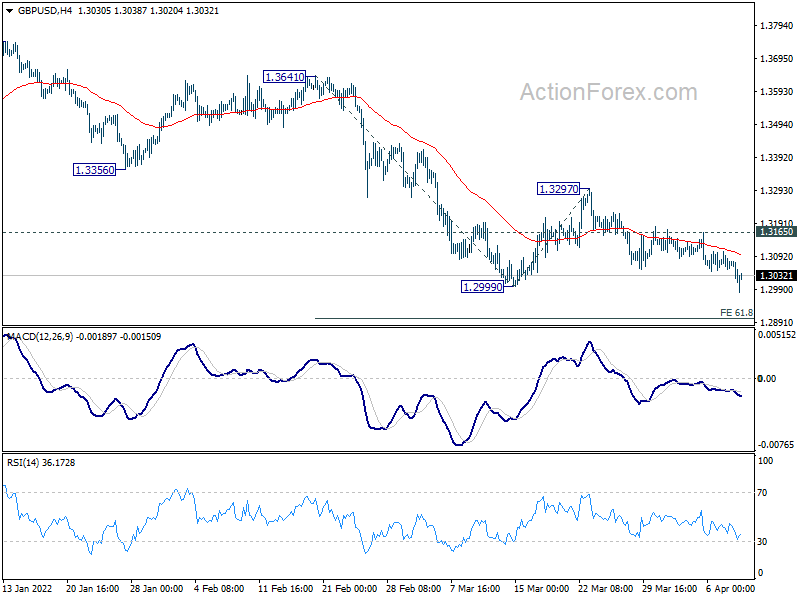
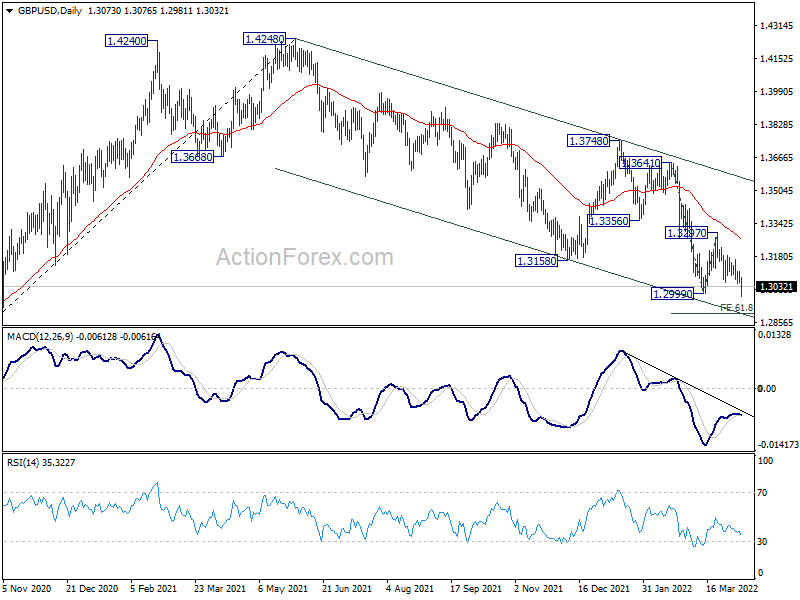
GBP/USD's break of 1.2999 support last week indicates resumption of larger down trend from 1.4248. Initial bias is now on the downside this week. Next target is 61.8% projection of 1.3641 to 1.2999 from 1.3297 at 1.2900. On the upside, break of 1.3165 resistance is needed to indicate short term bottoming. Otherwise, outlook will remain bearish in case of recovery.
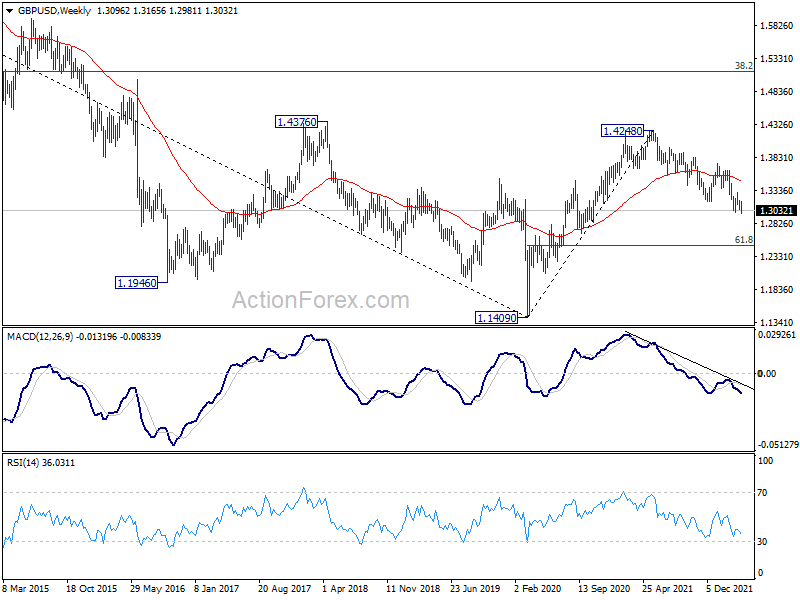
In the bigger picture, rise from 1.1409 (2020 low) has completed at 1.4248. Decline from 1.4248 could still be a corrective move, or it could be the start of a long term down trend. In either case, deeper decline would be seen back to 61.8% retracement of 2.1161 to 1.1409 at 1.2493. In any case, break of 1.3748 resistance is needed confirm completion of the fall from 1.4248, or outlook will stay bearish.
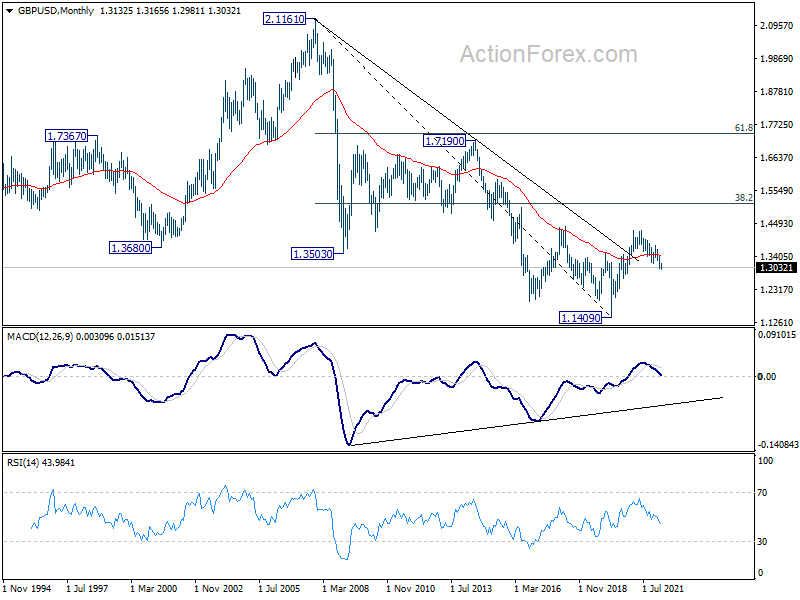
In the longer term picture, rebound from 1.1409 long term bottom could have completed at 1.4248 already, well ahead of 38.2% retracement of 2.1161 to 1.1409 at 1.5134. The development argues that price actions from 1.1409 are developing into a corrective pattern only. That is, long term bearishness is retained for resuming the downside from 2.1161 (2007 high) at a later stage.
USD/CHF Weekly Outlook
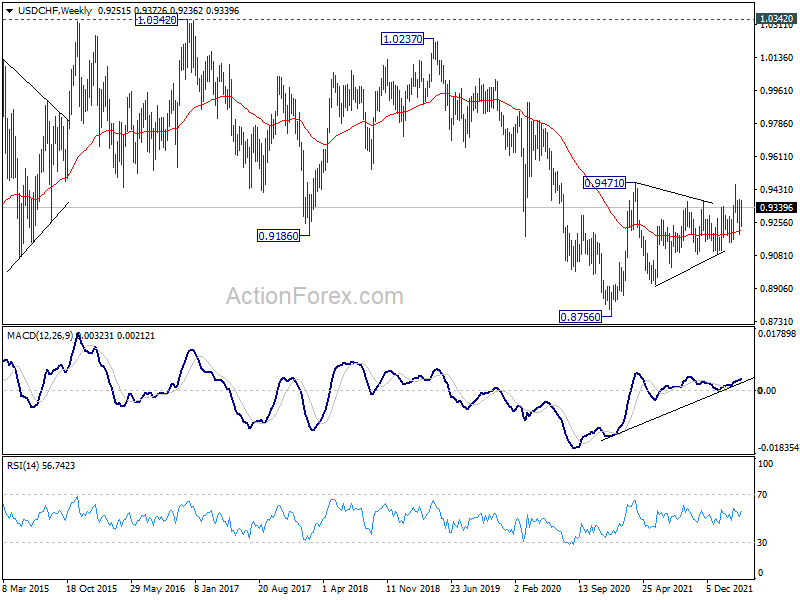
USD/CHF's rebound from 0.9193 extended higher last week but stayed below 0.9380 resistance. Initial bias remains neutral this week first. On the upside, firm break of 0.9380 should confirm that fall from 0.9459 has completed with three wave down to 0.9193. Such development will revive near term bullishness and turn bias back to the upside for 0.9459 and then 0.9471 resistance. On the downside, below 0.9280 minor support will turn bias to the downside for 0.9193 support next.
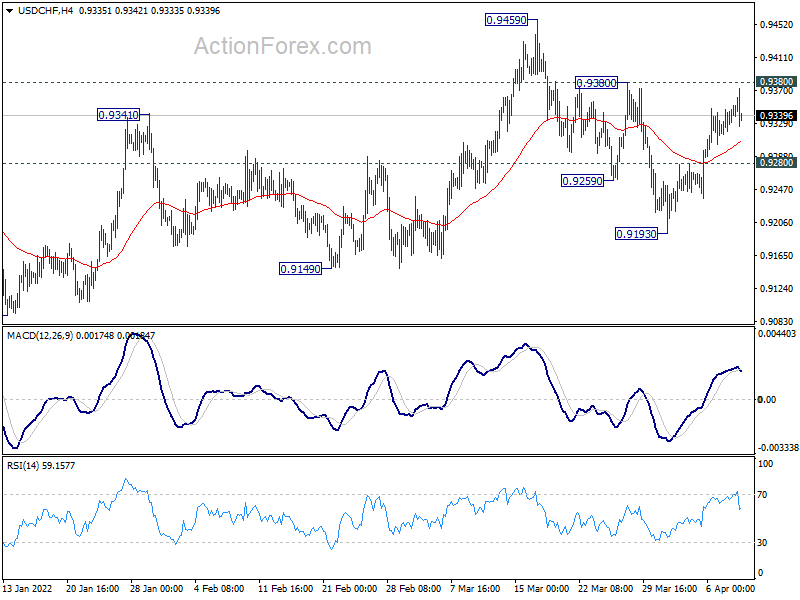
In the bigger picture, medium term outlook will be neutral at best as long as 0.9471 resistance holds. Larger down trend could still extend through 0.8756 (2021 low). However, firm break of 0.9471 will argue that whole down trend form 1.0342 (2016 high), has completed with waves down to 0.8756. A medium term up trend should be set up to target 1.0237/0342 resistance zone.
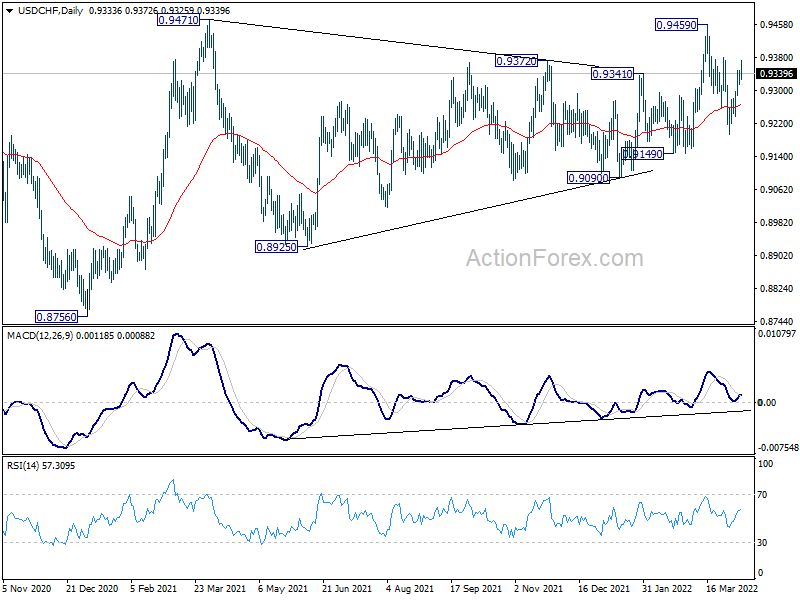
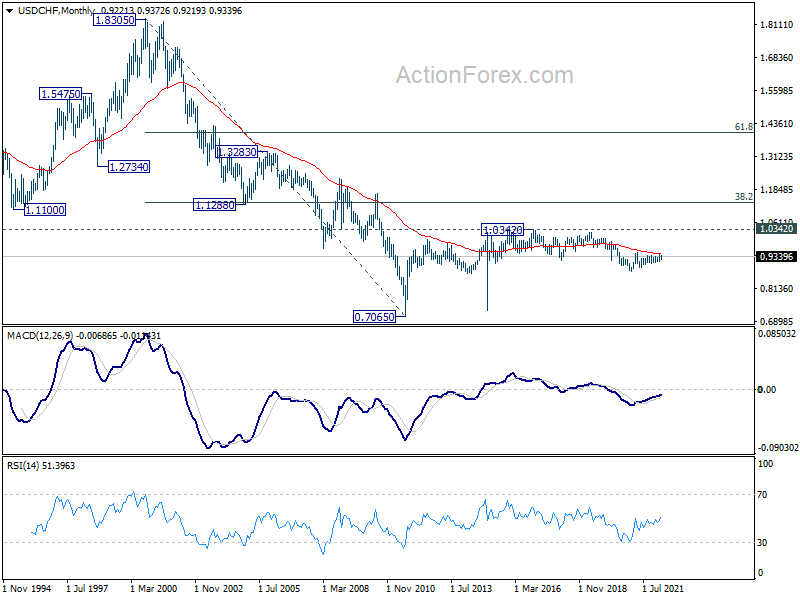
In the long term picture, price actions from 0.7065 (2011 low) are currently seen as developing into a long term corrective pattern, at least until a firm break of 1.0342 resistance.