

Sample Category Title
USD/JPY Daily Outlook
Daily Pivots: (S1) 123.49; (P) 123.77; (R1) 124.07; More...
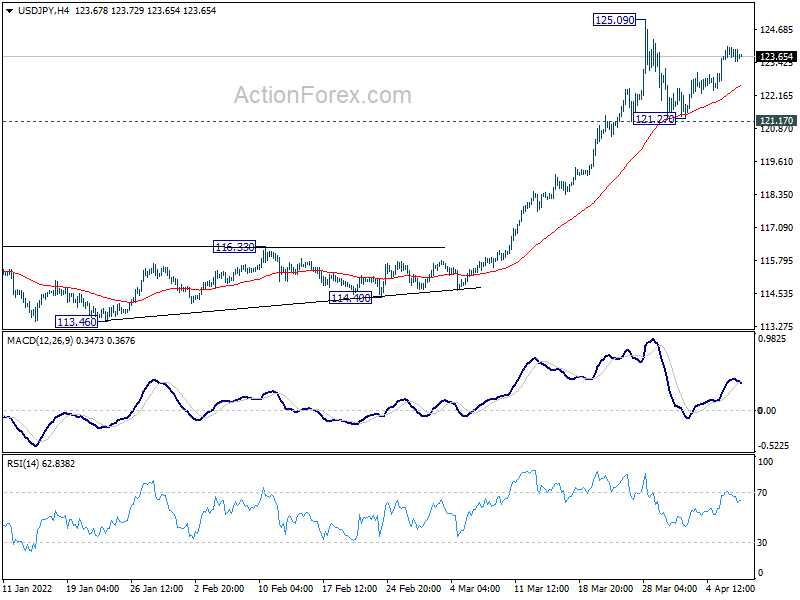
USD/JPY is staying in consolidation from 125.09 and intraday bias remains neutral for the moment. Outlook stays bullish with 121.17 support intact and further rise is expected. On the upside, break of 125.09 will target 125.85 long term resistance. Firm break pave the way to 130.04 long term projection level. However, break of 121.17 will turn bias back to the downside for deeper pull back.
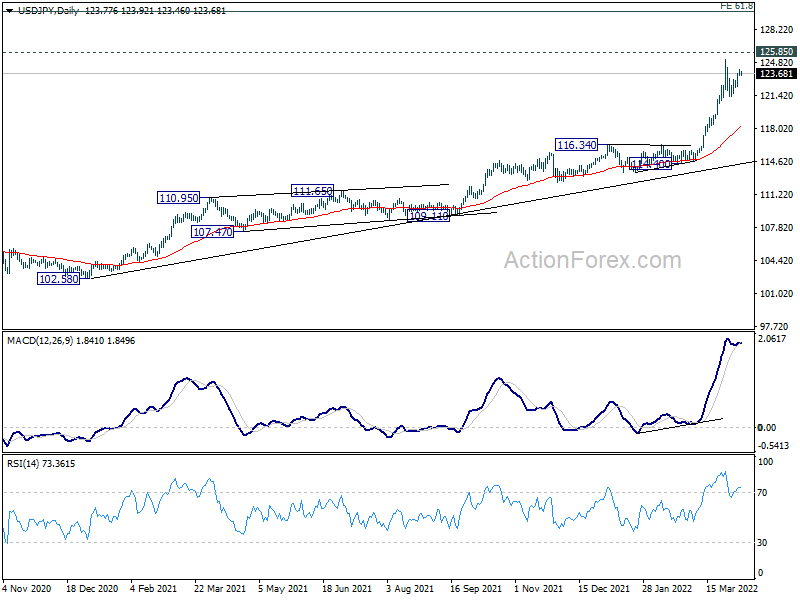
In the bigger picture, up trend from 98.97 (2016 low) in in progress for retesting 125.85 (2015 high). Sustained break there will confirm long term up trend resumption. Next target will be 61.8% projection of 75.56 (2011 low) to 125.85 (2015 high) from 98.97 at 130.04. This will now remain the favored case as long as 116.34 resistance turned support holds.
AUD/USD Daily Report
Daily Pivots: (S1) 0.7466; (P) 0.7530; (R1) 0.7573; More...
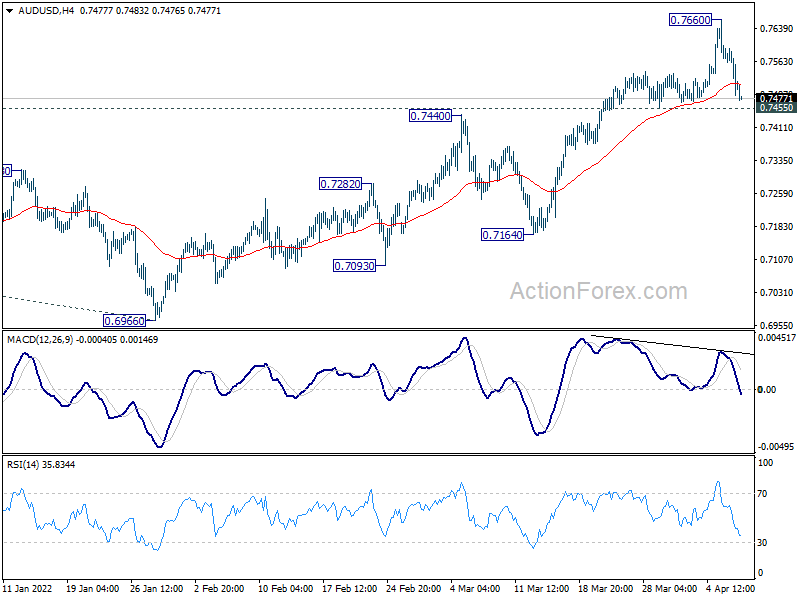
Intraday bias in AUD/USD remains neutral and outlook is unchanged. Further rise is expected as long as 0.7455 support holds. As noted before, whole corrective decline from 0.8006 should have completed at 0.6966 already. Break of 0.7660 will resume the rise from 0.6966 to retest 0.8006 high. However, firm break of 0.7455 will dampen this bullish view, and turn bias back to the downside for 0.7164 support instead.
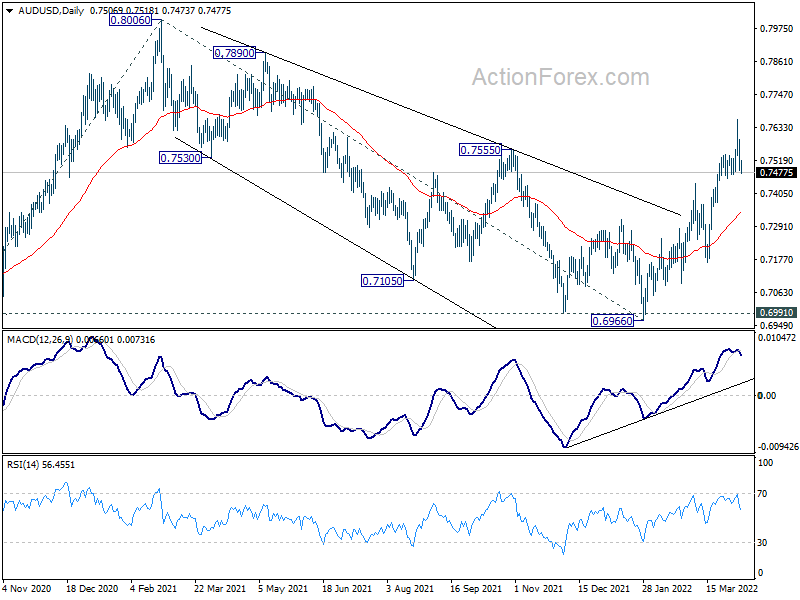
In the bigger picture, correction from 0.8006 could have completed at 0.6966, after drawing support from 0.6991. That is, up trend from 0.5506 (2020 low) might be ready to resume. Firm break of 0.8006 will target 61.8% projection of 0.5506 to 0.8006 from 0.6966 at 0.8511 next. This will remain the favored case as long as 0.7164 support holds.
USD/CAD Daily Outlook
Daily Pivots: (S1) 1.2497; (P) 1.2528; (R1) 1.2575; More...
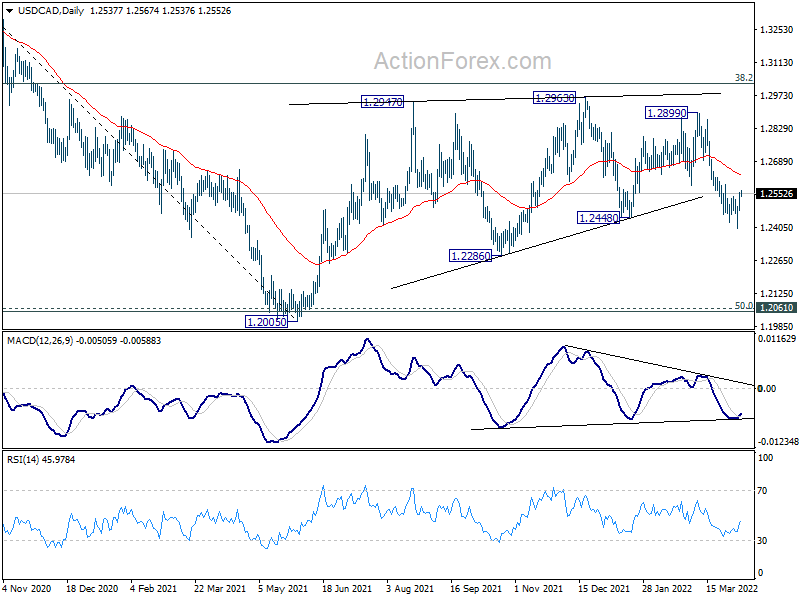
Intraday bias in USD/CAD remains neutral for the moment. Another fall could still be seen with 1.2591 resistance intact. Corrective pattern from 1.2005 could have completed already. Break of 1.2401 will target 1.2286 support and then 1.2005 low. However, on the upside, break of 1.2591 will dampen this bearish case, and turn bias back to the upside for 1.2899 resistance instead.
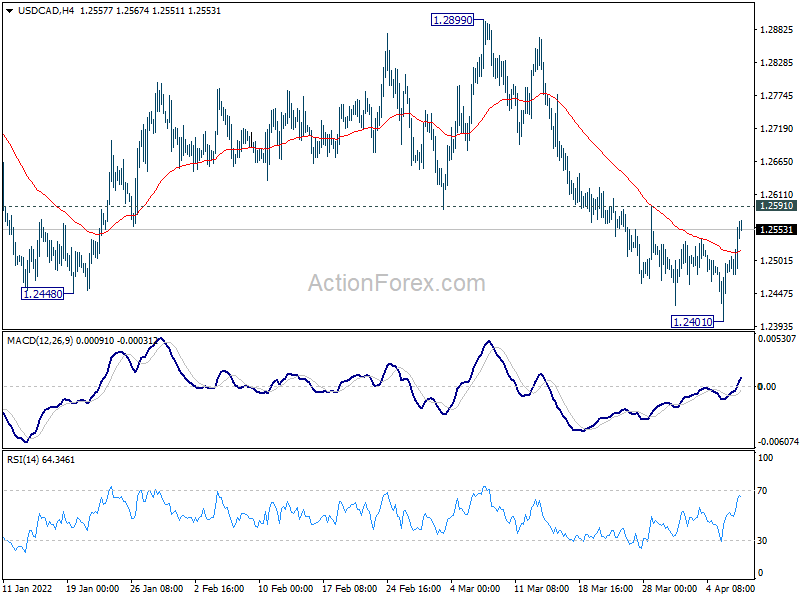
In the bigger picture, focus stays on 38.2% retracement of 1.4667 (2020 high) to 1.2005 (2021 low) at 1.3022. Sustained break there should confirm that the down trend from 1.4667 has completed after defending 1.2061 long term cluster support. Further rise would then be seen towards 61.8% retracement at 1.3650. However, rejection by 1.3022 will maintain medium term bearishness. Break of 1.2005 will resume the down trend from 1.4667 and that carries larger bearish implications too.
Risk Sentiment Hammered by Fed’s Balance Sheet Plan, Dollar Staying Firm
Markets are clearly in some risk aversion actions after Fed laid out the balance sheet runoff plan. Nikkei is leading other Asian stocks lower, after US indexes tumbled overnight. Australian Dollar is dragged down by the sentiment, followed by Kiwi and Loonie. On the other hand, Euro is recovering mildly for today. But for the week, Dollar is currently the strongest one, as supported by surging treasury yield and Fed expectations. Euro is still the weakest on dovish ECB and Ukraine uncertainty.
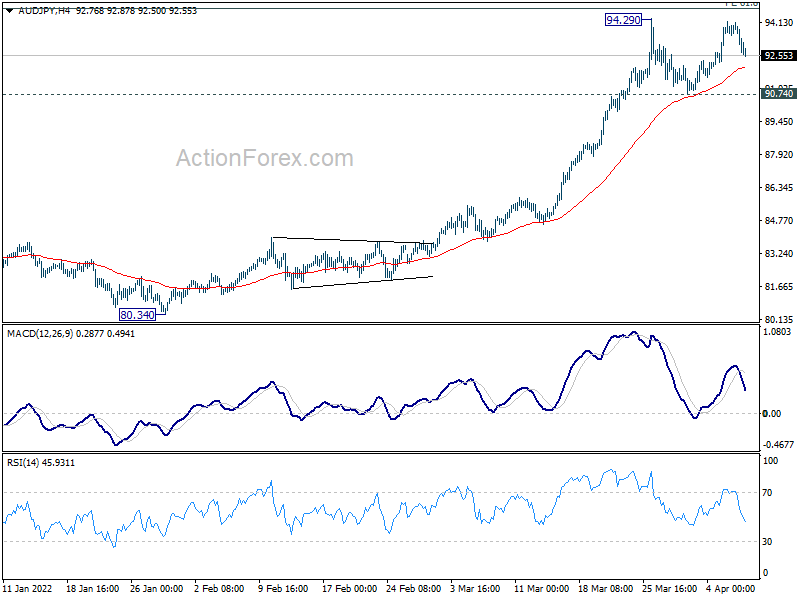
Technically, Aussie is apparently turning weaker today, but the selloff is not disastrous. A focus will be on 90.74 support in AUD/JPY. As long as this level holds, firstly, AUD/JPY's outlook will stay bullish for another rally through 94.29 high. Secondly, that should help floor selling in Aussie elsewhere. However, firm break of 90.74 would be a warning that the tide in Aussie is turning near term bearish.
In Asia, at the time of writing, Nikkei is down -2.00%. Hong Kong HSI is down -0.85%. China Shanghai SSE is down -0.76%. Singapore Strait Times is down -0.55%. Japan 10-year JGB yield is down -0.0087 at 0.236. Overnight, DOW dropped -0.42%. S&P 500 dropped -0.97%. NASDAQ dropped -2.22%. 10-year yield rose 0.053 to 2.609.
Fed plans to shrink balance sheet by $95B per month
In the minutes of the March 15-16 FOMC meeting, many participants said they would have preferred a 50bps hike because inflation was well above target, and risks were to the upside. However, a number of them pointed out the "greater near-term uncertainty" associated with the Russia invasion of Ukraine. Thus, a 25bps hike was taken at that meeting.
However, "many participants noted that one or more 50 basis point increases in the target range could be appropriate at future meetings, particularly if inflation pressures remained elevated or intensified.
Meanwhile "all participants" agreed that balance sheet runoff should start "at a coming meeting". " Participants generally agreed that monthly caps of about $60 billion for Treasury securities and about $35 billion for agency MBS would likely be appropriate. Participants also generally agreed that the caps could be phased in over a period of three months or modestly longer if market conditions warrant.
BoJ Noguchi: Takes significant time to justify stimulus withdrawal
Bank of Japan board member Asahi Noguchi said while core consumer inflation may exceed 2% from April, it's mainly driven by external factors rather than domestic demand. He added, "Japan is not experiencing the kind of high inflation seen in many other countries."
"In a country still mired in a sticky deflationary mindset, it will take significant time to stably achieve our 2% inflation target and justify a withdrawal of stimulus," he added.
Australia AiG services dropped to 56.2, intensifying price and wage pressures
Australia AiG Performance of Services Index dropped -3.8 pts to 56.2 in March. Sales dropped sharply by -14.9 to 53.7. Employment dropped -0.3 to 54.4. But new orders rose 2.4 to 63.5. Input prices jumped 11.5 to 77.5. Selling prices also rose 4.2 to 64.5. Average wages surged 11.8 to 67.7.
Innes Willox, Chief Executive of the national employer association Ai Group, said: "Australia's services sector continued its positive run in March although the pace of growth slowed in the face of intensifying input price pressures, difficulties in finding staff and further wage pressures."
Also from Australia, goods and services export was relatively unchanged over the month at AUD28.8B in February. Goods and services imports rose 12% mom to AUD 41B. Trade surplus shrank to AUD 7.46B, smaller than expectation of AUD 11.70B.
Looking ahead
Swiss unemployment rate and foreign currency reserves will be released in European session. Germany will release industrial production. Eurozone will release retail sales. But main focus will be on ECB monetary policy meeting accounts. Later in the day, US will release jobless claims.
USD/CAD Daily Outlook
Daily Pivots: (S1) 1.2427; (P) 1.2462; (R1) 1.2522; More...
Intraday bias in USD/CAD remains neutral for the moment. Another fall could still be seen with 1.2591 resistance intact. Corrective pattern from 1.2005 could have completed already. Break of 1.2401 will target 1.2286 support and then 1.2005 low. However, on the upside, break of 1.2591 will dampen this bearish case, and turn bias back to the upside for 1.2899 resistance instead.
In the bigger picture, focus stays on 38.2% retracement of 1.4667 (2020 high) to 1.2005 (2021 low) at 1.3022. Sustained break there should confirm that the down trend from 1.4667 has completed after defending 1.2061 long term cluster support. Further rise would then be seen towards 61.8% retracement at 1.3650. However, rejection by 1.3022 will maintain medium term bearishness. Break of 1.2005 will resume the down trend from 1.4667 and that carries larger bearish implications too.
Economic Indicators Update
| GMT | Ccy | Events | Actual | Forecast | Previous | Revised |
|---|---|---|---|---|---|---|
| 22:30 | AUD | AiG Performance of Services Index Mar | 56.2 | 60 | ||
| 01:30 | AUD | Trade Balance (AUD) Feb | 7.46B | 11.70B | 12.89B | 11.79B |
| 05:00 | JPY | Leading Economic Index Feb P | 103 | 102.5 | ||
| 05:45 | CHF | Unemployment Rate Mar | 2.20% | 2.20% | ||
| 06:00 | EUR | Germany Industrial Production M/M Feb | 0.00% | 2.70% | ||
| 07:00 | CHF | Foreign Currency Reserves (CHF) Mar | 938B | |||
| 09:00 | EUR | Eurozone Retail Sales M/M Feb | 0.60% | 0.20% | ||
| 11:30 | EUR | ECB Monetary Policy Meeting Accounts | ||||
| 12:30 | USD | Initial Jobless Claims (Apr 1) | 200K | 202K | ||
| 14:30 | USD | Natural Gas Storage | 18.0B | 26B |
Australia AiG services dropped to 56.2, intensifying price and wage pressures
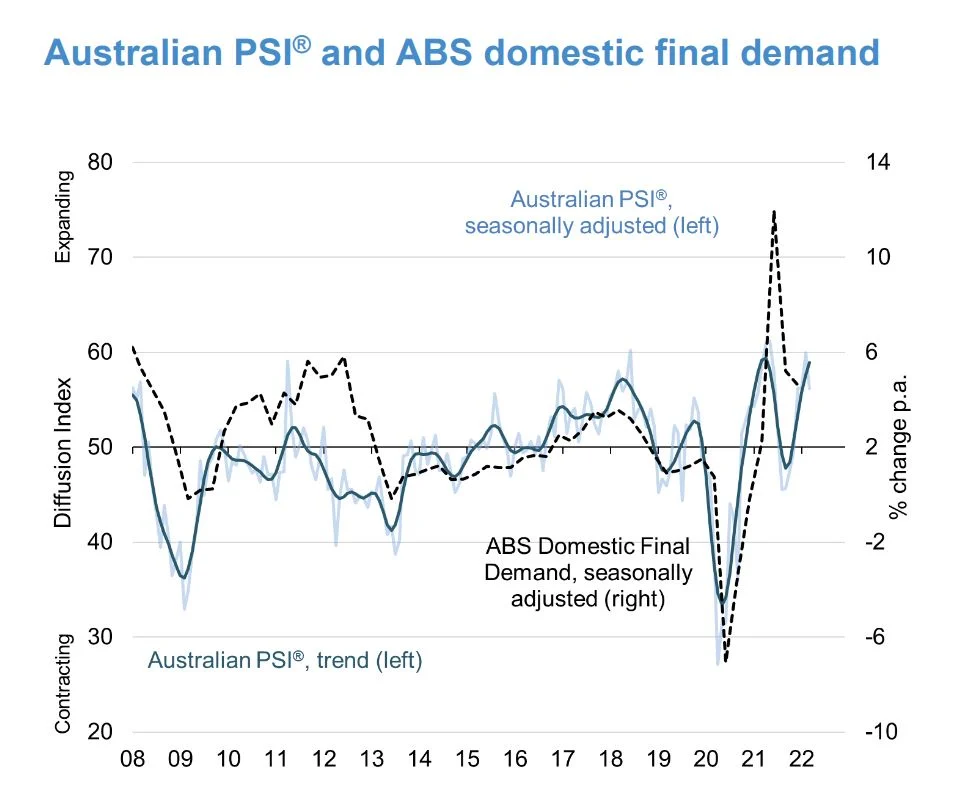
Australia AiG Performance of Services Index dropped -3.8 pts to 56.2 in March. Sales dropped sharply by -14.9 to 53.7. Employment dropped -0.3 to 54.4. But new orders rose 2.4 to 63.5. Input prices jumped 11.5 to 77.5. Selling prices also rose 4.2 to 64.5. Average wages surged 11.8 to 67.7.
Innes Willox, Chief Executive of the national employer association Ai Group, said: "Australia's services sector continued its positive run in March although the pace of growth slowed in the face of intensifying input price pressures, difficulties in finding staff and further wage pressures."
BoJ Noguchi: Takes significant time to justify stimulus withdrawal
Bank of Japan board member Asahi Noguchi said while core consumer inflation may exceed 2% from April, it's mainly driven by external factors rather than domestic demand. He added, "Japan is not experiencing the kind of high inflation seen in many other countries."
"In a country still mired in a sticky deflationary mindset, it will take significant time to stably achieve our 2% inflation target and justify a withdrawal of stimulus," he added.
Fed plans to shrink balance sheet by $95B per month
In the minutes of the March 15-16 FOMC meeting, many participants said they would have preferred a 50bps hike because inflation was well above target, and risks were to the upside. However, a number of them pointed out the "greater near-term uncertainty" associated with the Russia invasion of Ukraine. Thus, a 25bps hike was taken at that meeting.
However, "many participants noted that one or more 50 basis point increases in the target range could be appropriate at future meetings, particularly if inflation pressures remained elevated or intensified.
Meanwhile "all participants" agreed that balance sheet runoff should start "at a coming meeting". " Participants generally agreed that monthly caps of about $60 billion for Treasury securities and about $35 billion for agency MBS would likely be appropriate. Participants also generally agreed that the caps could be phased in over a period of three months or modestly longer if market conditions warrant.
NZD/USD Could Correct Lower, 0.6860 Is The Key
Key Highlights
- NZD/USD climbed above 0.7000 before it started a downside correction.
- It broke a crucial bullish trend line with support near 0.6945 on the 4-hours chart.
- EUR/USD settled below the key 1.0950 support.
- GBP/USD is at a risk of a downside break below 1.3000.
NZD/USD Technical Analysis
The New Zealand Dollar started a steady increase above the 0.6880 resistance against the US Dollar. NZD/USD traded above the 0.6950 resistance zone and extended increase.
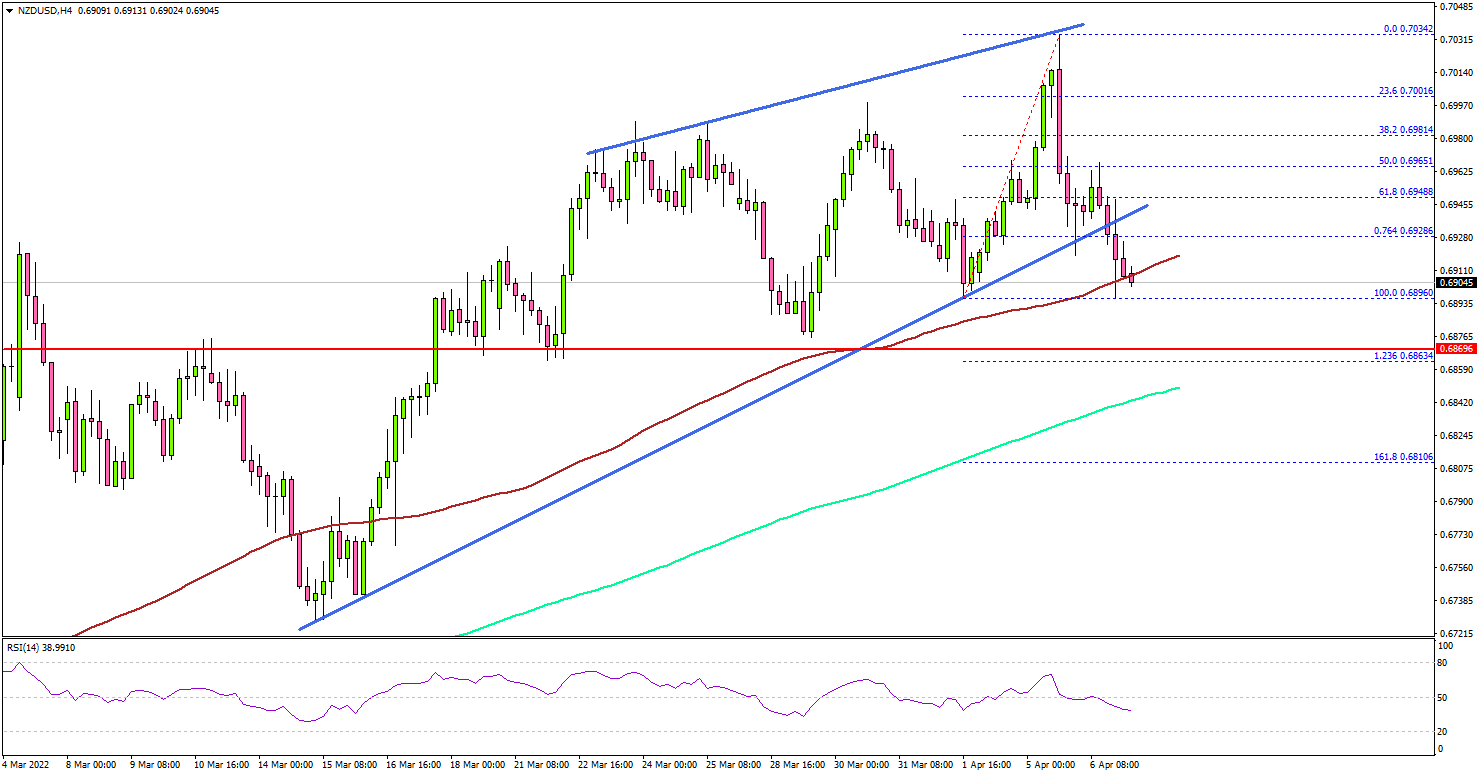
Looking at the 4-hours chart, the pair even broke the 0.7000 resistance. The pair settled above the 200 simple moving average (green, 4-hours) and the 100 simple moving average (red, 4-hours).
A high was formed near 0.7034 before it started a downside correction. There was a move below the 0.7000 and 0.6980 support levels. The pair declined below the 50% Fib retracement level of the upward move from the 0.6896 swing low to 0.7034 high.
Besides, it broke a crucial bullish trend line with support near 0.6945 on the same chart. An immediate support is near the 0.6900 level and the 100 simple moving average (red, 4-hours).
The next major support is near the 0.6860 level (a key multi-touch zone). A downside break below the 0.6860 support level might start a major decline.
On the upside, an immediate resistance is near the 0.6965 level. The next major resistance is near the 0.7000 level. Any more gains might send the pair towards the 0.7050 level in the coming sessions.
Looking at EUR/USD, the pair settled below the 1.0950 support zone, opening the doors for more downsides in the near term. Similarly, GBP/USD could dive if it breaks the 1.3000 support.
Economic Releases
- US Initial Jobless Claims - Forecast 200K, versus 202K previous.
RBA Tightening Cycle to Begin in June, Hikes in Most Months in H2 2022 with Cash Rate Peaking at...
The Reserve Bank Governor surprised us on Tuesday with the Board's decision to abandon its patient approach to monetary policy.
Since the last Board meeting, when "patience" was emphasised, we have seen a further drop in the unemployment rate, from 4.2% to 4.0%, and a continuing surge in job vacancies pointing to further falls in the unemployment rate through the rest of 2022 (see Figure 1).
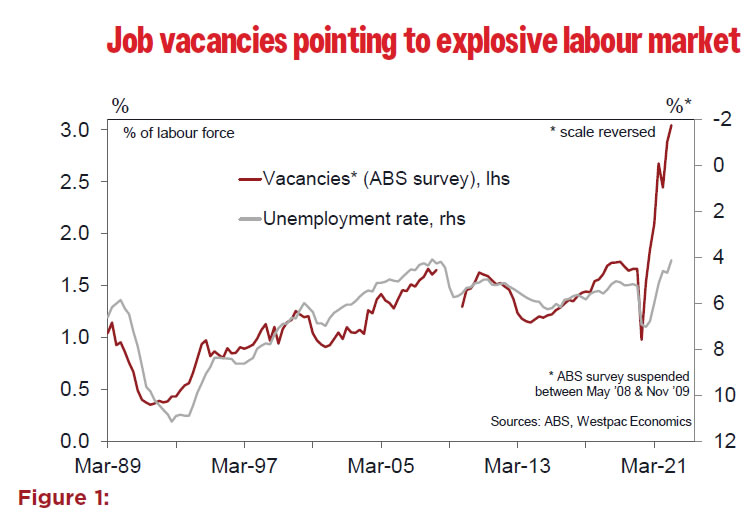
Accordingly, we have revised down our forecast for the unemployment rate which is now expected to reach 3.25% by year's end compared to 3.75% forecast previously.
That much tighter labour market in turn points to a stronger lift in wages growth in 2023 with a peak of 4% now expected compared to our previous peak of 3.5%.
We also recently revised up our forecasts for the US federal funds rate, which is now expected to peak at 2.375% by end 2022.
We expect the RBA has also been raising its own expectations for the federal funds rate in the wake of recent data releases and the strong rhetoric from FOMC members, including Chair Powell.
And recall that this shift by the RBA Board, from a 'patient' to a more pro-active approach to monetary policy – is in the context of an election campaign that will be fought through most of April and the first half of May.
By establishing a clear expectation that the Board will now begin the tightening cycle in June, the RBA is willing to risk political controversy, particularly around any potential discussion of the role of the federal budget in changing the Board's stance. Being aware of such complications but still being prepared to change the stance emphasises the Board's determination to change the policy message.
Before the decision to abandon 'patience' Westpac had expected the initial rate hike in the cycle to come in August. That forecast was first made back on January 20th when most published analysts were still expecting the cycle to begin in 2023 or November 2022 at the earliest.
That January 20th shift was our first forecast change since June 2021.
Our profile at that time was for rates to peak in February 2024 at a cash rate of 1.75% with two rate hikes in 2022 reaching 0.5% by year end (later tweaked to three moves to 0.75% by the end of 2022 with the same terminal rate of 1.75% coming by end 2023).
Now we expect a much shorter tightening cycle with consecutive rate hikes in June (15bps); July (25bp); and August (25bps). That point would see the 2020 COVID emergency cuts unwound with the Board likely to take a pause in September.
Further hikes are now expected in October (25bps) and November (25bps) reaching 1.25% by year's end. The cycle would resume in February 2023 with three more 25bp hikes in February; May and June 2023.
The three hikes in 2023 will be in the context of accelerating wage pressures with the annual rate reaching 4% by mid-2023.
Readers will be aware that we expect the peak in the federal funds rate by December 2022 of 2.375%. We now see the peak in the RBA cash rate at 2% (up from 1.75%) around six months later.
We would be surprised if the peak in the RBA cycle was too far out of synchronisation with the FOMC.
Our previous profile for 2022 had hikes in August; October and December in 2022 but the changed labour market situation and what looks to be a more urgent approach from the Board signals an earlier beginning to the cycle and only one 'break' in the sequence to mark the unwinding of emergency cuts.
The expected tempo is in line with the last tightening cycle over a decade ago in 2009–10. This came in two initial sequences of consecutive moves over three months – October-November- December in 2009 and March–April–May in 2010. The rationale at the time was to take back the GFC-related emergency cuts in anticipation of the inflationary and wage pressures which were building during the second round of the mining boom, when wages growth ultimately lifted to just below 4%.
A similar initial sequence of hikes in 2022 reflects the new urgency from the Board to unwind the emergency cuts during COVID and lift rates back to levels which are more reflective of the recovering economy. The further tightening into 2023 will be more about the backdrop of a record low unemployment rate, accelerating wages growth; and 'sticky' inflation as businesses continue to pass on the lagged cost increases resulting from supply shocks.
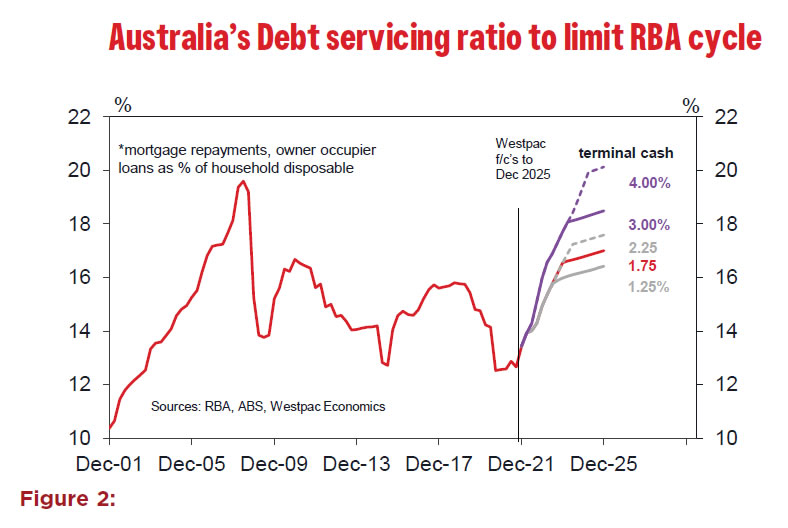
While we have accelerated the pace of rate hikes in 2022 with a peak of 1.25% by year's end we have only lifted the expected terminal rate from 1.75% to 2.0%.
This 2.0% will nevertheless result in a significantly higher debt servicing ratio for the household sector than in the 2009-10 tightening cycle. (see Figure 2) That said, we are mindful of the $250bn in excess savings being held by the household sector and around $170 billion for business, which has been accumulated through COVID when policy supports to income combined with pandemic-related restrictions on spending.
The federal government alone allocated around $330bn to supporting the economy through COVID. There has been a massive transfer from the government balance sheet to the balance sheets of households and business.
Much of this excess savings will be on the balance sheets of high income/low debt households. But it is also sitting with lowincome/ high debt households that will act as a potential buffer to higher rates. Banks report that borrowers are, on average, two years ahead on their mortgage repayments while there has been a $100 billion surge since Covid in balances in redraw facilities.
Without those buffers the peak cash rate would be lower. And there is a clear upside risk to the terminal cash rate if these buffers prove to be more substantial.
The RBA will also be mindful of the risks of over tightening into the buffers that eventually are worked through exposing households to damagingly high mortgage rates.
But there will still be considerable sensitivity to the higher rates. Consider for example the wave of fixed rate borrowers that took out 2% loans during the pandemic – this group is set to roll onto mortgage rates more than double their original rate over the course of 2023 and 2024.
Under our scenario the standard discounted variable rate for owner occupiers will be around 5.5% by mid-2023.
Signals for the RBA that the tightening cycle has peaked will include: a significant slowdown in consumer spending; falling house prices; and a stabilising unemployment rate aided by a lift in immigration back towards pre-COVID levels. Through 2023, inflation is forecast to move back into the upper end of the 2–3% target band as commodity prices and supply constraints ease globally.
With these changes in the cash rate profile and the volatile markets there will be some changes to our profile for fixed rates – both swaps and bonds. These will appear in detail in our monthly Westpac Market Outlook which prints tomorrow.
But the important target for the three- year swap rate will be around 2.5% in the second half of 2023 (up from 2.25%) as markets accept our outlook for a steady terminal cash rate of 2% through 2024 and 2025.
We also retain our view that the spread between AUD and USD long bond rates will narrow significantly over 2023 as the federal funds rate settles above the cash rate. Reflecting the higher AUD terminal cash rate we have lifted our target 10 year bond rate by end 2023 from 2.10 to 2.20 with the spread lifting from zero to 10 basis points.
Those relativities reflect the Australian economy's greater sensitivity to the short end of the yield curve and the potential upward pressure on the long bond rate as the Federal Reserve embraces its Quantitative Tightening Policy.
Don’t Get too Bullish on the DXY!
Those who’ve been long the US dollar index (DXY) since the middle of last year have done well for themselves. The DXY has gained c. 12% from its January 2021 swing low of 89.21 to trade close to 99.75 at the time of writing. Making similar gains from current levels will undoubtedly prove more challenging. Traders should be factoring this into their risk-reward assessments going forward for several reasons.
First and foremost, as the DXY moves higher it’s likely to meet fierce resistance between the 100-103 range. In March 2020, dollar sellers were quick to step into the market when price attempted to breach the 103 level. Buyers may meet similar selling pressure on any re-attempt at these levels. Even more selling pressure is likely to arise toward the 103.8 level.
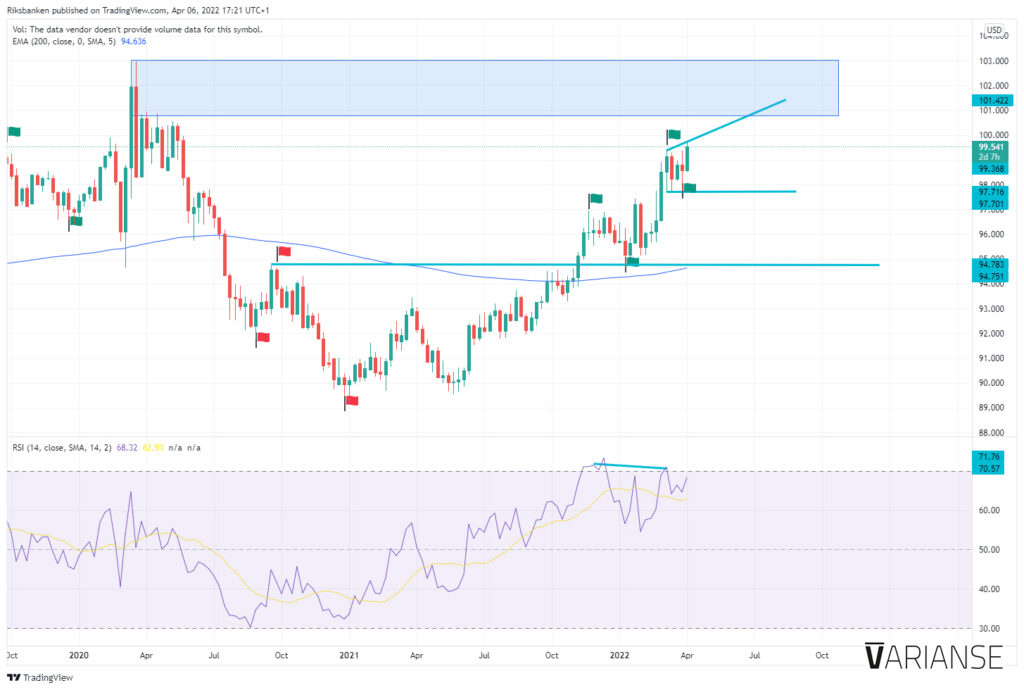
Secondly, from a market structure perspective the uptrend in the DXY is a lot more recent than appears to the naked eye. The 94.74 September 2020 swing high of the previous downtrend was only breached in November last year. This alone would not be concerning if it weren’t for a bit of RSI divergence between the latest two swing highs raises questions about further momentum.
Lastly, if indeed 99.418 represents the last true previous swing high and 97.685 the low in March, then traders are potentially facing a right-angled ascending broadening wedge pattern. Such a pattern adds a bit of ambiguity about further direction.
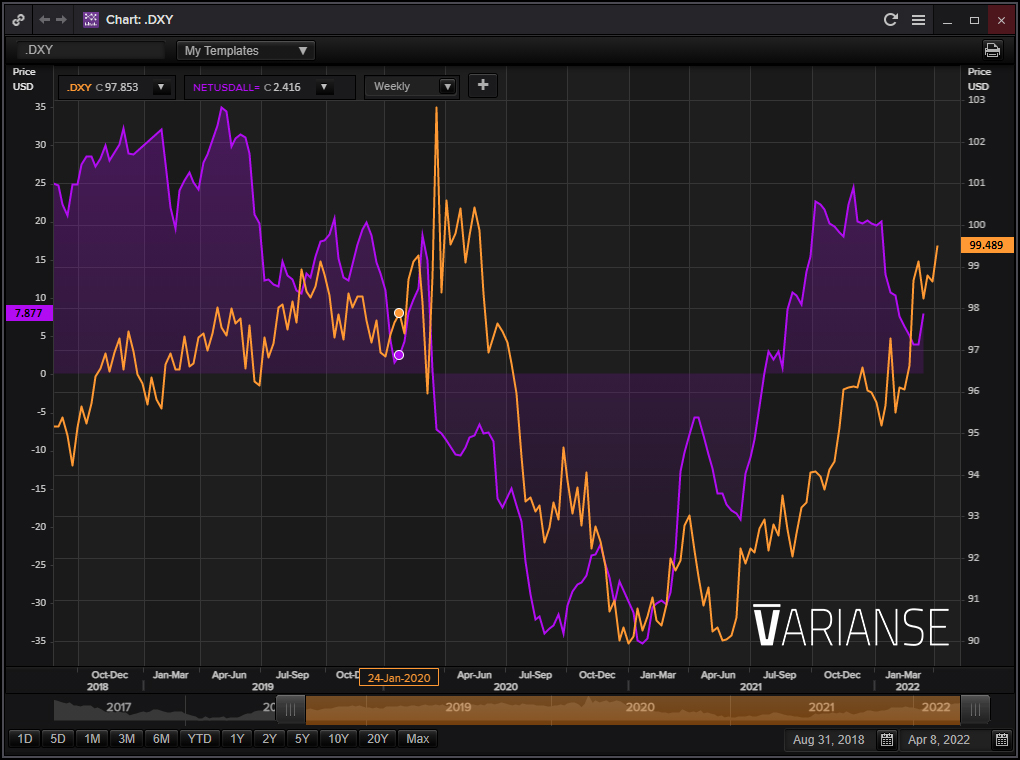
All that said, the DXY is clearly in an uptrend and the long US dollar positioning that drove the DXY higher earlier in the year has faded. So, there is still scope for a further rise in price. Nevertheless, traders should certainly be taking note of some of the red flags being thrown by the latest leg higher in the DXY.