Sample Category Title
Fed is Coming for Inflation
The FOMC minutes gave the clarity that every investors was looking for: the Federal Reserve (Fed) will be scaling back its near $9 trillion balance sheet by $95 billion per month, more than a trillion dollars per year.
On top, many Fed officials noted that ‘one or more 50-bps increases in the target range could be appropriate at future meetings, particularly if inflation measures remained elevated or intensified’.
Stock and bond markets didn’t react well to the cruel hawkishness of the latest FOMC minutes. Three major US indices fell, but value names lost less than the growth stocks. As such, we saw the Dow Jones retreat 0.42% to its 50-DMA, the S&P500 fall close to 1% below its 200-DMA, and Nasdaq slip more than 2% to an important Fibonacci support.
The US 2-10 year spread is back in the positive after having slipped below zero, but the recession threat is real, keeping the investor mood sour as the Fed pulls back support.
The equity and bond prices must go lower if the Fed wants to counter the supply-side inflation by a demand-side cool down.
In the FX
The US dollar remains well bid, and the dollar index consolidates just below the 100 level. It is probably just a matter of time before we see the index surpass the 100 mark, but in the very short run, we shall see a minor downside correction in the greenback following the Fed-minutes boost. The EURUSD slipped shortly below the 1.09 as the divergence between the hawkish Fed and the undecided and unresponsive European Central Bank (ECB) plays in favour of a softer euro, combined with the rising popularity of right-wing Marine Le Pen in French election polls, which is also seen as a threat for the European integrity.
Good news?
Good news is, China announced it will step up monetary stimulus to give support to counter the negative impacts of the latest Covid restriction measures which sent the Caixin services PMI to the scary level of 42 in March.
And US crude prices are back to the levels before the war. The barrel of US crude slid below the critical 50-DMA support, and the negative move appears to be more sustainable than the ones we saw over the past weeks. The loss of bullish momentum hints at a deeper downside correction which could pull the price of a barrel down toward the $88/90 barrel zone where it could meet the 100-DMA and the major 61.8% retracement on the December to March rally. If the fall is sustainable, we could start seeing some easing on the inflationary pressures, but it’s unsure how sustainable the oil pullback will be, and how low the prices could go considering the widening gap between supply and demand.
Anyway, it’s better to see the price of a barrel below the $100 mark, then above it!
Ruble back to the pre-war levels
One of the major drivers of the pullback in oil prices is European reluctance to ban the Russian oil. The West sticks however to new measures to pressure Putin to end the war in Ukraine, it sanctions his daughters, the family of Lavrov, the Russian banks. The UK froze Sberbank assets, as the US imposed full blocking sanctions on Sberbank and Alfa bank. More importantly, the US doesn’t allow Russia to process payments in US dollars, which obliged the country to service its $650 million worth of interest payment in rubles instead. But contractually, they are not allowed to pay in rubles, so the bonds could actually default. We are now within the 30-day grace period.
But interestingly, the Russian ruble is doing fine. The USD-RUB fell to the levels pre-war, as the generous income for its oil and gas keeps the currency well valued despite sanctions. The European Council President Michel Charles told the European Parliament yesterday that ‘measures on oil and even gas will be needed sooner or later’. In market language, that means that risks to oil prices remain tilted to the upside.
Gold, on the other hand, remains little changed near the $1920 per ounce. The rising yields hint that the medium-term direction should be the south, and we could see the price of an ounce sink sustainably to $1800/1820 area, which includes the 200-DMA. What keeps gold prices sustained right now is the fact that Russia is one of the largest gold miners, and that the safe haven demand remains tight, as the geopolitical tensions remain relatively high.
Technical Outlook and Review
DXY:
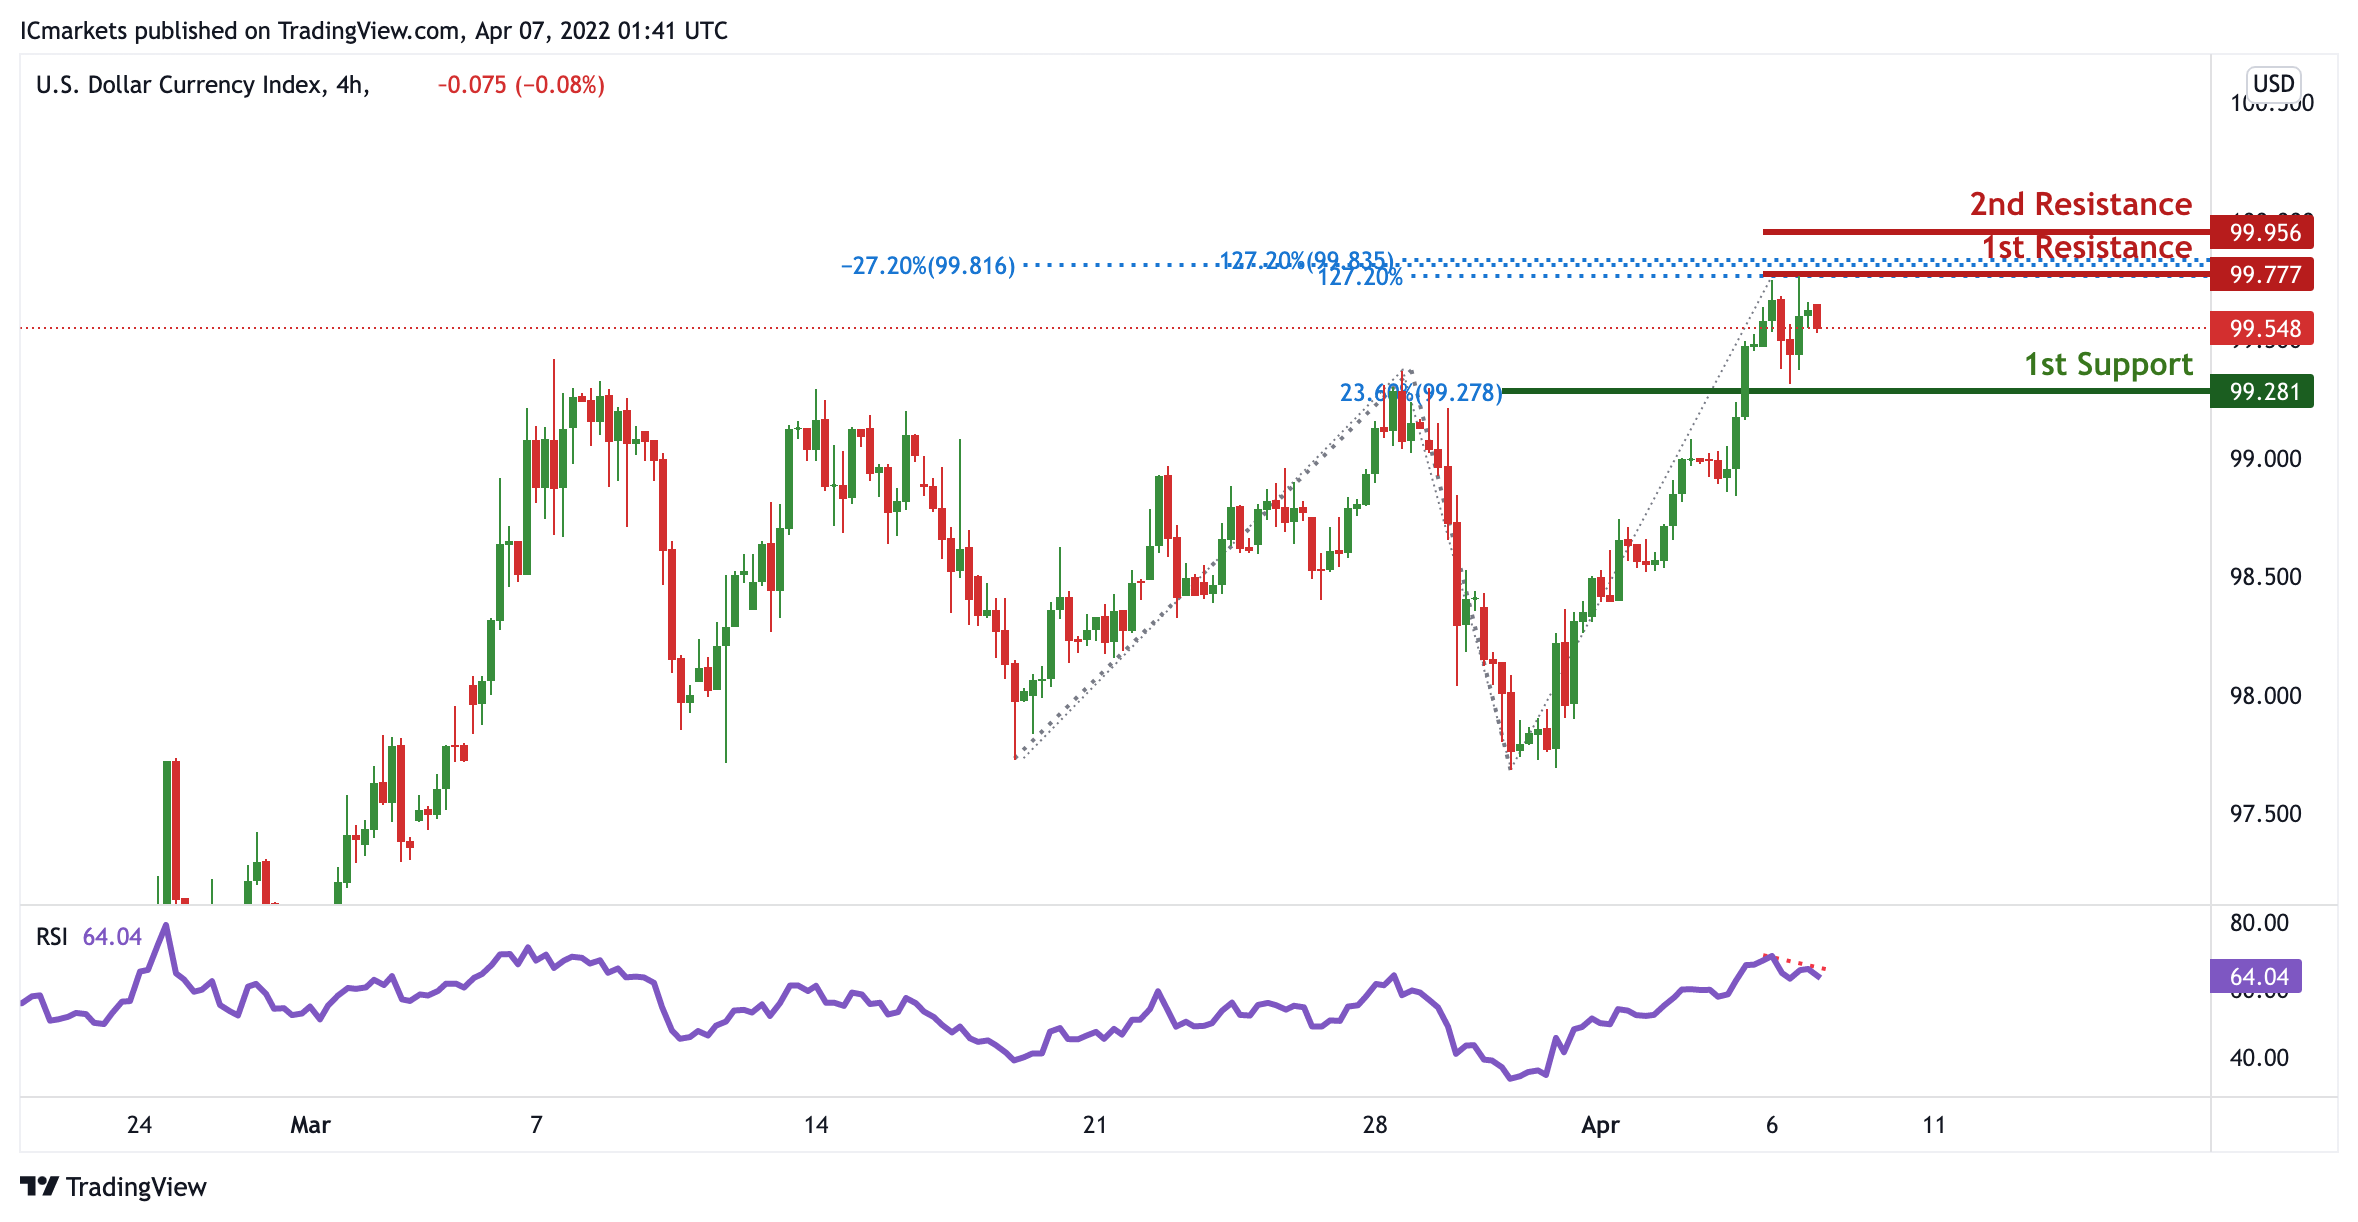
On the H1 timeframe, prices have approached pivot. We see the potential for a dip from our 1st resistance at 99.777 in line with which is an area of Fibonacci confluences towards our 1st support at 99.281 in line with 23.6% Fibonacci retracement. RSI is showing bearish momentum, further supporting our bearish bias.
Areas of consideration:
- H4 time frame, 1st resistance at 99.777
- H4 time frame, 1st support at 99.281
XAU/USD (GOLD):
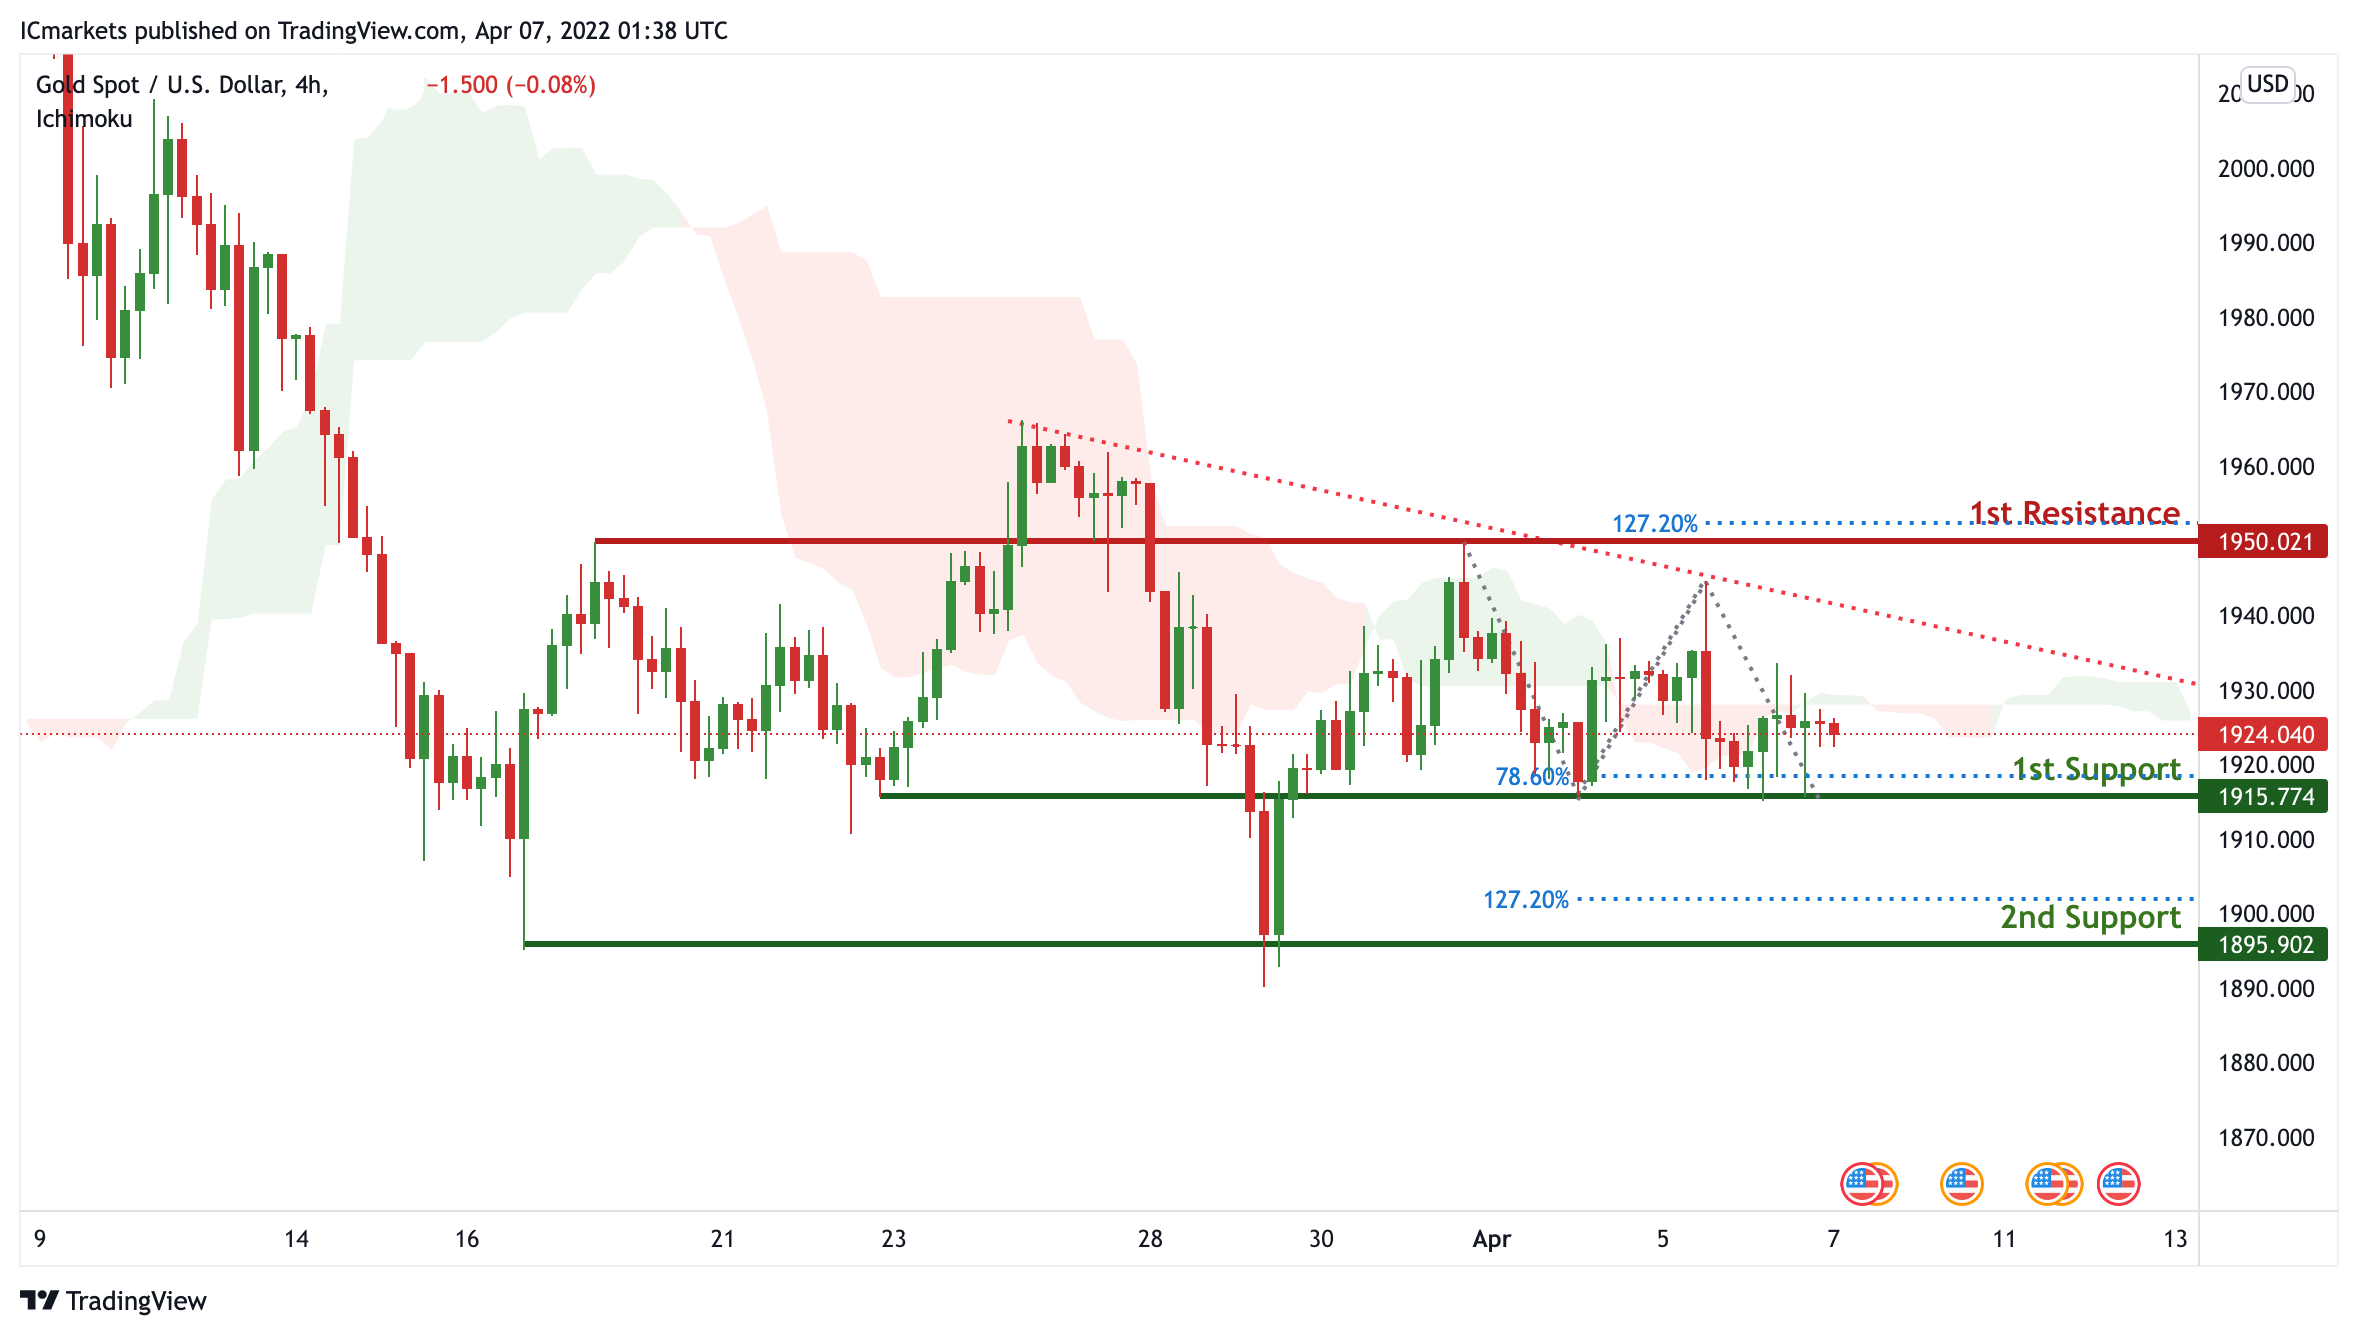
On the H1, prices are on bearish momentum and abiding by a descending trendline. We see the potential for a dip from our 1st resistance at 1950.021 which is in line with 127.2% Fibonacci extension towards our 1st support at 1915.774 in line which is a graphical overlap and in line with 78.6% Fibonacci Projection. Ichimoku is supporting our bullish bias.
Areas of consideration:
- 4h 1st support at 1915.774
- 4h 1st resistance at 1950.021
GBP/USD:
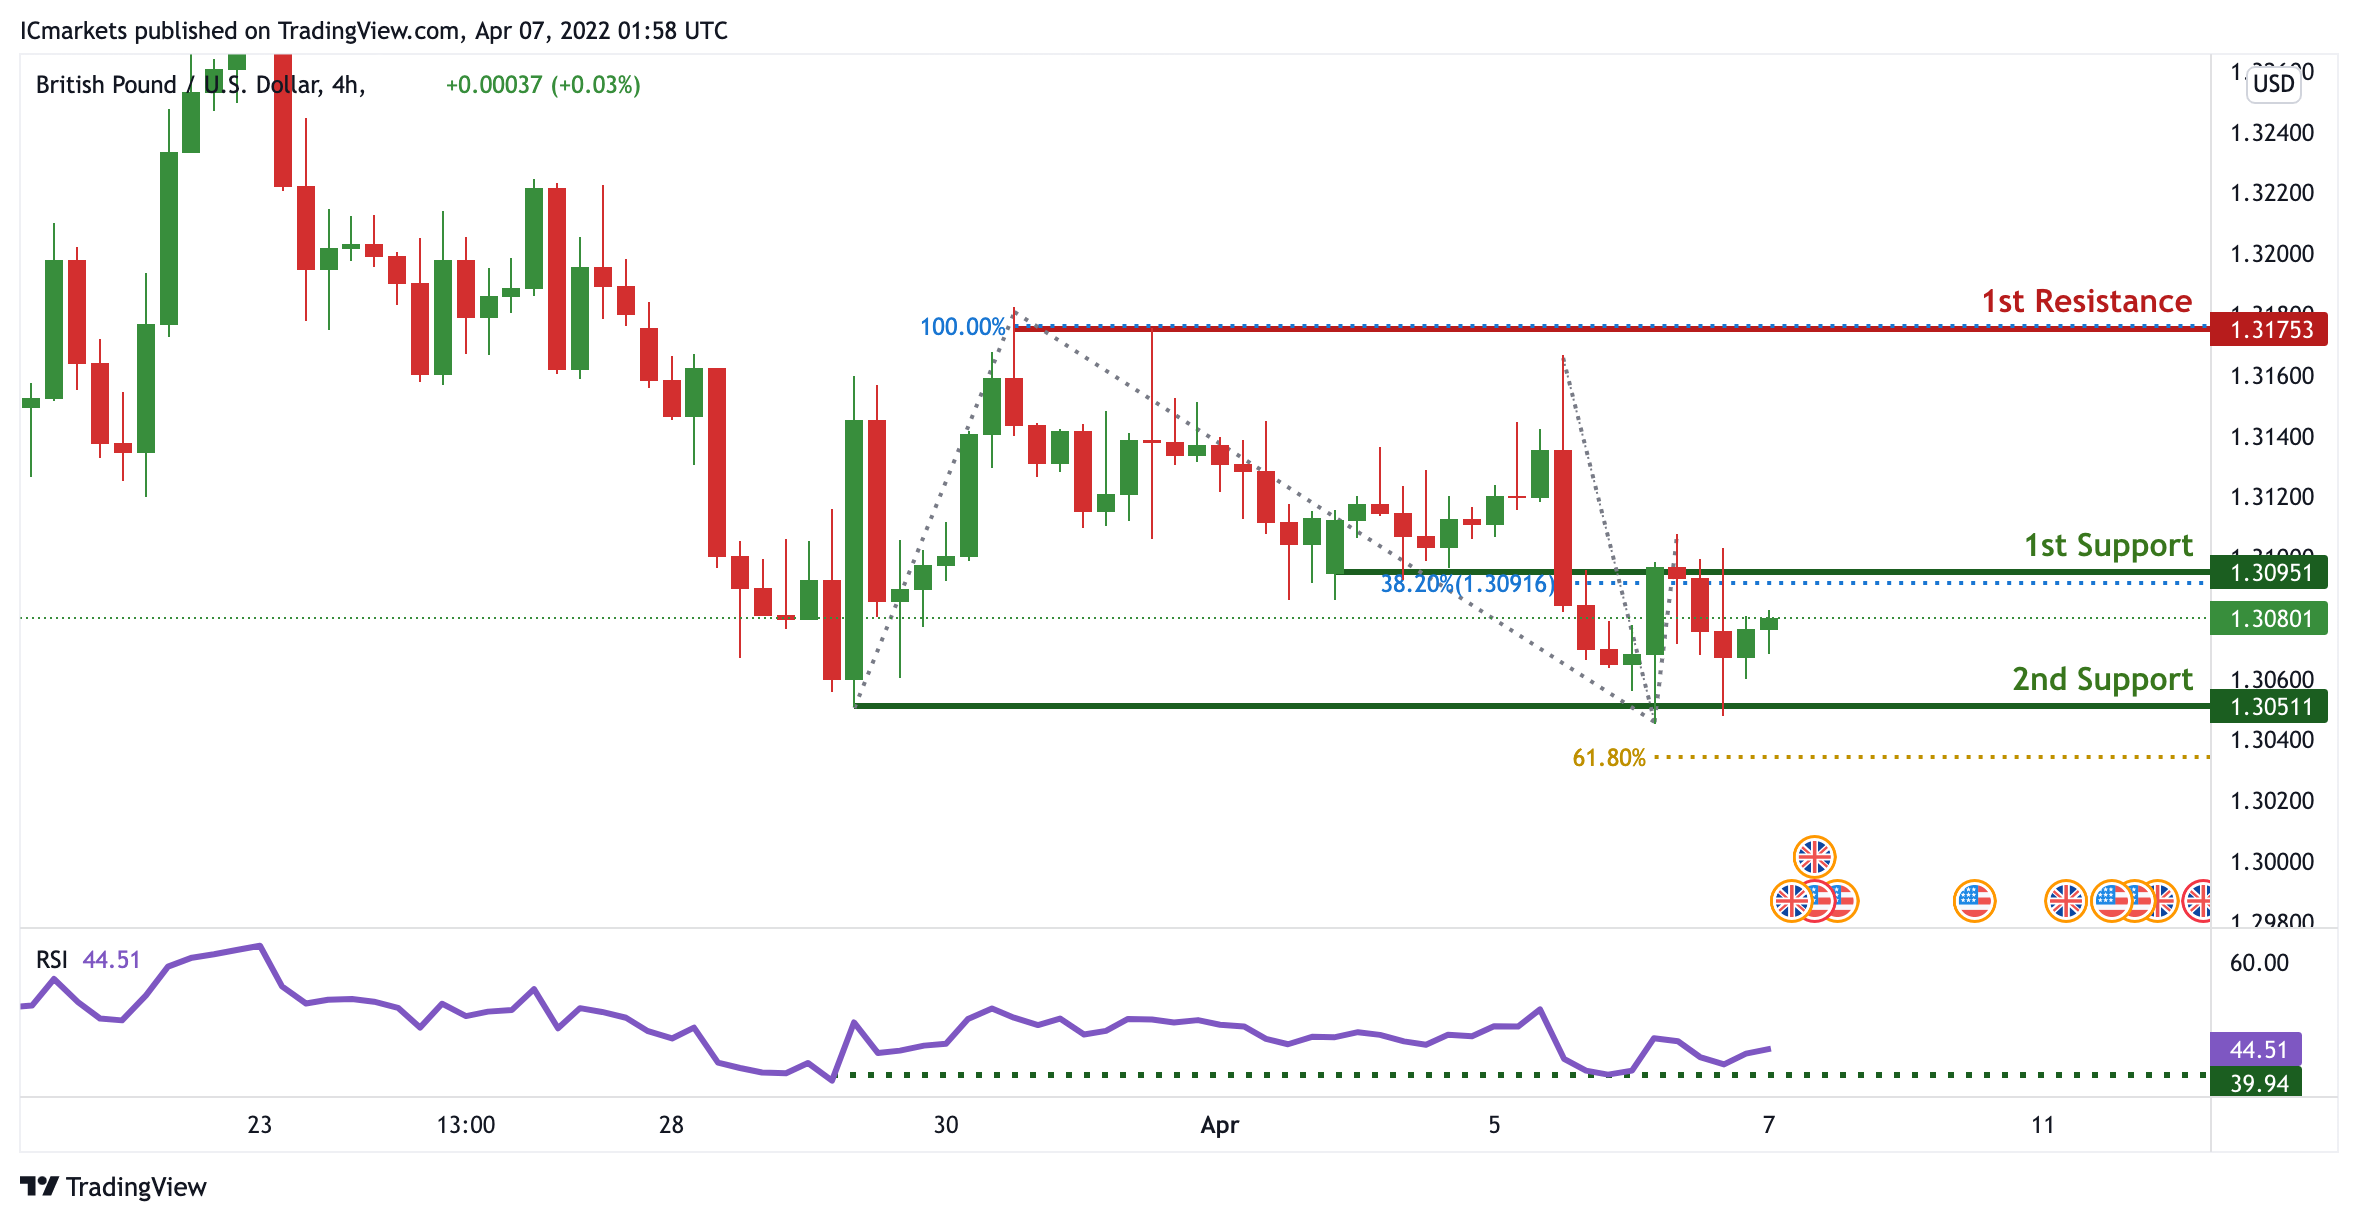
On the H4, prices are approaching a pivot. We see the potential for further bullish continuation from our 1st support at 1.30951 in line with 38.2% Fibonacci retracement towards our 1st resistance at 1.31763 in line with 100% Fibonacci Projection. Alternatively, if prices continue to dip, we might find prices dropping further towards our 2nd support at 1.30511 in line with 61.8% FIbonacci projection. Our bullish bias is further supported by RSI being at levels where bounces previously occurred.
Areas of consideration:
- H4 1st resistance at 1.30511
- H4 1st support at 1.30951
USD/CHF:
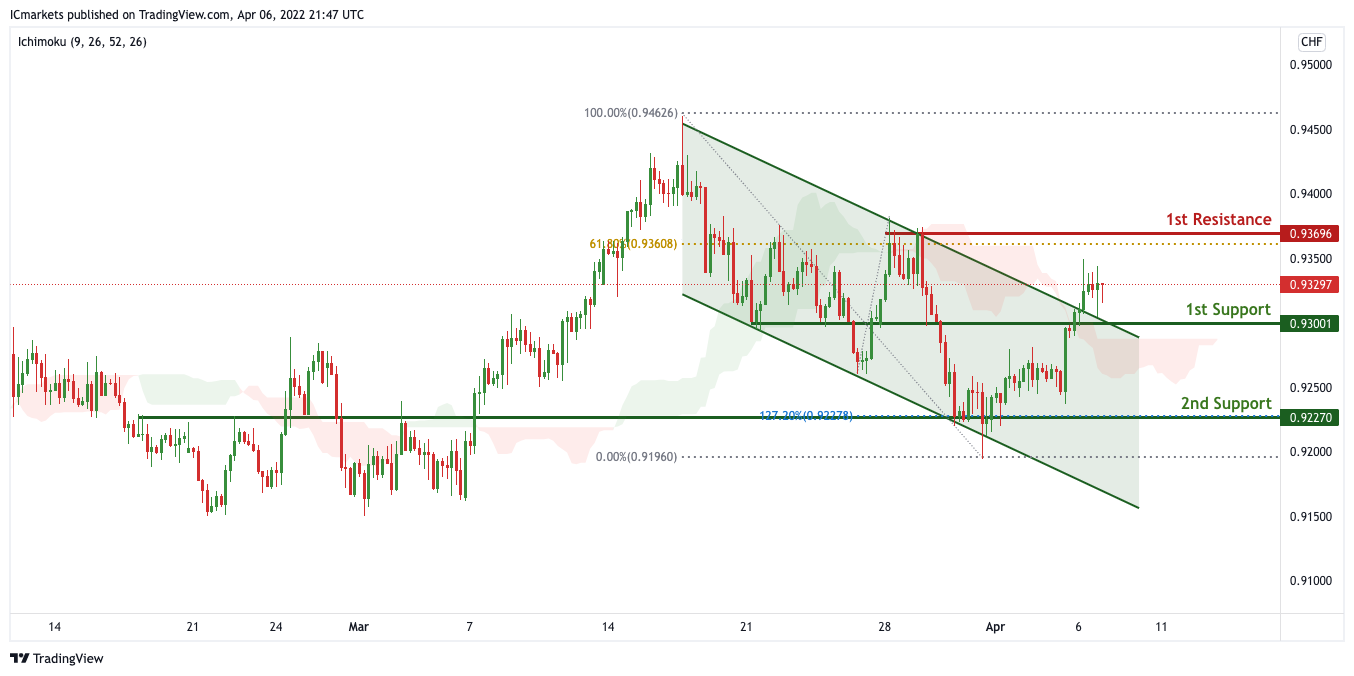
On the H4, with price moving above the ichimoku cloud and the recent break of the channel, we have a bias that price will rise to our 1st resistance at 0.93696 in line with the 61.8% Fibonacci retracement from our 1st support at 0.93001 in line with the horizontal pullback support. Alternatively, price may break 1st support structure and head for 2nd support at 0.92270 in line with the swing pullback support.
Areas of consideration
- 1st support level at 0.93001
- 1st resistance level at 0.93696
EUR/USD :
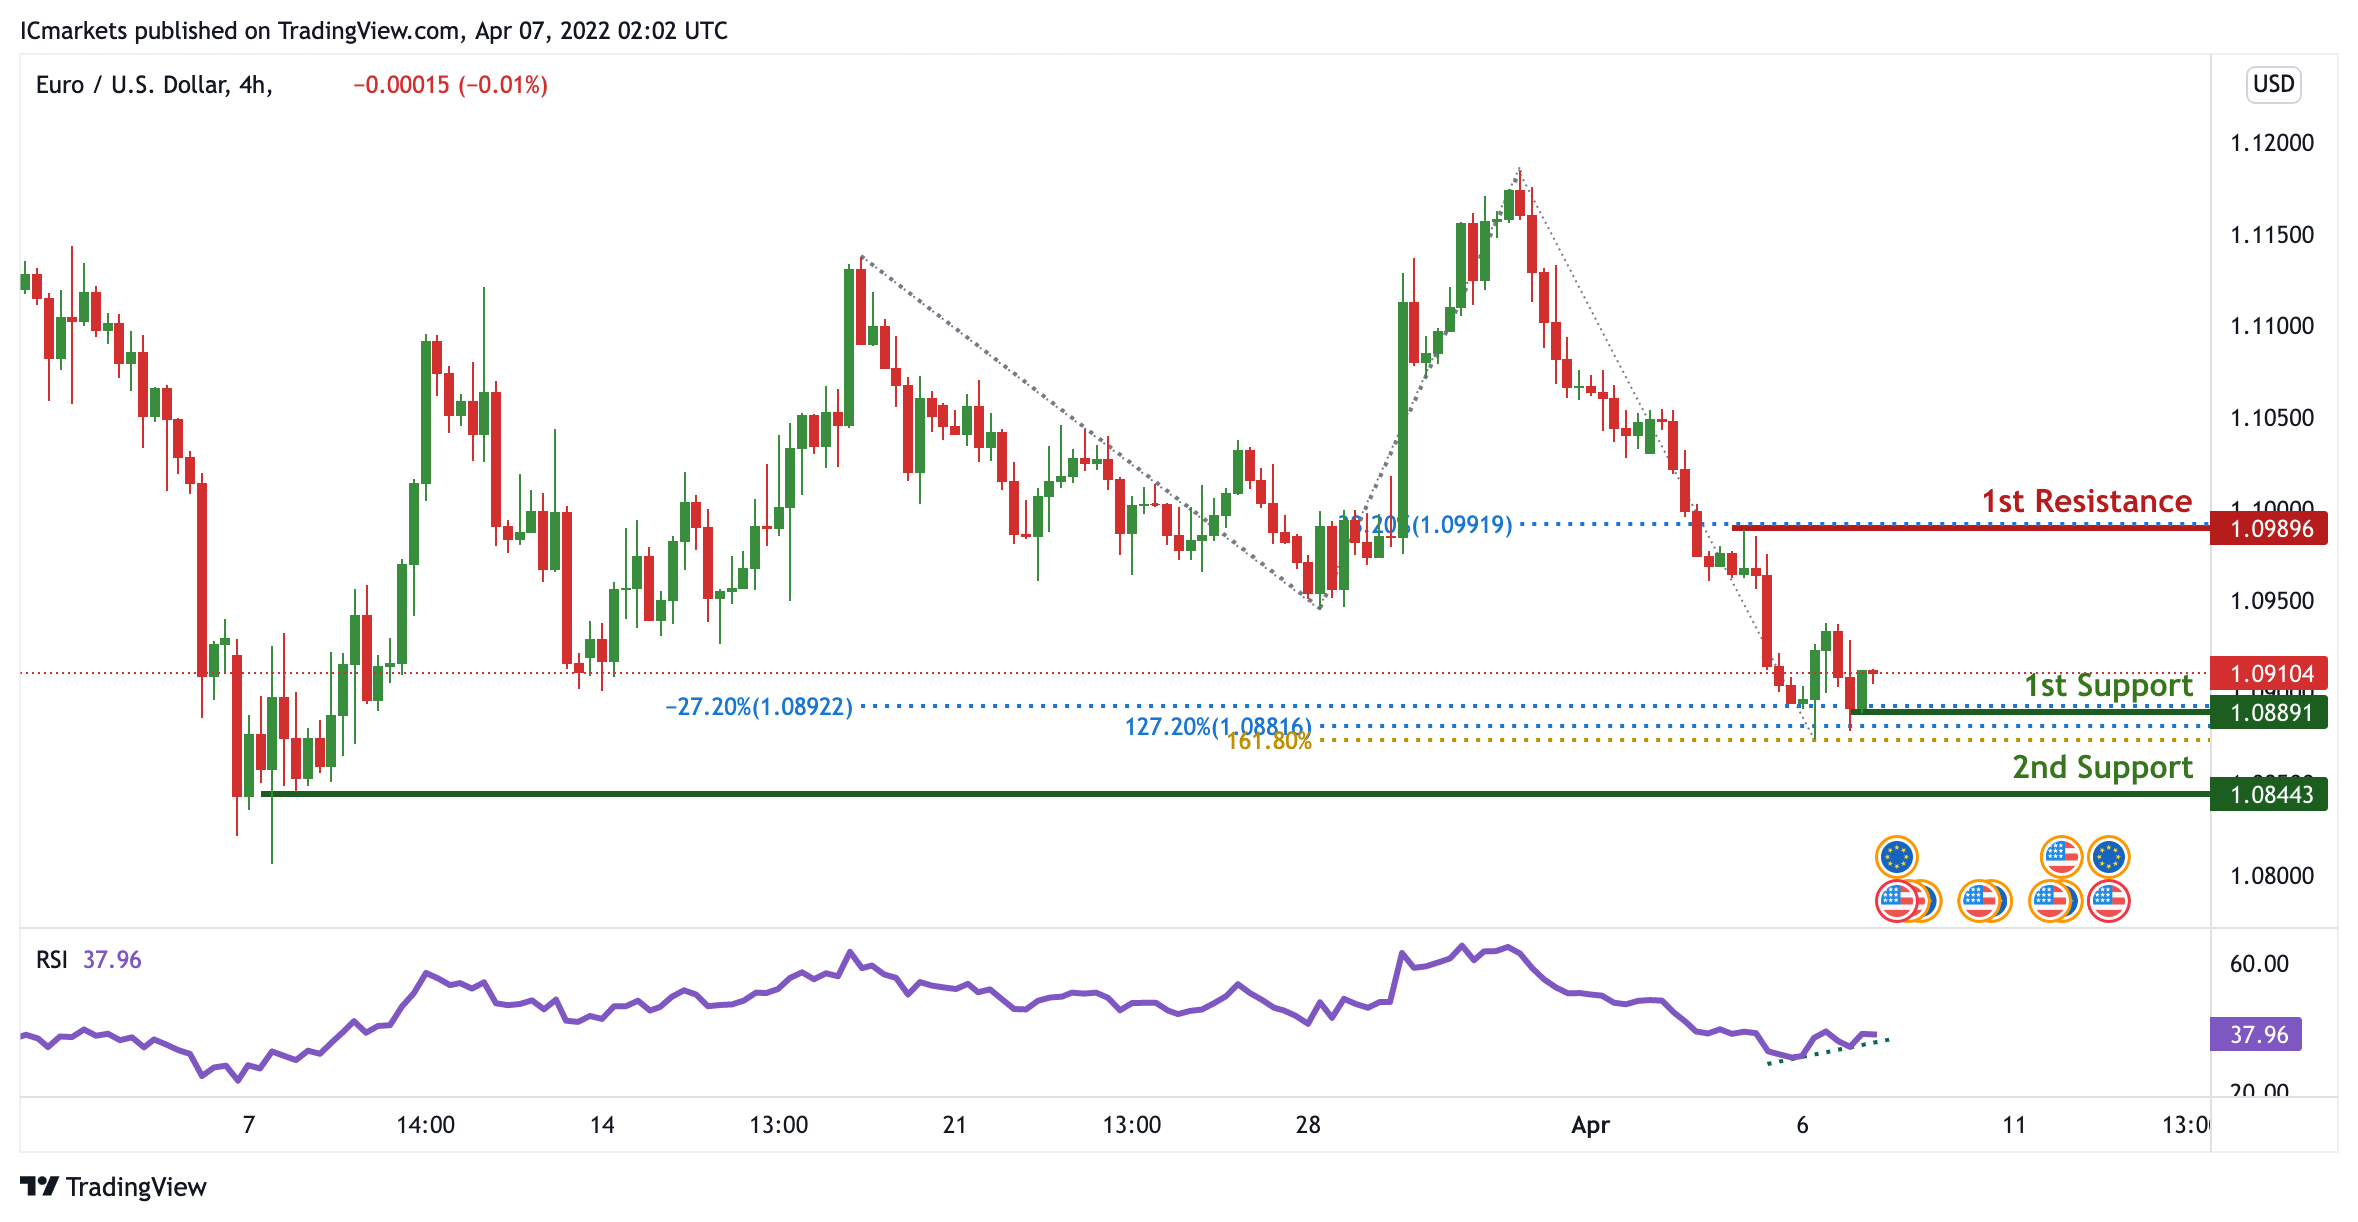
On the H4 timeframe, prices are at a key pivot. We see the potential for a bounce from our 1st support at 1.08891 which is an area of Fibonacci confluences towards our 1st resistance at 1.09896 in line with 38.2% Fibonacci retracement. RSI is on bullish momentum, further supporting our bullish bias.
Areas of consideration :
- H4 1st resistance at 1.09896
- H4 1st support at 1.08891
USD/JPY:
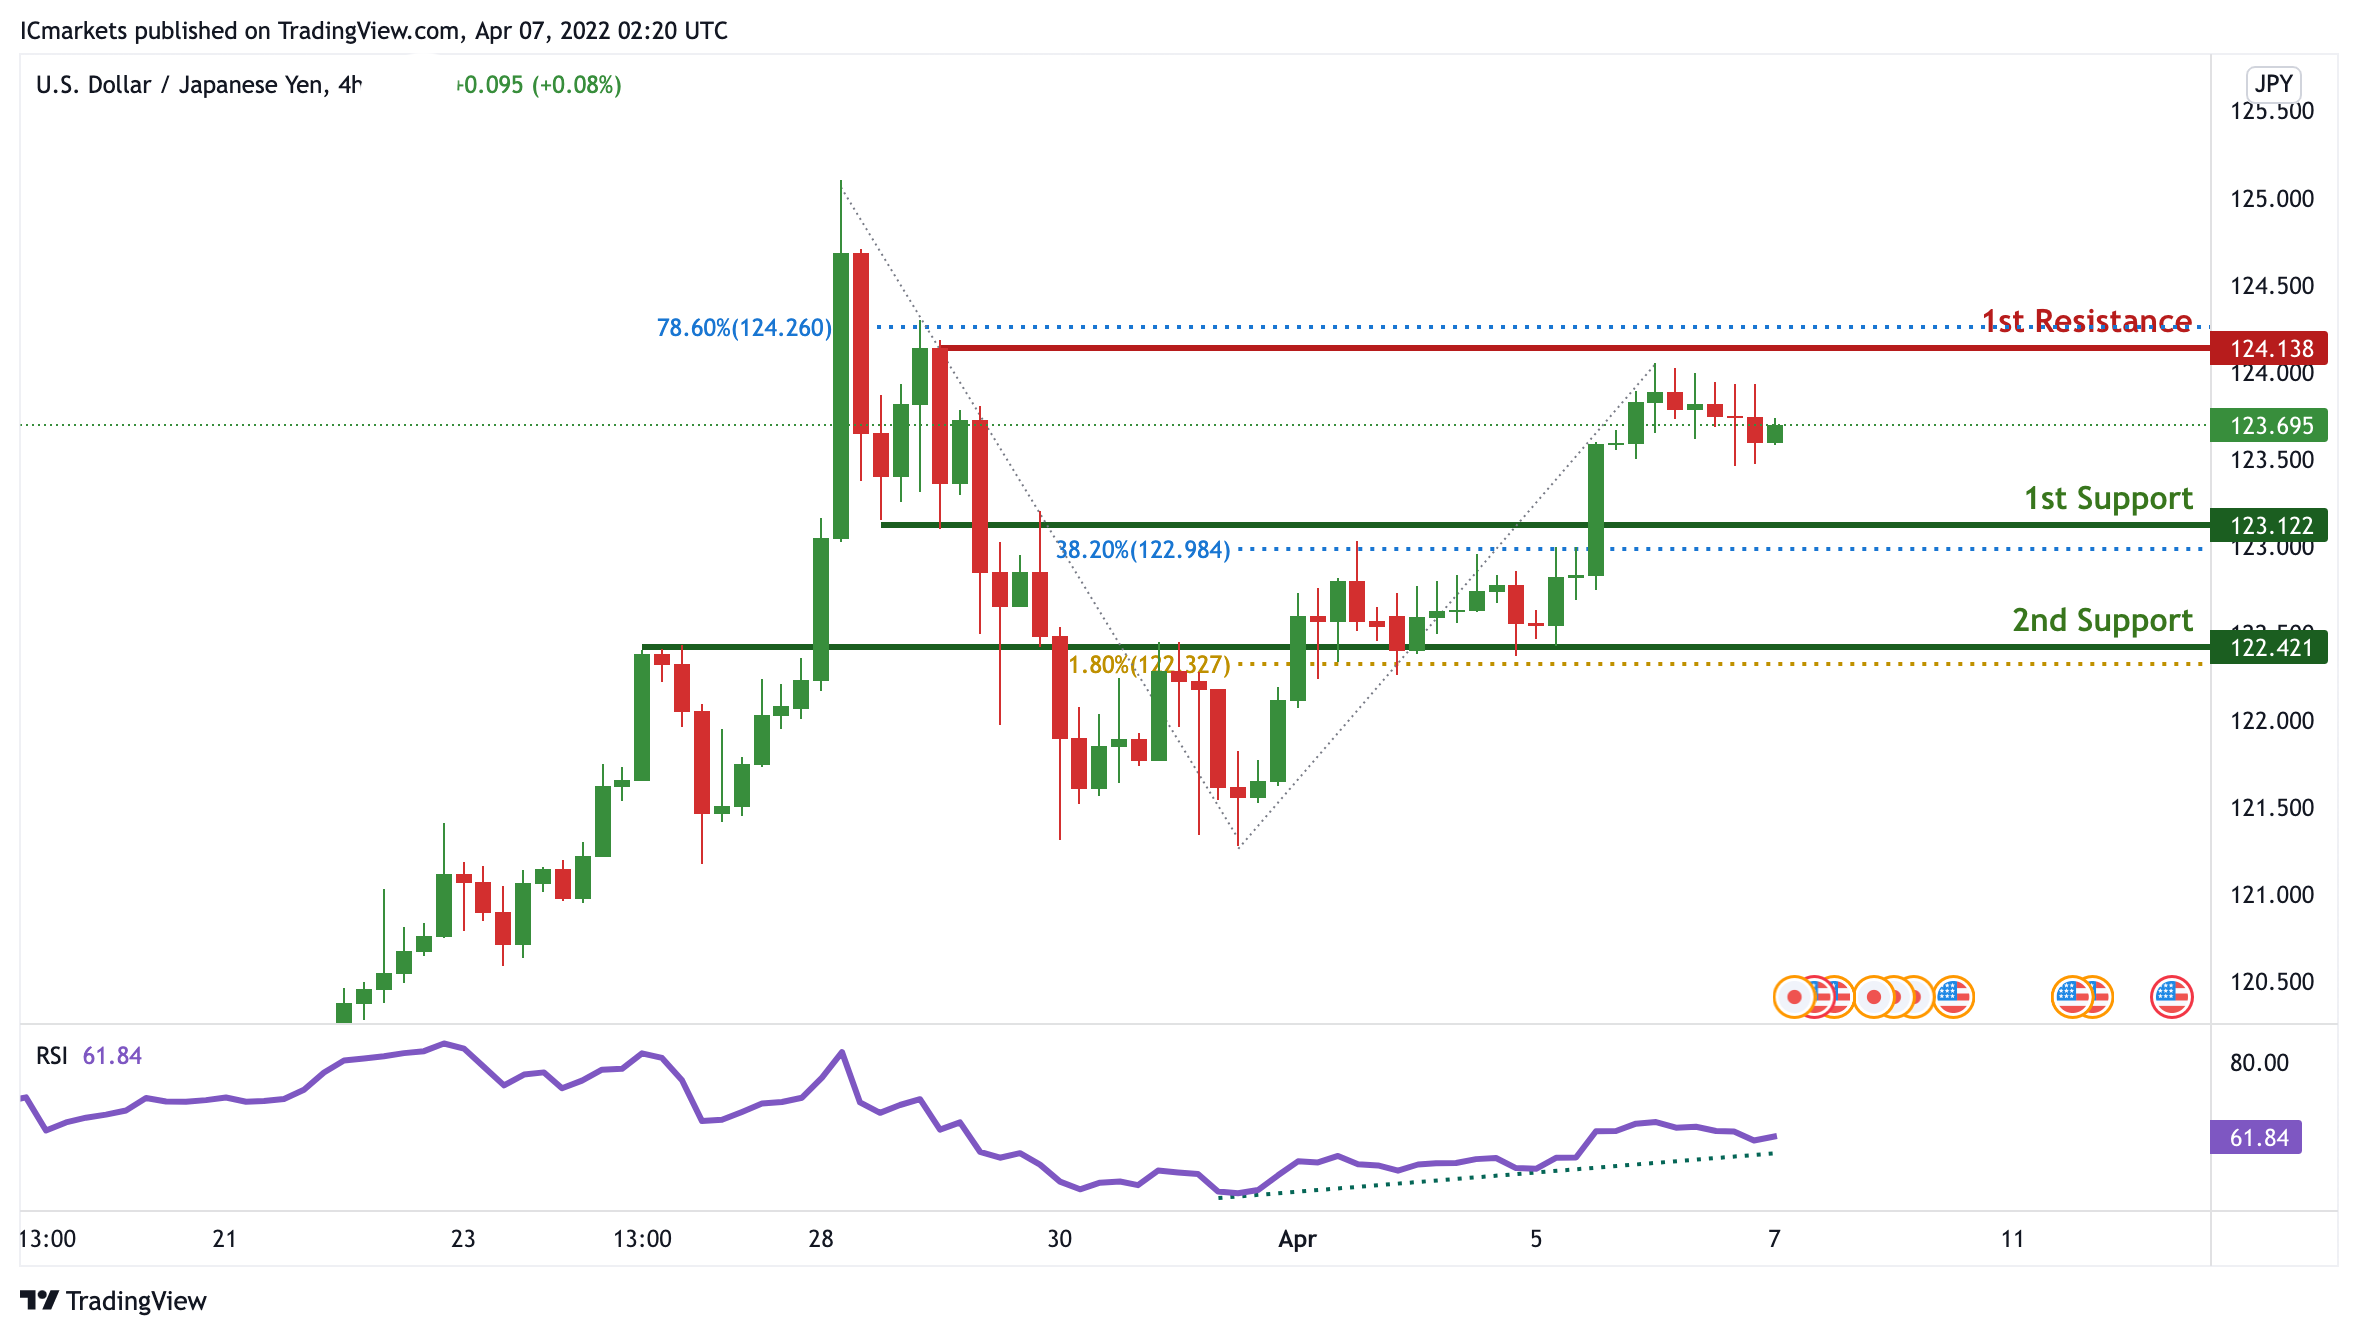
On the H4 timeframe, prices have bounced off a pivot. We see the potential for further bullish continuation at 123.122 in line with 38.2% Fibonacci retracement towards our 1st resistance at 124.138 in line with 78.6% Fibonacci Projection. RSI is on bullish momentum, further supporting our bullish bias.
Areas of consideration:
- H4 time frame, 1st resistance at 124.138
- H4 time frame, 1st support at 123.122
AUD/USD:
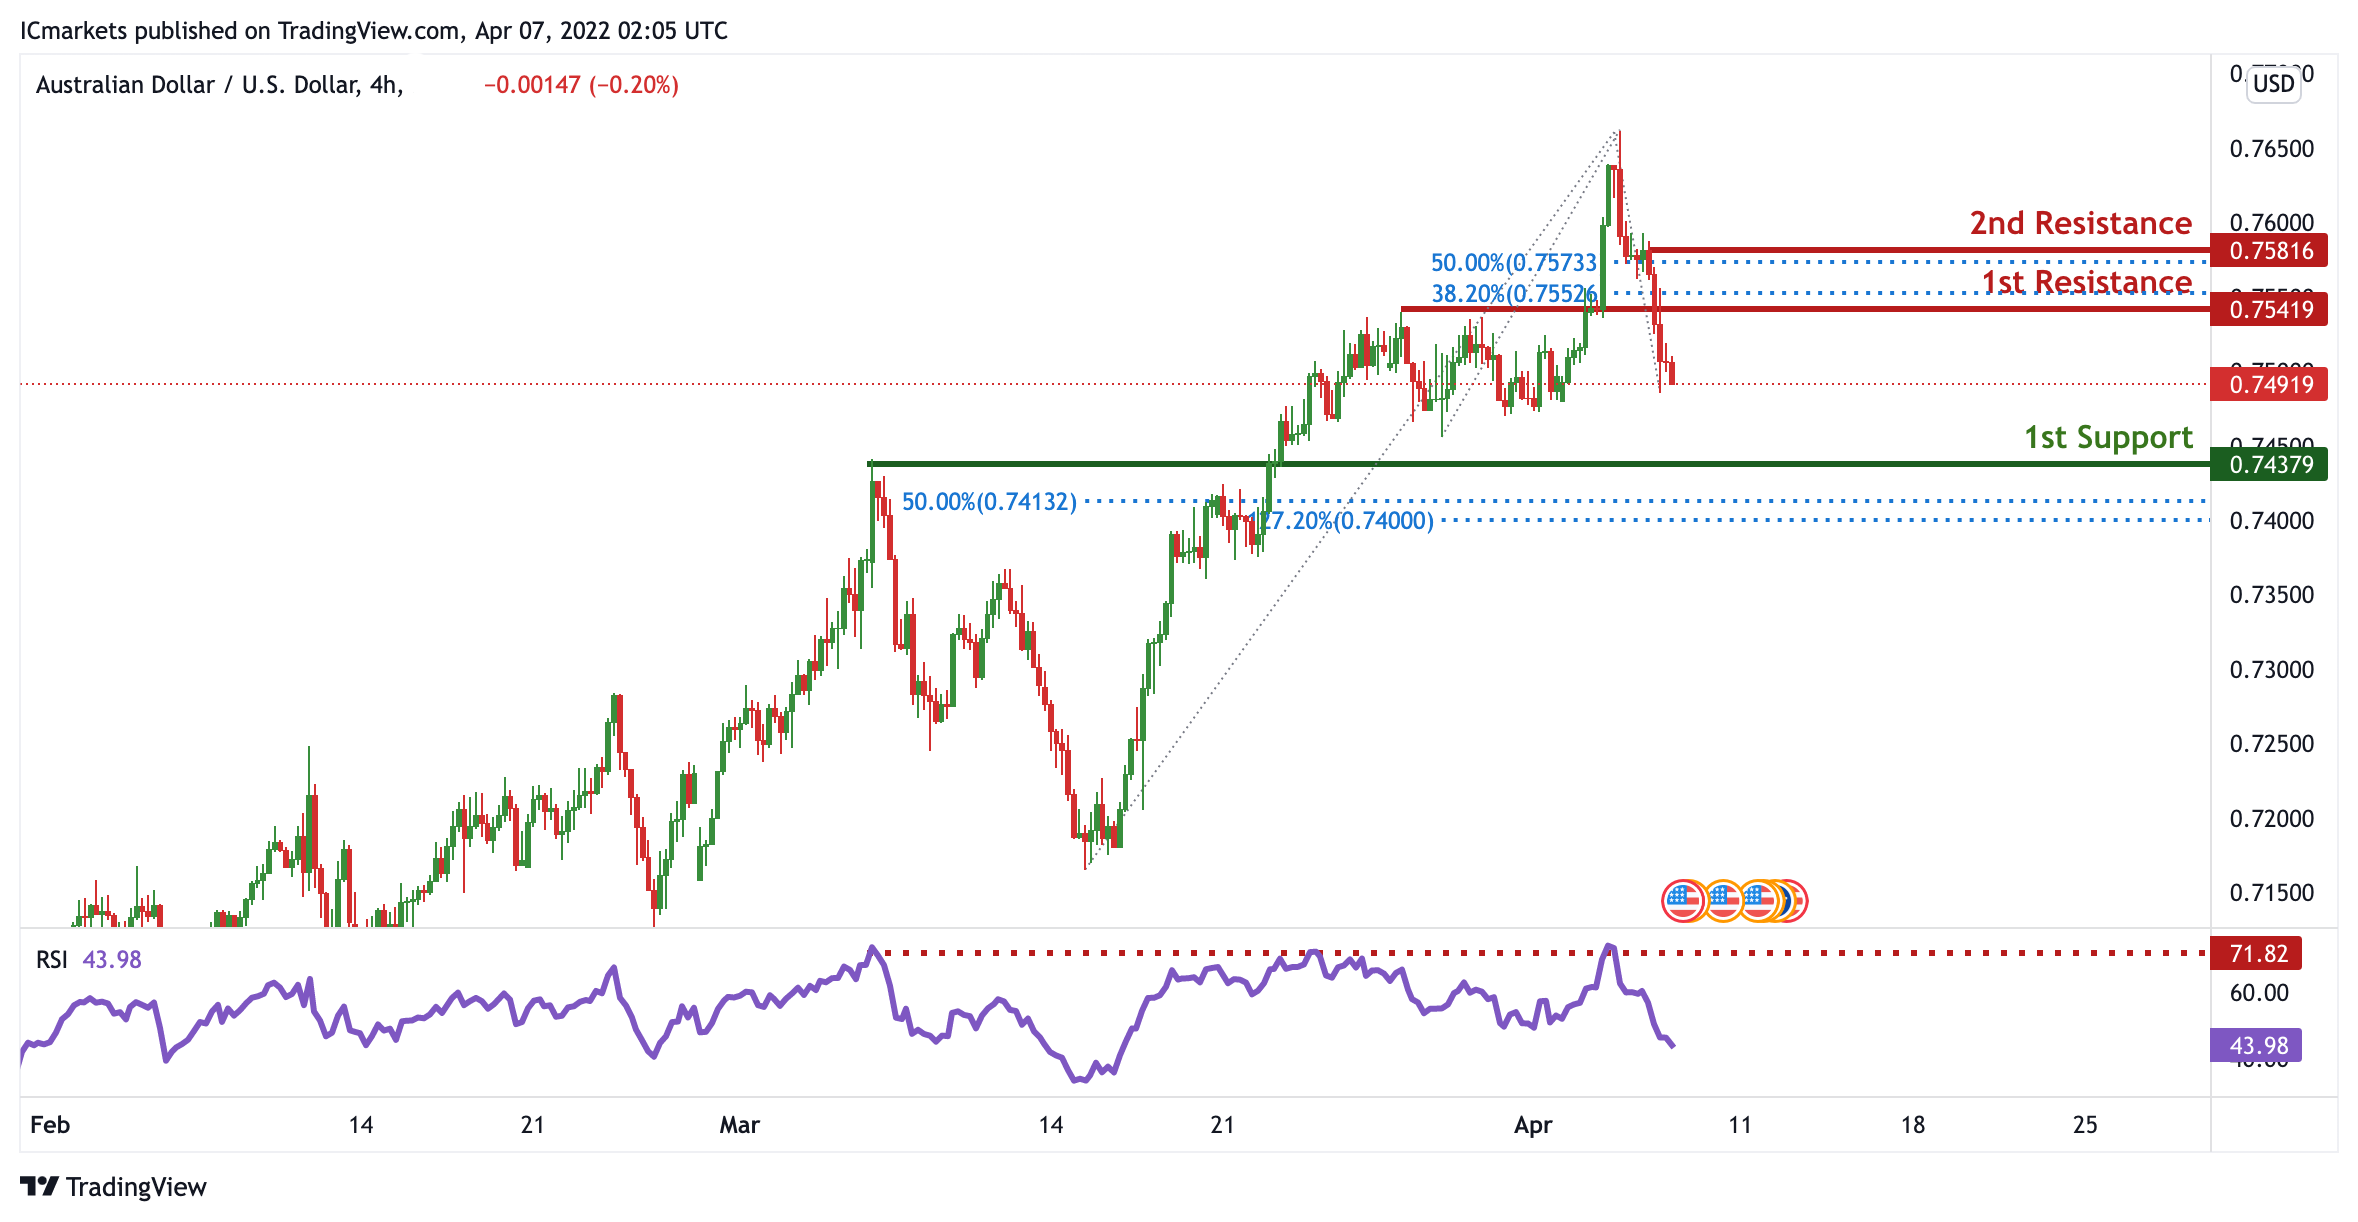
On the H4 timeframe, prices have bounced off a pivot. We see the potential for a dip from our 1st resistance at 0.75419 in line with 38.2% Fibonacci retracement towards our 1st support at 0.74379 which is an area of Fibonacci confluences. Our bearish bias is supported by RSI being at levels where dips previously occurred.
Areas of consideration
- H4 1st resistance at 0.75419
- H4 1st support at 0.74379
NZD/USD:
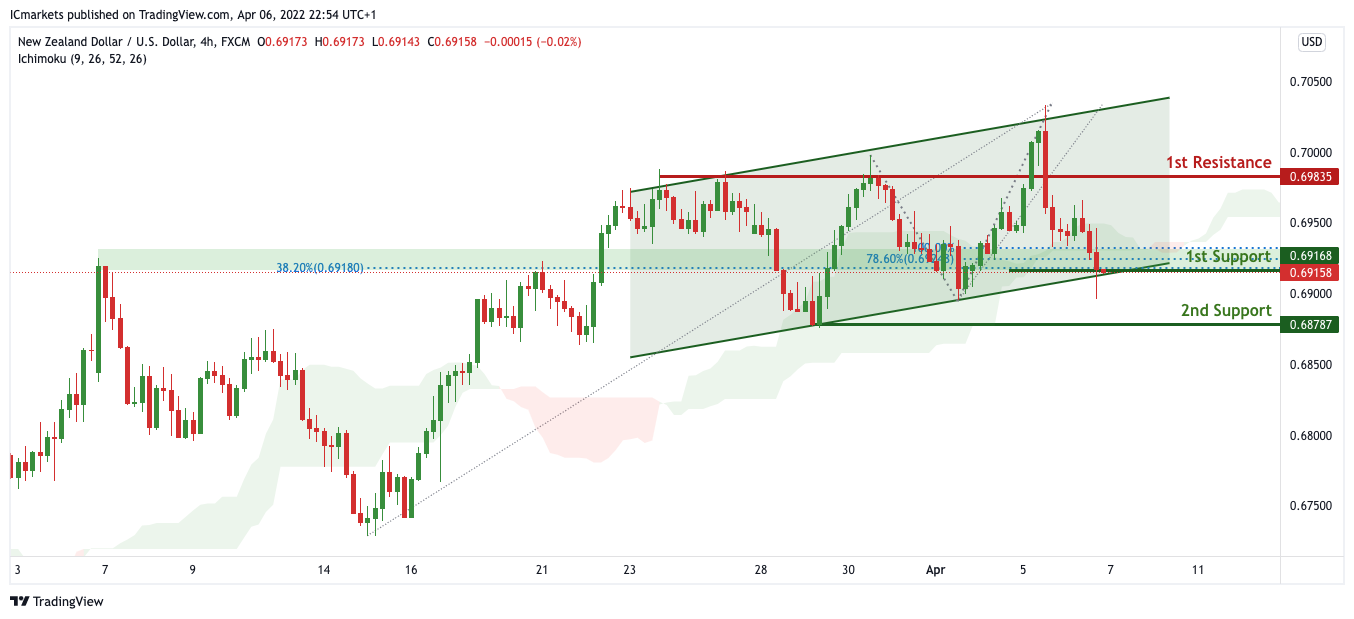
On the H4, with price expected to bounce off the support of the ichimoku cloud, we have a bias that price will rise to our 1st resistance at 0.69835 in line with the swing high resistance from our 1st support at 0.69168 in line with the horizontal overlap support, 78.6% Fibonacci projection. Alternatively, price may break 1st support structure and head for 2nd support at 0.68787 in line with the swing low support.
Areas of consideration:
- H4 time frame, 1st support at 0.69168
- H4 time frame, 1st resistance at 0.69835
USD/CAD:
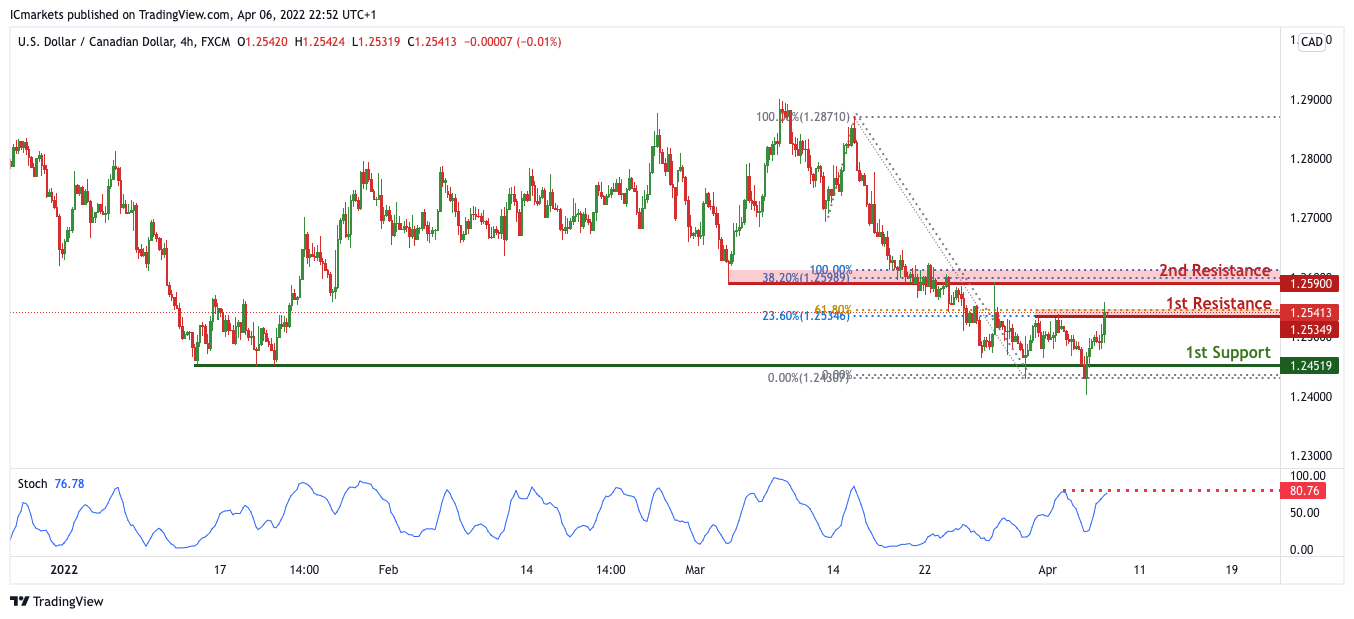
On the H4, with price expected to reverse off the stochastic indicator, we expect to see a potential for bearish drop from our 1st resistance of 1.25349 in line with the 23.6% fibonacci retracement and 61.8% Fibonacci projection towards our 1st support level at 1.24519 in line with the swing low support. Alternatively, If price breaks out, it can potentially move towards our 2nd resistance level at 1.25900 which is in line with the 38.2% Fibonacci retracement and 100% Fibonacci projection.
Areas of consideration:
- H4 time frame, 1st support at 1.24519
- H4 time frame, 1st resistance at 1.25349
OIL:
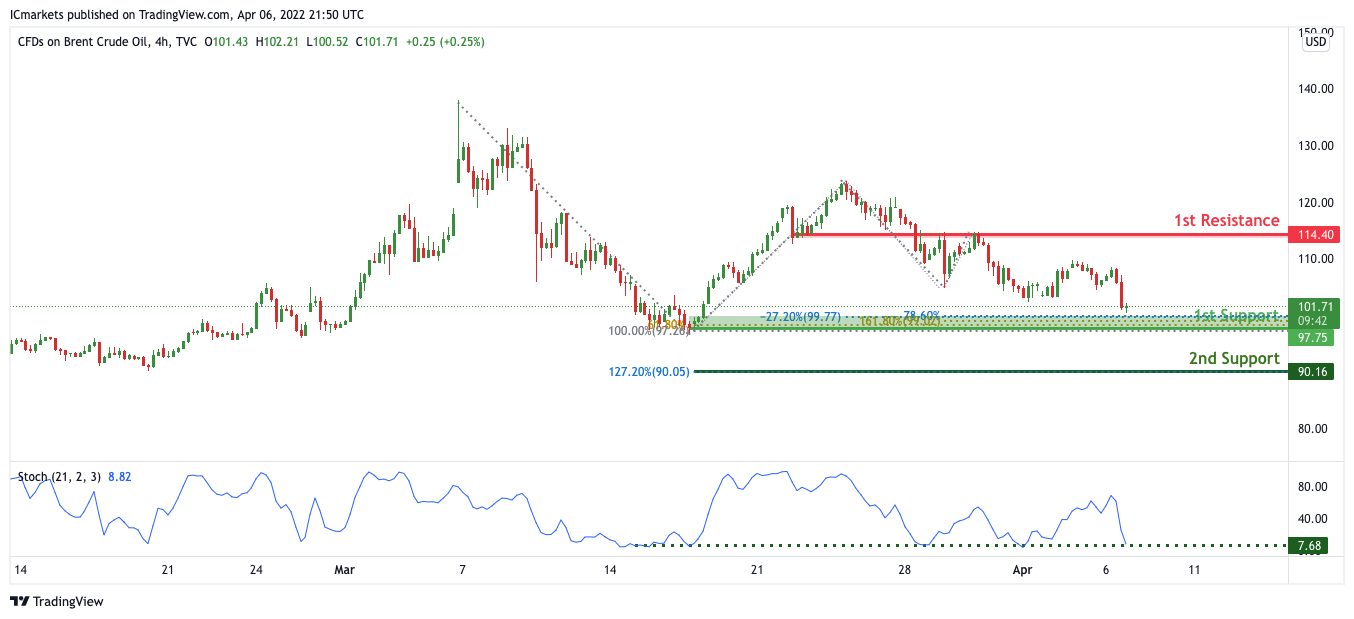
On the H4, with price expected to bounce off the support of the stochastics indicator, we have a bias that price will rise to our 1st resistance at 114.40 in line with the horizontal pullback resistance from our 1st support at 101.71 in line with the horizontal overlap support, 78.6% Fibonacci projection. Alternatively, price may break 1st support structure and head for 2nd support at 90.16 in line with the 127.2% Fibonacci extension
Areas of consideration:
- H4 time frame, 1st resistance of 114.40
- H4 time frame, 1st support of 101.71
Dow Jones Industrial Average:
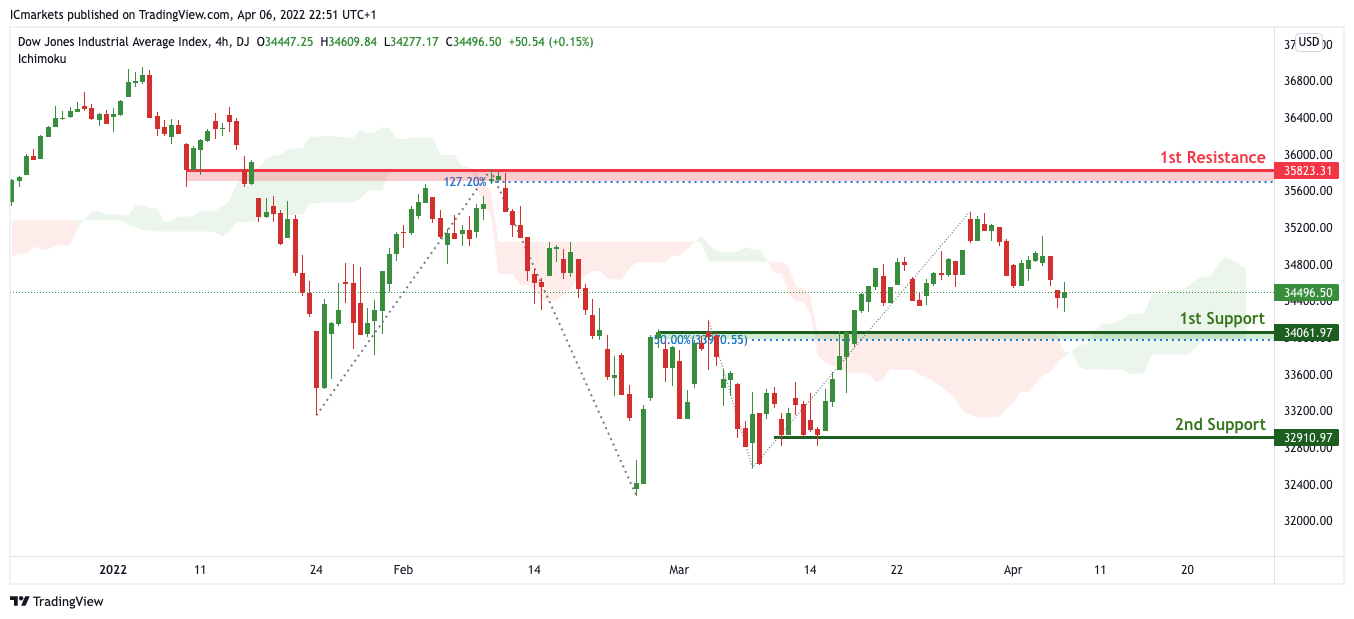
On the H4, with price moving above the ichimoku cloud, we have a bias that price will rise to our 1st resistance at 35823 in line with the 127.2% Fibonacci extension from our 1st support at 34061 in line with the horizontal pullback support and 50% Fibonacci retracement. Alternatively, price may break 1st support structure and head for 2nd support at 32910 in line with the horizontal swing low support.
Areas of consideration :
- H4 1st support at 34569
- H4 1st resistance at 35823
GBP/JPY Daily Outlook
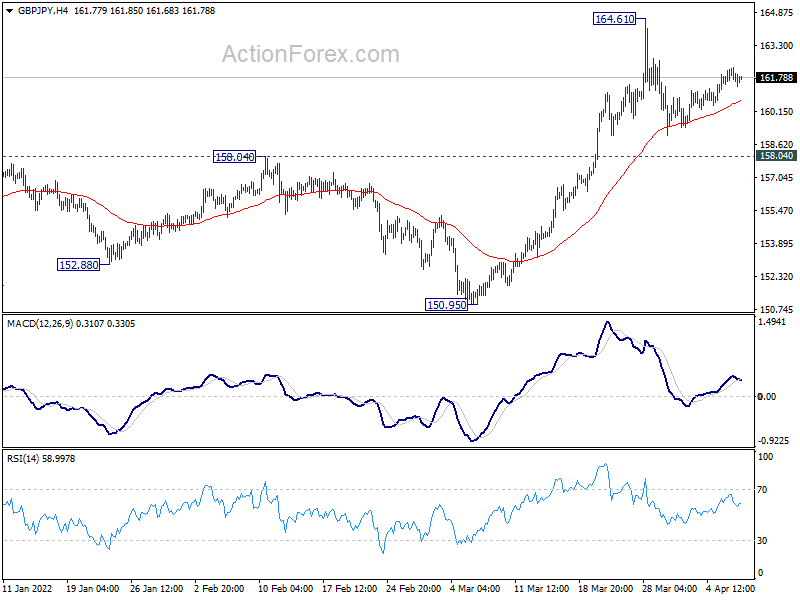
Daily Pivots: (S1) 161.44; (P) 161.86; (R1) 162.19; More...
GBP/JPY is staying in consolidation from 164.61 and intraday bias remains neutral. Outlook remains bullish with 158.04 resistance turned support intact, and further rally is expected. On the upside, break of 164.61 will resume larger up trend to long term fibonacci level at 167.93. However, firm break of 158.19 will turn bias to the downside and bring deeper pull back.
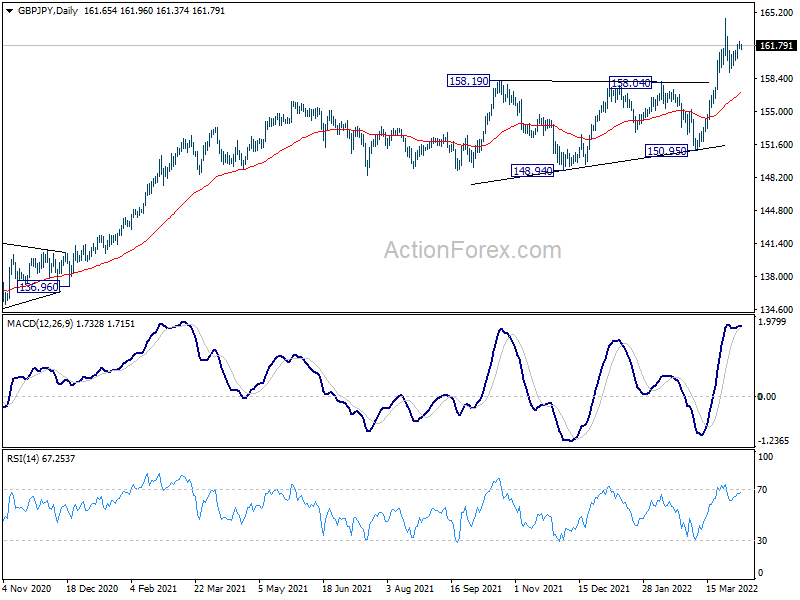
In the bigger picture, up trend from 123.94 (2020 low) is still in progress, and notable support from 55 week EMA affirms medium term bullishness. Next target is 61.8% retracement of 195.86 (2015 high) to 122.75 (2016 low) at 167.93. Sustained break there will be a long term bullish signal. This will now remain the favored case as long as 150.95 support holds.
EUR/JPY Daily Outlook
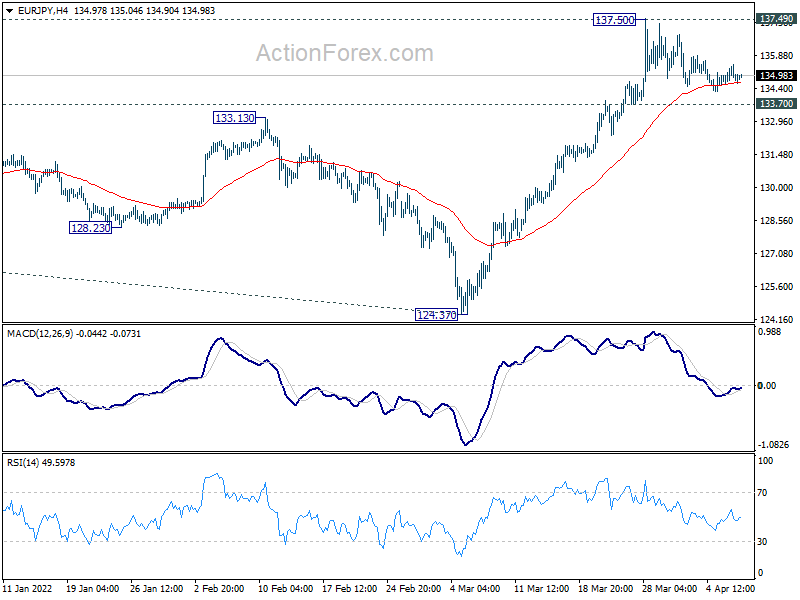
Daily Pivots: (S1) 134.58; (P) 135.03; (R1) 135.35; More....
Intraday bias in EUR/JPY remains neutral as consolidation from 137.50 is extending. With 133.70 minor support intact, further rally is expected. On the upside, sustained break of 137.49 resistance will resume larger up trend for 144.06 projection level next. However, firm break of 133.70 will indicate short term topping, and turn bias back to the downside for deeper pull back.
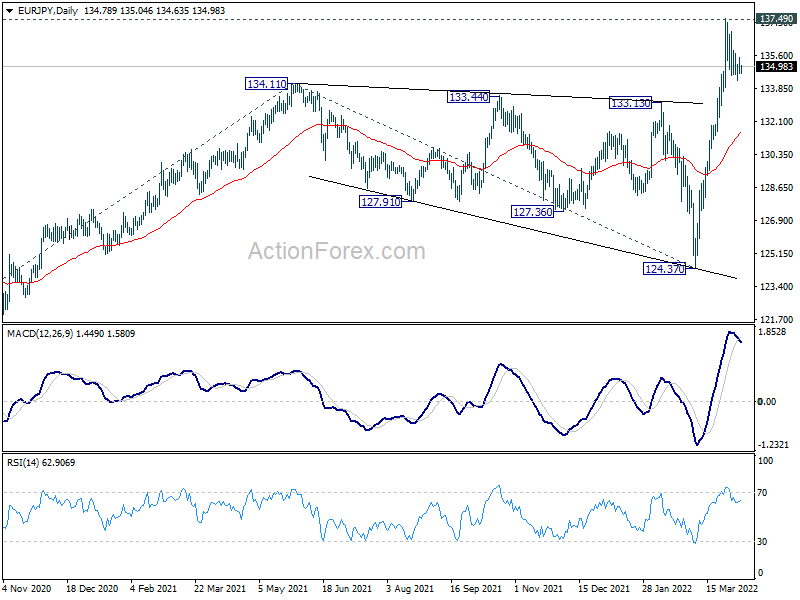
In the bigger picture, up trend from 114.42 (2020 low) is in progress. Sustained break of 137.49 (2018 high) will resume larger pattern from 109.30 (2016 low). Next target will be 100% projection of 114.42 to 134.11 from 124.37 at 144.06. In any case, outlook will now remain bullish as long as 124.37 support holds, in case of deep pull back.
EUR/GBP Daily Outlook
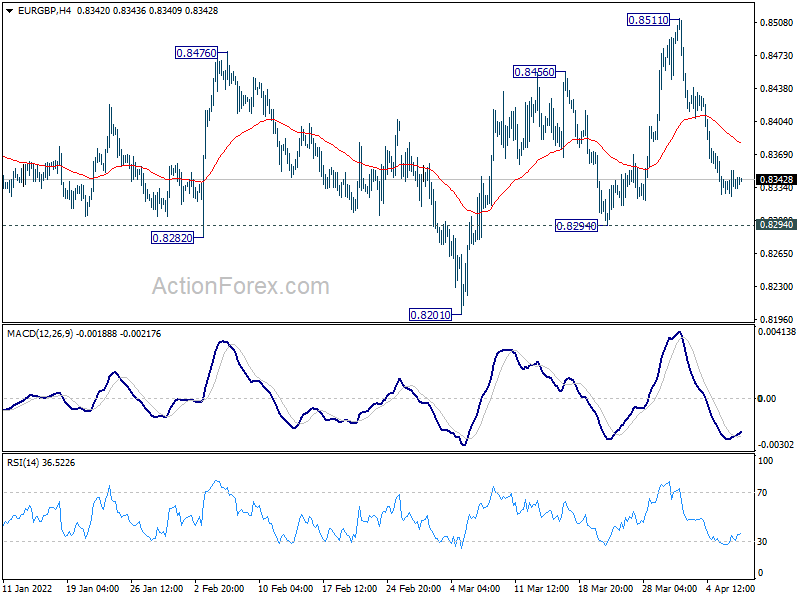
Daily Pivots: (S1) 0.8325; (P) 0.8340; (R1) 0.8353; More...
Intraday bias in EUR/GBP stays neutral for the moment. On the downside, break of 0.8294 will argue that rebound from 0.8201 has completed at 0.8511, and revive near term bearishness. Intraday bias will be back on the downside for retesting 0.8201 low. On the upside, however, break of 0.8511 will reaffirm that 0.8201 is a medium term bottom, and target 0.8697 medium term fibonacci level next.
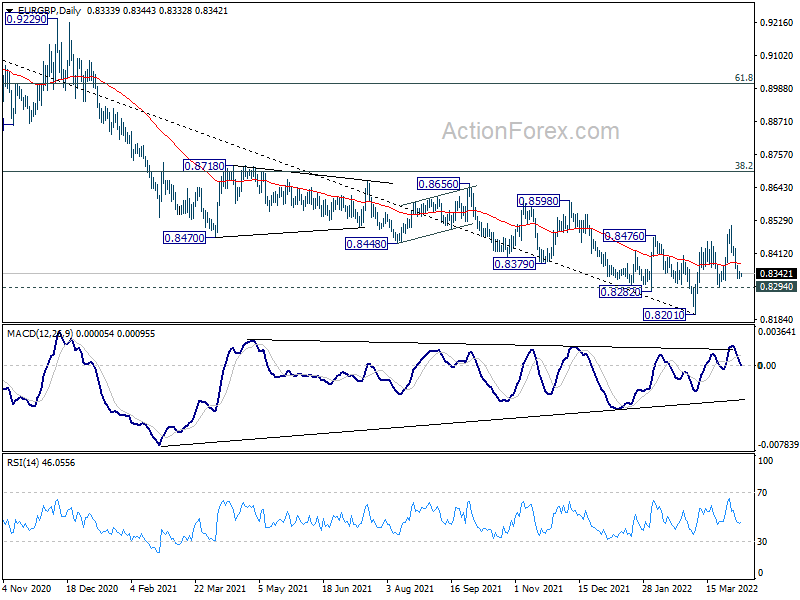
In the bigger picture, a medium term bottom should be in place at 0.8201, on bullish convergence condition in daily and weekly MACD. Rise from there could either be a correction to the down trend from 0.9499 (2020 high), or a medium term up trend itself. In either case, further rise should be seen to 38.2% retracement of 0.9499 to 0.8201 at 0.8697. Sustained break there will target 61.8% retracement at 0.9003. This will remain the favored case as long as 0.8294 support holds.
EUR/AUD Daily Outlook
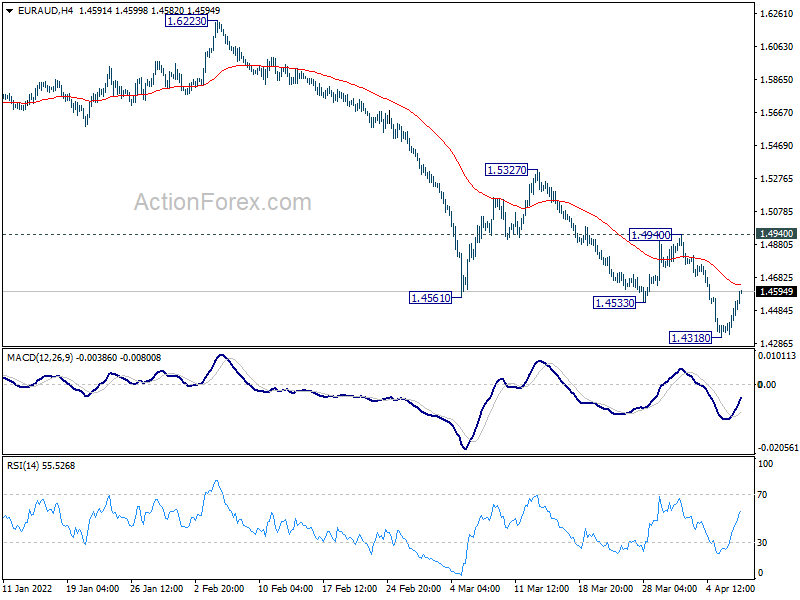
Daily Pivots: (S1) 1.4386; (P) 1.4464; (R1) 1.4587; More...
A temporary low is formed at 1.4318 in EUR/AUD with current recovery, and intraday bias is turned neutral first. Outlook stays bearish as long as 1.4940 resistance holds. Break of 1.4318 will resume larger down trend to 1.3624 long term support next. On the upside, however, firm break of 1.4940 will indicate short term bottoming and turn bias back to the upside for 1.5327 resistance instead.
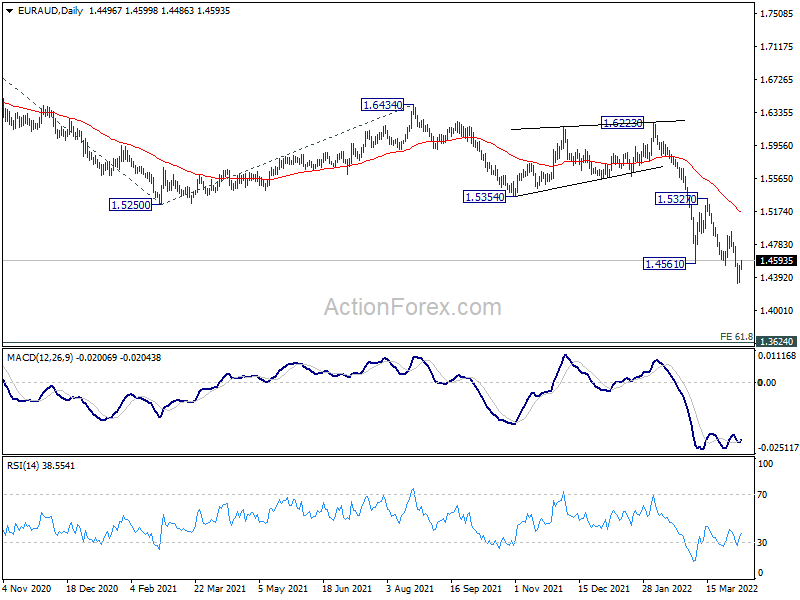
In the bigger picture, fall from 1.9799 is seen as a long term impulsive move. Next target is 61.8% projection of 1.9799 to 1.5250 from 1.6434 at 1.3623, which is close to 1.3624 long term support (2017 low). Some support could be seen there to bring interim rebound. But overall, break of 1.5354 support turned resistance is needed to be the first sign of medium term bottoming. Otherwise, outlook will stay bearish in case of recovery.
EUR/CHF Daily Outlook
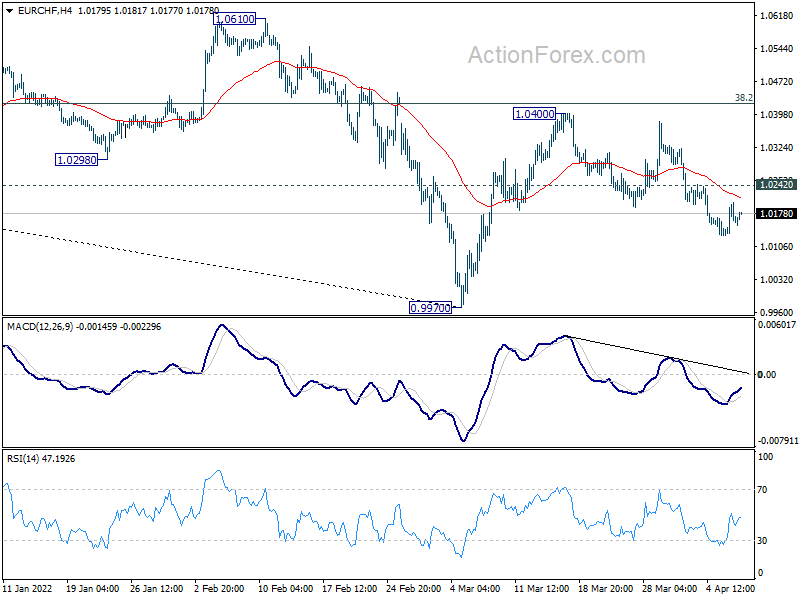
Daily Pivots: (S1) 1.0134; (P) 1.0170; (R1) 1.0204; More....
Further fall remains in favor in EUR/CHF with 1.0242 minor resistance intact. Rebound from 0.9770 could have completed at 1.0400 already, ahead of 38.2% retracement of 1.1149 to 0.9970 at 1.0420. Further fall would be seen back to retest 0.9970 low. However, break of 1.0242 will turn bias back to the upside for 1.0400 resistance again.
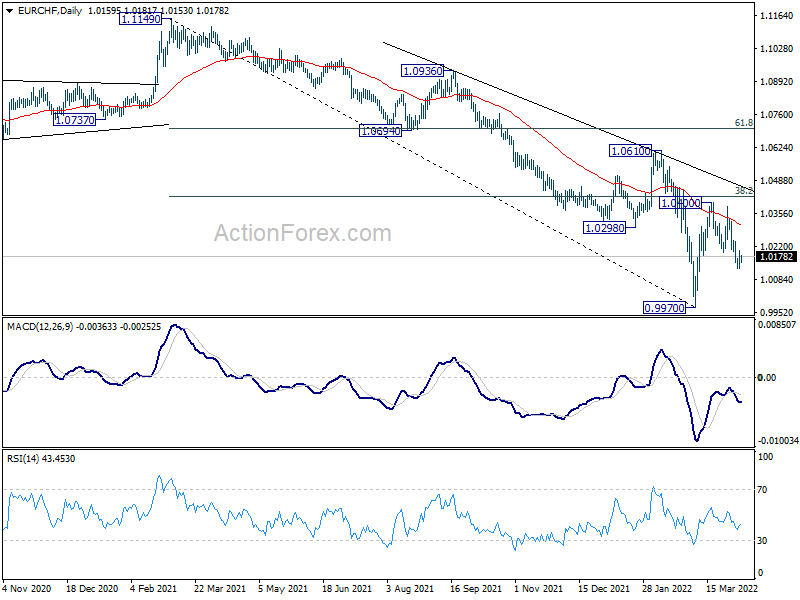
In the bigger picture, long term down trend from 1.2004 (2018 high) is still in progress. Next target is 100% projection of 1.2004 to 1.0505 to 1.1149 at 0.9650. In any case, sustained break of 1.0505 support turned resistance is needed to be the first sign of medium term bottoming. Otherwise, outlook will remain bearish.
EUR/USD Daily Outlook
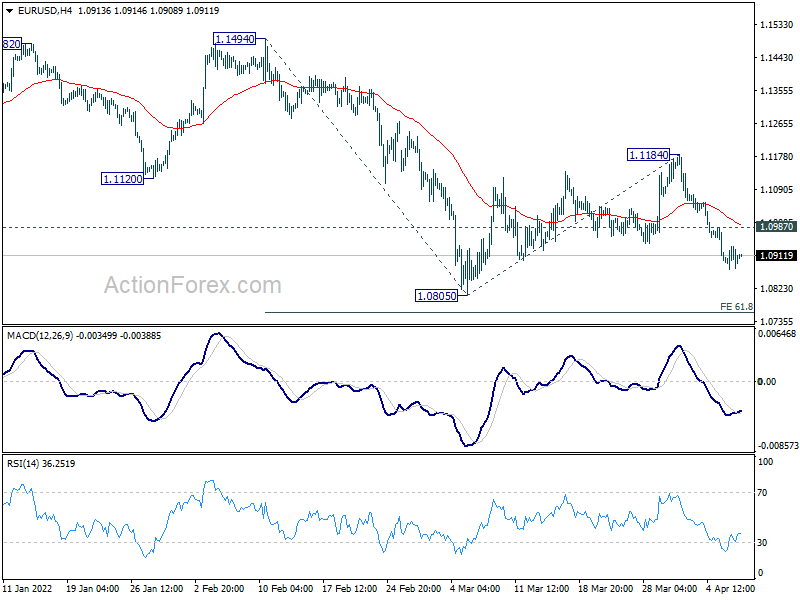
Daily Pivots: (S1) 1.0869; (P) 1.0903 (R1) 1.0932; More...
Intraday bias in EUR/USD remains mildly on the downside for retesting 1.0805 low first. Firm break there will resume larger down trend from 1.2248. Next target is 61.8% projection of 1.1494 to 1.0805 from 1.1184 at 1.0758, and then 100% projection at 1.0495. On the upside, above 1.0987 minor resistance will mix up the outlook and turn intraday bias neutral again.
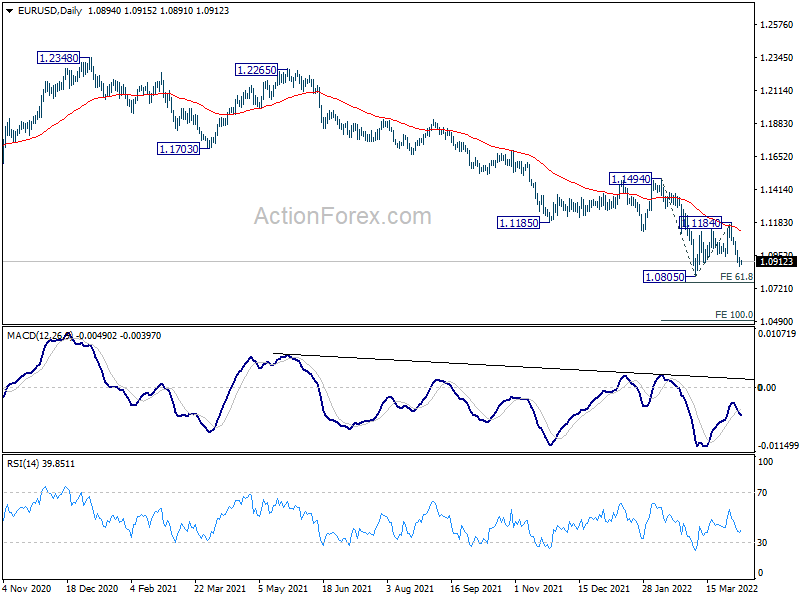
In the bigger picture, the decline from 1.2348 (2021 high) is expected to continue as long as 1.1494 resistance holds. Firm break of 1.0635 (2020 low) will raise the chance of long term down trend resumption and target a retest on 1.0339 (2017 low) next. Nevertheless, break of 1.1494 will maintain medium term neutral outlook, and extending term range trading first.
GBP/USD Daily Outlook
Daily Pivots: (S1) 1.3040; (P) 1.3074; (R1) 1.3102; More...
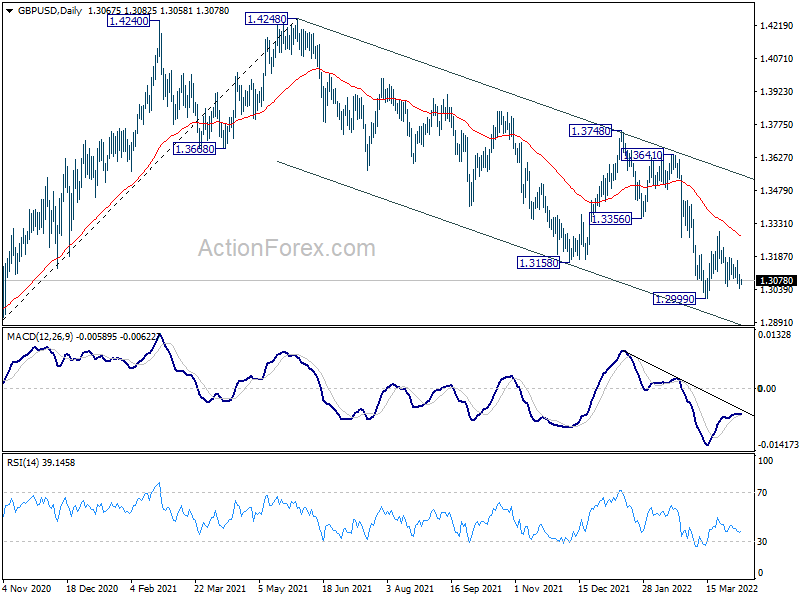
Intraday bias in GBP/USD remains neutral as consolidation from 1.2999 is still extending. Further decline is mildly in favor with 1.3297 resistance intact. On the downside, firm break of 1.2999 will resume larger down trend from 1.4248. However, firm break of 1.3297 will turn bias back to the upside for stronger rebound.
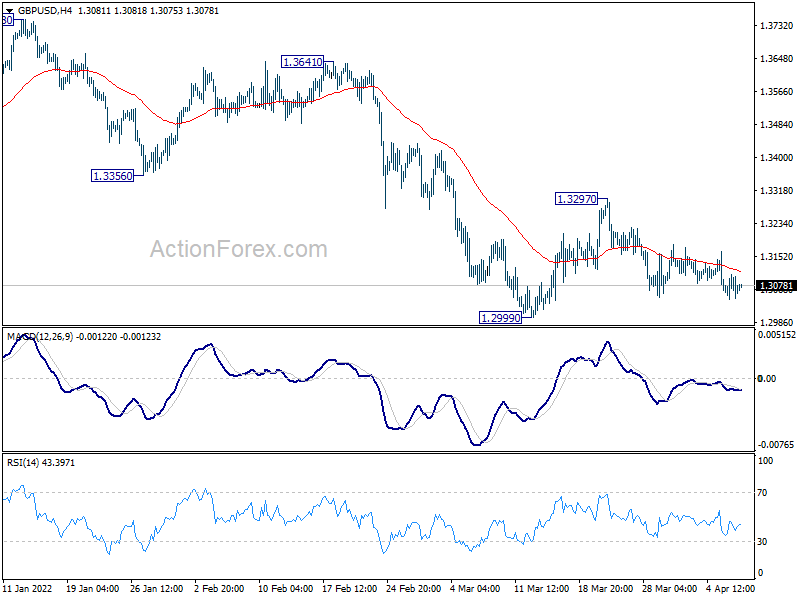
In the bigger picture, current development suggests that the up trend from 1.1409 (2020 low) has completed at 1.4248. Decline from 1.4248 could still be a corrective move, or it could be the start of a long term down trend. In either case, deeper decline would be seen back to 61.8% retracement of 2.1161 to 1.1409 at 1.2493. In any case, break of 1.3748 resistance is needed to indicate medium term bottoming, or outlook will stay bearish.
USD/CHF Daily Outlook
Daily Pivots: (S1) 0.9299; (P) 0.9325; (R1) 0.9358; More....
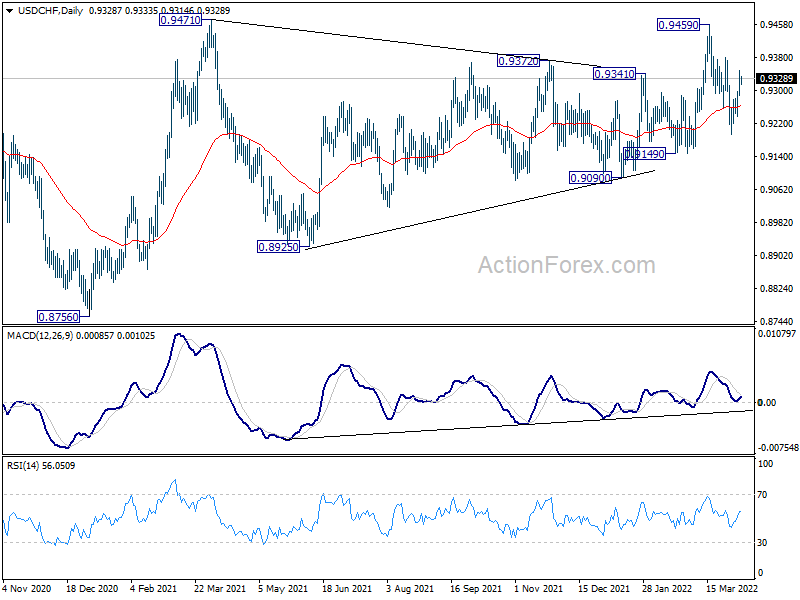
Intraday bias in USD/CHF remains neutral first, with focus on 0.9380 resistance. Firm break there will indicate that fall from 0.9459 has completed with three wave down to 0.9193. Such development will revive near term bullishness and turn bias back to the upside for 0.9459 and then 0.9471 resistance. On the downside, however, below 0.9236 will turn bias to the downside for 0.9149 structural support next.
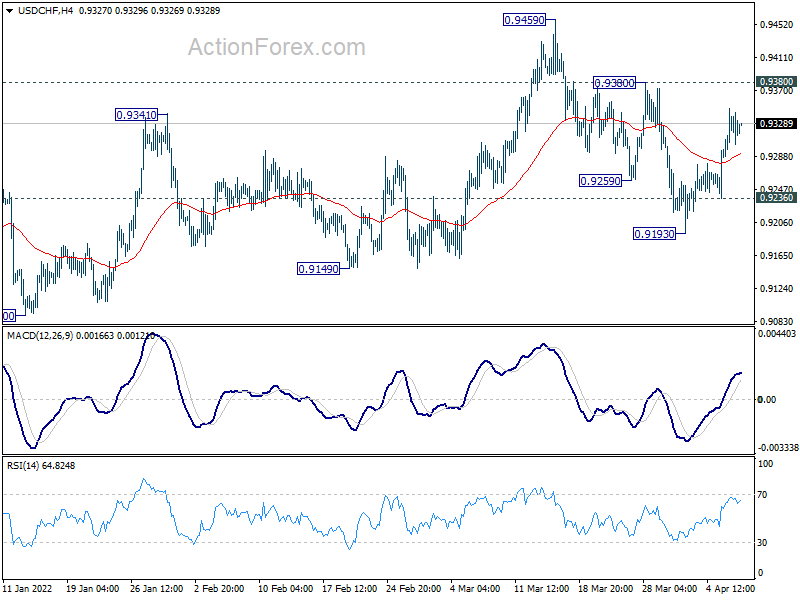
In the bigger picture, medium term outlook will be neutral at best as long as 0.9471 resistance holds. Larger down trend could still extend through 0.8756 (2021 low). However, firm break of 0.9471 will argue that whole down trend form 1.0342 (2016 high), has completed with waves down to 0.8756. A medium term up trend should be set up to target 1.0237/0342 resistance zone.