Sample Category Title
Asian Equities Follow Wall Street Higher
Asian markets rally
The perpetual armies of bullish investors dominated New York overnight, and also key fast-money markets like Japan today, as they wishfully priced there was no more bad news to come from Eastern Europe or the Fed. That sparked an “efficient market pricing” rally that saw New York record some impressive gains, with “value” the winner, over growth. The S&P 500 finished 1.15% higher, while the Nasdaq leapt 1.96% higher, and the Dow Jones gained 0.76%. In Asia, the rally continues, US futures on all three indexes creeping 0.15% higher despite US yields also rising in Asia, along with Australian CGBs and Japanese JGBS.
The Nikkei 225 has seen hot money pouring in thanks to a much weaker yen today boosting export hopes (while ignoring the energy bill). The Nikkei 225 has soared 2.75% higher, while South Korea’s Kospi has risen by 0.75%. Mainland China markets have climbed modestly, Covid-19 fears tempering gains. The Shanghai Composite and CSI 300 have risen by 0.35%. China’s tech-heavyweight buyback fever has lifted the Hang Seng to a 1.25% gain.
In regional markets, Singapore is 0.45% higher ahead of inflation data, while Taipei has rallied by 0.90%, and Kuala Lumpur has gained 0.70%, with Jakarta unchanged. Bangkok is 0.20% higher and Manila has fallen by 0.35%. Australian markets, perhaps with one eye on higher US and Australian yields today, have posted only modest gains. The ASX 200 and All Ordinaries rose by around 0.50%.
European markets also joined in the US ‘peak-Ukraine, peak-Fed” fever yesterday, a palpable sigh of relief flowing through European markets as the EU declined to embargo Russian oil. The slowing flows via the CPC may yet deliver another dose of reality to Europe and its energy vulnerability. European equities have posted some impressive gains this past week, maintaining them from here will be challenging I believe.
What’s this Rally For?
Equities rallied and treasuries dived yesterday, as a sign that investors are cheering the Federal Reserve’s (Fed) plan to deal more aggressively with the skyrocketing inflation – which is certainly more toxic in the longer run than higher rates for the economic tissue.
But in reality, the Fed is just figuring out the least bad policy to rectify the terrible mistake it made by letting inflation run this hot. And scaling back too rapidly to return to the far-missed inflation target could cause a recession. This is what the flattening, and inversion of the US yield curve warns.
The good news is that Powell’s got the market wind behind his back – for now. However, the market support could rapidly wane if the economic data begins softening and corporate earnings start slowing.
Anyway, the S&P500 had another strong session yesterday gaining more than 1%, and Nasdaq rallied close to 2% as technology stocks led the rally. The index crossed above its 50-DMA for the first time since the beginning of the year, and stepped into the medium term bullish consolidation zone after clearing the major Fibonacci 38.2% level on November - March selloff. Will it last? Hard to tell. The volatility is coming down, as investors welcome the Fed’s decision to step on the gas for tightening the policy, yet the hangover could soon kick in, as the news doesn’t match the market optimism.
Speaking of optimism, GameStop soared more than 30% as AMC gained 15%. Chinese stocks had another great day yesterday, as the share price rallied 11%, and more than 55% since last week.
Heavy battle near $110 per barrel
Oil trading is hectic these days, as prices swing between those who rush to sell the top near the $115pb level, and those who rush to buy below $110pb.
The price of a barrel of US crude stabilized near $110 this morning, but the news that Germany and Hungary are willing to put the brakes on a potential Russian oil embargo softens the bulls’ hands in the short run. The long term outlook remains positive.
More sanctions
EU countries will discuss with Biden on Thursday about new sanctions on Russia, and what to do if China continues supporting a nation that the West wants to isolate, hoping to stop the war in Ukraine.
So far, the sanctions didn’t stop Putin from increasing the intensity of the war in Ukraine, and the ruble which initially lost up to 40% of its value against the US dollar recovered a good part of losses. And the country didn’t even default on its interest payments despite big challenges.
Even if the West increases the intensity of their economic attack on Russia, as long as oil and other commodities come from Russia, the moves will weaken but not kill the beast.
Bond Sell-off Continues
Market movers today
Today we get the euro area consumer confidence from March, an early signal of how consumer sentiment has been affected by the war in Ukraine. Consensus expects a drop to -12.9 from -8.8 in February. Otherwise, another quiet day on the data front.
Given what looks like a frozen conflict in Ukraine for now, markets are also eyeing other topics. Today we have two ECB speakers, Nagel and Visco, on the wires. Also, Fed's Bullard discussing US economic outlook in the evening.
This morning, we published a note where we discuss the economic implications from the war in Ukraine on Russia, see Research Russia: EU embargo on Russian energy could be a game-changer, 23 March. We highlight that the EU still has room to substantially add pressure on Russia by imposing an energy embargo. Furthermore, the 'Fortress Russia' policies have already significantly weighed on households' living standards and the war ensures that weakness will persist for years to com
The 60 second overview
Fed: The Fed's new mantra seems to be "get to neutral as fast as possible", as FOMC members continue to talk about front-loading rate hikes and even doves like Mary Daly are now calling for tighter policy. No FOMC member is ruling out 50bp rate hikes at this point. With the Fed behind the curve and still high inflation, we see an increasing probability that the Fed will tighten more and faster than we have pencilled in (i.e. risks are skewed towards the Fed hiking by 50bp in both May and June or 75bp in one go). Tighter monetary policy (and financial conditions) and the commodity price shock increase the risk of a global recession 1-2 years down the road, which is also reflected by the very flat US yield curve.
Western sanctions: US President Joe Biden and G7/NATO/EU leaders are meeting in Brussels tomorrow and they are expected to announce new sanctions against Russia, see FT.
Equities: The positive correlation between yields and equities continued, with equities posting solid gains. Risk on with a slight value outperformance - but only mildly so. As a whole, value outperformed growth by around 0.5pp globally despite the US 10y breaching 2.40%. This can be compared to 7pp during the most intense rotation days in January. This summed up to a peculiar sector performance with both financials, consumer discretionary and communication services in the lead. S&P500 1.1%, Dow 0.7%, Nasdaq 2% and Russell 1.1%. Asian markets are continuing its rebound and US futures point slightly upward.
FI: Risk sentiment was positive yesterday and sent yields higher across the board in a bear flattening move. Bunds touched above 0.5% for the first time since 2018 as inflation gained again although energy prices were broadly stable yesterday. US 10yr Treasury yields are now trading around 2.4%. Front end rates sold off again, where the ECB pricing now has 53bp priced for this year, mostly driven by the spill-over from the US after Powell's comments on Tuesday preparing the grounds for a more aggressive calibration in May/onwards.
FX: USD/JPY continue to see upwards pressure as yields rise. Expectations are running high for a hawkish message at tomorrow's Norges Bank meeting.
Credit: Risk-on continued in credit markets yesterday with iTraxx Xover and Main 11bp and 2bp tighter, respectively. HY bonds closed the day 9bp tighter and IG 1bp.
UK CPI rose to 6.2% yoy in Feb, core CPI up to 5.2% yoy
UK CPI rose 0.8% mom in February, above expectation of 0.6% mom. That's also the largest monthly rise since 2009. On a 12-month basis, CPI surged from 5.5% to 6.2% yoy, above expectation of 5.9% yoy. That's the highest on record since 1997, and the highest rate is historic modelled series since March 1992. CPI core also rose from 4.4% yoy to 5.2% yoy, above expectation of 4.8% yoy.
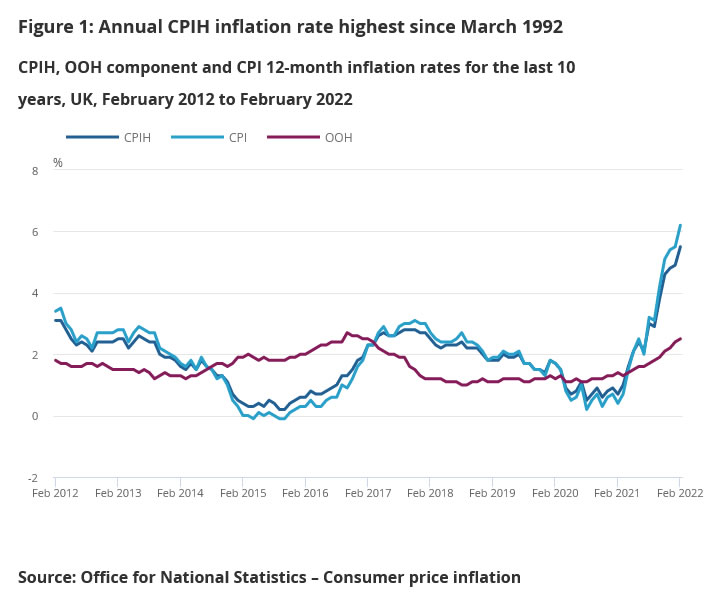
Also release, PPI input was at 1.4% mom, 14.6% yoy in February, versus expectation of 1.2% mom, 13.9% yoy. PPI output was at 0.8% mom, 10.1% yoy, versus expectation of 0.7% mom, 10.2% yoy. PPI output core was at 0.7% mom, 9.9% yoy, versus expectation of 0.9% mom, 10.0% yoy.
EUR/USD Daily Outlook
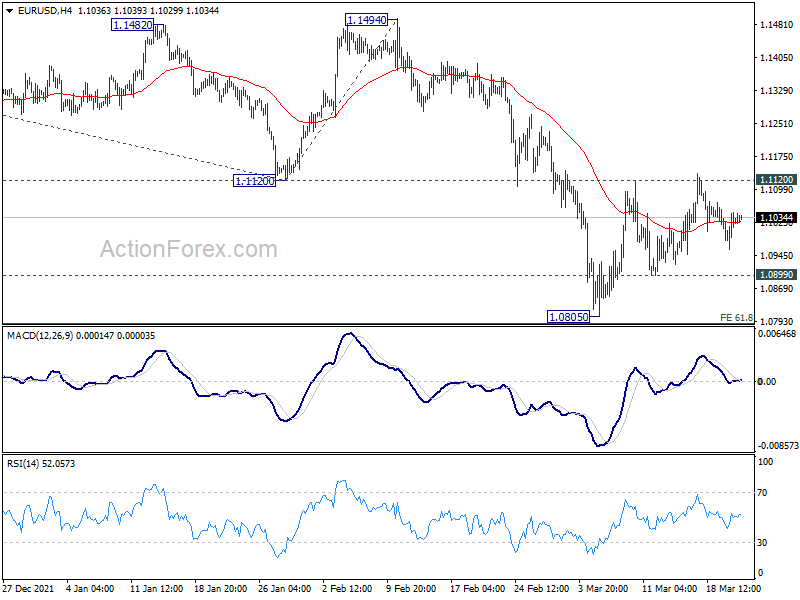
Daily Pivots: (S1) 1.0979; (P) 1.1013; (R1) 1.1064; More...
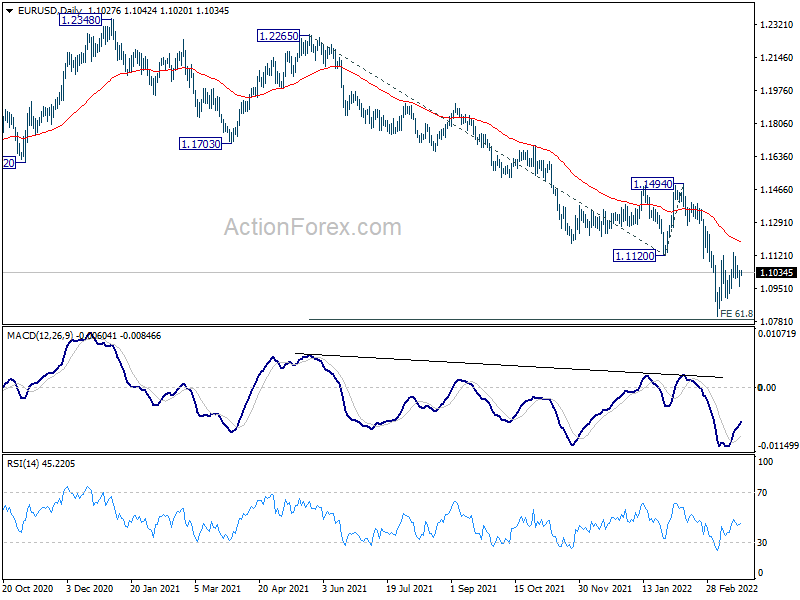
Outlook in EUR/USD is unchanged and intraday bias stays neutral first. On the downside, below 1.0899 minor support will turn bias back to the downside for 61.8% projection of 1.2265 to 1.1120 from 1.1494 at 1.0786. However, firm break of 1.1120 will confirm short term bottoming at 1.0805. Bias will be back on the upside for 55 day EMA (now at 1.1198) and above.
In the bigger picture, the decline from 1.2348 (2021 high) is expected to continue as long as 1.1494 resistance holds. Firm break of 1.0635 (2020 low) will raise the chance of long term down trend resumption and target a retest on 1.0339 (2017 low) next. Nevertheless, break of 1.1494 will maintain medium term neutral outlook, and extending term range trading first.
GBP/USD Daily Outlook
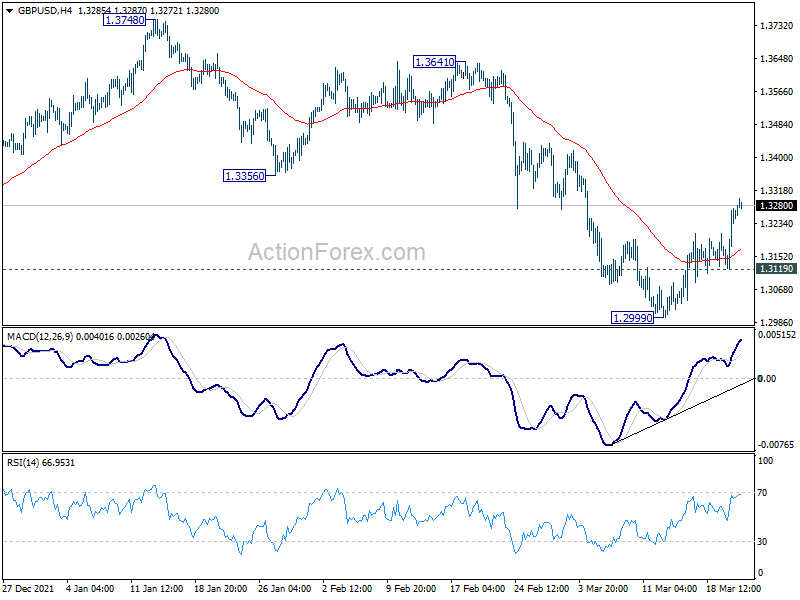
Daily Pivots: (S1) 1.3164; (P) 1.3219; (R1) 1.3318; More...
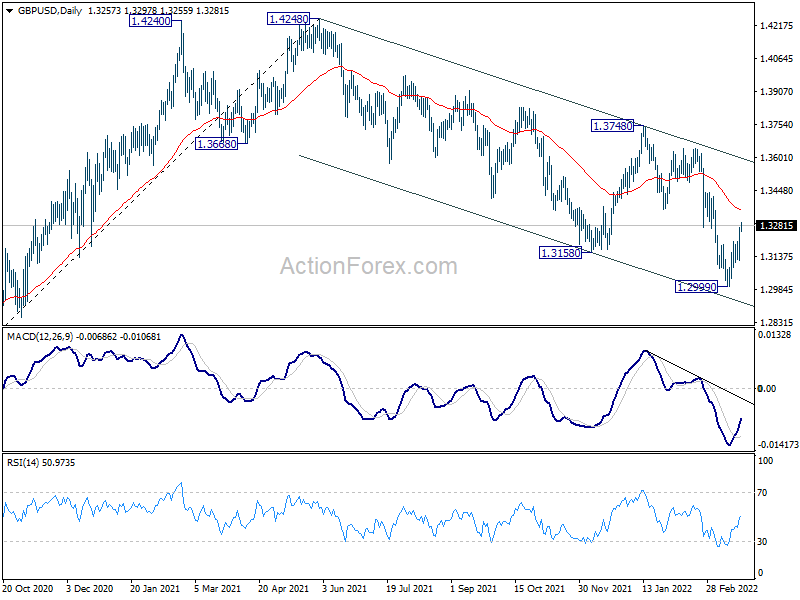
Intraday bias in GBP/USD remains on the upside at this point. Rebound from 1.2999 short term bottom is targeting 55 day EMA (now at 1.3355). Sustained break there will target medium term channel resistance (now at 1.3590). On the downside, break of 1.3119 minor support will turn intraday bias back to the downside for retesting 1.2999. Firm break there will resume larger down trend from 1.4248.
In the bigger picture, current development suggests that the up trend from 1.1409 (2020 low) has completed at 1.4248. Decline from 1.4248 could still be a corrective move, or it could be the start of a long term down trend. In either case, deeper decline would be seen back to 61.8% retracement of 2.1161 to 1.1409 at 1.2493. In any case, break of 1.3748 resistance is needed to indicate medium term bottoming, or outlook will stay bearish.
USD/CHF Daily Outlook
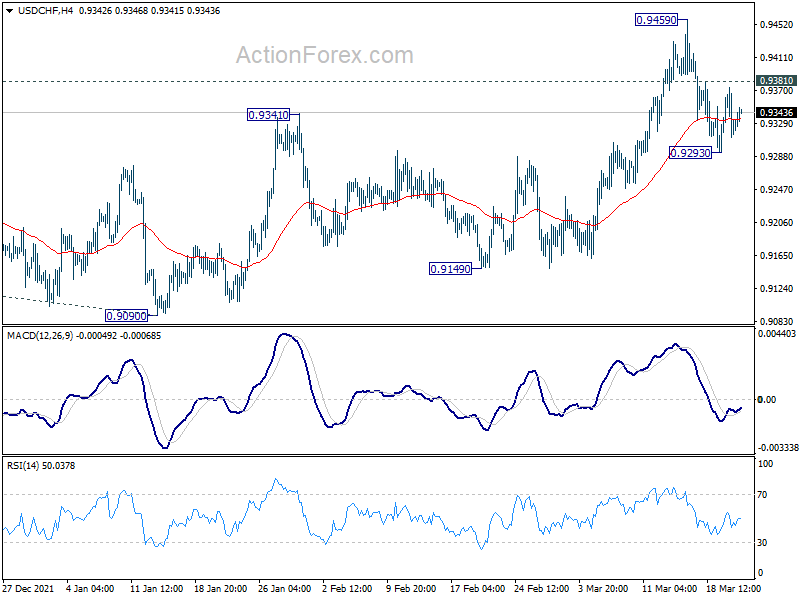
Daily Pivots: (S1) 0.9303; (P) 0.9339; (R1) 0.9365; More....
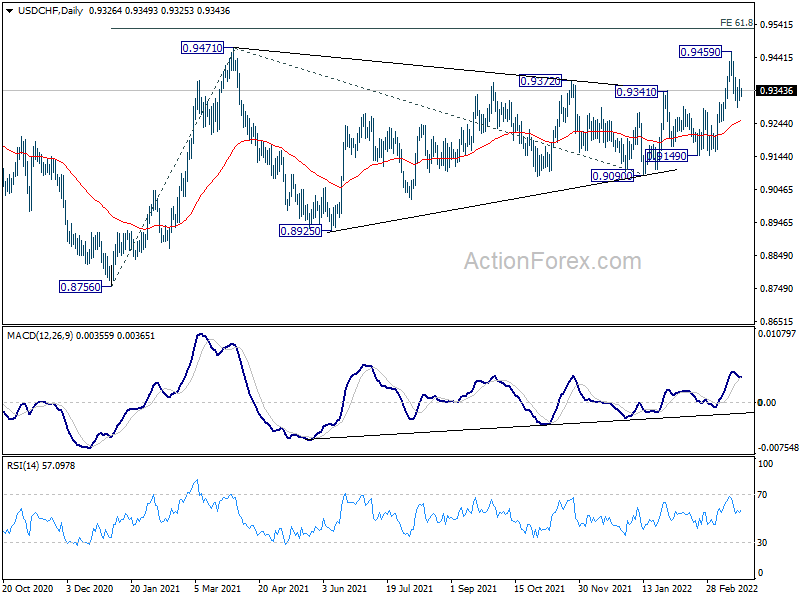
Intraday bias in USD/CHF stays neutral as range trading continues. On the downside, below 0.9293 will extend the pull back from 0.9459 to 55 day EMA (now at 0.9254). On the upside, above 0.9381 minor resistance will flip bias back to the upside. Firm break of 0.9471 will resume the rise from 0.8756 to 61.8% projection of 0.8756 to 0.9471 from 0.9090 at 0.9532.
In the bigger picture, medium term outlook will be neutral at best as long as 0.9471 resistance holds. Larger down trend could still extend through 0.8756 (2021 low). However, firm break of 0.9471 will argue that whole down trend form 1.0342 (2016 high), has completed with waves down to 0.8756. A medium term up trend should be set up to target 1.0237/0342 resistance zone.
USD/JPY Daily Outlook
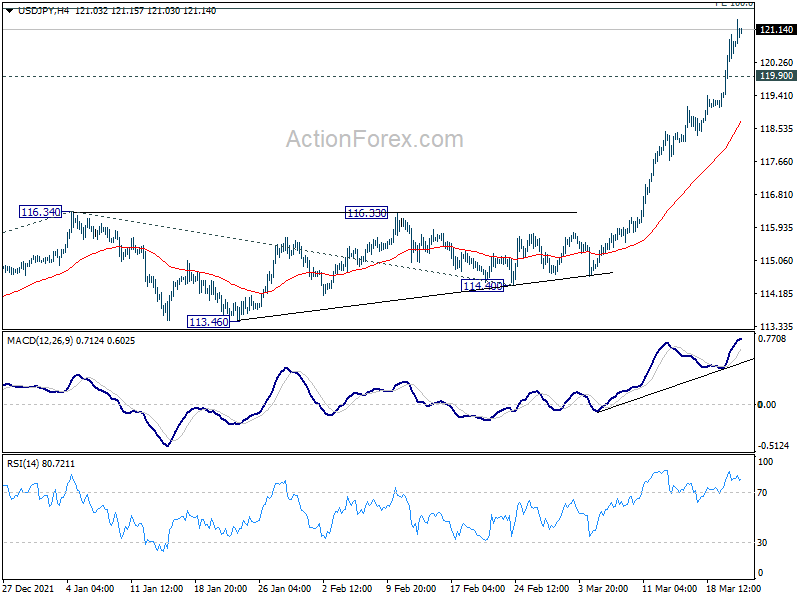
Daily Pivots: (S1) 119.82; (P) 120.43; (R1) 121.41; More...
Intraday bias in USD/JPY stays on the upside for 100% projection of 109.11 to 116.34 from 114.40 at 121.63. Sustained break there will pave the way to 126.09, which is close to 125.85 long term resistance. On the downside, below 119.90 minor support twill turn intraday bias neutral and bring consolidations first, before staging another rally.
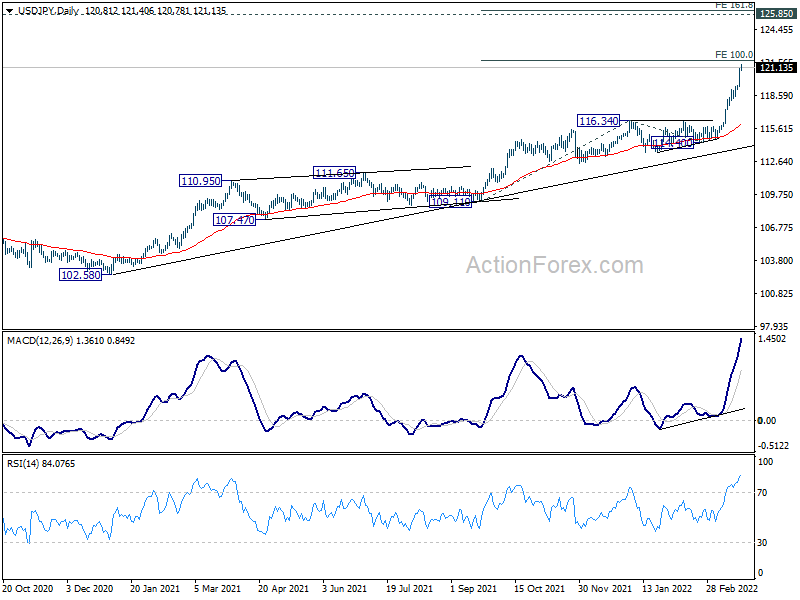
In the bigger picture, the break of 118.65 resistance (2016 high) suggest that up trend from 98.97 (2016 low) is resuming, with rise from 101.18 (2020 low) as the third leg. Medium term outlook will remain bullish as long as 113.46 low. Next target is 125.85 (2015 high).
AUD/USD Daily Report
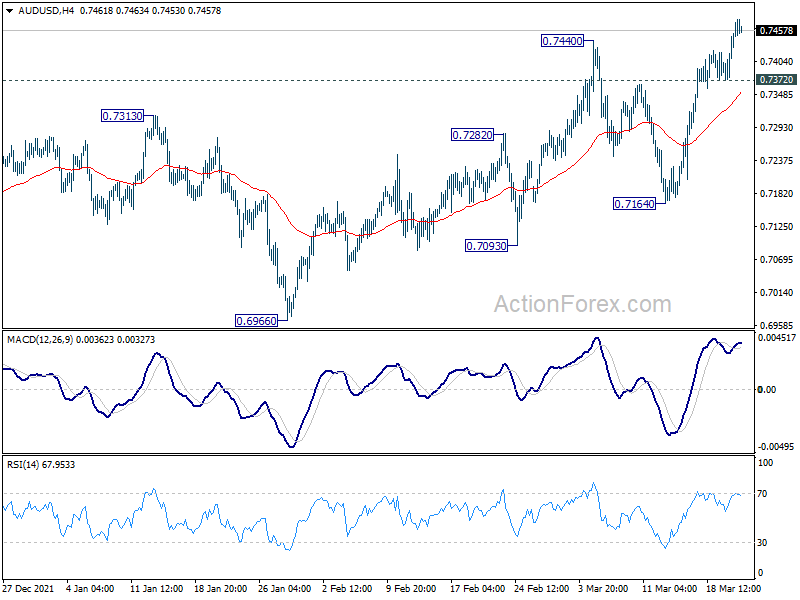
Daily Pivots: (S1) 0.7406; (P) 0.7439; (R1) 0.7502; More...
Intraday bias in AUD/USD remains on the upside for the moment. Current rise from 0.6966 should target 0.7555 resistance. Decisive break there should confirm that whole corrective decline from 0.8006 has completed at 0.6966. On the downside, below 0.7372 minor support will turn intraday bias neutral again. But overall, further rise is still expected as long as 0.7164 support holds.
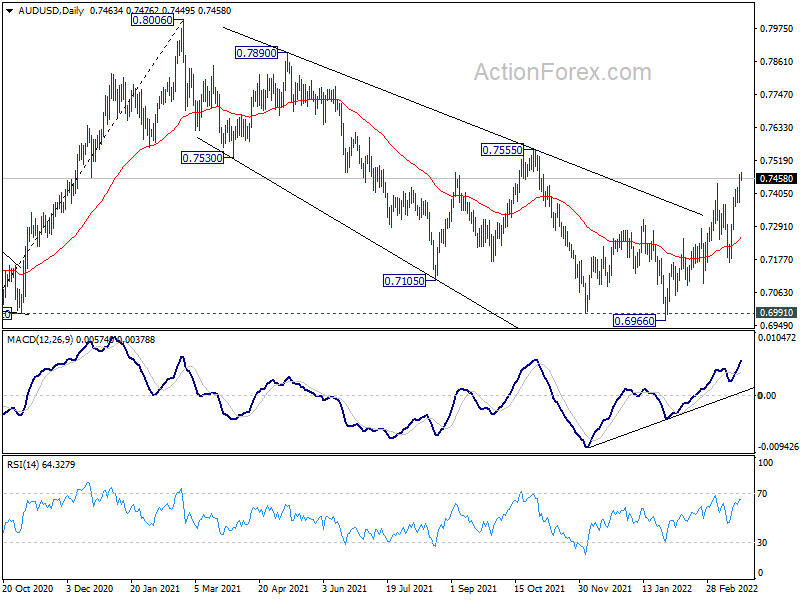
In the bigger picture, focus remains on 0.6991 key structural support. Sustained break there will argue that the whole up trend from 0.5506 might be finished at 0.8006, after rejection by 0.8135 long term resistance. Deeper decline would then be seen back to 61.8% retracement of 0.5506 to 0.8006 at 0.6461. Meanwhile, strong rebound from 0.6991 will retain medium term bullishness. That is, whole up trend from 0.5506 is still in progress for another rise through 0.8006 at a later stage.
USD/CAD Daily Outlook
Daily Pivots: (S1) 1.2549; (P) 1.2587; (R1) 1.2606; More...
USD/CAD continues to lose downside momentum as seen in 4 hour MACD. Bur there decline is still mildly in favor with 1.2692 minor resistance intact, for retesting 1.2448. Nevertheless, on the upside, break of 1.2692 will mix up the outlook again.
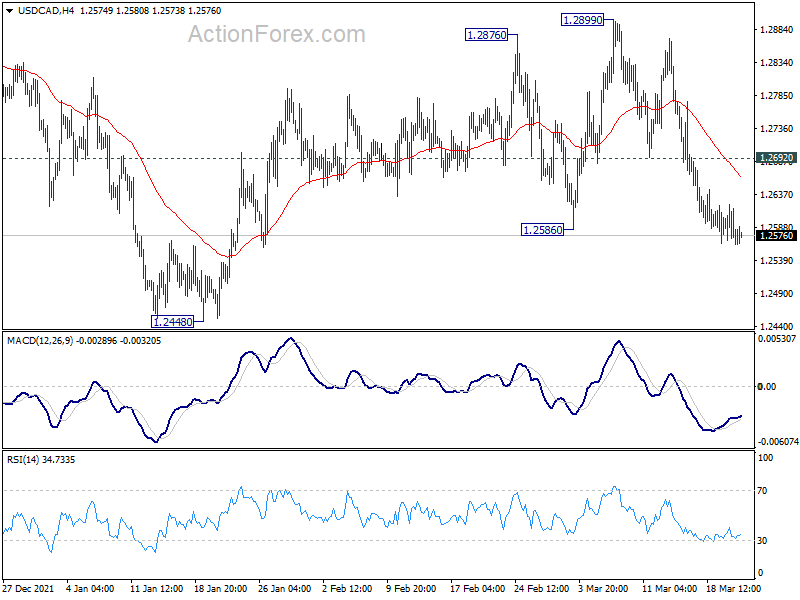
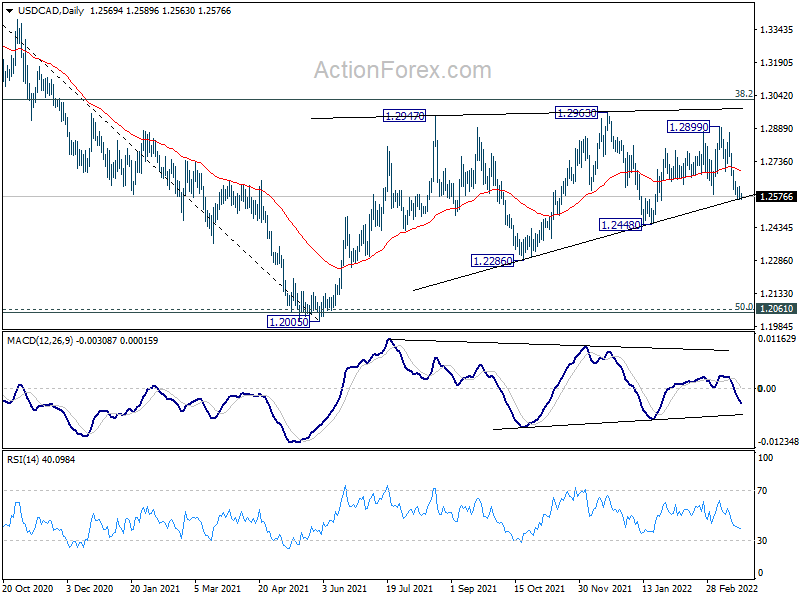
In the bigger picture, focus stays on 38.2% retracement of 1.4667 (2020 high) to 1.2005 (2021 low) at 1.3022. Sustained break there should confirm that the down trend from 1.4667 has completed after defending 1.2061 long term cluster support. Further rise would then be seen towards 61.8% retracement at 1.3650. However, rejection by 1.3022 will maintain medium term bearishness. Break of 1.2005 will resume the down trend from 1.4667 and that carries larger bearish implications too.