

Sample Category Title
Crude Oil Price Start Fresh Increase, Gold Consolidates
Key Highlights
- Crude oil price started a steady increase above the $105.00 resistance.
- A key bullish trend line is forming with support near $113.70 on the 4-hours chart.
- Gold price is consolidating above the $1,900 support zone.
- The US Manufacturing PMI could decline from 57.5 to 56.3 in March 2022 (Prelim).
Crude Oil Price Technical Analysis
After a sharp decline, crude oil price found support near $95.00 against the US Dollar. The price formed a base and started a fresh increase above the $100.00 resistance.
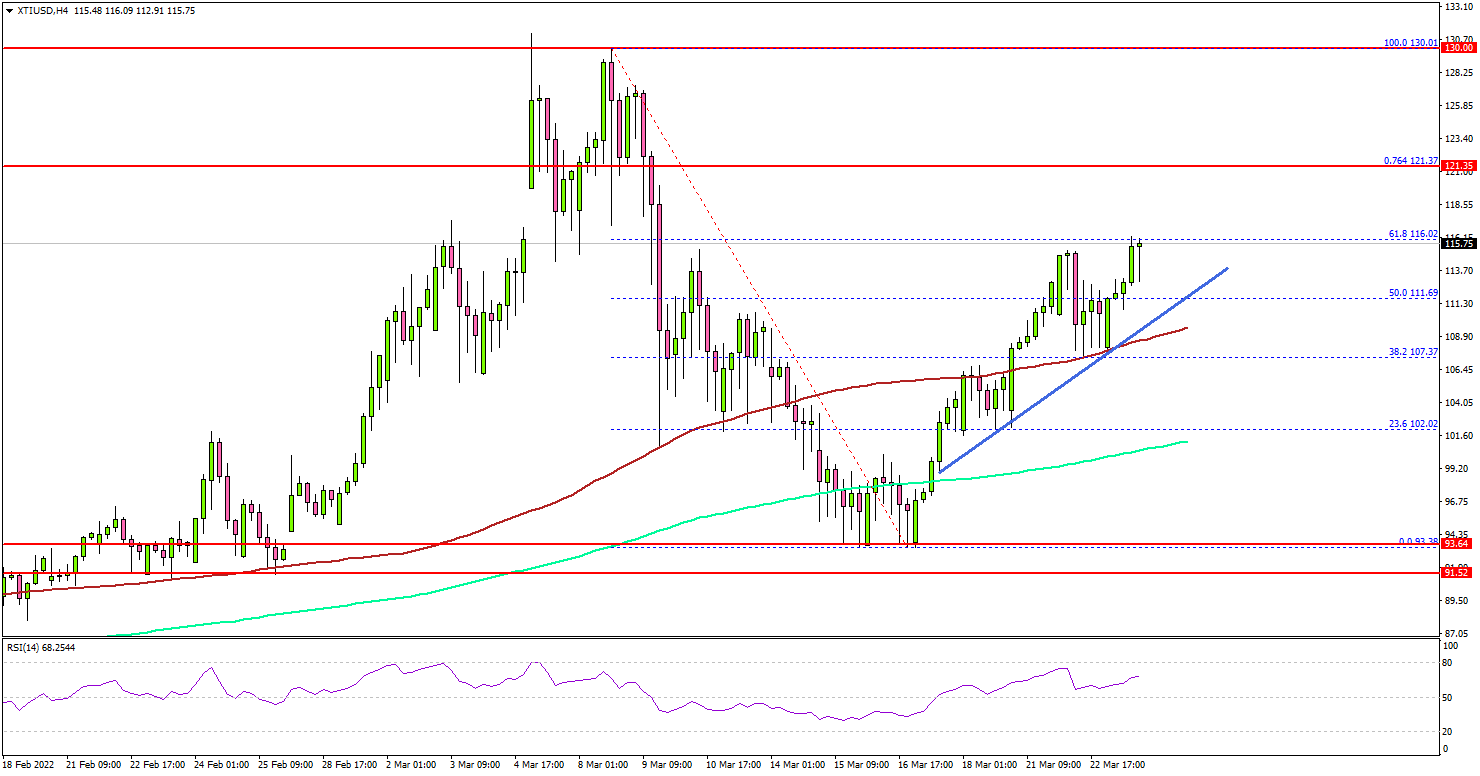
Looking at the monthly chart of XTI/USD, the price cleared the $105.00 resistance zone and the 200 simple moving average (green, 4-hours). The price climbed above the 50% Fib retracement level of the downward move from the $130 swing high to $94 swing low.
It even moved above the $110 level and the 100 simple moving average (red, 4-hours). Besides, there is a key bullish trend line forming with support near $113.70 on the same chart.
It is now facing resistance near the $118 zone. The next major resistance might be $121.50 or the 76.4% Fib retracement level of the downward move from the $130 swing high to $94 swing low.
Any more gains might send the price towards the $130 level. If not, the price might correct lower below the $110 level. The next major support is near $105, below which there is a risk of a move towards the $100 level.
Looking at the gold price, there were mostly range moves above the $1,900 and $1,905 levels. To start a fresh increase, the price must surpass the $1,950 resistance.
Economic Releases to Watch Today
- Germany’s Manufacturing PMI for March 2022 (Preliminary) - Forecast 55.8, versus 58.4 previous.
- Germany’s Services PMI for March 2022 (Preliminary) - Forecast 53.8, versus 55.8 previous.
- Euro Zone Manufacturing PMI for March 2022 (Preliminary) – Forecast 56.0, versus 58.2 previous.
- Euro Zone Services PMI for March 2022 (Preliminary) – Forecast 54.2, versus 55.5 previous.
- US Manufacturing PMI for March 2022 (Preliminary) – Forecast 56.3, versus 57.5 previous.
- US Services PMI for March 2022 (Preliminary) – Forecast 56.0, versus 56.5 previous.
- US Initial Jobless Claims - Forecast 212K, versus 214K previous.
GBPUSD Forecasting The Path & Selling The Rallies At The Blue Box
In this technical blog we’re going to take a quick look at the Elliott Wave charts of GBPUSD. As our members know, the pair shows bearish sequences in the cycle from the June 1st 2021 peak. Incomplete structure calls for a further decline. The pair has made 3 waves bounce recently, that has reached our selling zone. We recommended members to avoid buying and keep selling rallies in 3,7,11 swings. In the further text we are going to explain the Elliott Wave Forecast and the trading strategy.
GBPUSD H1 Elliott Wave Analysis 03.22.2022
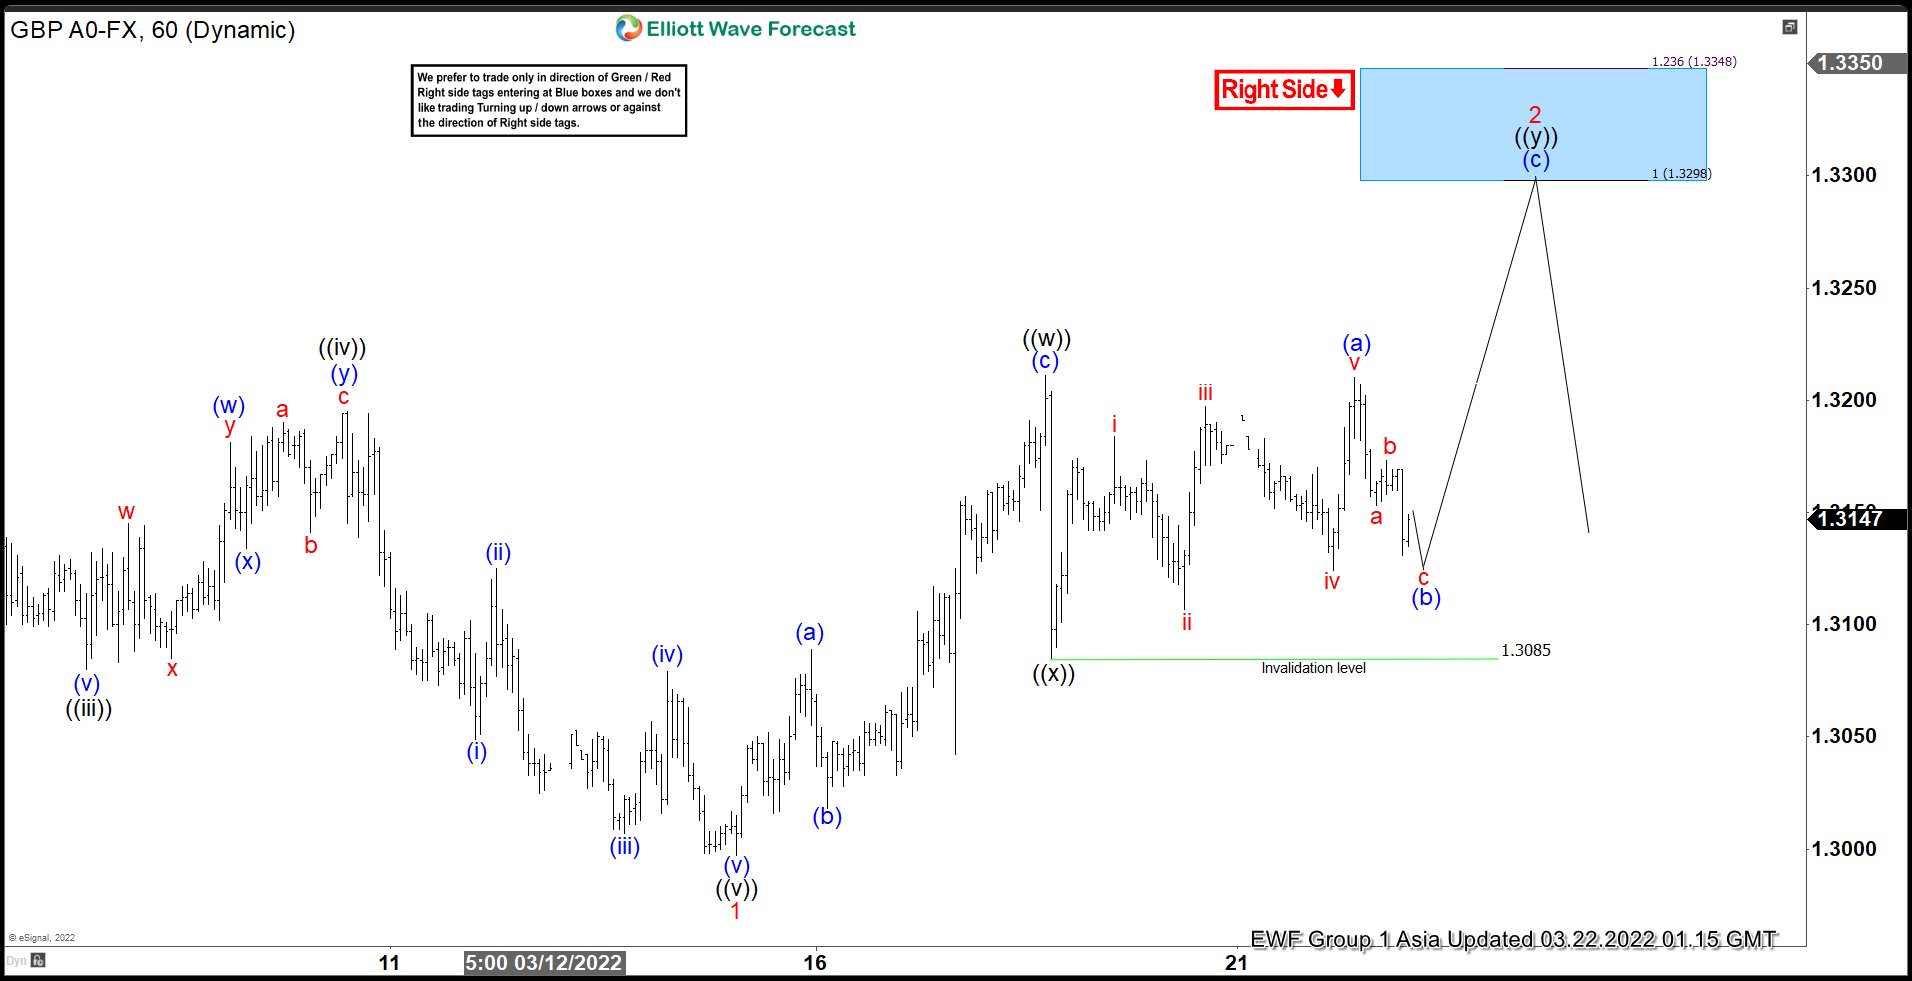
GBPUSD is correcting the cycle from the February 18th peak. Recovery shows incomplete sequences at the moment. Consequently we are calling for upside in near term toward 1.3298-1.3348 area to complete 2 red recovery. Although expecting more upside we recommended members to avoid buying the pair in proposed push up. Strategy is waiting for Blue Box to be reached before selling the pair. As the main trend is bearish we expect sellers to appear at the blue box for 3 waves pull back at least. Once pull back reaches 50 Fibs against the ((x)) black low, we will make short position risk free ( put SL at BE) and take partial profits. Invalidation for the trade would be break above 1.618 fibs extension: 1.3436
As our members know Blue Boxes are no enemy areas , giving us 85% chance to get a reaction.
GBPUSD H1 Elliott Wave Analysis 03.23.2022
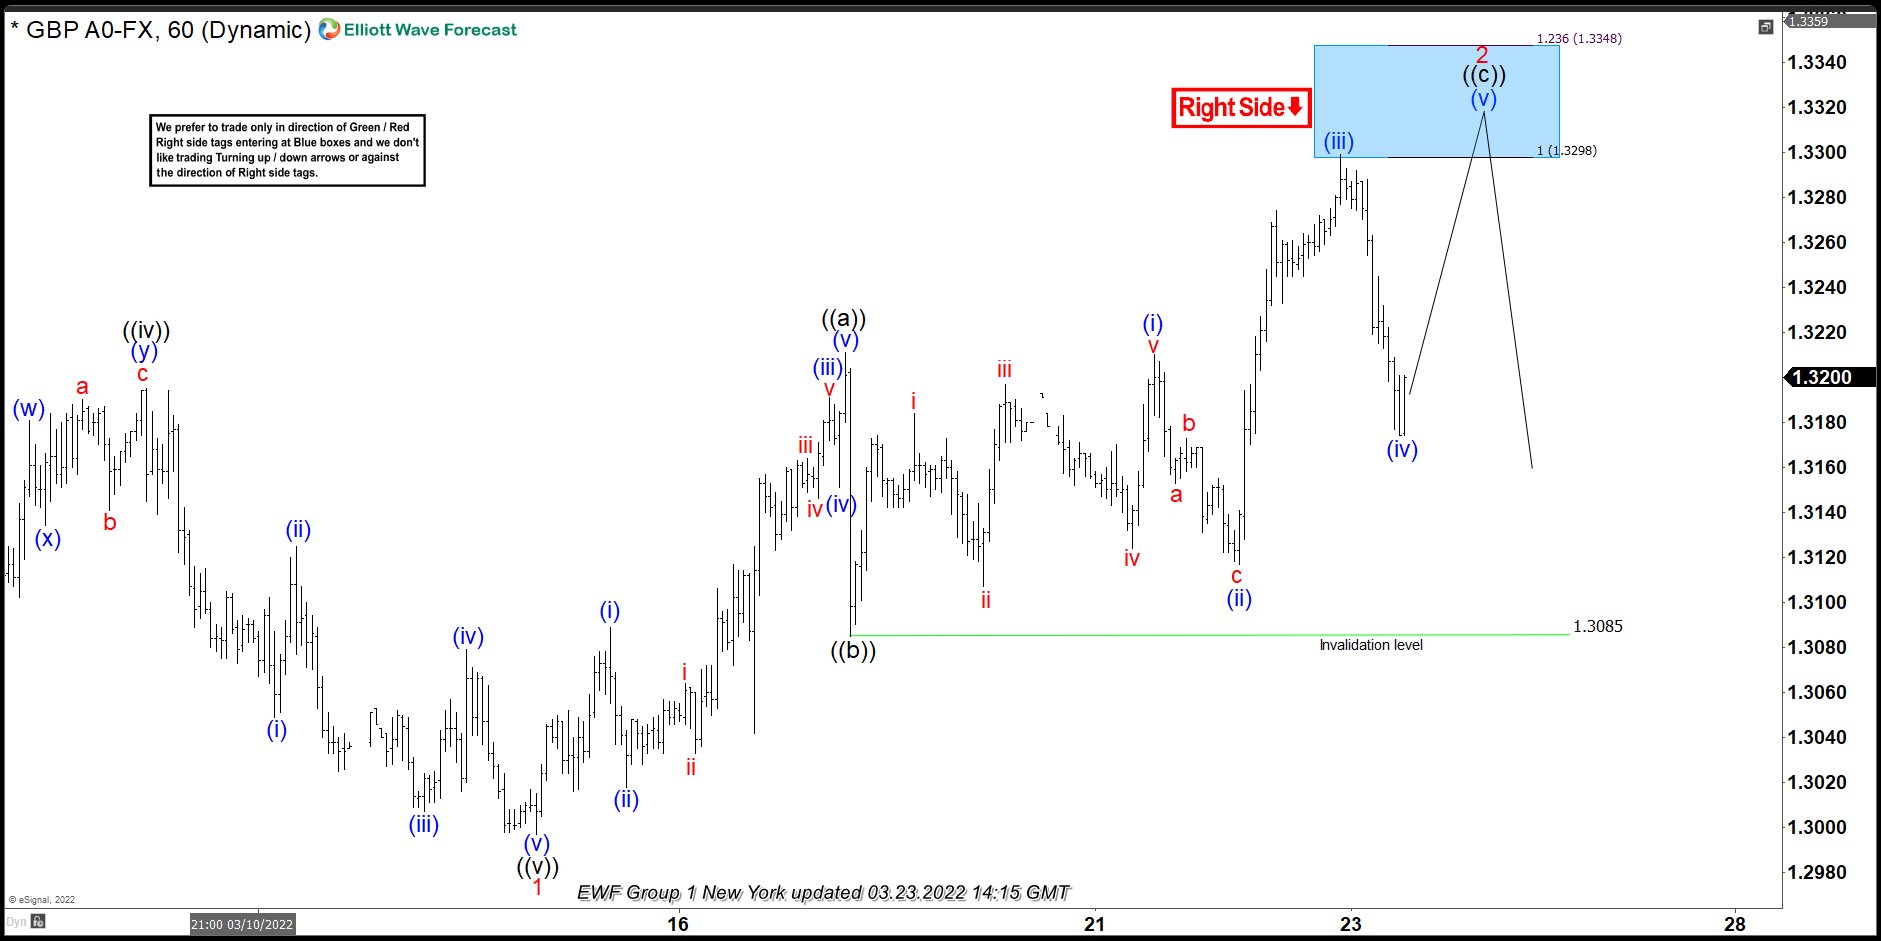
The pair reached equal legs area at 1.3298 and made turn lower from there. We got a decent reaction from the blue box. As a result , members who took short trades made positions risk free ( Put SL at BE) and took partial profits. At this stage we see potential for another leg up within the cycle from the low. One of the reason for calling another leg up in GBPUSD is EURUSD which shows higher high sequences from the 03/07 low. Alternatively if 1.3085 pivot gives up we can already have 2 red completed at the current high 1.3299. We should keep in mind that extremes from the lows are already reached and another leg up doesn’t need to happen.
Elliott Wave View: EURJPY Starts New Bullish Cycle
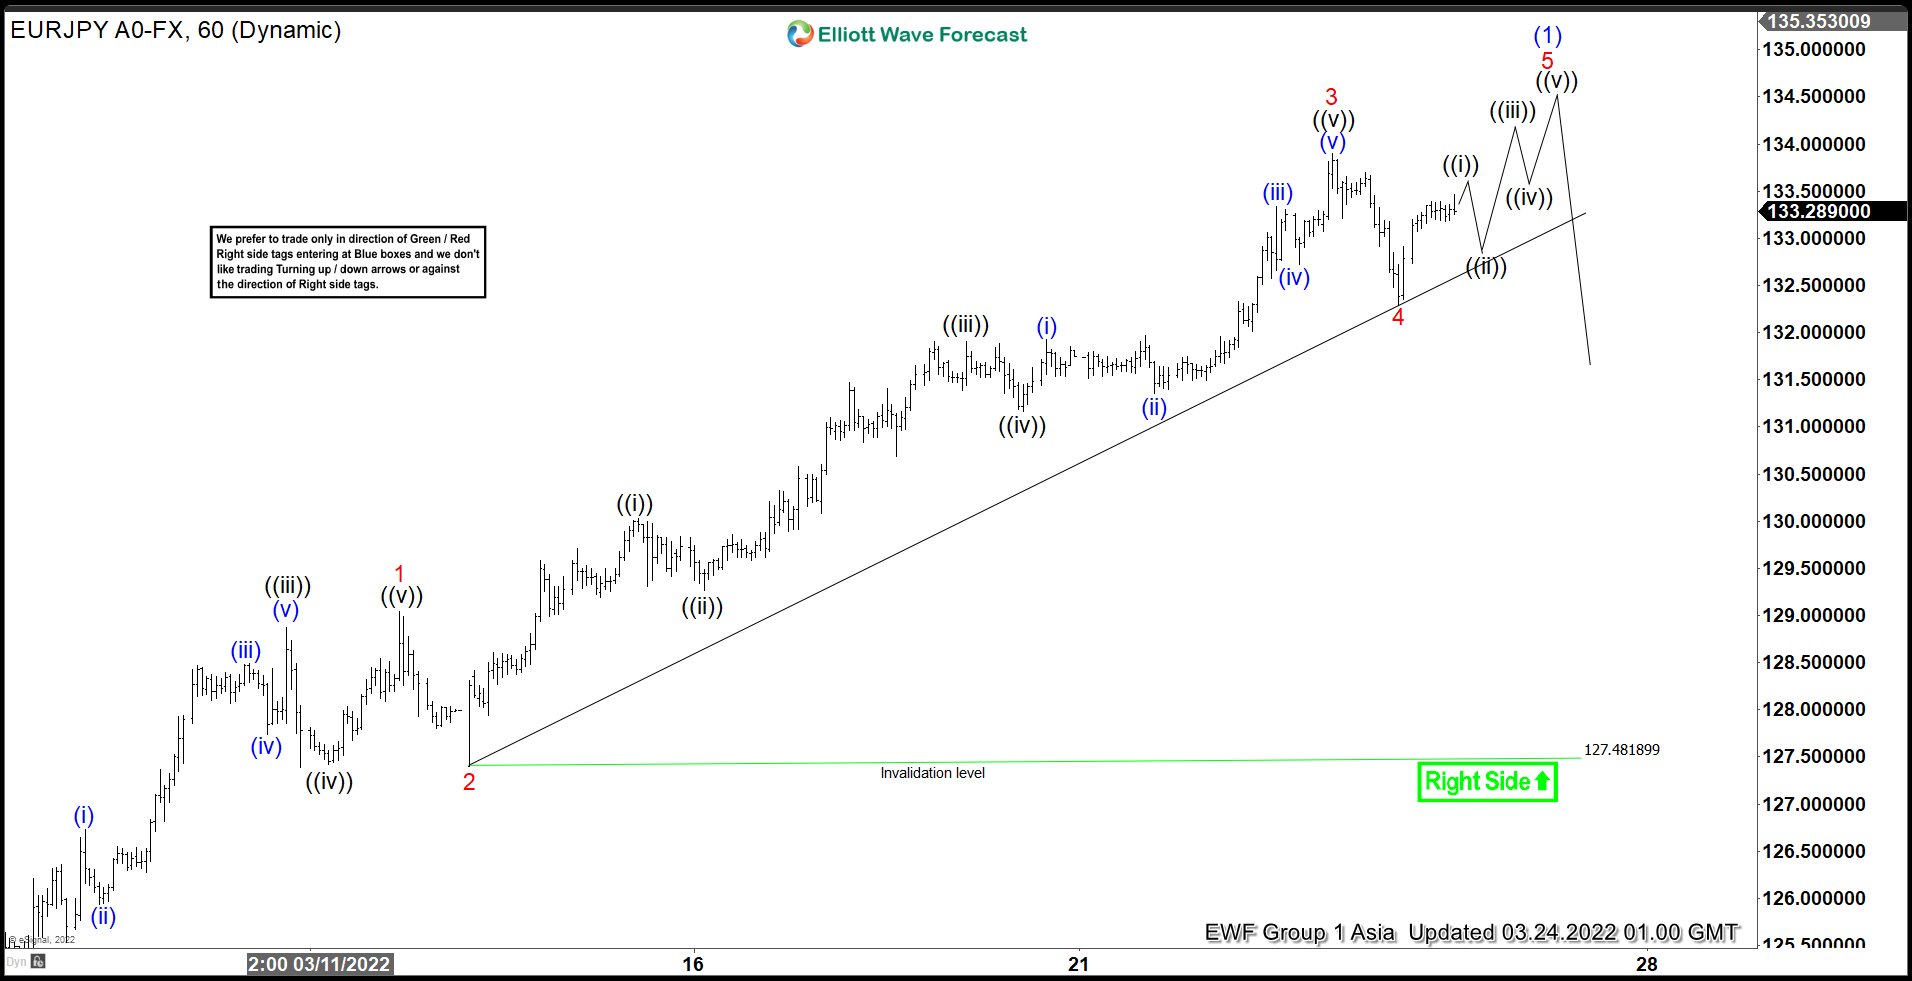
EURJPY is close to breaking above the previous high on June 1, 2021 at 134.12. A break above that level should create a bullish sequence from May 2020 low favoring further upside. Near term, cycle from March 7, 2022 low is in progress as a 5 waves impulse Elliott Wave structure. Up from March 7, wave 1 ended at 129.04 and pullback in wave 2 ended at 127.40. Pair extends higher in wave 3 with internal subdivision as another impulse in lesser degree. Up from wave 2, wave ((i)) ended at 130.03 and pullback in wave ((ii)) ended at 129.27. Pair then extends higher in wave ((iii)) towards 131.90 and dips in wave ((iv)) ended at 131.16. The last leg wave ((v)) ended at 133.89 which also ended wave 3. Pullback in wave 4 ended at 132.29.
Near term, expect pair to continue higher within wave 5 while pivot at 127.48 low stays intact. Potential target for wave 5 comes at 123.6 – 161.8 inverse Fibonacci retracement at 134.2 – 134.9 before pair ends wave (1). Note that it can extend higher than this area, but this is one possible way to measure potential target for wave 5. Once wave 5 completes, pair should do larger wave (2) pullback to correct cycle from March 7 low before the rally resumes. Pair should continue to stay supported in larger degree and dips should continue to find support in 3, 7, or 11 swing as far as March 7 low pivot (124.39) stays intact.
EURJPY 60 Minutes Elliott Wave Chart
GBPCHF Wave Analysis
- GBPCHF reversed from resistance level 1.2400
- Likely to fall to support level 1.2140
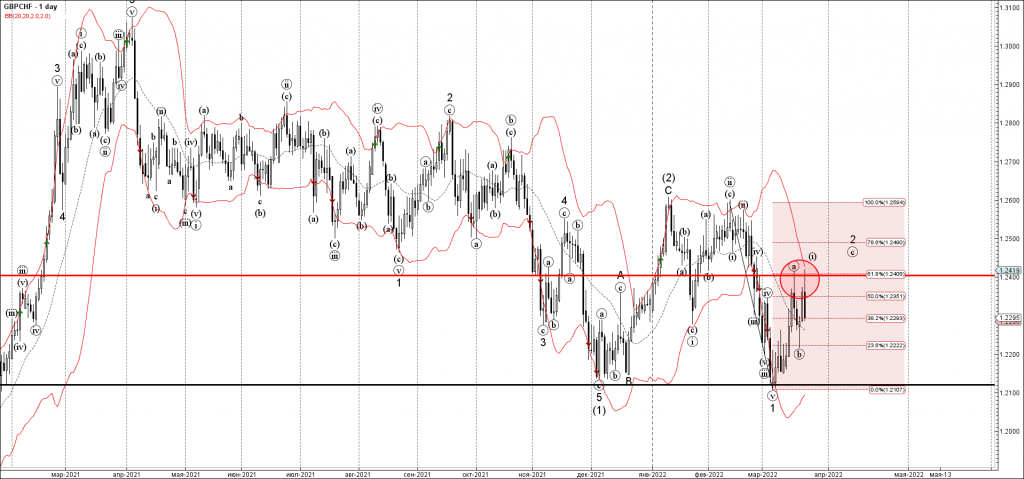
GBPCHF recently reversed down from the resistance level 1.2400 (top of the previous wave (a)), upper daily Bollinger Band and the 61.8% Fibonacci correction of the downward impulse from February.
The downward reversal from the resistance level 1.2400 stopped the previous short-term impulse wave (a) from last month.
GBPCHF can be expected to fall further toward the next support level 1.2140 (which has been reversing the price from December).
Eco Data 3/24/22
[php_everywhere instance="1"]
GBPAUD’s Bearish Bias Persists; Downside Risks Grow
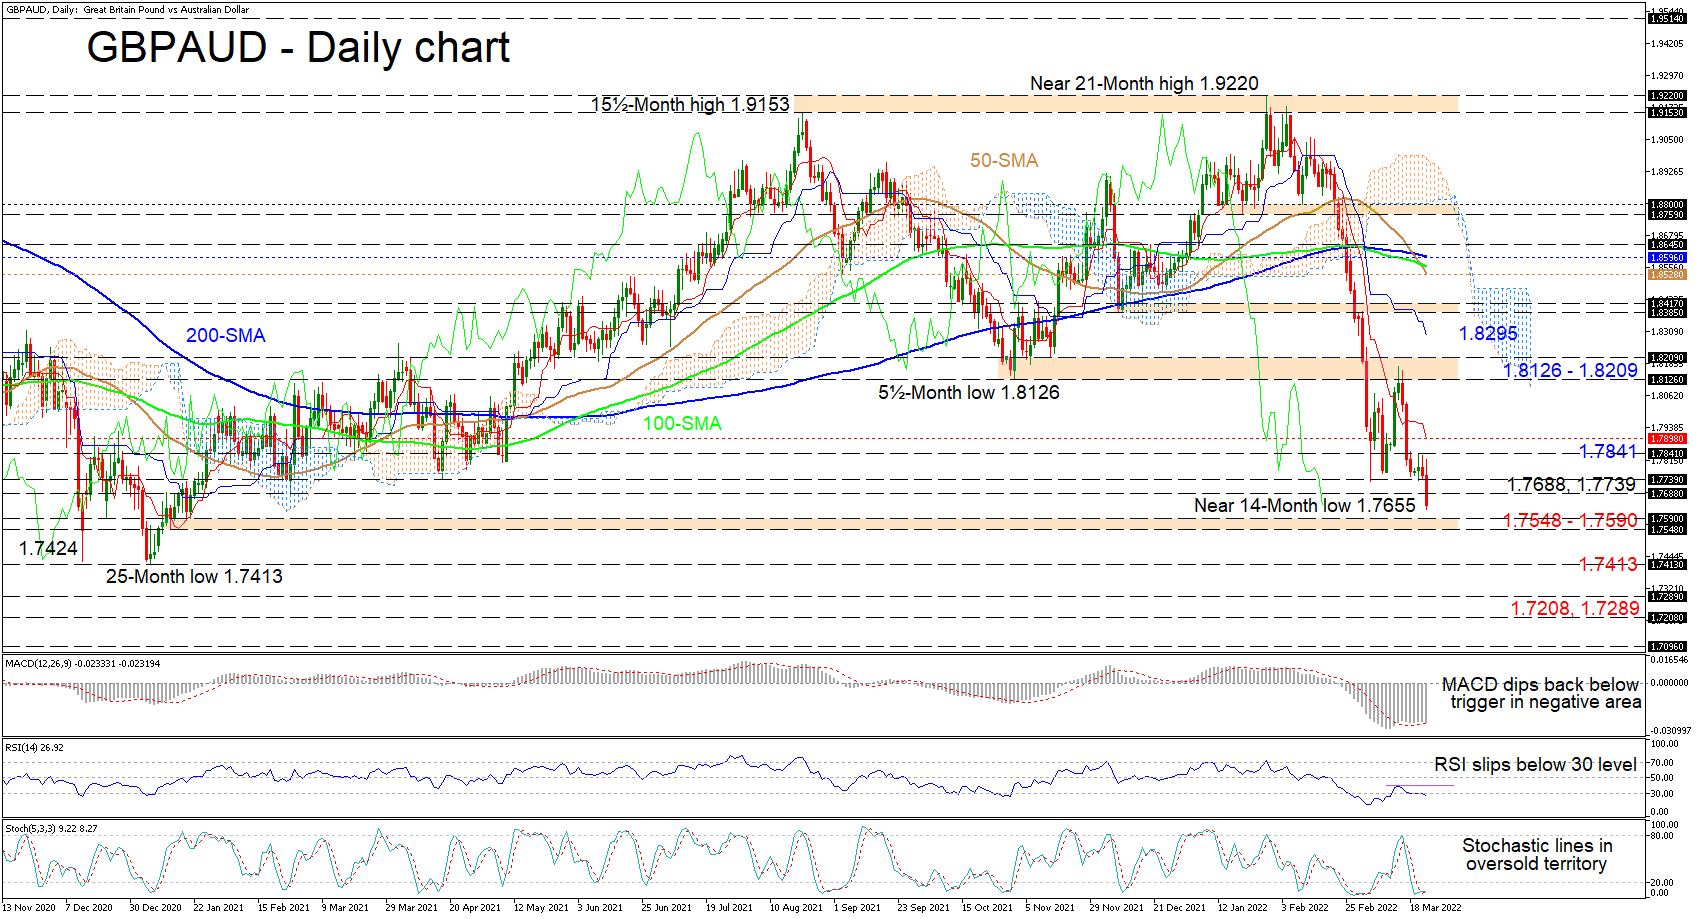
GBPAUD dived below the April and February 2021 lows of 1.7739 and 1.7688 respectively today, recording a near 14-month low of 1.7655 following an aggressive one-and-a-half-month decline, which began around the beginning of February. The dip in the 100- and 200-day simple moving averages (SMAs) indicates sellers’ recent dominance in the pair, and the diving 50-day SMA, which has completed bearish crossovers with both longer-term averages, is confirming that the bearish trend is sustaining its descending pace.
The falling Ichimoku lines suggest that negative forces are very much active, while the short-term oscillators reflect persistent downward momentum. The MACD, deep in the negative zone, has pierced back beneath its red trigger line, while the RSI is sinking further past the 30 oversold level. Moreover, the stochastic lines, which are in oversold territory, display a lack of opposing positive forces.
If the descent in the pair endures, downside constraints could originate from the nearby 1.7548-1.7590 support band. If sellers drive the pair lower, the critical 25-month trough of 1.7413 could draw traders’ attention, as it is where the pair eventually bottomed after it collapsed from the March 2020 high of 2.0591. Sinking past this crucial support may exacerbate the downward trajectory, solidifying a prolonged bearish outlook with the December 2018 lows of 1.7289 and 1.7208 looking like the next resorts for the pair to find some footing.
Alternatively, if buyers re-emerge and lift the price above the 1.7688 and 1.7739 obstacles, they may tackle nearby resistance arising from the 1.7841 high and the descending red Tenkan-sen line at 1.7898. In the event the pair builds additional upside momentum off this uptick in positive forces, the bulls could be encouraged to challenge the 1.8126-1.8209 key resistance barricade.
Currently, GBPAUD’s bearish bias looks unbreakable and if the price closes below the more than two-year low of 1.7413, a grim plot is likely to endure. Adding credence to this viewpoint is the fact that the price would need to make profound improvements overcoming the 1.8126-1.8209 border to revive some optimism in the pair.
Gas for Rubles: Direct and Indirect Consequences
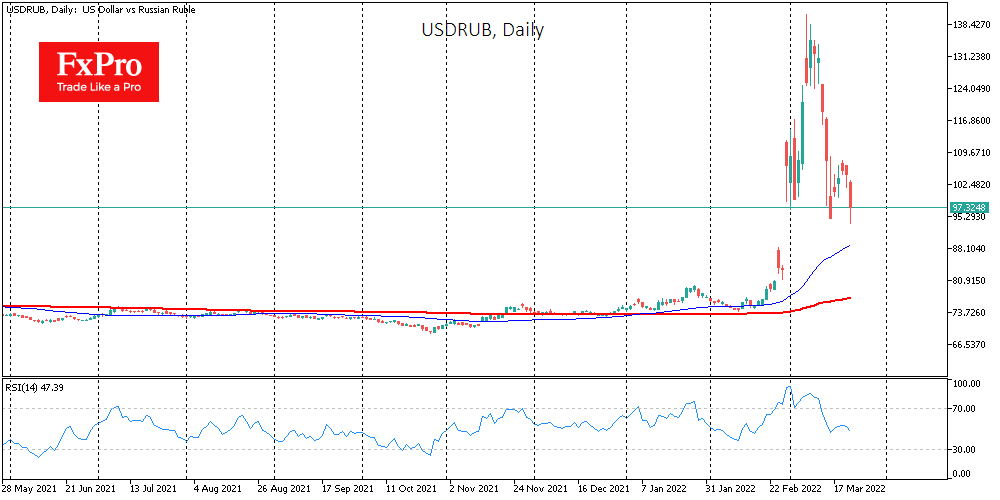
The Russian rubles adds more than 3% to the dollar, trading around 100 on news that “so-called unfriendly countries” will have to pay for gas in rubles. Impulsively (as the Russian currency market remains extremely illiquid), the USDRUB dropped below 95.
This is indeed positive news for the Russian currency as it increases demand.
But is it such a significant step? All exporters are now obliged to convert at least 80% of their foreign currency earnings into rubles. On the foreign exchange side, buying gas for rubles raises the bar to 100% for Gazprom and several other smaller exporters, but not for all jurisdictions (about 70% of total gas exports).
For the balance of supply and demand of the ruble, this is a much less strong move than the initial order to convert 80% of all foreign exchange earnings into rubles.
The news itself carries more of an emotional message for the markets. Still, the initial optimism could correct very quickly and is unlikely to be the mainstay for a sustained rally in the rubles. It also looks like an attempt to jab the USA, as selling energy for dollars has often been referred to as the basis of the reserve status of the USD in recent months.
A secondary effect was the inversion of the spread between the USDRUB exchange rate on the Moscow Exchange and in Forex. Previously, in early March, USDRUB was traded up to 10 rubles less in Russia than abroad (though the spread diminished over time). Now USDRUB is settling at 98 on FX versus 100.4 on MOEX.
Another secondary effect is a rise in oil prices of more than 5% since the start of the day, as some buyers will try to use the remaining alternative to gas, which can still be bought with dollars. Among the adverse effects, albeit in the medium term, it is worth pointing out that the switch to ruble settlements will accelerate a pullback of Russian gas by Europe, reducing export revenues, which has been a guarantee of ruble stability and a driver of economic growth.
Japanese Yen Steadies
March has been a sea of red for the Japanese yen, as USD/JPY has soared 5.04% this month. The currency is steady on Wednesday, after breaking above the 121 line earlier in the day.
Rate differential weighing on yen
The yen took a double-punch in the ribs on Tuesday, as USD/JPY jumped 1.14%. Central bankers drove the gains, as Fed Chair Powell sounded hawkish while BOJ Governor Kuroda was dovish. Powell said that inflation was putting the recovery at risk and the Fed was prepared to do whatever was needed, including implementing 1/2 point rate hikes at policy meetings. The Fed has been widely criticized for being too slow in its response to rising inflation, as Powell was preaching that inflation was transitory even as CPI rose month after month. The Fed seems determined to make amends, and Powell’s strident comments were meant to convey a message to the markets that the Fed means business in its determination to contain inflation.
Meanwhile, BoJ Governor Kuroda was preaching the exact opposite message to parliament. Kuroda stated that it was premature for the Bank to debate exiting its loose policy and that it would continue to purchase ETFs as needed. Kuroda said that the Bank needed to “patiently maintain our powerful monetary easing” in the face of rising inflation.
The comments from Powell and Kuroda widened the US/Japan rate differential and sent the yen tumbling lower. US Treasury yields have been rising and the 10-year yield is currently at 2.36%.
With the yen being extremely sensitive to the rate differential, a further upswing in US yields will spell more trouble for the yen, which could climb to 123.00 or even 125.00.
Earlier in the day, Japan released BoJ Core CPI, the central bank’s preferred inflation gauge. The January reading of 1.0% YoY was the highest gain since March 2016. Inflationary pressures are nowhere near as strong as we’re seeing in the UK or the US, but after decades of deflation, the BoJ may have to adjust its monetary policy to a new era of inflation moving upwards.
USD/JPY Technical
- USD/JPY has broken through resistance at 120.72. Above, there is resistance at 122.04
- There is support at 118.62 and 117.84
US oil inventories dropped -2.5m barrels, WTI extending rebound
US commercial crude oil inventories dropped -2.5m barrels in the week ending March 18, larger than expectation of -0.7m decline. At 413.4m barrels, oil inventories are about -13% below the five year average for this time of year.
gasoline inventories dropped -2.9m barrels. Distillate dropped -2.1m barrels. Propane/propylene rose 0.3m barrels. Total commercial petroleum inventories dropped -6.7m barrels.
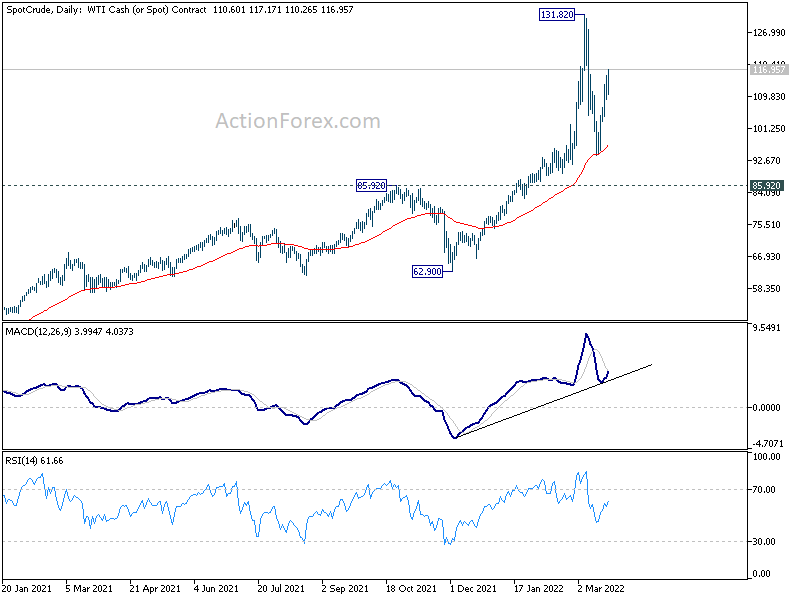
WTI crude oil's rebound from 93.98 resumes today and it's now pressing 61.8% retracement of 131.82 to 93.98 at 117.36. Sustained break there could pave the way back to 131.82 high. And in any case, further rally will now remain in favor as long as 109.30 minor support holds.
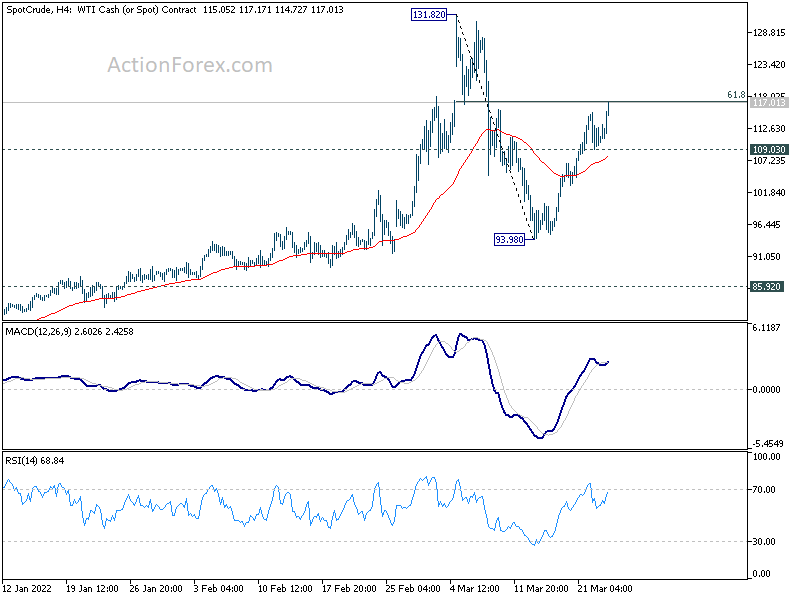
While the correction from 131.82 was deep, WTI held well above 85.92 resistance turned support. It also drew notable support from 55 day EMA, keeping medium term outlook bullish. Thus, while the corrective pattern from 131.82 might still extend with another falling leg, an eventual upside breakout is still favored.
Sunset Market Commentary
Markets
A lot of eyes were on UK Finance Minister Sunak and his spring statement on the budget and the economy. The UK cost of living crisis worsened with inflation having accelerated to a faster-than-expected 6.2% y/y (5.2% core) in February, data showed ahead of Sunak’s update. He wants to alleviate some of the income squeeze by announcing the biggest ever fuel-duty cut until March next year in a tax cut worth £5bn. Sunak also removes the 5% VAT on the installation of some energy saving investments, doubles household support and, as widely expected, raises the threshold at which people pay National Insurance by £3000 instead of the previously planned 300 pounds. The latter is in effect a (£6bn personal) tax cut for low earners and is due to kick in next month. Sunak also announces a cut in the basic income tax to 19% by election year 2024 and promised to cut taxes for business investment in the fall. The measures widen the deficit forecast for FY 22/23. For the coming five years however, the Office for Budget Responsibility has cut the deficit forecast by £29bn. Combined with the OBR expecting “only” £125bn of bond sales in 2022/2023 compared to market estimates of £152bn and slashed growth estimates (3.8% vs 6% in 2022), UK yields in a kneejerk move declined 9.8 bps (10y) to 13.3 bps (2y). Losses are being limited to around 5 bps in the meantime. Market’s monetary policy expectations were unaltered after Sunak’s update, sticking to five more hikes by the end of the year. EUR/GBP hit the 0.83 big figure in early trading but prevented a break lower. The pair is filling bids around 0.832. Cable turns below 1.32 again.
Outside the UK, core bond markets licked their wounds after their relentless decline in recent weeks. US Treasuries outperform with changes ranging from -1.9 bps (30y) to -4.4 bps (5y), driven by real yields. Inflation expectations remain on the rise, supported by commodity prices soaring (again). Brent oil trades above $120/b, up more than 20% in just 5 days. Dutch gas futures bounce off €100/MWh support to €117. German/European yields ease 1-3 bps in a flattening move. EU budget commissioner Hahn poured cold water over expectations for more EU common debt issuance to help finance the green transition and organize a European defense. EUR/USD was already struggling amid slight risk-off (European stocks lose more than 1%) and eventually fell below 1.10 after Hahn’s comments. USD/JPY’s ascent stalls in the high 120 area while EUR/JPY shifted in reverse (from 133.23 to 132.7). News Headlines
Czech National Bank deputy governor Mora believes that circumstances will force the CNB to go well above 5% with rates. Those circumstances obviously are Russia’s invasion which lifts energy prices and thus inflation. Though the risk of stagflation is real, Mora believes that the Czech economy can stomach higher rates. The economic slowdown may not be that bad, mainly because the Czech labour market is very tight. People still have huge savings from during the pandemic and will keep on spending. Deputy governor Mora is more reluctant to use FX reserves and a stronger currency in helping to achieve inflation stability. CNB governor Rusnok floated that idea over the weekend. Governor Hulob yesterday said that he preferred rate hikes over FX sales. The CNB meets next on March 31. The policy rate currently stands at 4.5% with Czech money markets pricing a policy rate peak around 5.75%. EUR/CZK today touched 24.50 before rebounding back to 24.60.
Russian president Putin told his government that he took the decision to switching to ruble payments for natural gas supplies of the so-called hostile states (US, UK and EU member states) and stop using the compromised currencies in such transactions. He ordered the central bank to develop a mechanism to make ruble payments within a week. Simultaneously, he stressed that Russia will definitely continue to supply natural gas in line with the volumes and prices, pricing mechanisms set forth in existing contracts. The Russian ruble rises on Putin’s creative accounting measure to try to circumvent some of the international sanctions. USD/RUB drops back below the 100 level.