Sample Category Title
EUR/USD Could Resume Decline Below 1.0850
Key Highlights
EUR/USD failed to extend recovery above the 1.1120 resistance zone.
- A major bearish trend line is forming with resistance near 1.1100 on the 4-hours chart.
- GBP/USD remains at a risk of a sharp decline below 1.3000.
- Gold and oil prices consolidated gains above $1,975 and $100 respectively.
EUR/USD Technical Analysis
The Euro found support near 1.0800 against the US Dollar. EUR/USD started a recovery wave above the 1.1000 resistance, but it faced a lot of hurdles.
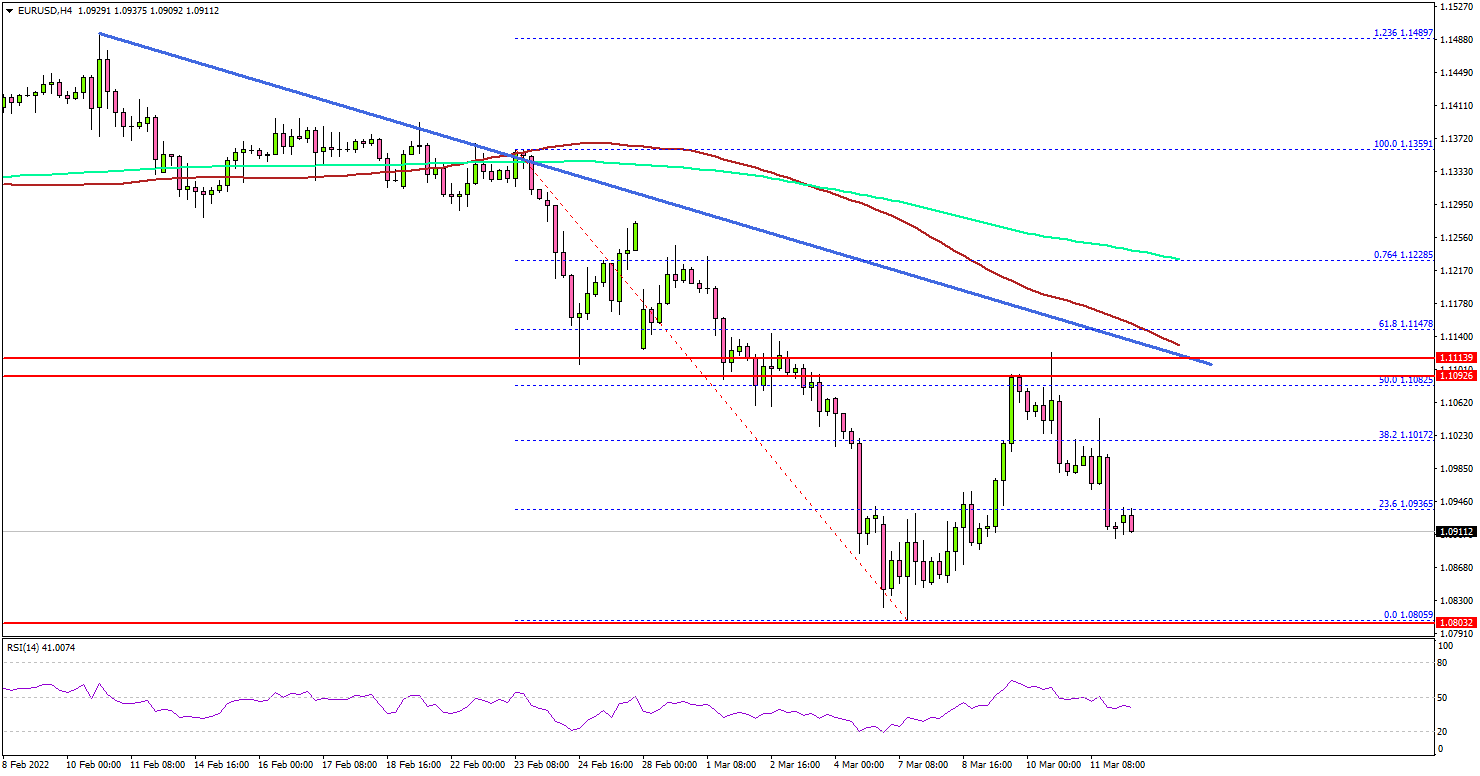
Looking at the 4-hours chart, the pair was able to recover above the 38.2% Fib retracement level of the key decline from the 1.1359 swing high to 1.0805 low. However, the pair faced a strong resistance near the 1.1120 level.
EUR/USD stayed below the 100 simple moving average (red, 4-hours), and the 200 simple moving average (green, 4-hours). It failed to clear the 50% Fib retracement level of the key decline from the 1.1359 swing high to 1.0805 low.
There is also a major bearish trend line forming with resistance near 1.1110 on the same chart. It is now moving lower and trading below 1.1000.
The first major support is near the 1.0850 level. The main support is near the 1.0800 zone. A successful break below the 1.0800 support could start another major decline. On the upside, the pair could face resistance near the 1.1000 level.
The main hurdle sits near the 1.1120 level and the 100 simple moving average (red, 4-hours), above which EUR/USD may perhaps start a steady increase.
Looking at GBP/USD, the pair remained in a bearish zone and there is a risk of a sharp decline if there is a close below the 1.3000 support zone.
Economic Releases
- UK Rightmove House Price Index for March 2022 (YoY) – Forecast +9.5%, versus +9.5% previous.
Week Ahead Preview: 14 March 2022
Stock index futures rose during the Asian session, while gold and crude oil slipped, as once again, there was hope that the Ukraine conflict could end after officials from both sides gave their most upbeat assessments yet on Sunday about the progress in peace talks. Apparently, there could be positive results within days. You can understand why the markets have reacted positively to the headlines given the fact that developments in the Ukraine have been the primary driver of risk appetite. But so far, every bit of optimism has led to pessimism and disappointment, with Russian forces continuing their military operations regardless. Will this prove to be another such scenario?
If last week was anything to go by, I wouldn’t hold my breath.
Indeed, last week was yet another eventful week, with headlines from Russia and Ukraine causing wild moves in asset prices, keeping traders on their toes. On Friday alone, we saw risk assets being tossed in all sorts of directions, before the bears came out on top. Initially, Putin was quoted as saying that there are “certain positive shifts in talks with Ukraine,” which caused stocks and the euro to rise. However, this was later countered by Ukraine’s Kuleba, who said that “zero progress was made in talks with Russia,” and that talks don’t seem to impact Moscow’s behaviour on the ground.
Let’s hope we don’t get that sort of conflicting headlines as we look ahead to the new week.
The main macro event will be the Fed’s much anticipated rate decision on Wednesday, with Jay Powell and his colleagues at the FOMC expected to hike rates by 25 basis points. But there is no doubt in mind that the focus for the majority of market participants will be on the going conflict between Russia and Ukraine, and the implications this has on many markets, not least commodities.
War in Ukraine
Russia’s ongoing invasion of Ukraine is once again going to dominate the news and markets. It is all a question of whether a peace agreement will be reached or whether there will be further possible sanctions on Moscow. So, apart from this week’s Fed meeting on Wednesday, and possibly the BoE’s rate decision on Thursday, nothing else is going to matter. The focus will be fixated on the Ukrainian situation and unless something changes dramatically, I am expecting investors to remain cautiously optimistic, which should limit risk taking. So, any rebound we might see in the stock markets should be taken with a pinch of salt, while there is no resolution in the conflict.
FOMC rate decision (Wednesday)
Among the non-geopolitical events, the FOMC’s rate decision on Wednesday and Powell’s press conference will be the highlights. Will the Fed surprise the market with a 50 basis point hike? I doubt it. Although inflation has continued to soar, a 25 basis point hike is a good way, the Fed would feel, to get the hiking cycle started without scaring the markets.
This will be the first hike since December 2018, when a 25 basis point increase lifted interest rates to a target range of 2.25% -2.50%. But then Covid struck at the end of 2021, and by March 2020, rates were slashed to 0% to 0.25%, where they have stayed since.
But thanks in part to the Fed’s vast QE programme and zero interest rates, the big surge in energy and commodity prices, and lifting of lockdowns, inflation has surged significantly – certainly significantly more than the Fed had expected. The headline CPI measure of inflation has risen to 7.9%, which is the highest level in 40 years. Clearly, it is time for the tightening to begin.
Worrying for the Fed, the University of Michigan’s 1-year inflation expectations shot up to 5.4%, up sharply from 4.9% and the highest print since Dec 1981.
Against a backdrop of rapidly rising inflationary pressures around the world, you would expect the Fed to be more aggressive in hiking. Earlier this month, Powell said he would prefer a 25 basis point hike but would not be opposed to a 0.50% hike in the future meetings, should inflation accelerate.
It will be interesting to find out how the Fed’s dot plots will look like. In December, they saw the Fed funds rate moving to 0.75 to 1.00 percent, meaning they expected 3 rate hikes in 2022. But now, expect to see a sharp revision, with 6-7 hikes not out of the question.
Bank of England (Thursday)
The BoE meets on Thursday and another 0.25 basis point hike is expected, which would lift rates from 0.5% to 0.75%, to the highest level since before the pandemic. If expectations are met, this would be the third hike in a row, after the BoE kicked off the rate hiking cycle with a 50 basis point hike. The only surprise would be if the BoE hikes more than expected, which is an outside possibility given that UK inflation is at the highest level for 30 years.
Eco Data 3/14/22
[php_everywhere instance="1"]
Forex and Cryptocurrency Forecast
EUR/USD: Mega Event of the Week: US Federal Reserve Meeting
As expected, the main event of the past week was Thursday, March 10th, thanks to the meeting of the European Central Bank. The interest rate was left at the same level of 0%, and this was no surprise to anyone. But despite the absolute predictability of this decision, the EUR/USD pair first soared to 1.1120 after the statement of the regulator, and then fell below 1.1000. It's all about the failed attempt to "feed" both hawks and doves.
On the one hand, the ECB surprised everyone with its hawkish decision to roll back QE more quickly. Asset buyback volumes under QE will be reduced from €40bn in April to €30bn in May and to €20bn in June, which is significantly ahead of the previous forecast. It had been Previously assumed that the reduction to €20 billion could occur only by October.
However, the position of the ECB on the issue of raising the interest rate has become even more dovish than it was. The regulator stated Earlier that a very small time gap is planned between the QE curtailment and the subsequent rate hike. Now, according to the head of the Central Bank, Christine Lagarde, "any adjustment of the ECB key rate will occur only some time after the end of bond purchases and will be gradual." Such a dovish statement disappointed investors and pushed the EUR/USD pair down.
An additional impetus to the sell-off of the euro came from the inflation report in the US, where consumer price growth reached a 40-year high. Thus, in monthly terms, the consumer price index increased from 0.6% to 0.8%, and in annual terms, inflation accelerated from 7.5% to 7.9%. These data further confirmed the markets in confidence that the increase in the US federal funds rate will take place already at the next Fed meeting, which is to be held next Wednesday, on March 16. Moreover, Jerome Powell, the head of the US Central Bank, said that he plans to propose a 0.25% rate increase at this meeting.
Naturally, inflation is growing not only in the US, but also in Europe. The ECB raised its growth estimates in 2022 from 3.2% to 5.1%. And according to experts at Goldman Sachs, this figure could rise to 8%. But the divergence in monetary policy and economic prospects is clearly not on the EU's side. The geographical factor should also be taken into account: proximity to the zone of armed conflict in Ukraine, as well as Europe's dependence on Russian energy carriers.
At present, Europe bears the main losses from the sanctions imposed against Russia. Analysts believe that it is facing a steady stagflation. The US is not immune from slowing economic growth either. But it is one of the world's leading oil suppliers and have significant shale gas reserves, so it will be much less affected by skyrocketing energy prices. In addition, savings accumulated by American households during the COVID-19 pandemic are now at an all-time high. This financial cushion dampens inflationary pressures, allowing the Fed to pursue a tighter monetary policy.
The EUR/USD pair slightly won back the losses of February over the past week and completed the five-day period at the level of 1.0911. However, in the event of an escalation of hostilities in Ukraine and an increase in mineral fuel prices, the nearest strategic target for the bears will no doubt be a retest of the March 07 low of 1.0805. This will be followed by the 2020 low of 1.0635 and the 2016 low of 1.0325. In the previous review, we already expressed the idea that the quotes may be at the level of 1.0000 at some point. This forecast was supported by ABN Amro bank strategists, who consider the fall of the pair to parity as the baseline scenario.
On the other hand, even a slight hint of a diplomatic settlement of the situation in Ukraine, not to mention the complete cessation of hostilities, can provide serious support to the common European currency and lead to its growth. Given the increased volatility, the nearest target for the bulls is a breakdown of the resistance zone around 1.1000. Then there are zones 1.1100-1.1125, 1.1280-1.1390 and the highs of January 13 and February 10 in the area of 1.1485.
Analysts' opinions are distributed as follows. 50% of them vote for the fact that EUR/USD will be able to return to at least 1.1200 within March. 25% side with the bears, and the remaining 25% have taken a neutral position. Oscillators on D1 are 90% red, 10% are neutral gray. Trend indicators are 100% on the side of the bears.
As for the calendar for the upcoming week, as already mentioned, the US Fed meeting on Wednesday, March 16 will be a mega event. And statistics on retail sales in the United States will be released a few hours before the release of the final commentary and the press conference of the regulator's leadership. Attention should be paid to the speech of the head of the ECB, Christine Lagarde the next day, on Thursday, March 17, as well as to data from the consumer market of the Eurozone and from the US labor market.
GBP/USD: What to Expect from the Bank of England?
The EU's dependence on Russian gas was about 45-50% before the imposition of sanctions. Unlike the countries of the European Union, the UK is practically independent of Russian gas supplies: this figure is less than 3%. Its trade turnover with the Russian Federation is also much lower. And geographically, it is separated from the zone of the armed Russian-Ukrainian conflict by about 2,000 kilometers. All these factors enable the Bank of England, in contrast to its colleagues from the ECB, to act more decisively in the normalization of its monetary policy.
There will also be a meeting of the Bank of England on March 17, the day after the Fed meeting. And it is quite possible that the decision of the UK regulator on the interest rate will depend on how much the US Central Bank will raise (or not raise) its rate on the eve. This is an additional factor of uncertainty when predicting the exchange rate of the British currency.
Recall that the Bank of England was the first to raise the rate, raising it to 0.5%. But it is still unclear how long its hawkish fuse will last.
Experts' forecast for the GBP/USD pair for the next week is as follows: 35% vote for the movement to the north, 35% - for further movement to the south, the remaining 20% vote for the sideways trend. However, when moving to a monthly forecast, bull supporters get a clear advantage: those are 65%, with 15% of the votes cast for bears and 20% of abstentions. All 100% of the indicators on D1 are facing south at the time of writing the review, however, 30% of the oscillators signal that the pair is oversold.
The pound finished the weekly trading session at 1.3035. The nearest support is located in the zone 1.2985-1.3025, followed by the 2020 supports. Resistance levels are 1.3080, 1.3145, 1.3200, 1.3270-1.3325, 1.3400, 1.3485, 1.3600, 1.3640.
Aside from the Bank of England meeting, next week's events include the publication of data from the UK labor market on Tuesday, March 15, including the average wage level in the country, as well as changes in the number of applications for unemployment benefits.
USD/JPY: Markets Have Chosen the Dollar
We put the question: "Yen or Dollar: Which Safe Haven Is Better?" in the title of the previous USD/JPY review, implying that when the market is in a panic, investors start looking for the safest place to store their capital.
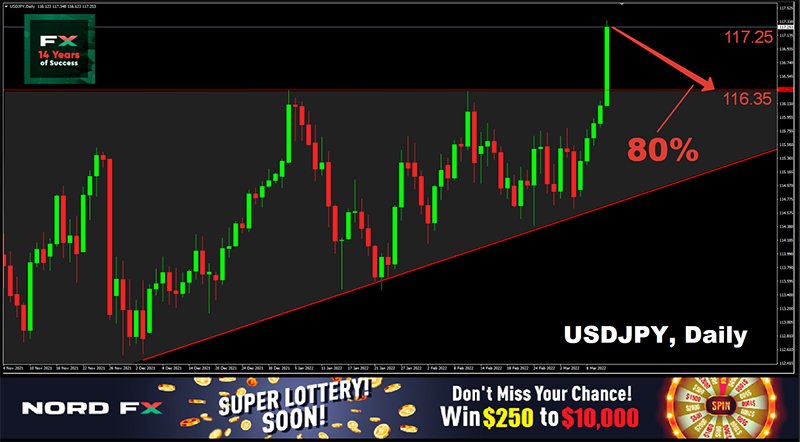
The dollar won this dispute last week. It not only won, but by a wide margin. Having started at 114.81, on Friday March 11, the USD/JPY pair peaked at 117.35, and the last chord of the week sounded a little lower at 117.25. Recall that the vast majority of experts (75%) predicted the growth of the pair, but almost no one expected the breakthrough to be so powerful and all-destroying. As a result of this blitzkrieg, the pair not only renewed the January-February high of 116.35 but reached the zone where it had been traded for a very, very long time, at the turn of 2016/2017.
Experts cite the fact that the Bank of Japan still prefers to refrain from cutting economic stimulus, as the reason for such weak demand for the yen. As we have already written, the regulator believes that tightening monetary policy in the current conditions can bring more harm than good to the economy. Moreover, the country has also joined the sanctions against Russia, which deprives its export-oriented companies of a serious share of income.
Against the backdrop of Russia's invasion of Ukraine, it is also noteworthy that a peace treaty between Russia and Japan was never concluded at the end of World War II, and the countries are still formally at war. The reason is the disagreement regarding the ownership of South Sakhalin and the Kuril Islands. And this issue has been raised again in recent days.
Weak statistics played against the yen last week as well. Japan's GDP fell from 1.3% to 1.1% in the Q4 2021 instead of growing to 1.4%. In annual terms, this figure fell from 5.4% to 4.6%, which disappointed investors.
As for the forecast, 80% of analysts believe that the pair's growth potential has already been exhausted, 20% adhere to the opposite point of view. There is almost complete unanimity among the indicators on D1, after such a powerful breakthrough to the north. 100% of trend indicators, as well as 90% of oscillators are looking up, although a third of them are already in the overbought zone. The remaining 10% of oscillators have taken a neutral position.
Experts name 117.35, 117.70, 118.00 and 118.60 as resistance levels. Supports are located at levels and zones 117.00, 116.75, 116.35, 115.75, 115.00, 114.40-114.65, 114.15, 113.75.
A regular meeting of the Bank of Japan will take place on Friday, March 18. But if the Bank of England has something to answer the US Federal Reserve, nothing of the kind can be expected from the Japanese regulator with its always negative (minus 0.1%) rate. The yen, as a safe-haven currency, is usually supported by investors running away from risky assets. However, judging by the events of the past week, they may give preference to the dollar.
CRYPTOCURRENCIES: March 09 Mystery and the Secret Struggle of Crypto Clans
Many were probably surprised by the unexpected jump in bitcoin on Wednesday March 09. The beginning of the week passed quite calmly: the bulls tried to break above $40,000, the bears tried to lower the quotes below $37,000. And then all of a sudden, in just a few hours, the BTC/USD pair soared by 10%, reaching a high of $42,520.
Why did it happen?
We have repeatedly said that the present and future of the crypto market is largely in the hands of the White House and the US central bank, and the jump on March 09 is an obvious proof of this.
Bitcoin and other digital assets surged after the details of President Joe Biden's executive order were revealed. The document instructs federal agencies to study the impact of cryptocurrencies on national security and the economy by the end of the year, as well as outline the necessary changes in legislation. In particular, it is supposed to coordinate the work of the SEC (Securities and Exchange Commission) and the CFTC (Commodity Futures Trading Commission), as well as the definition of roles for government agencies - from the State Department to the Department of Commerce.
According to a number of analysts, the events in Ukraine prompted the preparation of this document by the White House. More precisely, the fear that some organizations and individuals may use digital assets to circumvent sanctions against Russia. But, whatever the reason, it doesn't change the point. Unlike, for example, China, which seeks to completely destroy this market, the United States, on the contrary, seems to want to develop this industry. And this was positively received by crypto investors.
Such Washington's intentions were confirmed by Anthony Scaramucci, founder of SkyBridge Capital and former White House Communications Director. He is confident that the United States will not tighten the noose around the neck of the crypto market: "I don't think the US wants to lose its leadership in financial services. If they decide to ban or over-regulate digital currencies, we will see capital flight and brain flight out of the country."|
This businessman also stated in an interview with Magnifi that investors should buy BTC even if they have never worked with cryptocurrencies before. According to Scaramucci, cold-blooded holders who know how to wait will benefit in the future. He is confident that bitcoin is guaranteed to reach $100,000 in a couple of years. Note that the entrepreneur stores about $1 billion in bitcoins at the moment.
Returning to the sanctions against Russia, they can cause the price of bitcoin to skyrocket, according to another billionaire, the legendary investor Bill Miller. "Almost 50% of its reserves are held by Russia in currencies controlled by people who want to harm it," Miller said. In this regard, the Russian government may try to use digital gold as a reserve currency. And this, according to Miller, is a "very bullish signal" for bitcoin.
The bullish sentiment was also supported by an authoritative cryptanalyst known as Dave the Wave. According to his forecast, the price of the main cryptocurrency should update its historical maximum in 2022. Dave the Wave has published the BTC price chart and explained that despite bitcoin falling below $40,000, it is still on its way to $100,000. Against the background of the collapse of the global market, the coin has a chance for a steady rebound from the $36,000 mark.
The well-known crypto-analyst and trader Michael van de Poppe looks at the current situation quite differently. He believes that against the background of geopolitical tensions in the east of Europe, bitcoin can continue its fall to $30,000. "Why?" asks the specialist. And he answers: "Because of a short-term panic. You should understand that traders are people who are focused on the short term, are very impulsive, emotional, and this is what the markets reflect." At the same time, Michael van de Popp notes that the current recession is a good opportunity for those who are still optimistic about the first cryptocurrency to replenish its reserves.
As for the altcoins led by ethereum, according to the trader, they are under strong selling pressure in the current situation, which could push them further down until the ethereum reaches the $2,000 mark.
According to Galaxy Digital CEO Mike Novogratz, bitcoin and gold will become the safest assets in the near future. "You can put an equal sign between these two instruments and stop the discussion about what is more important, BTC or precious metals," this billionaire said.
However, there is no equality at the moment. On the contrary, according to analysts from IntoTheBlock, the correlation between bitcoin and precious metals has fallen to its lowest level since August 2021. Thus, it has reached a 7-month low in relation to gold and silver. Experts believe that these changes have occurred against the backdrop of a military operation that Russia is conducting on the territory of Ukraine. Bitcoin is highly correlated with the traditional stock market while commodity prices continue to rise.
According to experts, indicators that assess the return on an asset and the degree of risk demonstrate how much better precious metals have reacted to the resulting volatility compared to the flagship cryptocurrency.
The experts have also noted that the majority of bitcoin holders (57%) have not been affected by the recent price fluctuations of the coin. Many holders keep their virtual assets for more than a year, which means they still have positive returns.
At the time of writing this review (the evening of March 11), after the jump on March 09, everything is back to normal: the BTC/USD pair is trading around $39,000, the total market capitalization, after rising to $1.854 trillion, returned to the values of a week ago at $1.740 trillion, and the Crypto Fear & Greed Index fell from 27 to 22 points, finding itself in the Extreme Fear zone once again.
And in conclusion, another tip in our joke crypto life hacks column. Recall that we talk in it about alternative ways to make money in this market. This time our advice is: "Try writing a crypto thriller." An example is a bestseller that recently came out from the pen of Forbes journalist Laura Shin. Its title is very telling: The Cryptopians: Idealism, Greed, Lies, and the Making of the First Big Cryptocurrency Craze. The writer talks in this book about the large-scale struggle of the rich for influence and leadership in the "new money" industry.
Shin introduces readers to prominent figures in the digital space, such as Vitalik Buterin, Web3 prodigy, Charles Hoskinson, and Joe Labin (a former Goldman Sachs vice president who became one of the most famous cryptocurrency billionaires). "Sparks fly as these prominent personalities fight for their place in what seems to be a limitless new business world," the author writes, describing the "crypto clans" confrontation.
EUR/USD Weekly Outlook
EUR/USD recovered strongly after dipping to 1.0805 last week. But upside is limited by 1.1120 support turned resistance. Initial bias stays neutral first and further decline remains in favor. On the downside, firm break of 61.8% projection of 1.2265 to 1.1120 from 1.1494 at 1.0786 will pave the way to 100% projection at 1.0349 next. However, strong break of 1.1120 will confirm short term bottoming, at least, and bring stronger rebound back towards 1.1494 structural resistance instead.
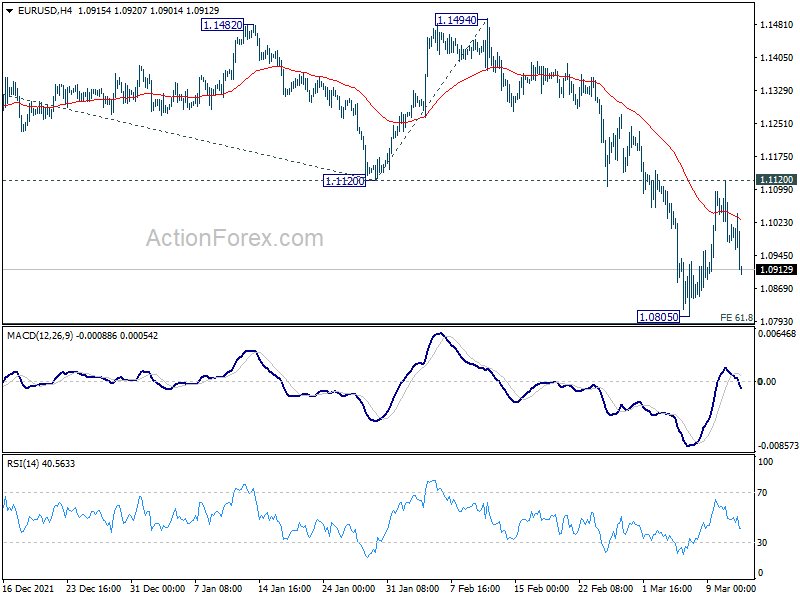
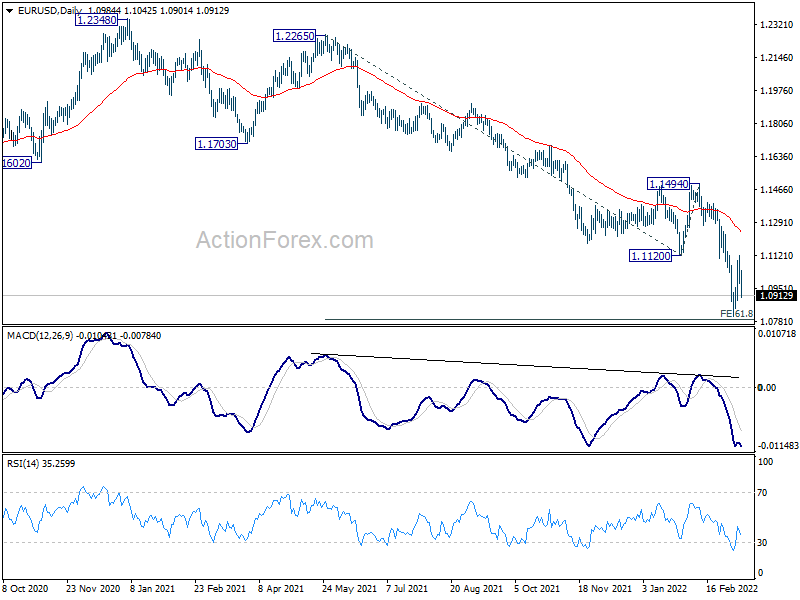
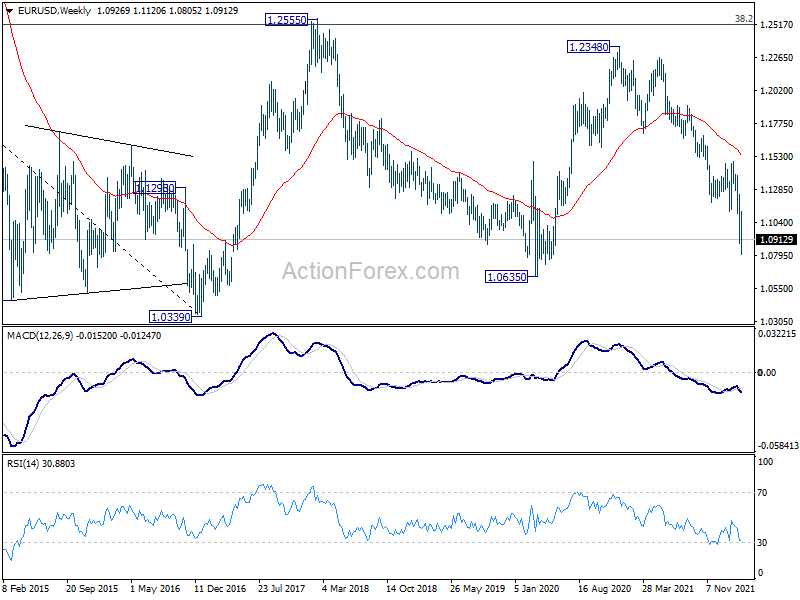
In the bigger picture, the decline from 1.2348 (2021 high) is expected to continue as long as 1.1494 resistance holds. Firm break of 1.0635 (2020 low) will raise the chance of long term down trend resumption and target a retest on 1.0339 (2017 low) next. Nevertheless, break of 1.1494 will maintain medium term neutral outlook, and extend range trading first.
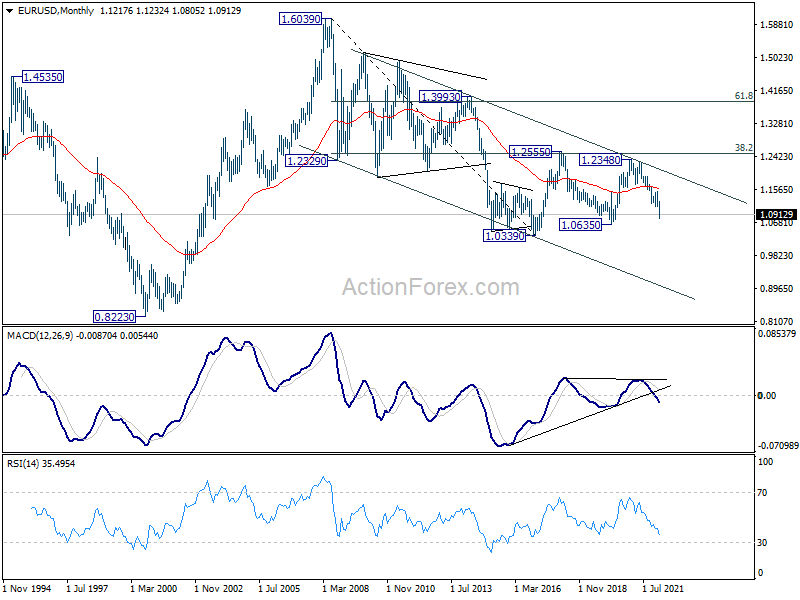
In the long term picture, in any case, as long as 38.2% retracement of 1.6039 (2008 high) to 1.0339 (2017 low) at 1.2516 holds, the down trend from 1.6039 could still resume through 1.0339 low. However, sustained trading above 1.2516 will argue that the long term trend has reversed.
USD/JPY Weekly Outlook
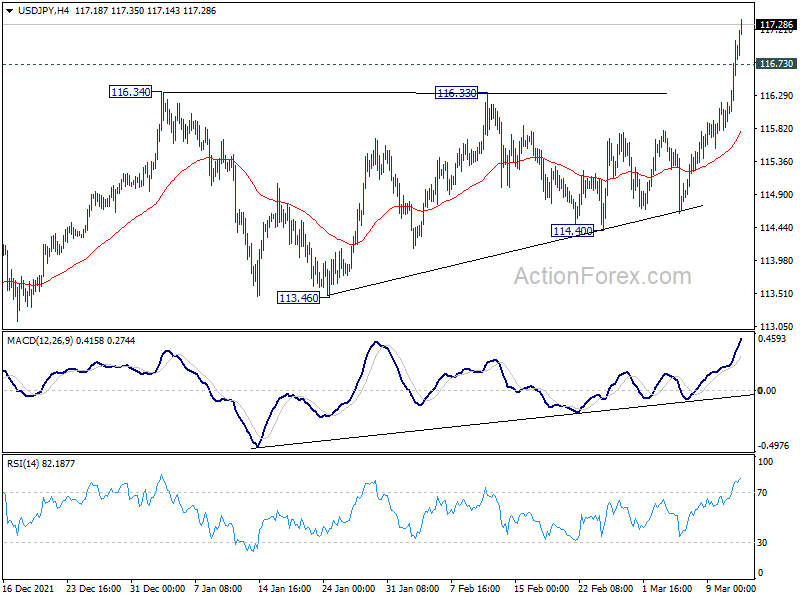
USD/JPY's strong break of 116.34 resistance confirms resumption of whole up trend from 102.58. Initial bias stays on the upside this week. Next target is 118.65 long term resistance. On the downside, below 116.73 minor support will turn intraday bias neutral and bring consolidation first, before staging another rally.
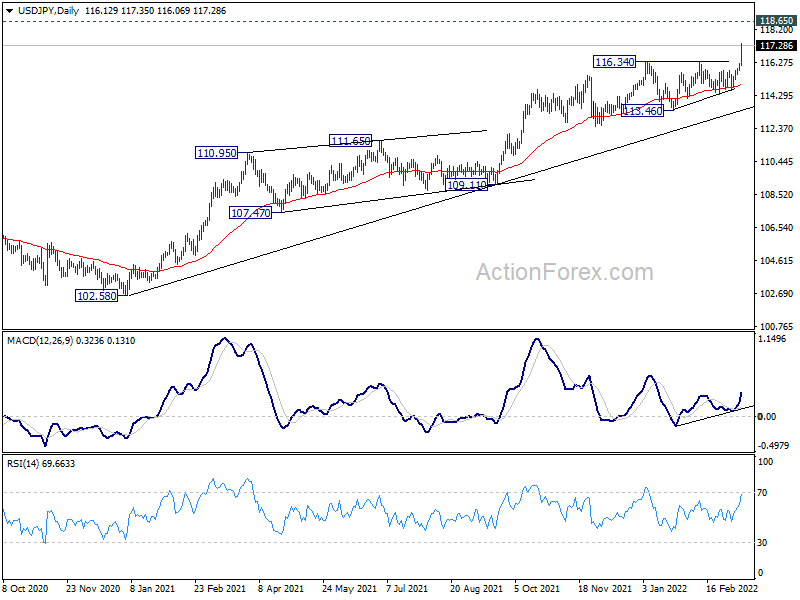
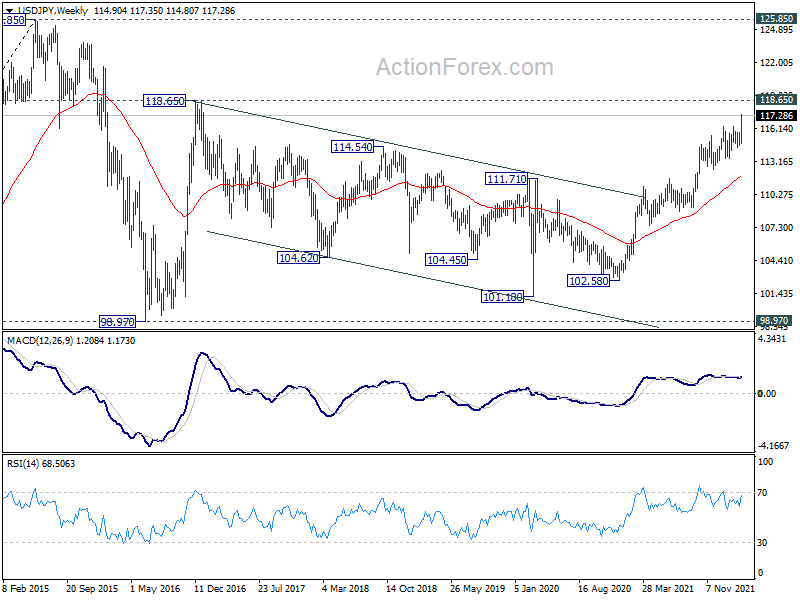
In the bigger picture, no change in the view that rise from 102.58 is the third leg of the up trend from 101.18 (2020 low). Such rally should target a test on 118.65 (2016 high). Sustained break there will pave the way to 125.85 (2015 high) and raise the chance of long term up trend resumption. This will remain the favored case as long as 113.46 support holds.
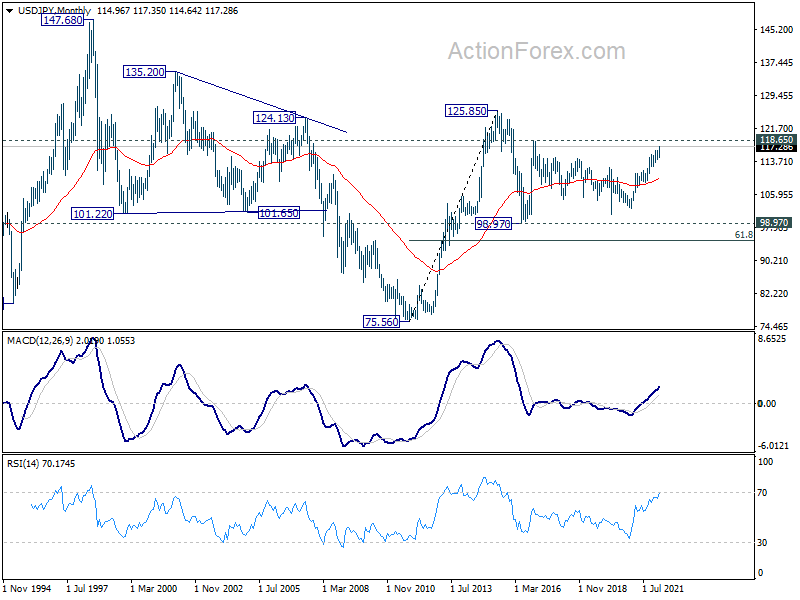
In the long term picture, the rise from 75.56 (2011 low) long term bottom to 125.85 (2015 high) is viewed as an impulsive move, no change in this view. Price actions from 125.85 are seen as a corrective pattern which could still extend. In case of deeper fall, downside should be contained by 61.8% retracement of 75.56 to 125.85 at 94.77. Up trend from 75.56 is expected to resume at a later stage for above 135.20/147.68 resistance zone.
GBP/USD Weekly Outlook
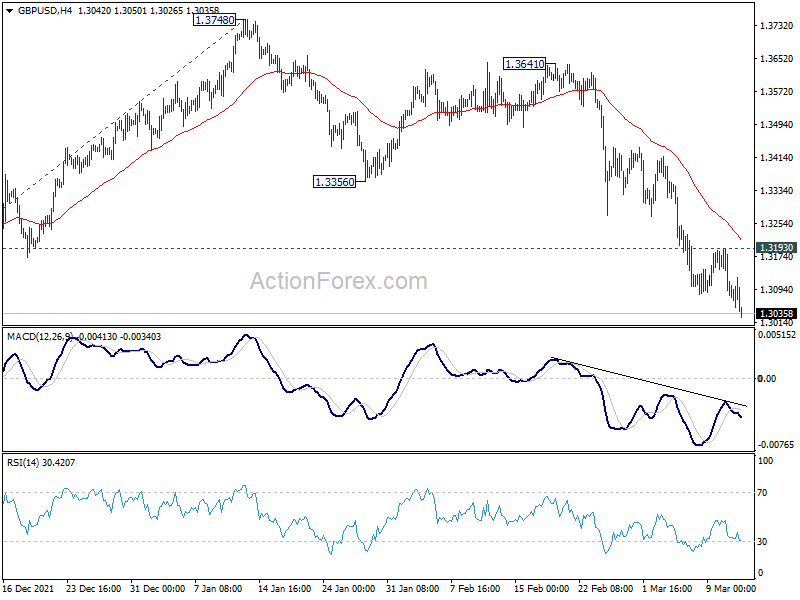
GBP/USD's decline continued last week after some interim consolidations. Initial bias is now on the downside this week. The decline from 1.4248 should target 100% projection of 1.4248 to 1.3158 from 1.3748 at 1.2658. On the upside, break of 1.3193 resistance is needed to indicate short term bottoming. Otherwise, outlook will stay bearish in case of recovery.
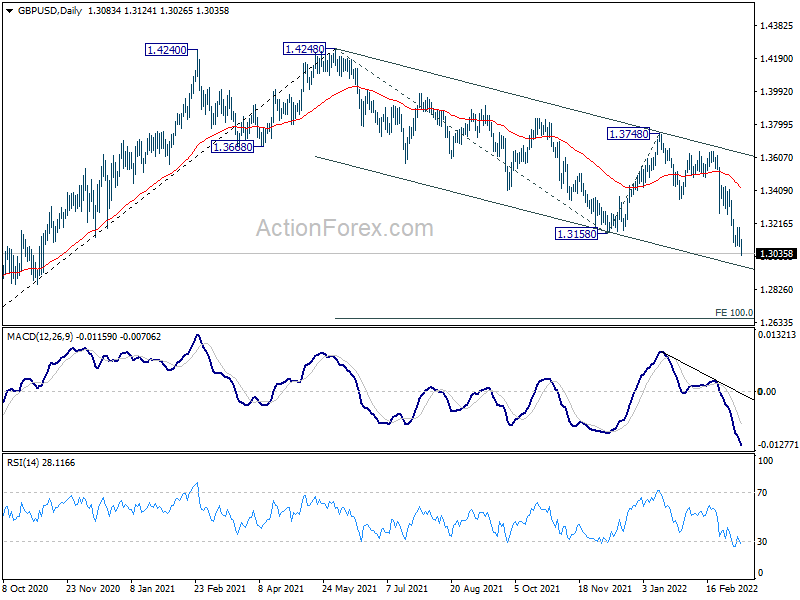
In the bigger picture, current development suggests that the up trend from 1.1409 (2020 low) has completed at 1.4248. Decline from 1.4248 could still be a corrective move, or it could be the start of a long term down trend. In either case, deeper decline would be seen back to 61.8% retracement of 2.1161 to 1.1409 at 1.2493. In any case, break of 1.3748 resistance is needed to indicate medium term bottoming, or outlook will stay bearish.
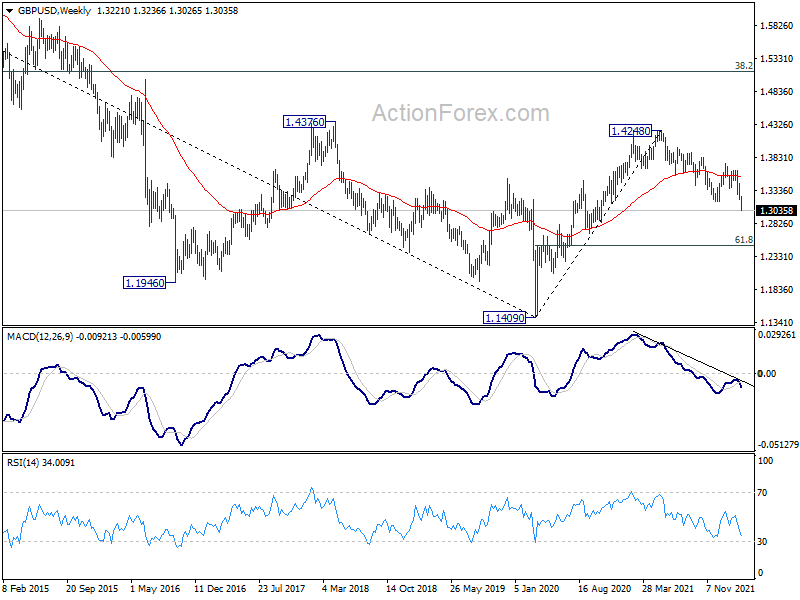
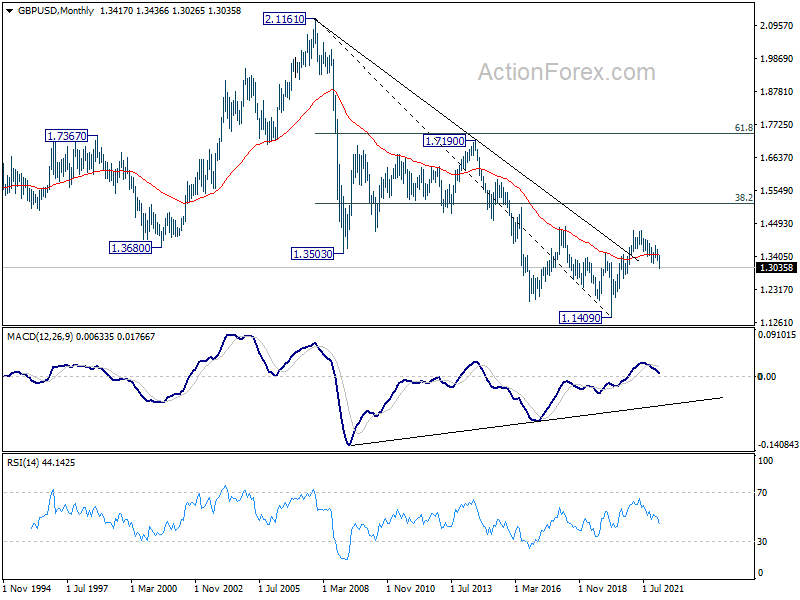
In the longer term picture, rebound from 1.1409 long term bottom could have completed at 1.4248 already, ahead of 38.2% retracement of 2.1161 to 1.1409 at 1.5134. The development argues that price actions from 1.1409 are developing into a corrective pattern only. That is, long term bearishness is retained for resuming the downside from 2.1161 (2007 high) at a later stage.
USD/CHF Weekly Outlook
USD/CHF's late rally and break of 0.9341 resistance argues that choppy rise from 0.8925 might be ready to resume. Initial bias is mildly on the upside this week for 0.9372 resistance first. Break will target 0.9371. However, downside, though, break of 0.9248 will turn intraday bias neutral again.
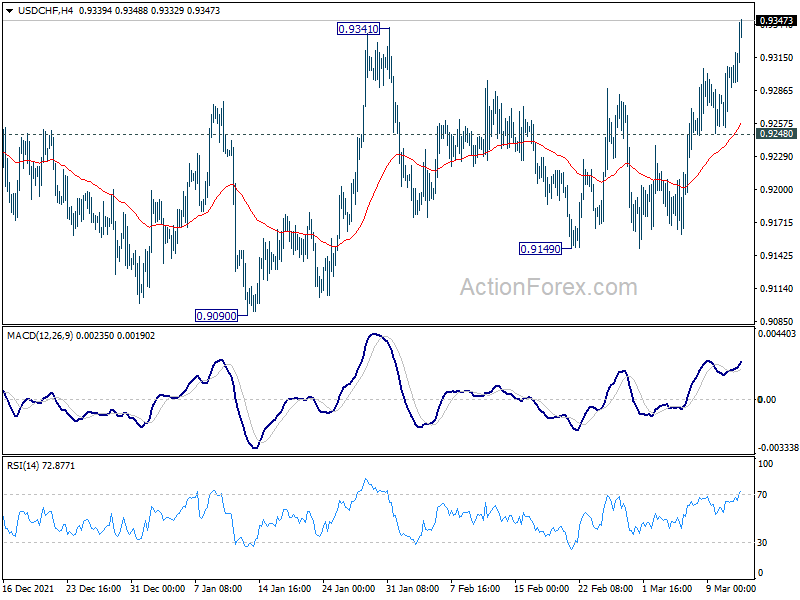
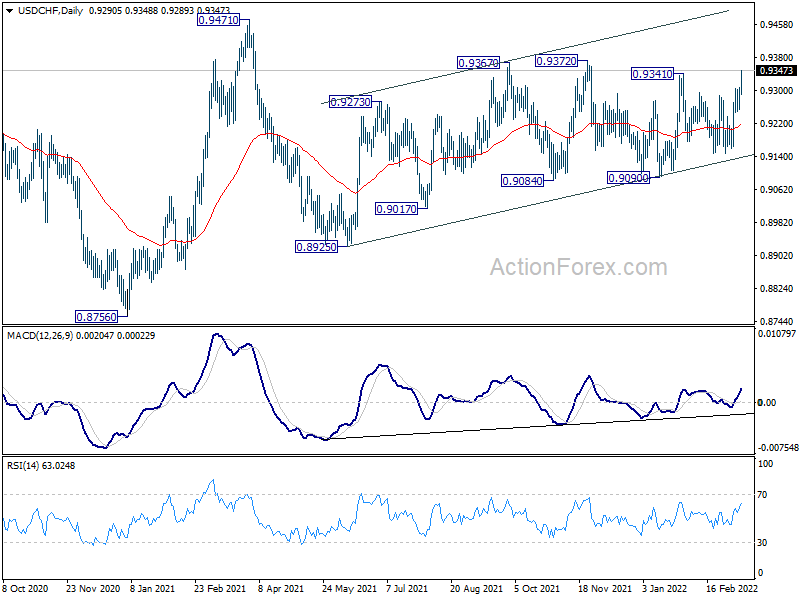
In the bigger picture, medium term outlook will be neutral at best as long as 0.9471 resistance holds. Larger down trend could still extend through 0.8756 (2021 low). However, firm break of 0.9471 will argue that the trend has already reversed and rebound the rally from 0.8756 with another impulsive move.
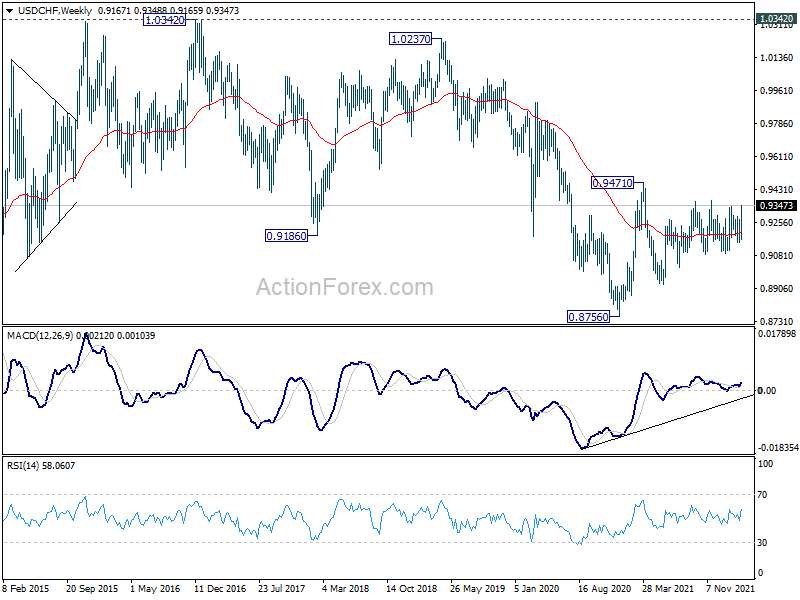
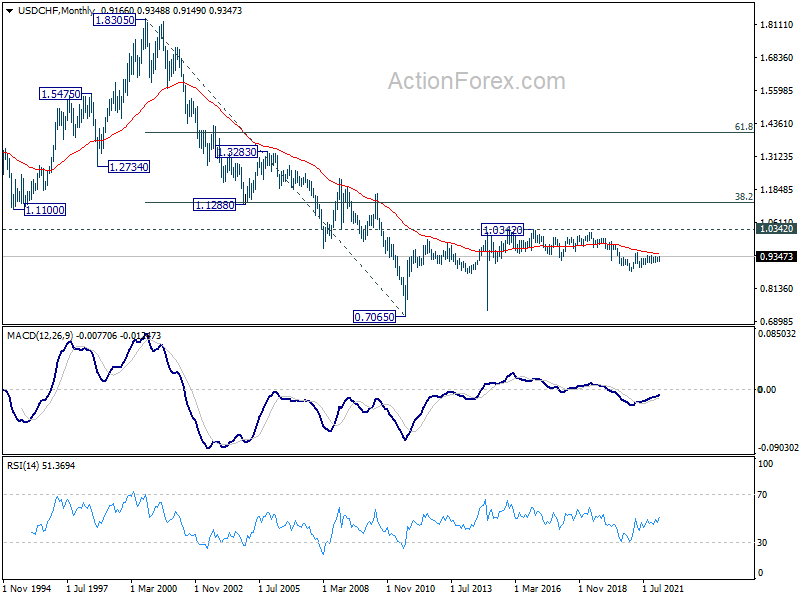
In the long term picture, price actions from 0.7065 (2011 low) are currently seen as developing into a long term corrective pattern, at least until a firm break of 1.0342 resistance.
AUD/USD Weekly Outlook
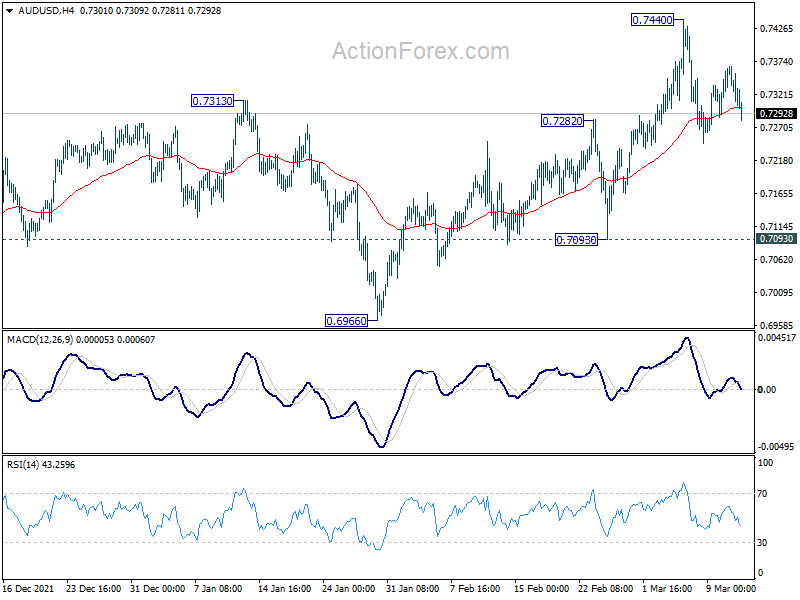
AUD/USD edged higher to 0.7440 last week but retreated since then. Initial bias remains neutral this week for more consolidations. But still, further rally will remain in favor as long as 0.7093 support holds. As noted before, larger decline from 0.8006 might have completed at 0.6966 already. Above 0.7440 will resume the rise from 0.6966 for 0.7555 resistance next.
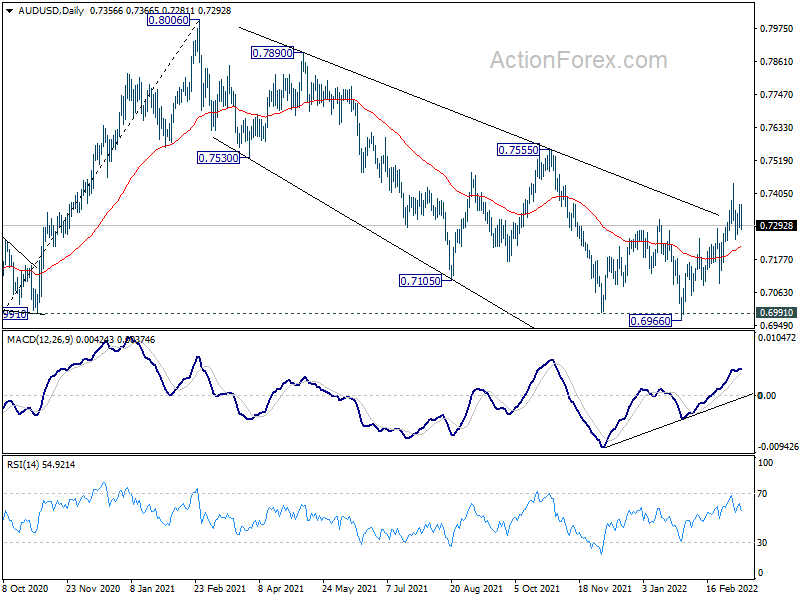
In the bigger picture, focus remains on 0.6991 key structural support. Sustained break there will argue that the whole up trend from 0.5506 might be finished at 0.8006, after rejection by 0.8135 long term resistance. Deeper decline would then be seen back to 61.8% retracement of 0.5506 to 0.8006 at 0.6461. Meanwhile, strong rebound from 0.6991 will retain medium term bullishness. That is, whole up trend from 0.5506 is still in progress for another rise through 0.8006 at a later stage.
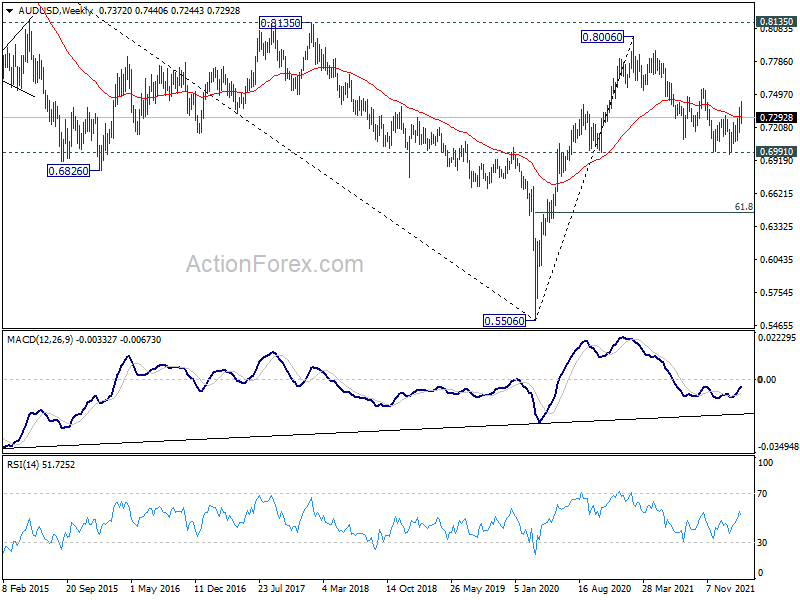
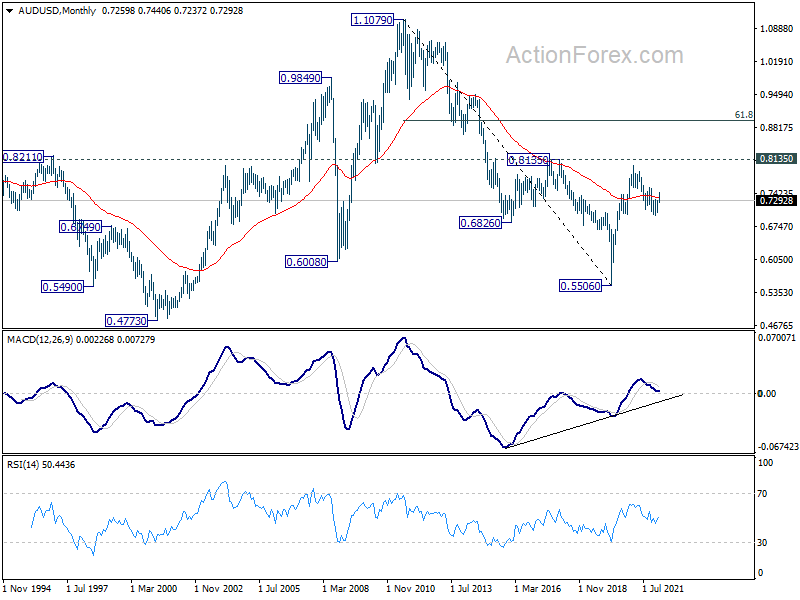
In the longer term picture, focus remains on 0.8135 structural resistance. Decisive break there will argue that rise from 0.5506 is developing into a long term up trend that reverses whole down trend from 1.1079 (2011 high). However, rejection by 0.8135 will keep long term outlook neutral at best.
USD/CAD Weekly Outlook
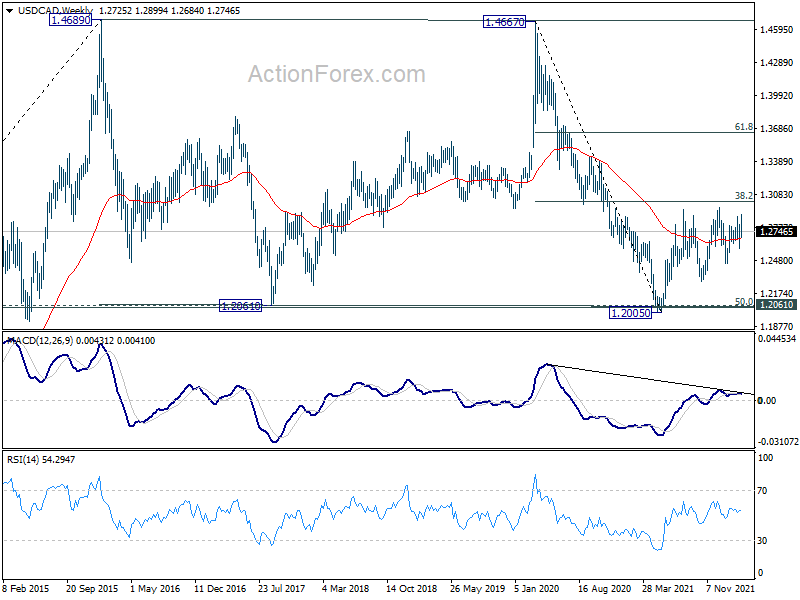
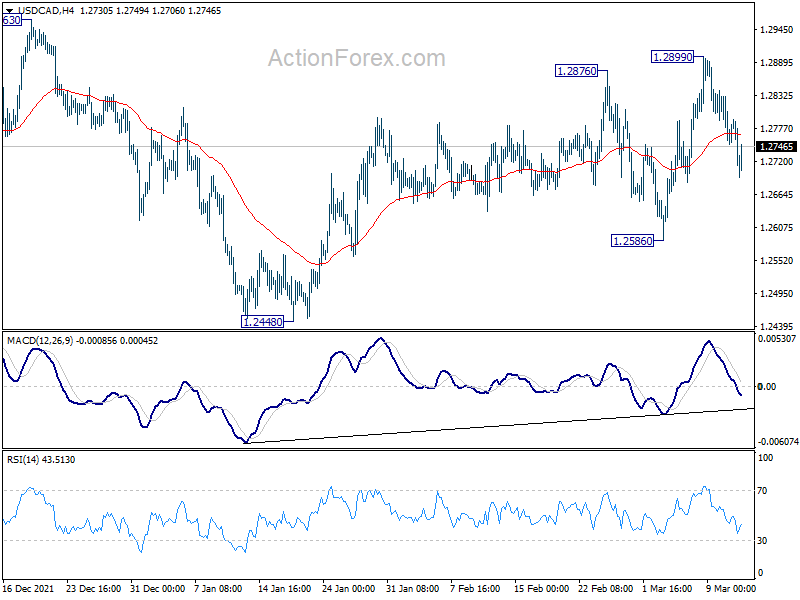
USD/CAD edged higher to 1.2899 last week but dropped sharply since then. Near term outlook is mixed and initial bias is neutral first. On the upside, break of 1.2899 will target 1.2963 resistance first. Break there will target key long term fibonacci level at 1.3022. However, break of 1.2586 will bring retest of 1.2448 support instead.
In the bigger picture, focus stays on 38.2% retracement of 1.4667 (2020 high) to 1.2005 (2021 low) at 1.3022. Sustained break there should confirm that the down trend from 1.4667 has completed after defending 1.2061 long term cluster support. Further rise would then be seen towards 61.8% retracement at 1.3650. However, rejection by 1.3022 will maintain medium term bearishness. Break of 1.2005 will resume the down trend from 1.4667 and that carries larger bearish implications too.
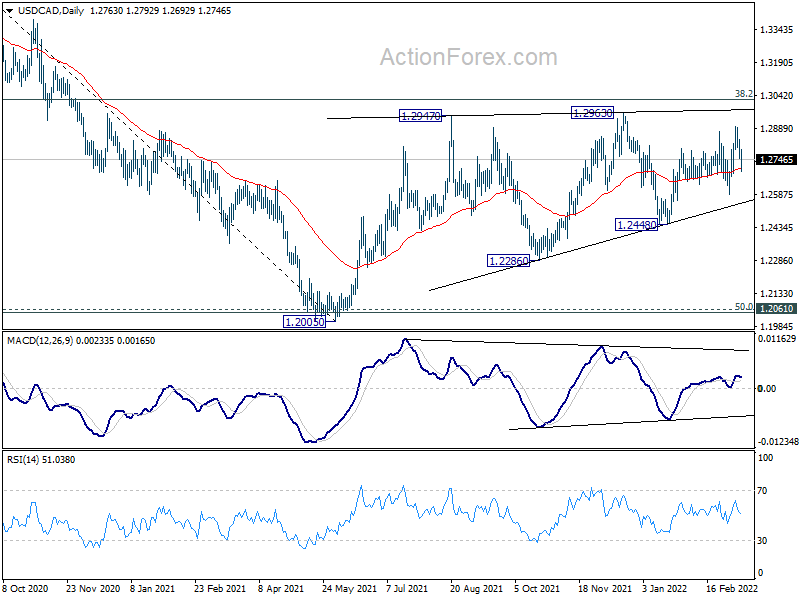
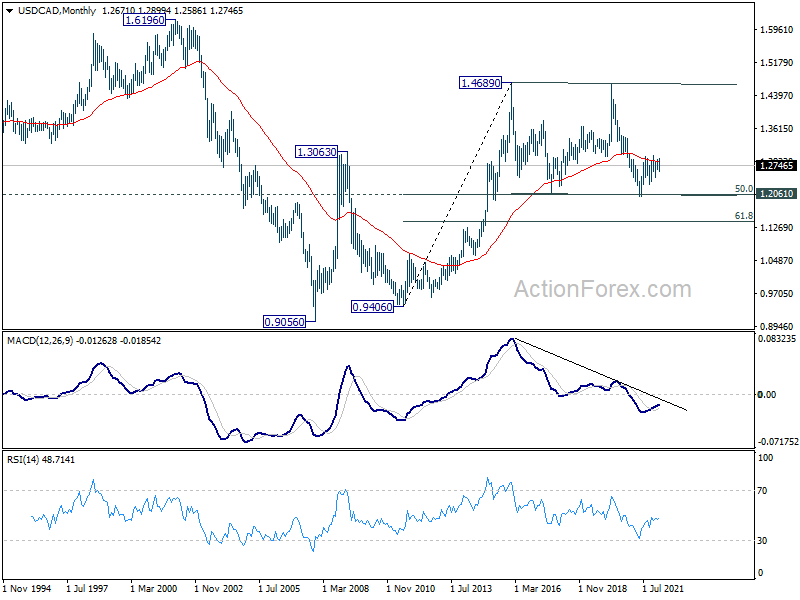
In the longer term picture, we're viewing price actions from 1.4689 as a consolidation pattern. Thus, up trend from 0.9506 (2007 low) is still expected to resume at a later stage. This will remain the favored case as long as 1.2061 support holds, which is close to 50% retracement of 0.9406 to 1.4689 at 1.2048. However, firm break of 1.2061 support will argue that USD/CAD has already started a long term down trend. Next target is 61.8% retracement of 0.9406 to 1.4689 at 1.1424.