Sample Category Title
AUD/USD Daily Report
Daily Pivots: (S1) 0.7262; (P) 0.7314; (R1) 0.7347; More...
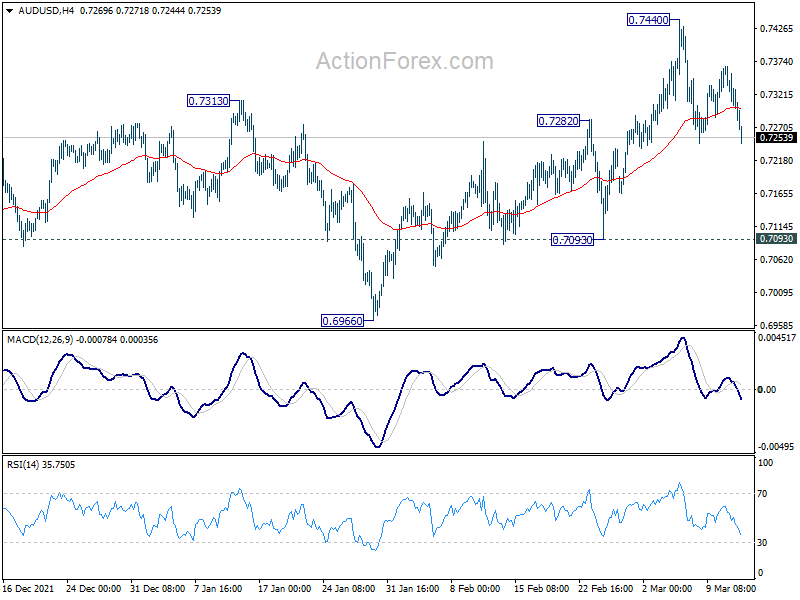
Intraday bias in AUD/USD remains neutral for the moment as consolidation from 0.7440 could extend. Further rally will remain in favor as long as 0.7093 support holds. As noted before, larger decline from 0.8006 might have completed at 0.6966 already. Above 0.7440 will resume the rise from 0.6966 for 0.7555 resistance next.
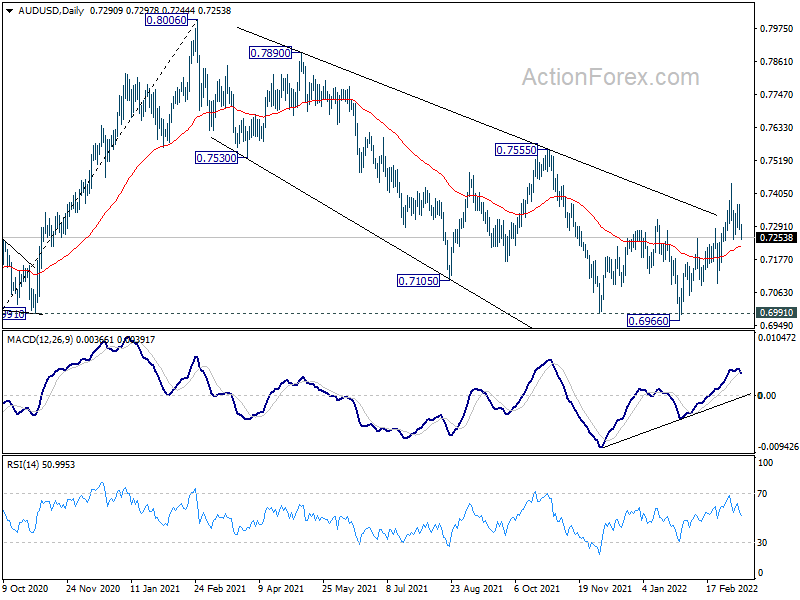
In the bigger picture, focus remains on 0.6991 key structural support. Sustained break there will argue that the whole up trend from 0.5506 might be finished at 0.8006, after rejection by 0.8135 long term resistance. Deeper decline would then be seen back to 61.8% retracement of 0.5506 to 0.8006 at 0.6461. Meanwhile, strong rebound from 0.6991 will retain medium term bullishness. That is, whole up trend from 0.5506 is still in progress for another rise through 0.8006 at a later stage.
USD/CAD Daily Outlook
Daily Pivots: (S1) 1.2694; (P) 1.2744; (R1) 1.2794; More...
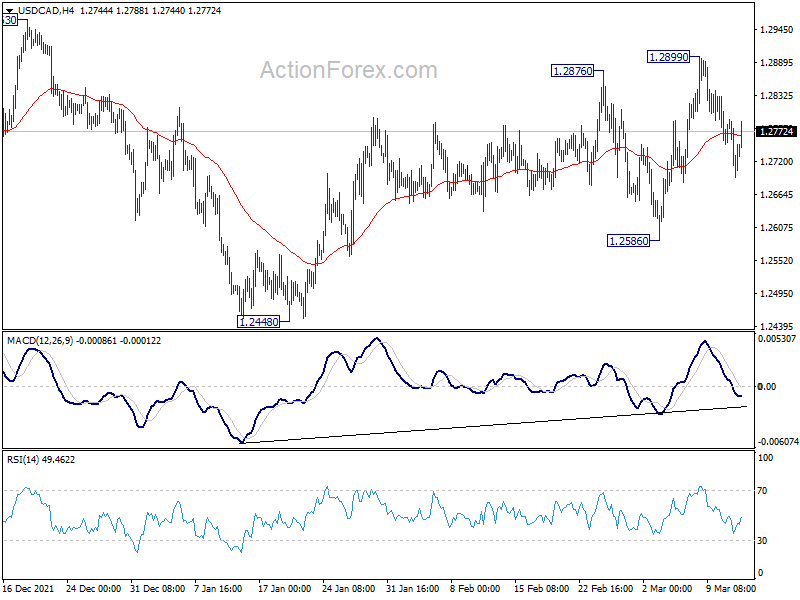
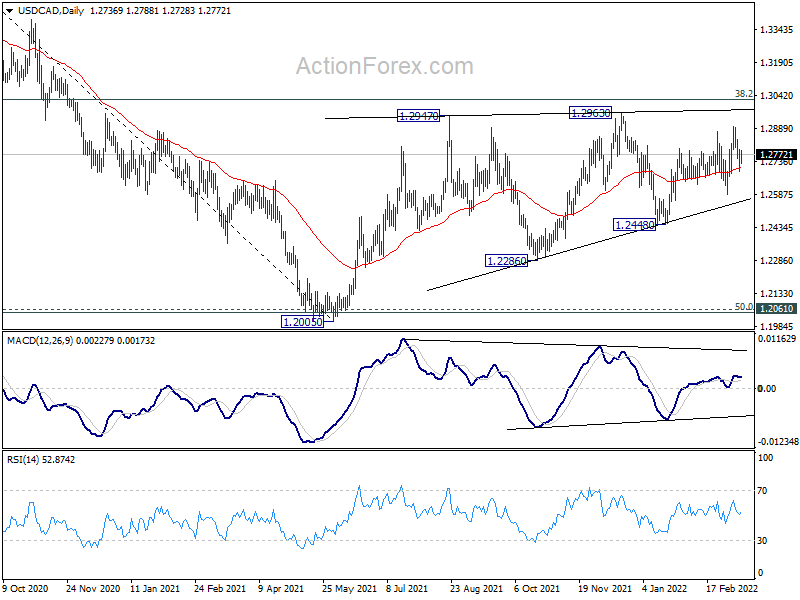
Intraday bias in USD/CAD stays neutral with mixed outlook. On the upside, break of 1.2899 will target 1.2963 resistance first. Break there will target key long term fibonacci level at 1.3022. However, break of 1.2586 will bring retest of 1.2448 support instead.
In the bigger picture, focus stays on 38.2% retracement of 1.4667 (2020 high) to 1.2005 (2021 low) at 1.3022. Sustained break there should confirm that the down trend from 1.4667 has completed after defending 1.2061 long term cluster support. Further rise would then be seen towards 61.8% retracement at 1.3650. However, rejection by 1.3022 will maintain medium term bearishness. Break of 1.2005 will resume the down trend from 1.4667 and that carries larger bearish implications too.
EUR/USD Daily Outlook
Daily Pivots: (S1) 1.0864; (P) 1.0953; (R1) 1.1005; More...
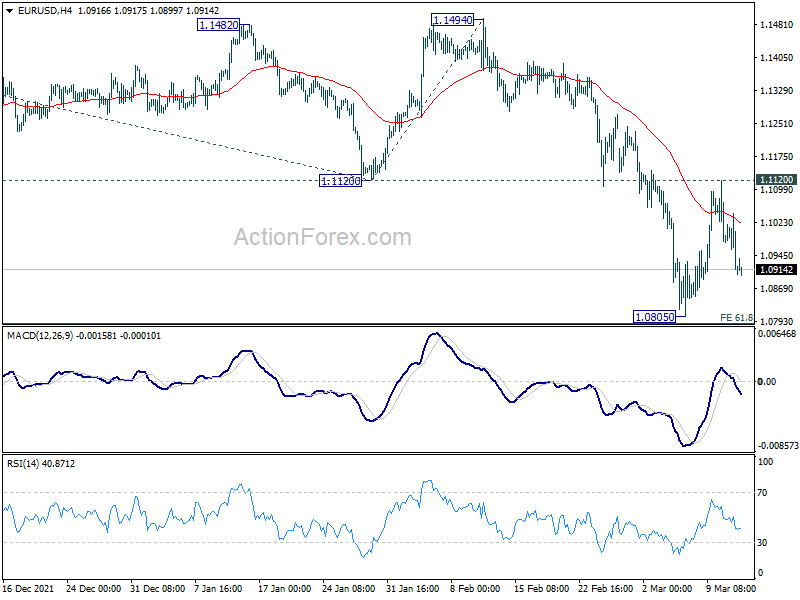
Intraday bias in EUR/USD remains neutral for the moment. As long as 1.1120 support turned resistance holds, larger down trend from 1.1494 is still expected to continue. On the downside, firm break of 61.8% projection of 1.2265 to 1.1120 from 1.1494 at 1.0786 will pave they way to 100% projection at 1.0349 next. However, strong break of 1.1120 will confirm short term bottoming, at least, and bring stronger rebound back towards 1.1494 structural resistance instead.
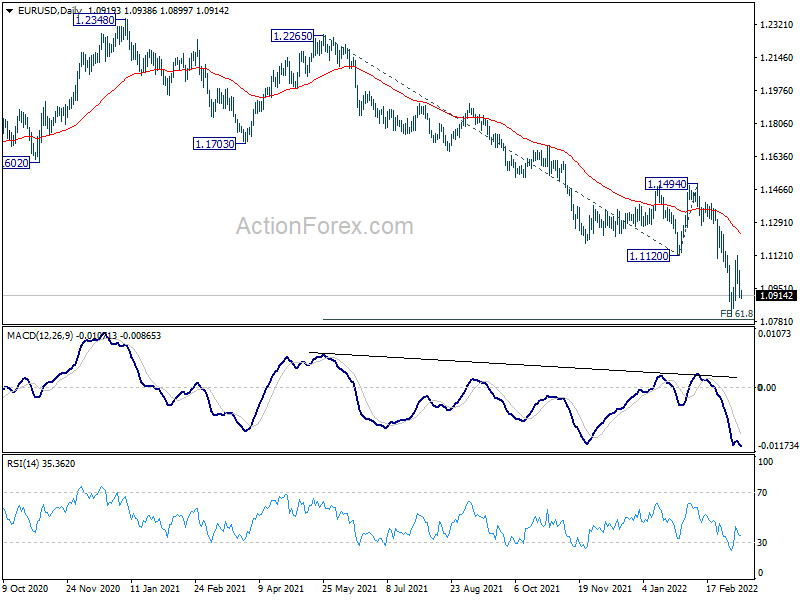
In the bigger picture, the decline from 1.2348 (2021 high) is expected to continue as long as 1.1494 resistance holds. Firm break of 1.0635 (2020 low) will raise the chance of long term down trend resumption and target a retest on 1.0339 (2017 low) next. Nevertheless, break of 1.1494 will maintain medium term neutral outlook, and extend range trading first.
GBP/USD Daily Outlook
Daily Pivots: (S1) 1.3004; (P) 1.3064; (R1) 1.3101; More...
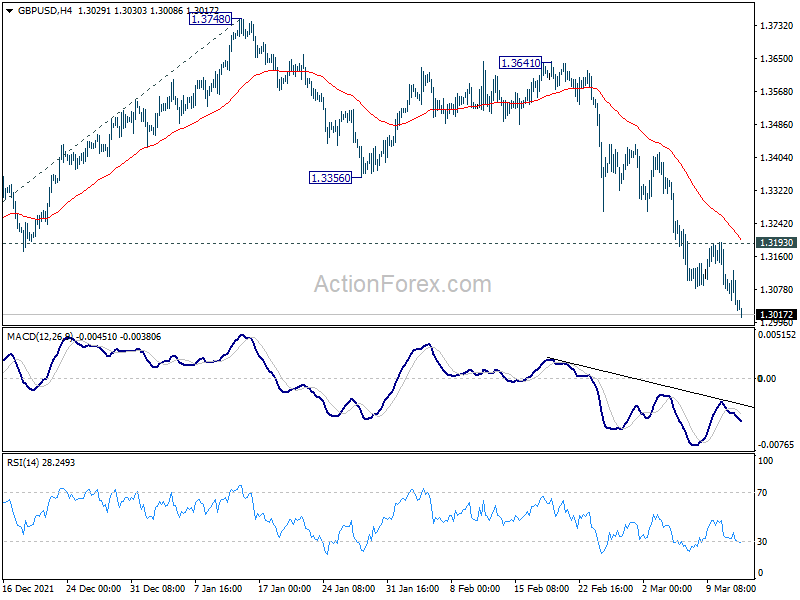
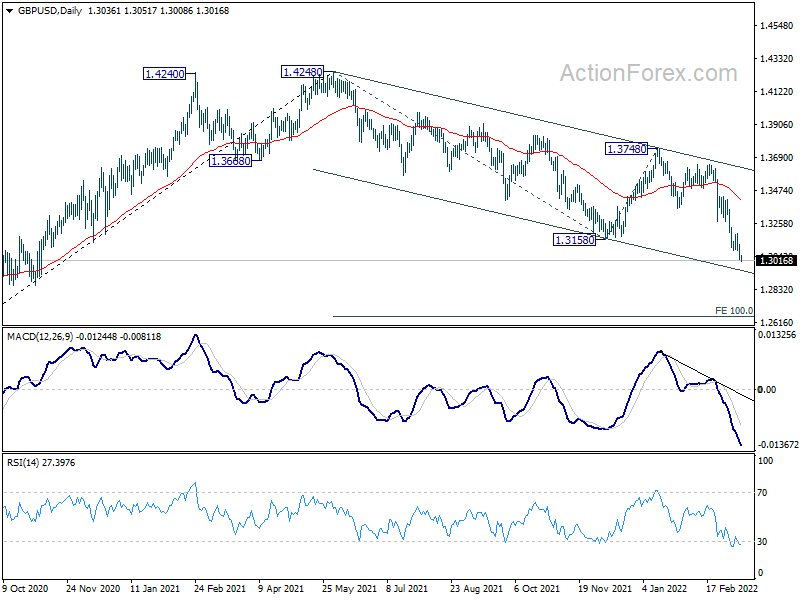
Intraday bias in GBP/USD remains on the downside at this point. Current down trend from 1.4248 should target 100% projection of 1.4248 to 1.3158 from 1.3748 at 1.2658 next. On the upside, break of 1.3193 resistance is needed to indicate short term bottoming. Otherwise, outlook will stay bearish in case of recovery.
In the bigger picture, current development suggests that the up trend from 1.1409 (2020 low) has completed at 1.4248. Decline from 1.4248 could still be a corrective move, or it could be the start of a long term down trend. In either case, deeper decline would be seen back to 61.8% retracement of 2.1161 to 1.1409 at 1.2493. In any case, break of 1.3748 resistance is needed to indicate medium term bottoming, or outlook will stay bearish.
USD/CHF Daily Outlook
Daily Pivots: (S1) 0.9310; (P) 0.9330; (R1) 0.9369; More....
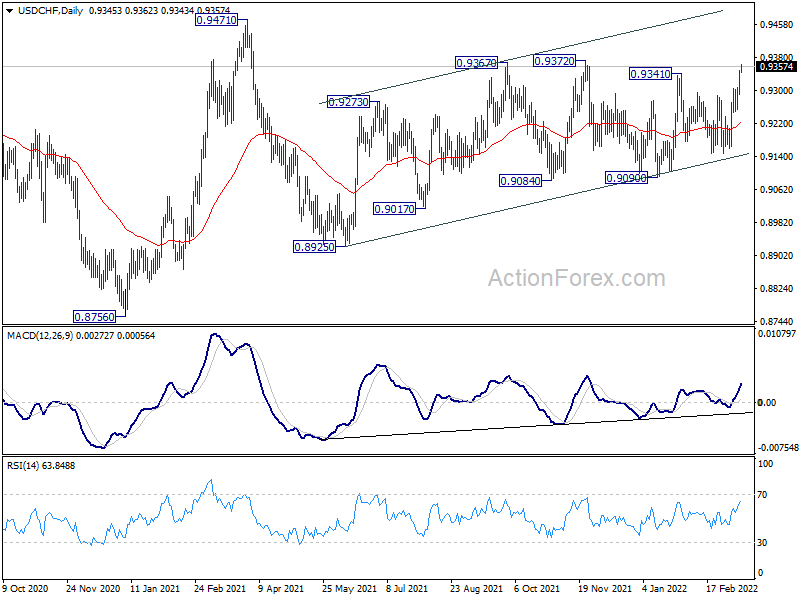
Intraday bias in USD/CHF remains mildly on the upside. Choppy rise from 0.8925 might be ready to resume. Further rise should be seen to 0.9372 resistance first. Break will target 0.9371. However, on the downside, break of 0.9289 will turn intraday bias neutral again.
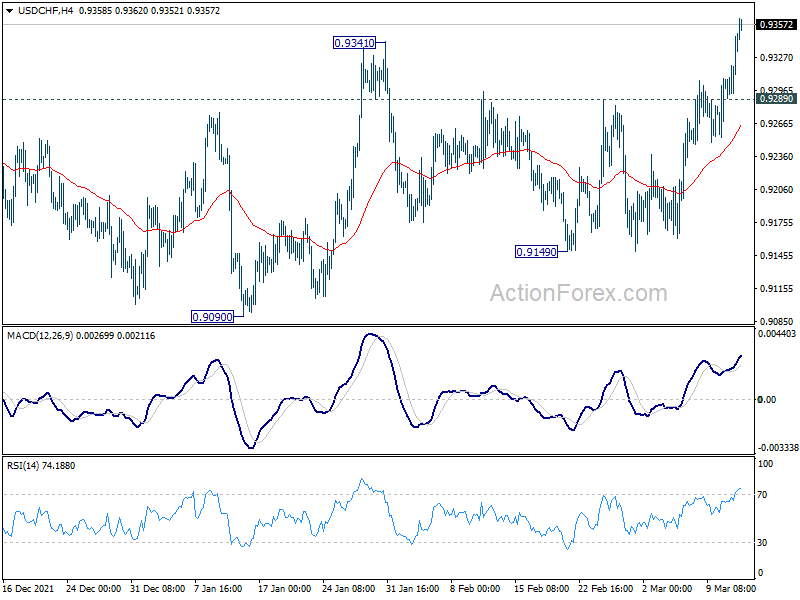
In the bigger picture, medium term outlook will be neutral at best as long as 0.9471 resistance holds. Larger down trend could still extend through 0.8756 (2021 low). However, firm break of 0.9471 will argue that the trend has already reversed and rebound the rally from 0.8756 with another impulsive move.
USD/JPY Daily Outlook
Daily Pivots: (S1) 116.48; (P) 116.92; (R1) 117.73; More...
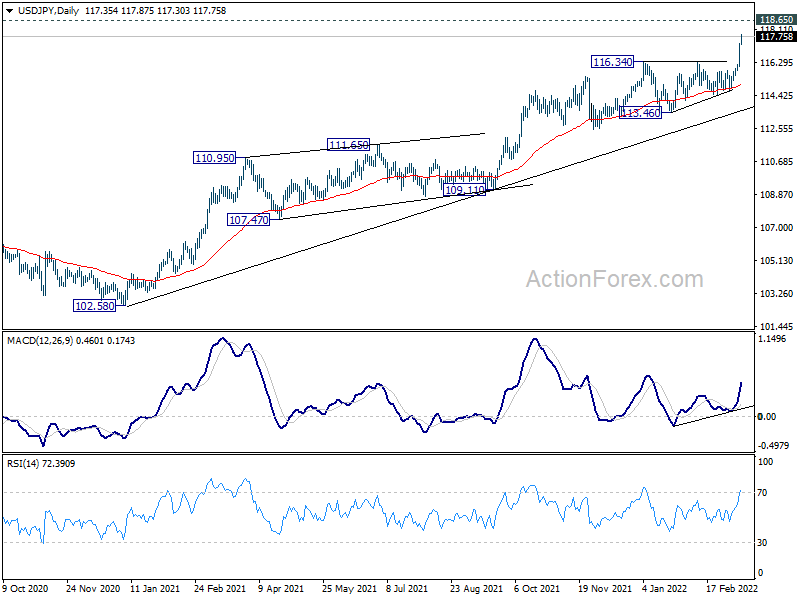
Intraday bias in USD/JPY remains on the upside at this point. Current up trend from 102.58 should target 118.65 long term resistance next. On the downside, below 117.23 minor support will turn intraday bias neutral and bring consolidation first. But retreat should be contained by 116.34 resistance turned support to bring another rally.
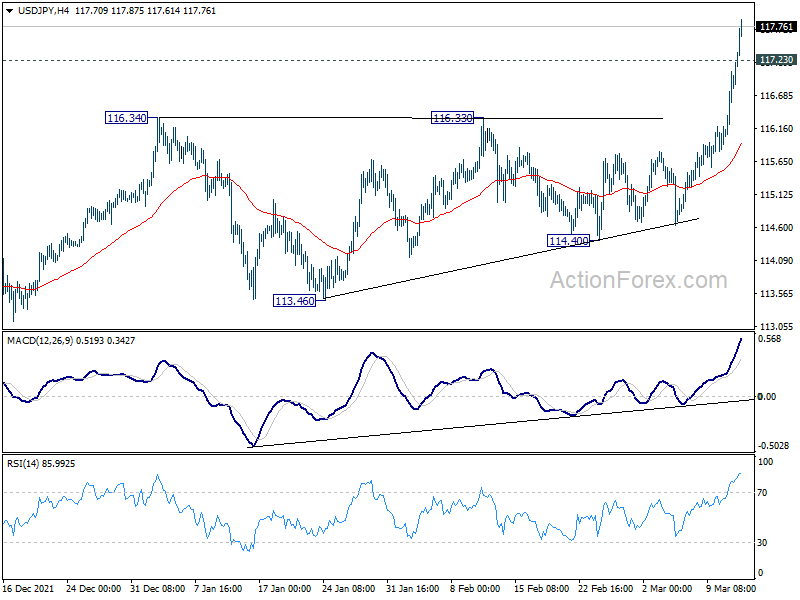
In the bigger picture, no change in the view that rise from 102.58 is the third leg of the up trend from 101.18 (2020 low). Such rally should target a test on 118.65 (2016 high). Sustained break there will pave the way to 125.85 (2015 high) and raise the chance of long term up trend resumption. This will remain the favored case as long as 113.46 support holds.
Dollar Extending Rally Against Yen, Fed and BoE to Hike this Week
Dollar is lifted by risk aversion sentiment in Hong Kong and China in Asian session today. The greenback's strength is particularly apparent against Yen, Aussie and Kiwi. Euro is trying to recover against others but such recovery remains weak. The uncertainty over Russia invasion of Ukraine will continue to cap Euro's rebound. The economic calendar is rather empty today, but volatility is guaranteed ahead with FOMC and BoE rate hikes scheduled.
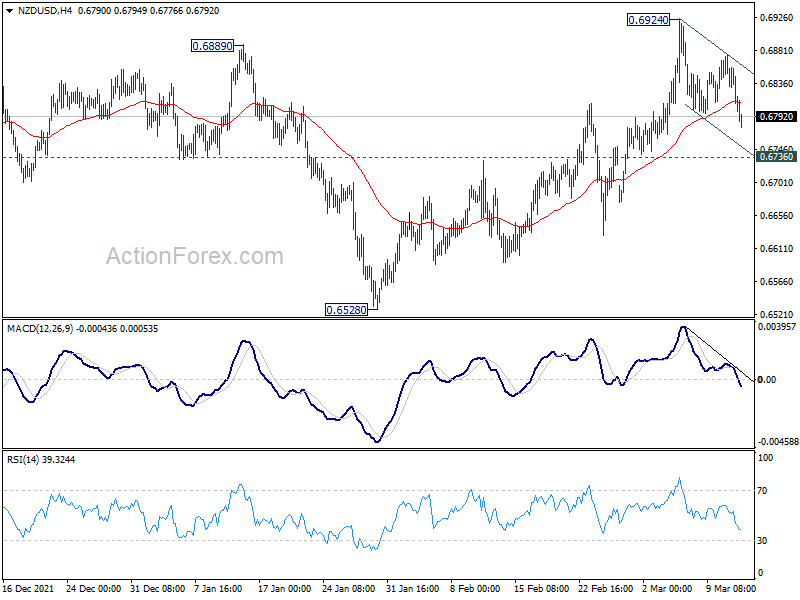
A question in mind is whether commodity currencies could pick up buying again, and extend the rally started since war. Technically, NZD/USD's near term pull back from 0.6924 should complete soon, followed by a break through 0.6924 resistance in the next few days. That is, downside should be very limited even though it may have another dip. However, downside acceleration with break of 0.6736 support turned resistance will argue that the near term tide has reversed, which could also be reflected in Aussie's movements.
In Asia, at the time of writing, Nikkei is up 0.91%. Hong Kong HSI is down -3.81%. China Shanghai SSE is down -1.30%. Singapore Strait Times is down -0.67%. Japan 10-year JGB yield is up 0.009 at 0.192.
Hong Kong HSI extends free fall on geo-politics, lockdown, and regulatory crackdown
Stocks in Hong Kong and China are in selloff mode again today while other parts of Asia are mixed. A batch of factors are weighing on sentiments. The Financial Times and Washington Post reported on Sunday that Russia has asked China for help on military equipment for its invasion of Ukraine. But the spokesperson for China's embassy in Washington said he's "never heard of that".
Separately, fresh lockdown was announced in China's key technology hub in Shenzhen. Last week, the US SEC named its first batch of Chinese stocks as part of a crackdown on foreign firms that refuse to open their books to U.S. regulators. Didi Global suspended its listing in HK after failing to appease the Chinese government's regulatory demands.
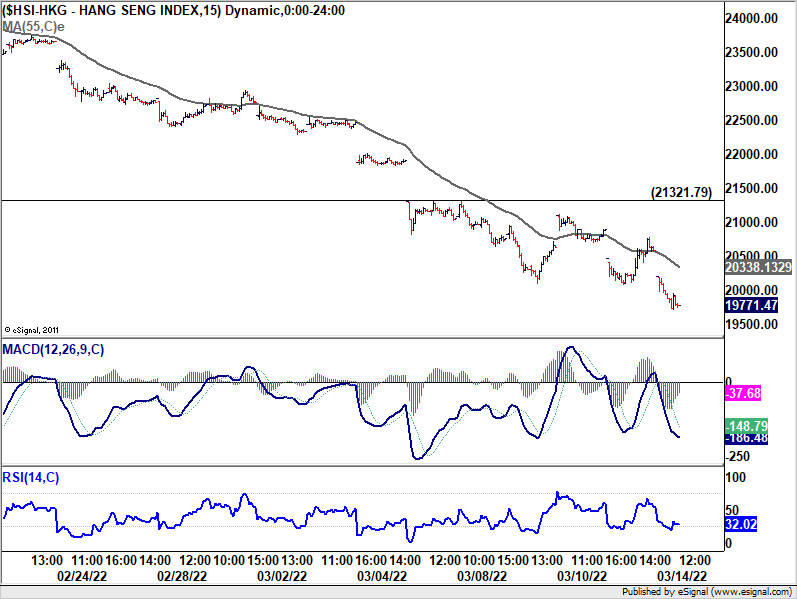
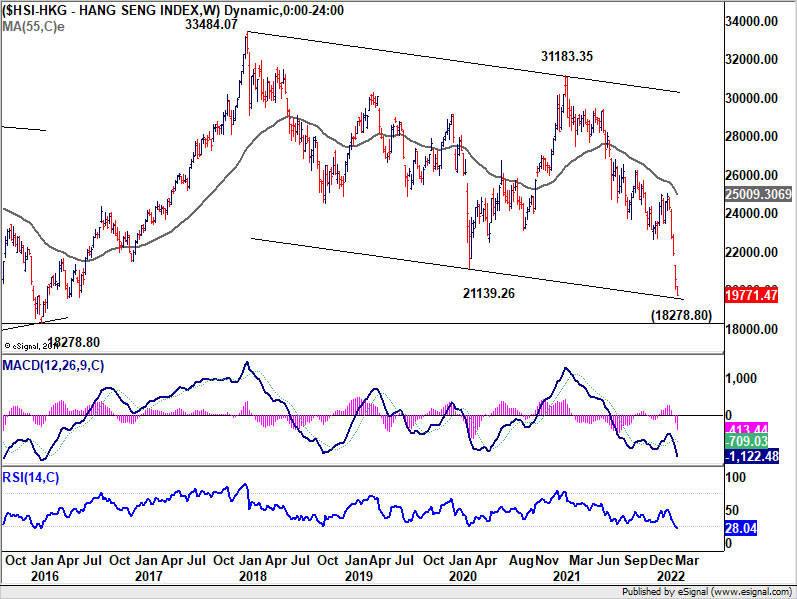
At the time of writing, Hong Kong HSI is down -3.81%, or -782.32 pts for the day, breaking through 20k psychological level. Near term outlook will stay bearish as long as the bottom of the gap last week holds, at 21321.79. However, downside might be "relatively limited" as it will enter into a long term support zone between 18278.80 (2016 low), and lower channel support. Also, both daily and weekly RSI are clearly in deep oversold region.
Ethereum and Bitcoin extending triangle consolidation, not the time for downside breakout yet
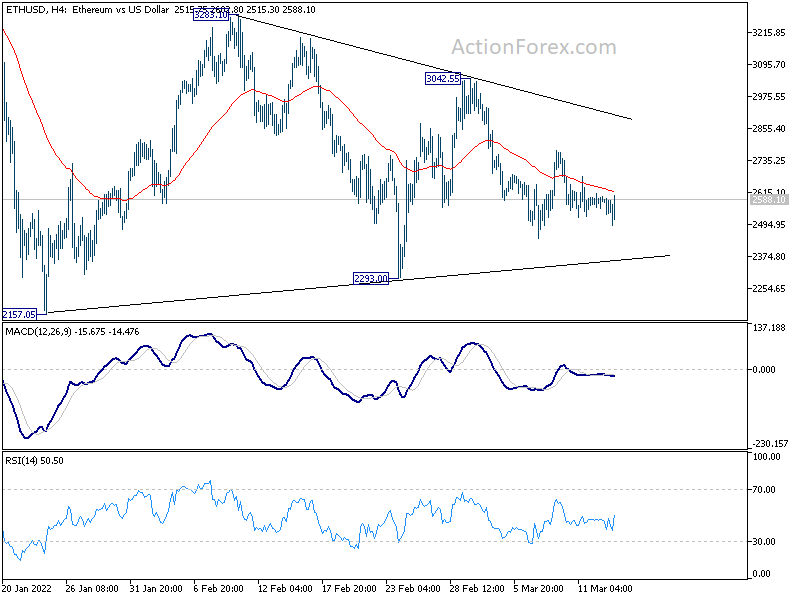
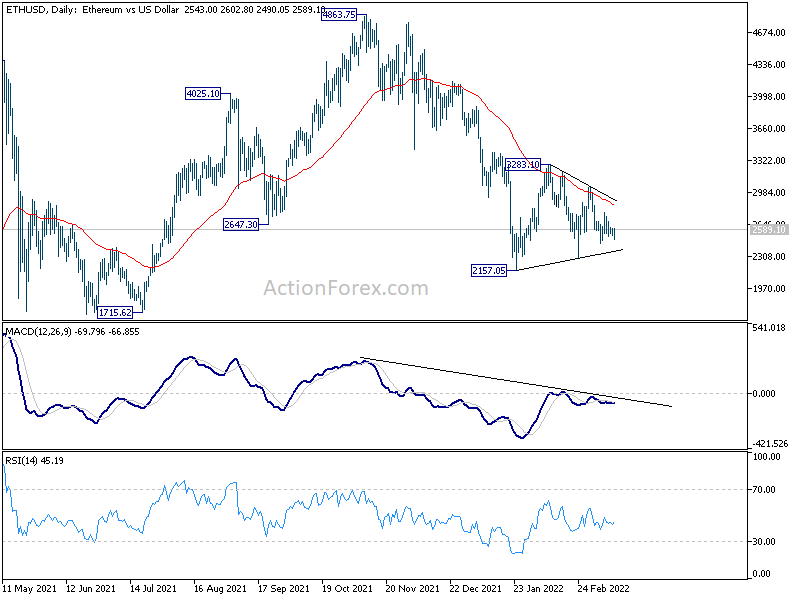
Ethereum is struggling in tight range above 2500 in quiet Asian session. It's staying in the consolidation pattern from 2157, probably in form of a triangle. That is another rising leg could be seen as before the consolidation completes. But judging from current price actions, upside should be limited by 55 day EMA (now at 2852).
The whole down trend from 4863 is expected resume later. Break of 2293 support will be the first sign of downtrend resumption. Further break of 2157 low will pave the way through 2000 to 1715 support next.
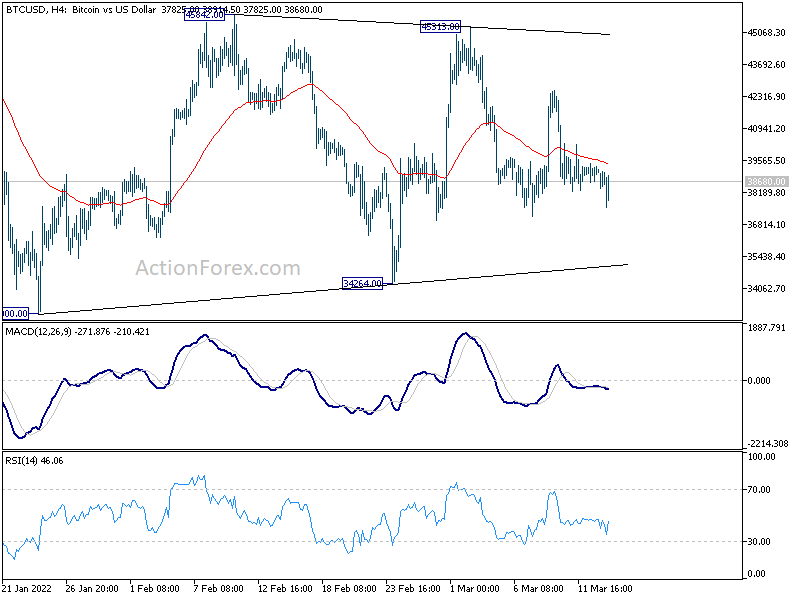
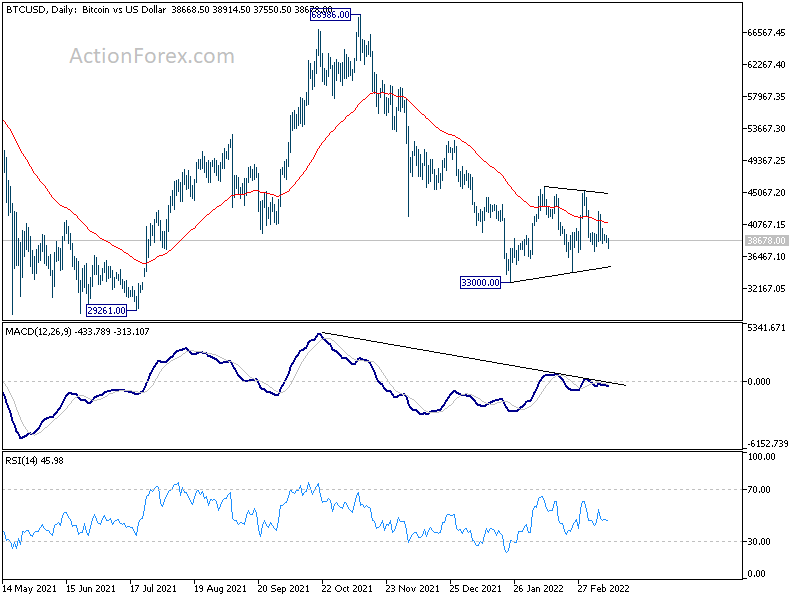
Bitcoin carries the same picture. It's trading in range around 38000 for now. Overall, it's seen as extending the triangle consolidation pattern from 33000. Such pattern should complete after another rising leg. Break of 34264 will be the first sign of resumption of down trend from 68986. Further break of 33000 will target 29261 support next.
Fed and BoE to hike, BoJ to stand pat
Three central banks will meet this week. Fed is now expected lift interest rate by 25bps only to 0.25-0.50%. That, nonetheless, still mark the start of a tightening cycle. Fed Chair Jerome Powell would continue to sound hawkish but non-committal. The numbers, in the new economic projections and dot plot, would speak a louder message.
BoE is also expected to raise interest rate again by 25bps to 0.75%. Last time, the 25bps hike was made by a marginal 5-4 votes, beating hawks that voted for a 50bps hike. The main question this time is how many MPC members will vote for a 50bps again.
BoJ is expected to keep monetary policy unchanged. Governor Haruhiko Kuroda has repeatedly point to sluggish wage growth. Even though core inflation might hit 2% target briefly, there is no case for tightening yet.
On the data front, Canada CPI and retail sales could be most market moving. US retail sales, UK employment , Germany ZEW, will be featured. China will also release retail sales and industrial production. Here are some highlights for the week:
- Monday: France trade balance; Swiss SECO economic forecasts.
- Tuesday: RBA minutes, house price index; China retail sales, industrial production, fixed asset investment; UK employment; Swiss PPI; Germany ZEW economic sentiment; Eurozone industrial production; Canada housing starts, manufacturing sales; US PPI, Empire state manufacturing.
- Wednesday: New Zealand current account; Japan trade balance; Canada CPI, whole sales; US retail sales, import prices, business inventories, NAHB housing index; FOMC rate decision.
- Thursday: New Zealand GDP; Australian employment; Japan machines orders; Swiss trade balance; Eurozone CPI final; BoE rate decision; US jobless claims, Philly Fed manufacturing index, housing starts, building permits, industrial production.
- Friday: BoJ rate decision, CPI, tertiary industry index; Eurozone trade balance; Canada retail sales, foreign securities purchases, new housing price index; US existing home sales.
USD/JPY Daily Outlook
Daily Pivots: (S1) 116.48; (P) 116.92; (R1) 117.73; More...
Intraday bias in USD/JPY remains on the upside at this point. Current up trend from 102.58 should target 118.65 long term resistance next. On the downside, below 117.23 minor support will turn intraday bias neutral and bring consolidation first. But retreat should be contained by 116.34 resistance turned support to bring another rally.
In the bigger picture, no change in the view that rise from 102.58 is the third leg of the up trend from 101.18 (2020 low). Such rally should target a test on 118.65 (2016 high). Sustained break there will pave the way to 125.85 (2015 high) and raise the chance of long term up trend resumption. This will remain the favored case as long as 113.46 support holds.
Economic Indicators Update
| GMT | Ccy | Events | Actual | Forecast | Previous | Revised |
|---|---|---|---|---|---|---|
| 07:45 | EUR | France Trade Balance (EUR) Jan | -12.3B | -11.3B | ||
| 08:00 | CHF | SECO Economic Forecasts |
Ethereum and Bitcoin extending triangle consolidation, not the time for downside breakout yet
Ethereum is struggling in tight range above 2500 in quiet Asian session. It's staying in the consolidation pattern from 2157, probably in form of a triangle. That is another rising leg could be seen as before the consolidation completes. But judging from current price actions, upside should be limited by 55 day EMA (now at 2852).
The whole down trend from 4863 is expected resume later. Break of 2293 support will be the first sign of downtrend resumption. Further break of 2157 low will pave the way through 2000 to 1715 support next.
Bitcoin carries the same picture. It's trading in range around 38000 for now. Overall, it's seen as extending the triangle consolidation pattern from 33000. Such pattern should complete after another rising leg. Break of 34264 will be the first sign of resumption of down trend from 68986. Further break of 33000 will target 29261 support next.
Hong Kong HSI extends free fall on geo-politics, lockdown, and regulatory crackdown
Stocks in Hong Kong and China are in selloff mode again today while other parts of Asia are mixed. A batch of factors are weighing on sentiments. The Financial Times and Washington Post reported on Sunday that Russia has asked China for help on military equipment for its invasion of Ukraine. But the spokesperson for China's embassy in Washington said he's "never heard of that".
Separately, fresh lockdown was announced in China's key technology hub in Shenzhen. Last week, the US SEC named its first batch of Chinese stocks as part of a crackdown on foreign firms that refuse to open their books to U.S. regulators. Didi Global suspended its listing in HK after failing to appease the Chinese government's regulatory demands.
At the time of writing, Hong Kong HSI is down -3.81%, or -782.32 pts for the day, breaking through 20k psychological level. Near term outlook will stay bearish as long as the bottom of the gap last week holds, at 21321.79. However, downside might be "relatively limited" as it will enter into a long term support zone between 18278.80 (2016 low), and lower channel support. Also, both daily and weekly RSI are clearly in deep oversold region.
Technical Outlook and Review
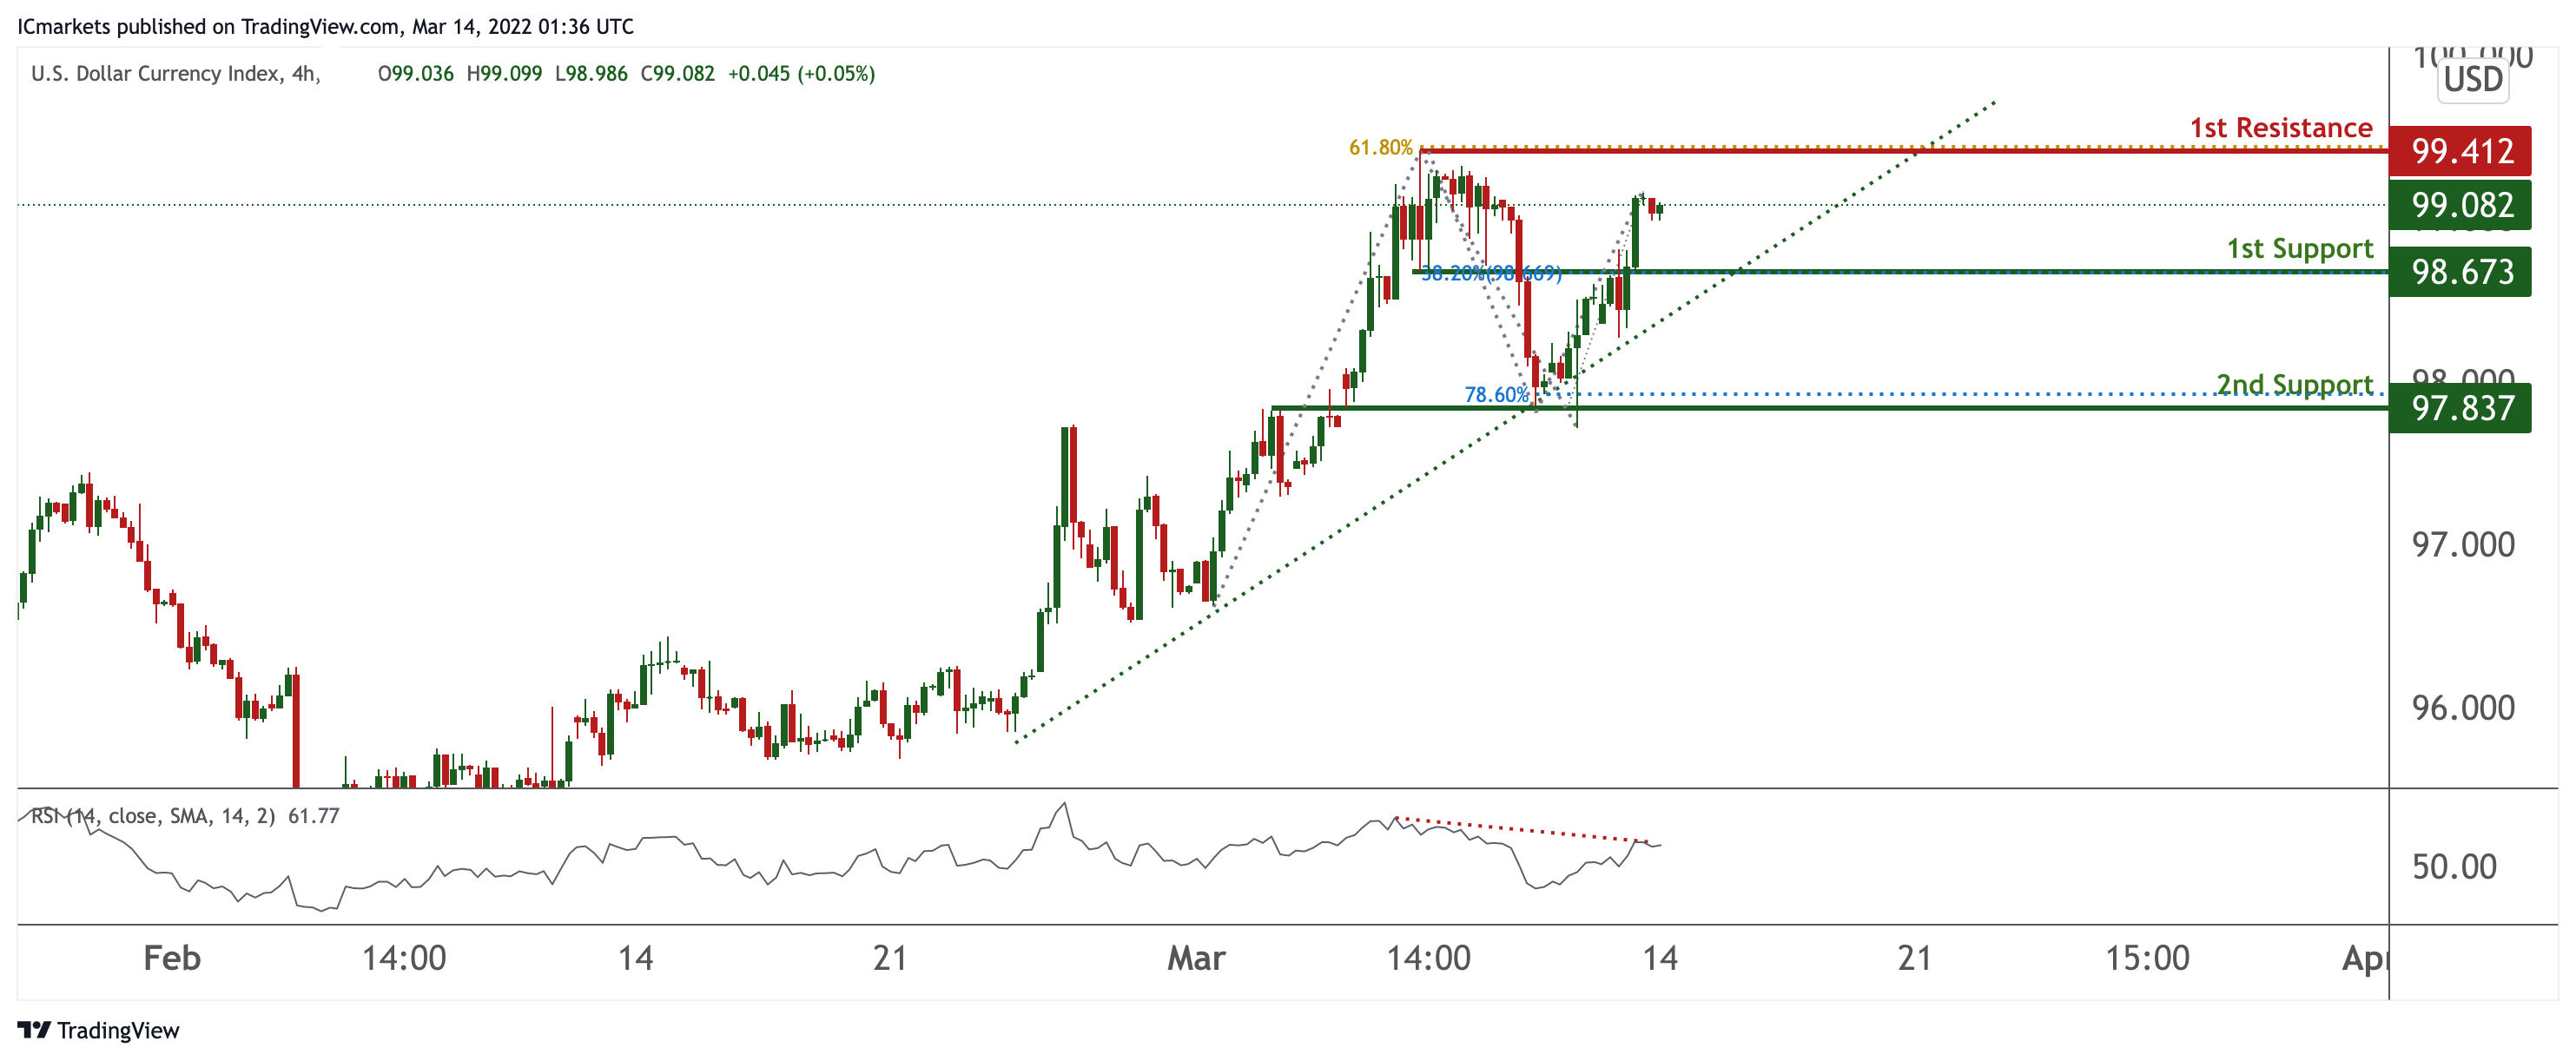
DXY:
On the H4 timeframe, prices are on bullish momentum and abiding to our ascending trendline support. We see the potential for a short pullback from our 1st resistance at 99.412 in line with 61.8% Fibonacci projection towards our 1st support at 98.673 in line with 38.2% Fibonacci retracement. RSI is on bearish momentum, further supporting our bias.
Areas of consideration:
- H4 time frame, 1st resistance at 99.412
- H4 time frame, 1st support at 98.673
XAU/USD (GOLD):
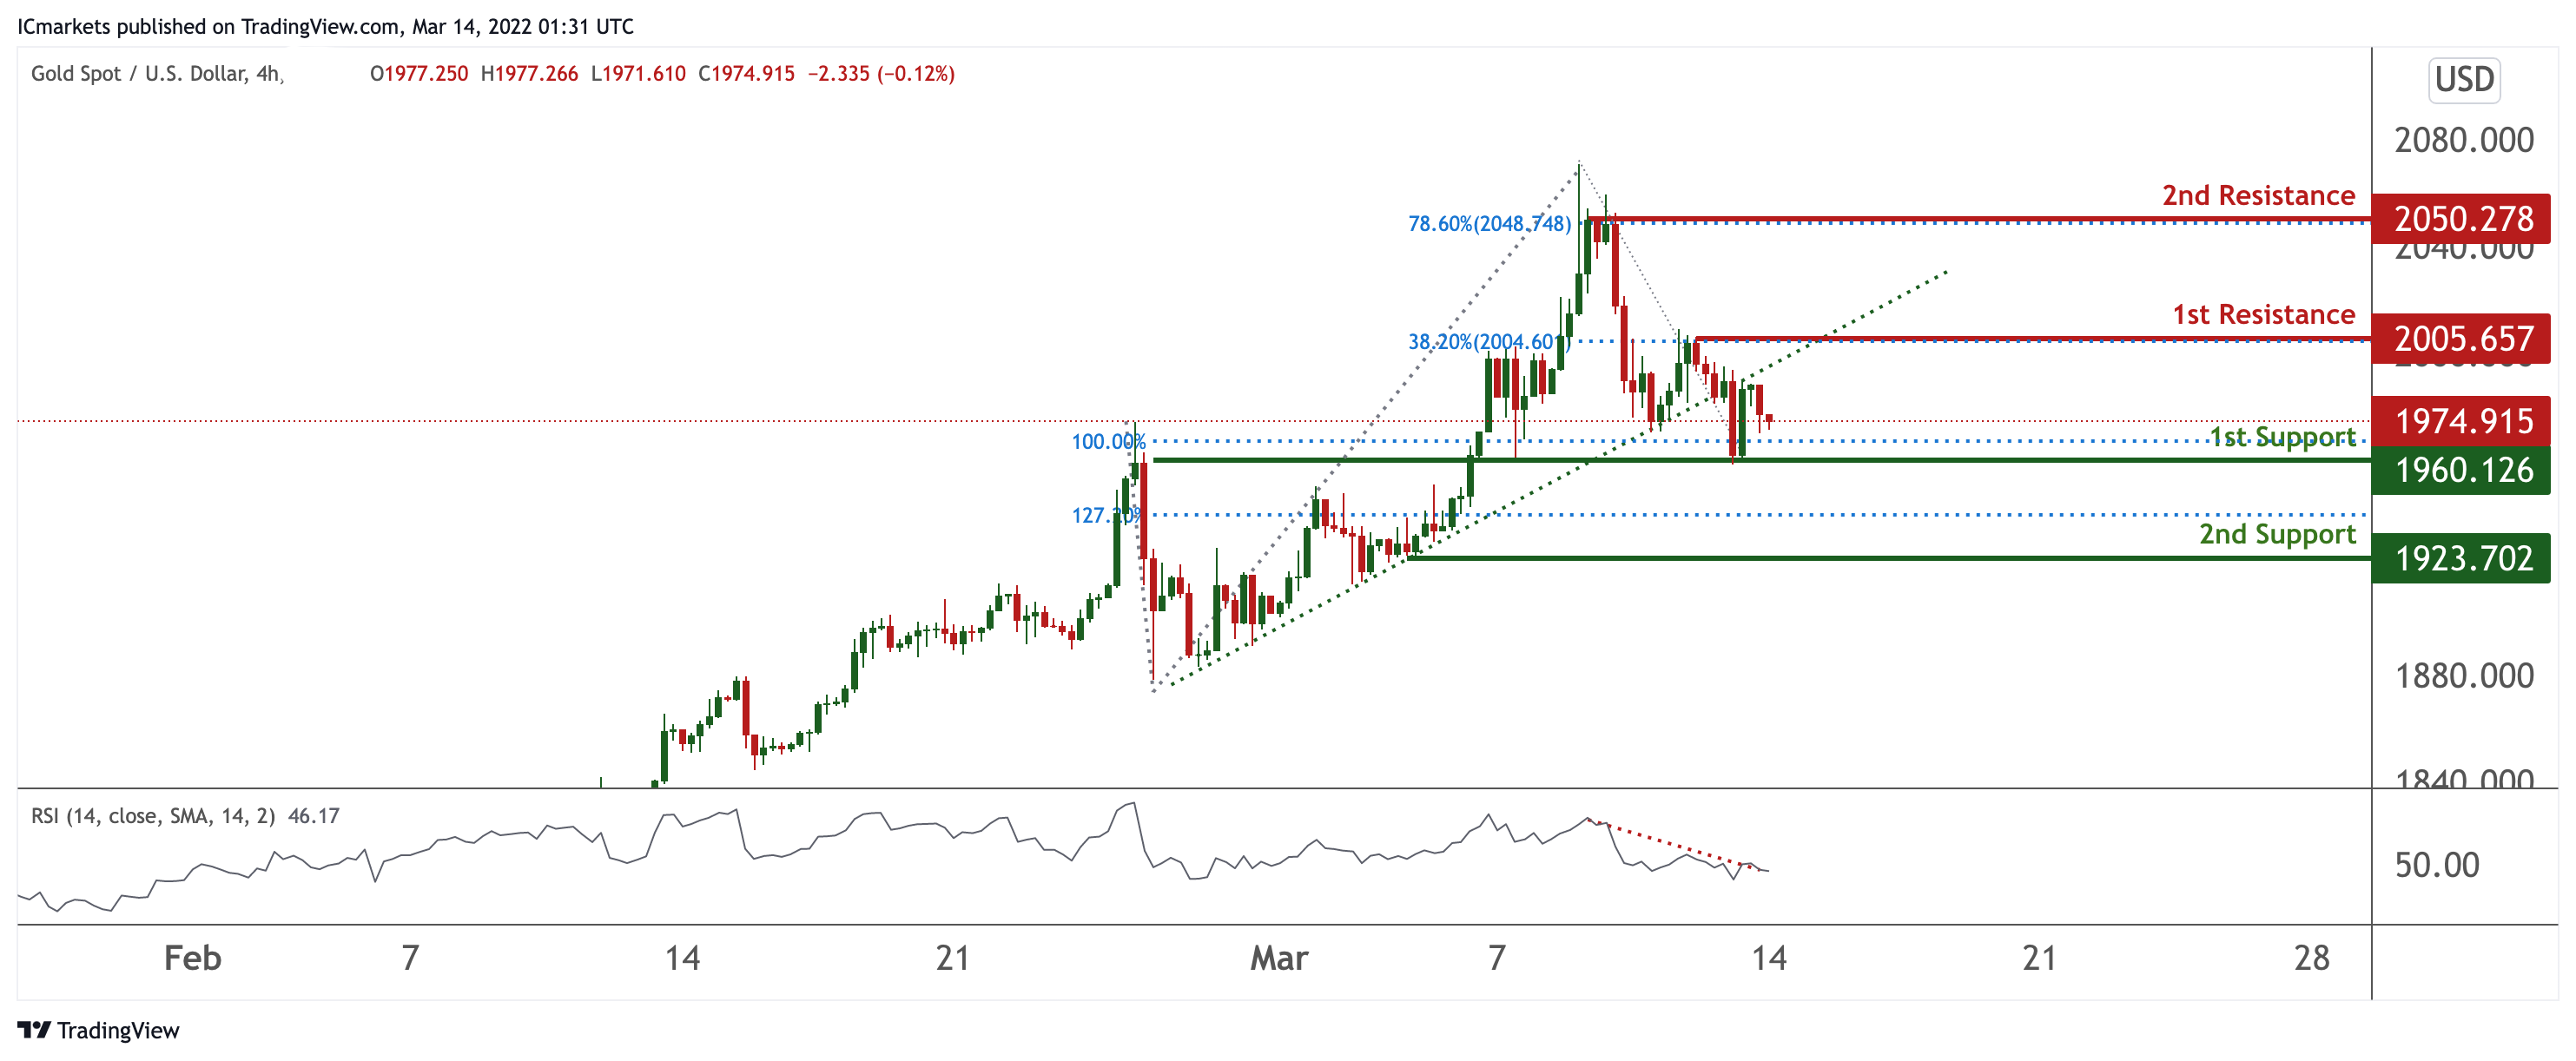
On the H4, prices have recently broken out of our ascending trendline support. We see the potential for further bearish continuation from our 1st resistance at 2005.657 in line with 38.2% Fibonacci retracement towards our 1st support at 1960.126 in line with 100% Fibonacci projection. Ichimoku is on bearish momentum, further supporting our bias.
Areas of consideration:
- 4h 1st support at 1960.126
- 4h 1st resistance at 2005.657
GBP/USD
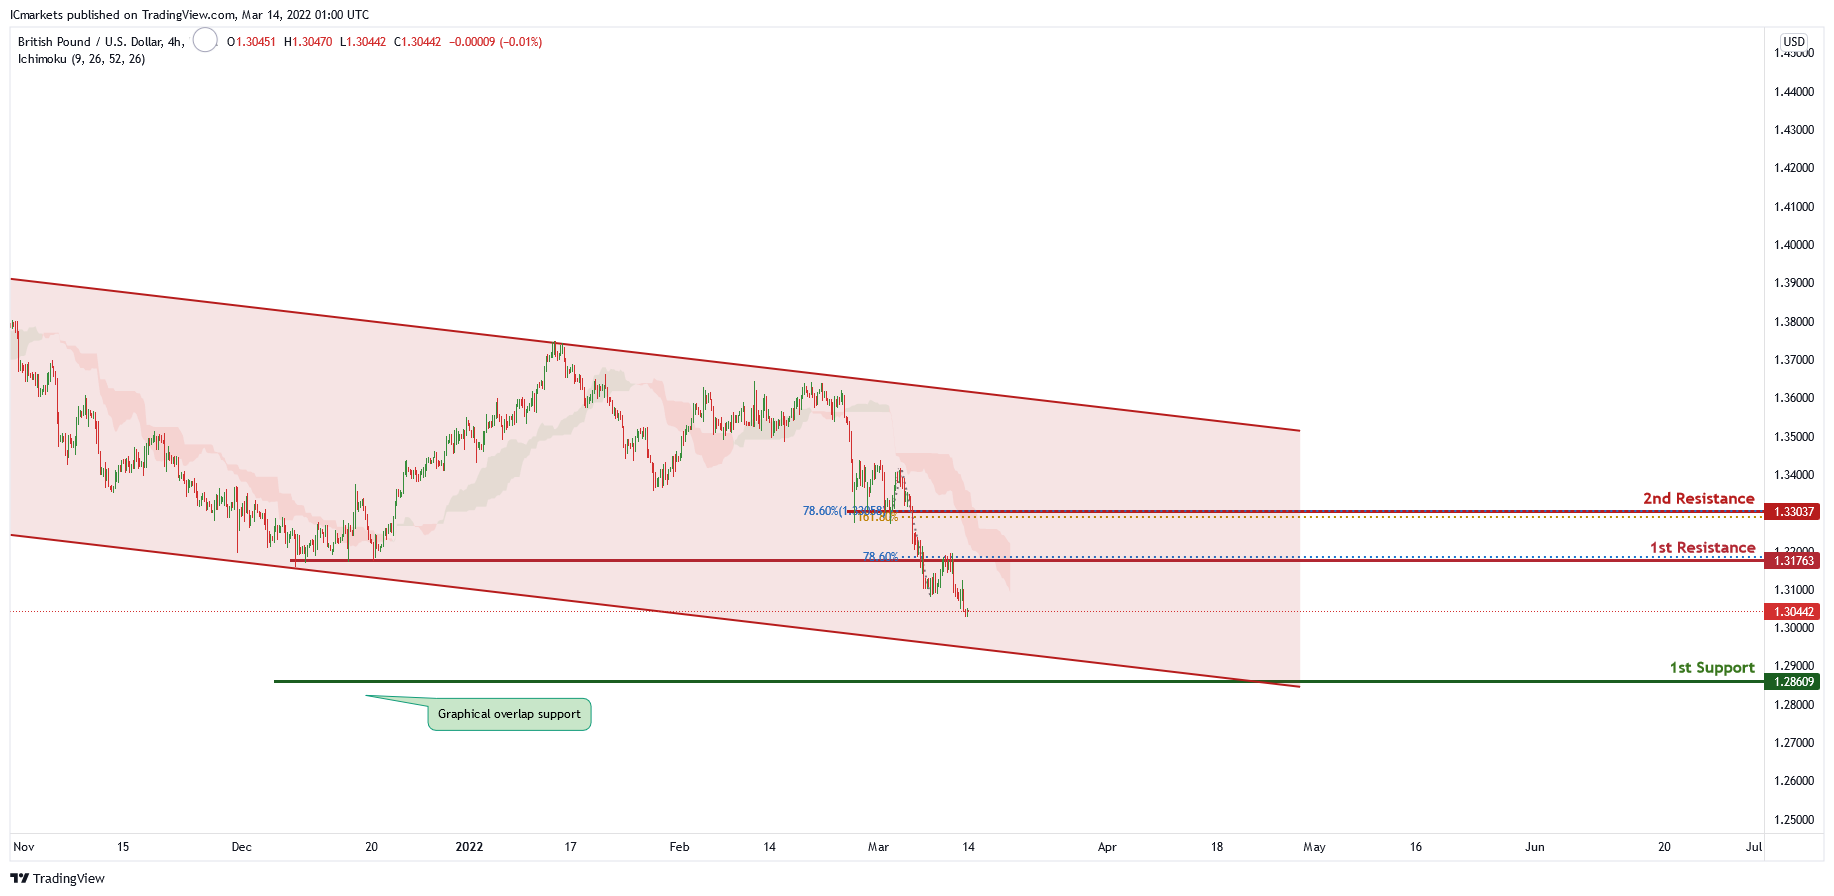
On the H4 chart price is trading in a descending channel and has recently broken the 1st resistance level of 1.31763 in line with 78.6% Fibonacci retracement. Price can potentially dip to the 1st support level of 1.28652 in line which is also the graphical overlap support. Our bearish bias is supported by the ichimoku cloud indicator as price is trading under it.
Areas of consideration
- H4 1st resistance at 1.31763
- H4 1st support at 1.28652
USD/CHF:
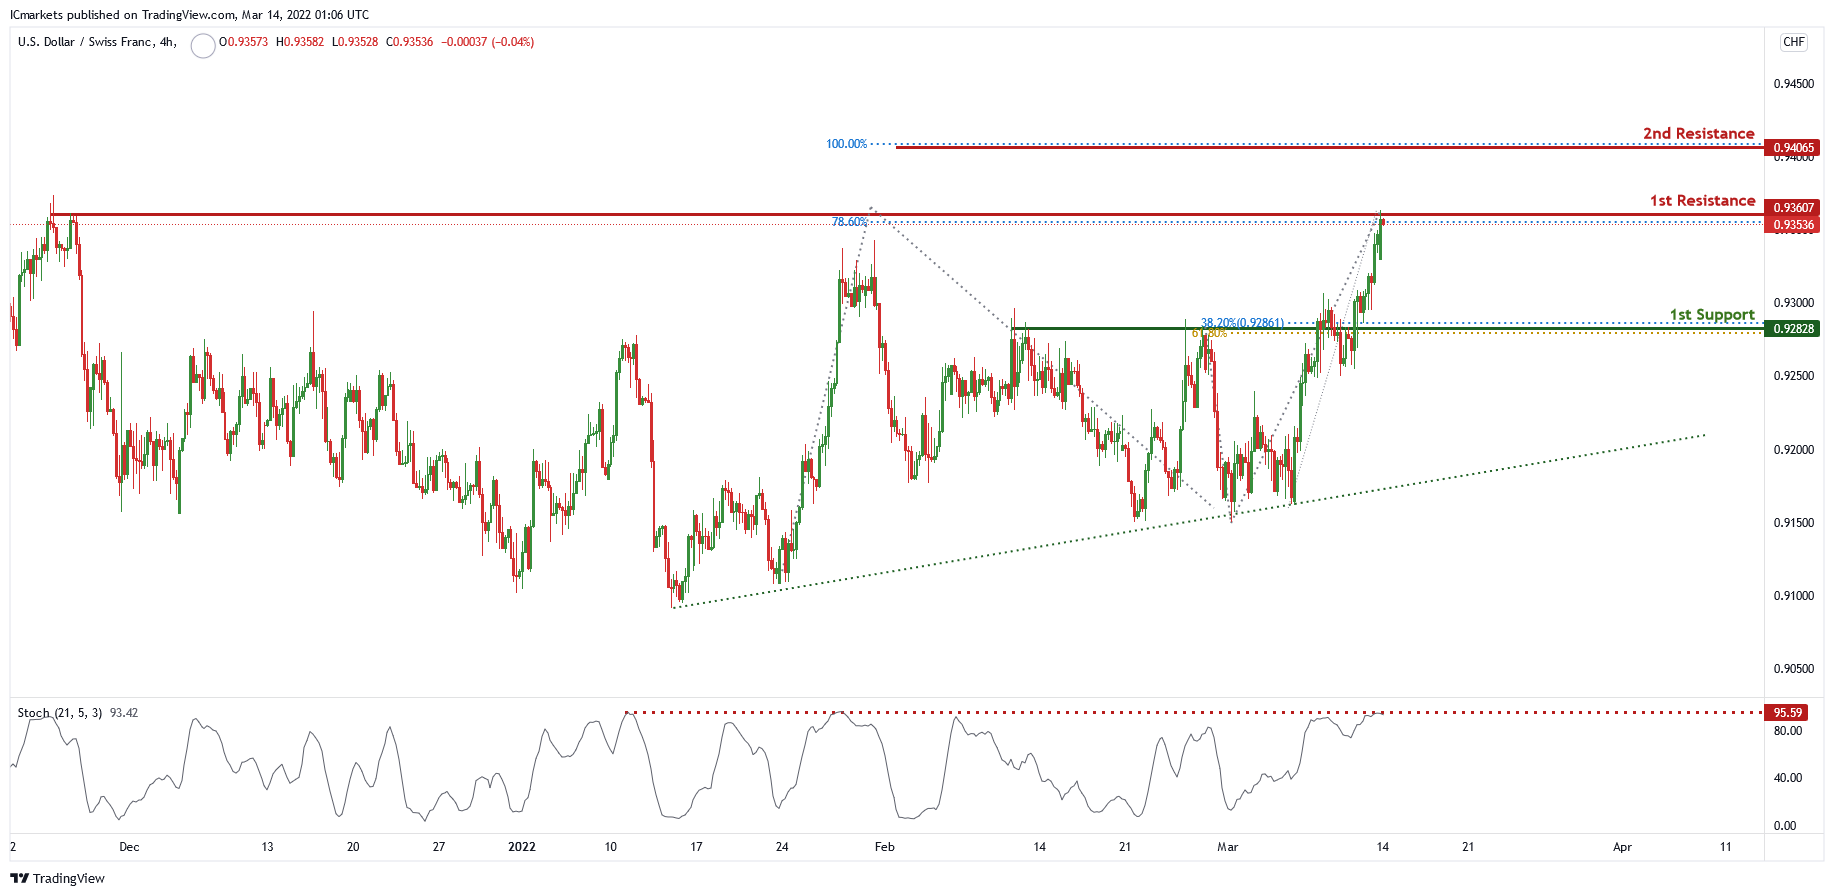
On the H4, price is abiding by an ascending trendline and near 1st resistance level of 0.93607 in line with 78.6% Fibonacci projection. Price can potentially dip to the 1st support level of 0.92828 in line with 38.2% Fibonacci retracement and 61.8% Fibonacci projection. Our bearish bias is further supported by the stochastic indicator as it is at resistance level.
Areas of consideration
- 1st support level 0.92828
- 1st resistance 0.93607
EUR/USD :
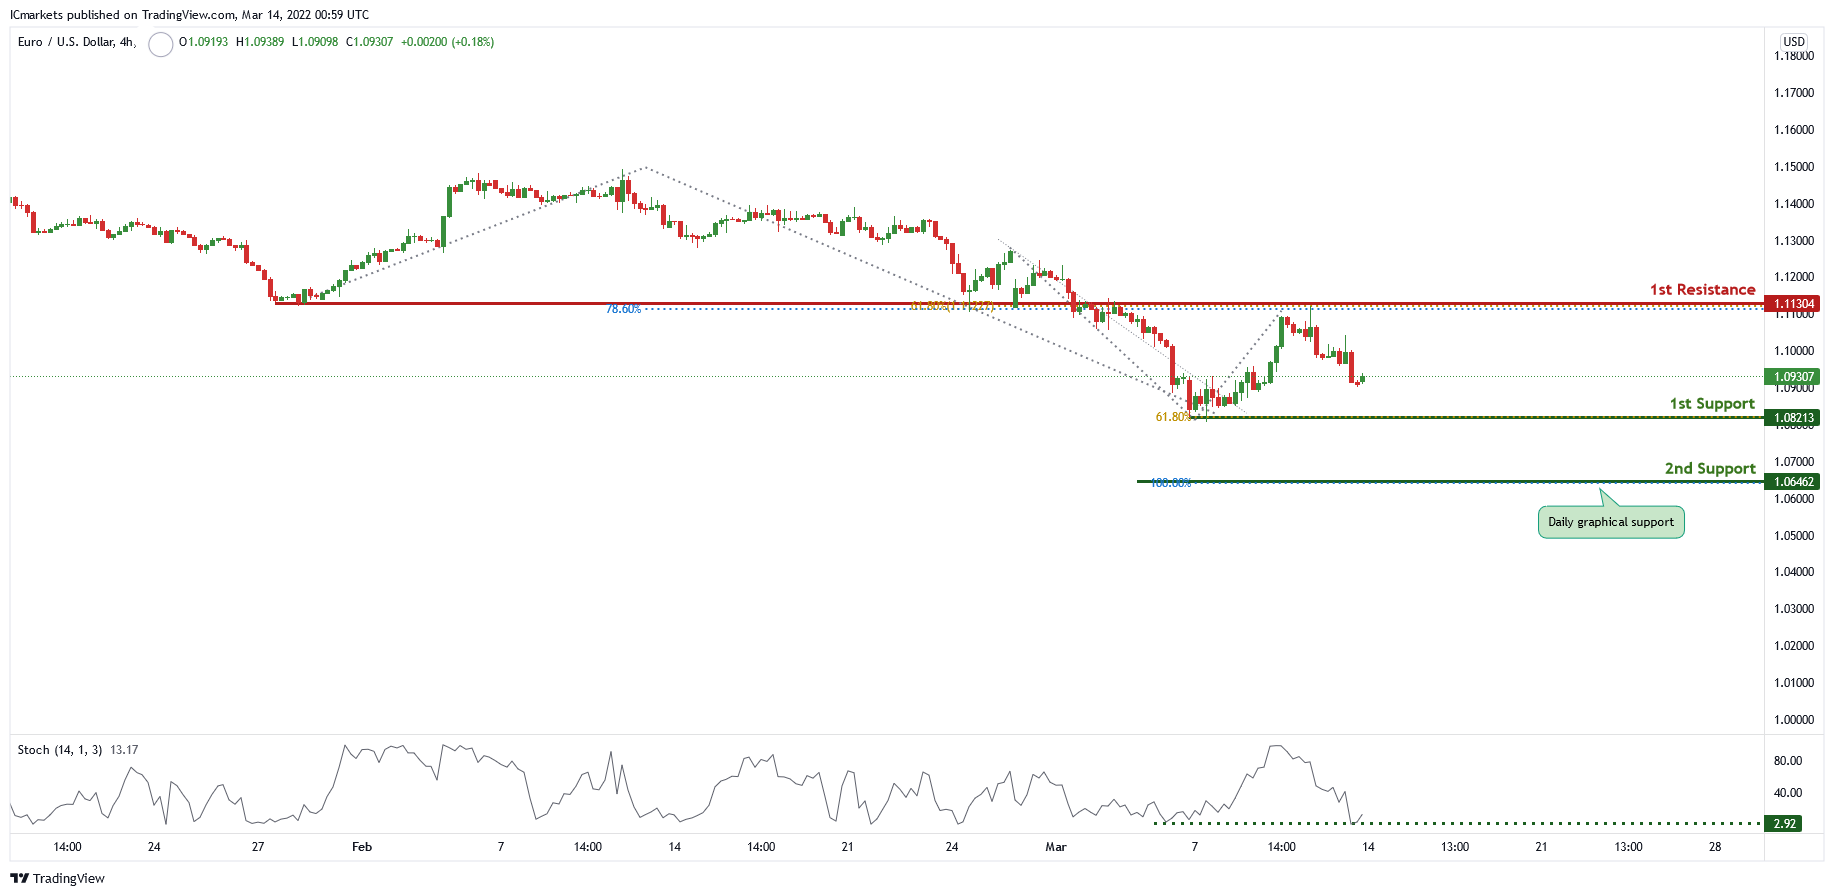
On the H4 price is near 1st resistance level of 1.11304 in line with 78.6% Fibonacci projection and 61.8% Fibonacci retracement. Price can potentially dip to the 1st support level which is the graphical swing low and 61.8% Fibonacci projection. Our bearish bias is supported by the stochastic indicator as it is the graphical swing low and 61.8% Fibonacci projection
Areas of consideration :
- H4 1st resistance at 1.11304
- H4 1st support at 1.08213
USD/JPY:
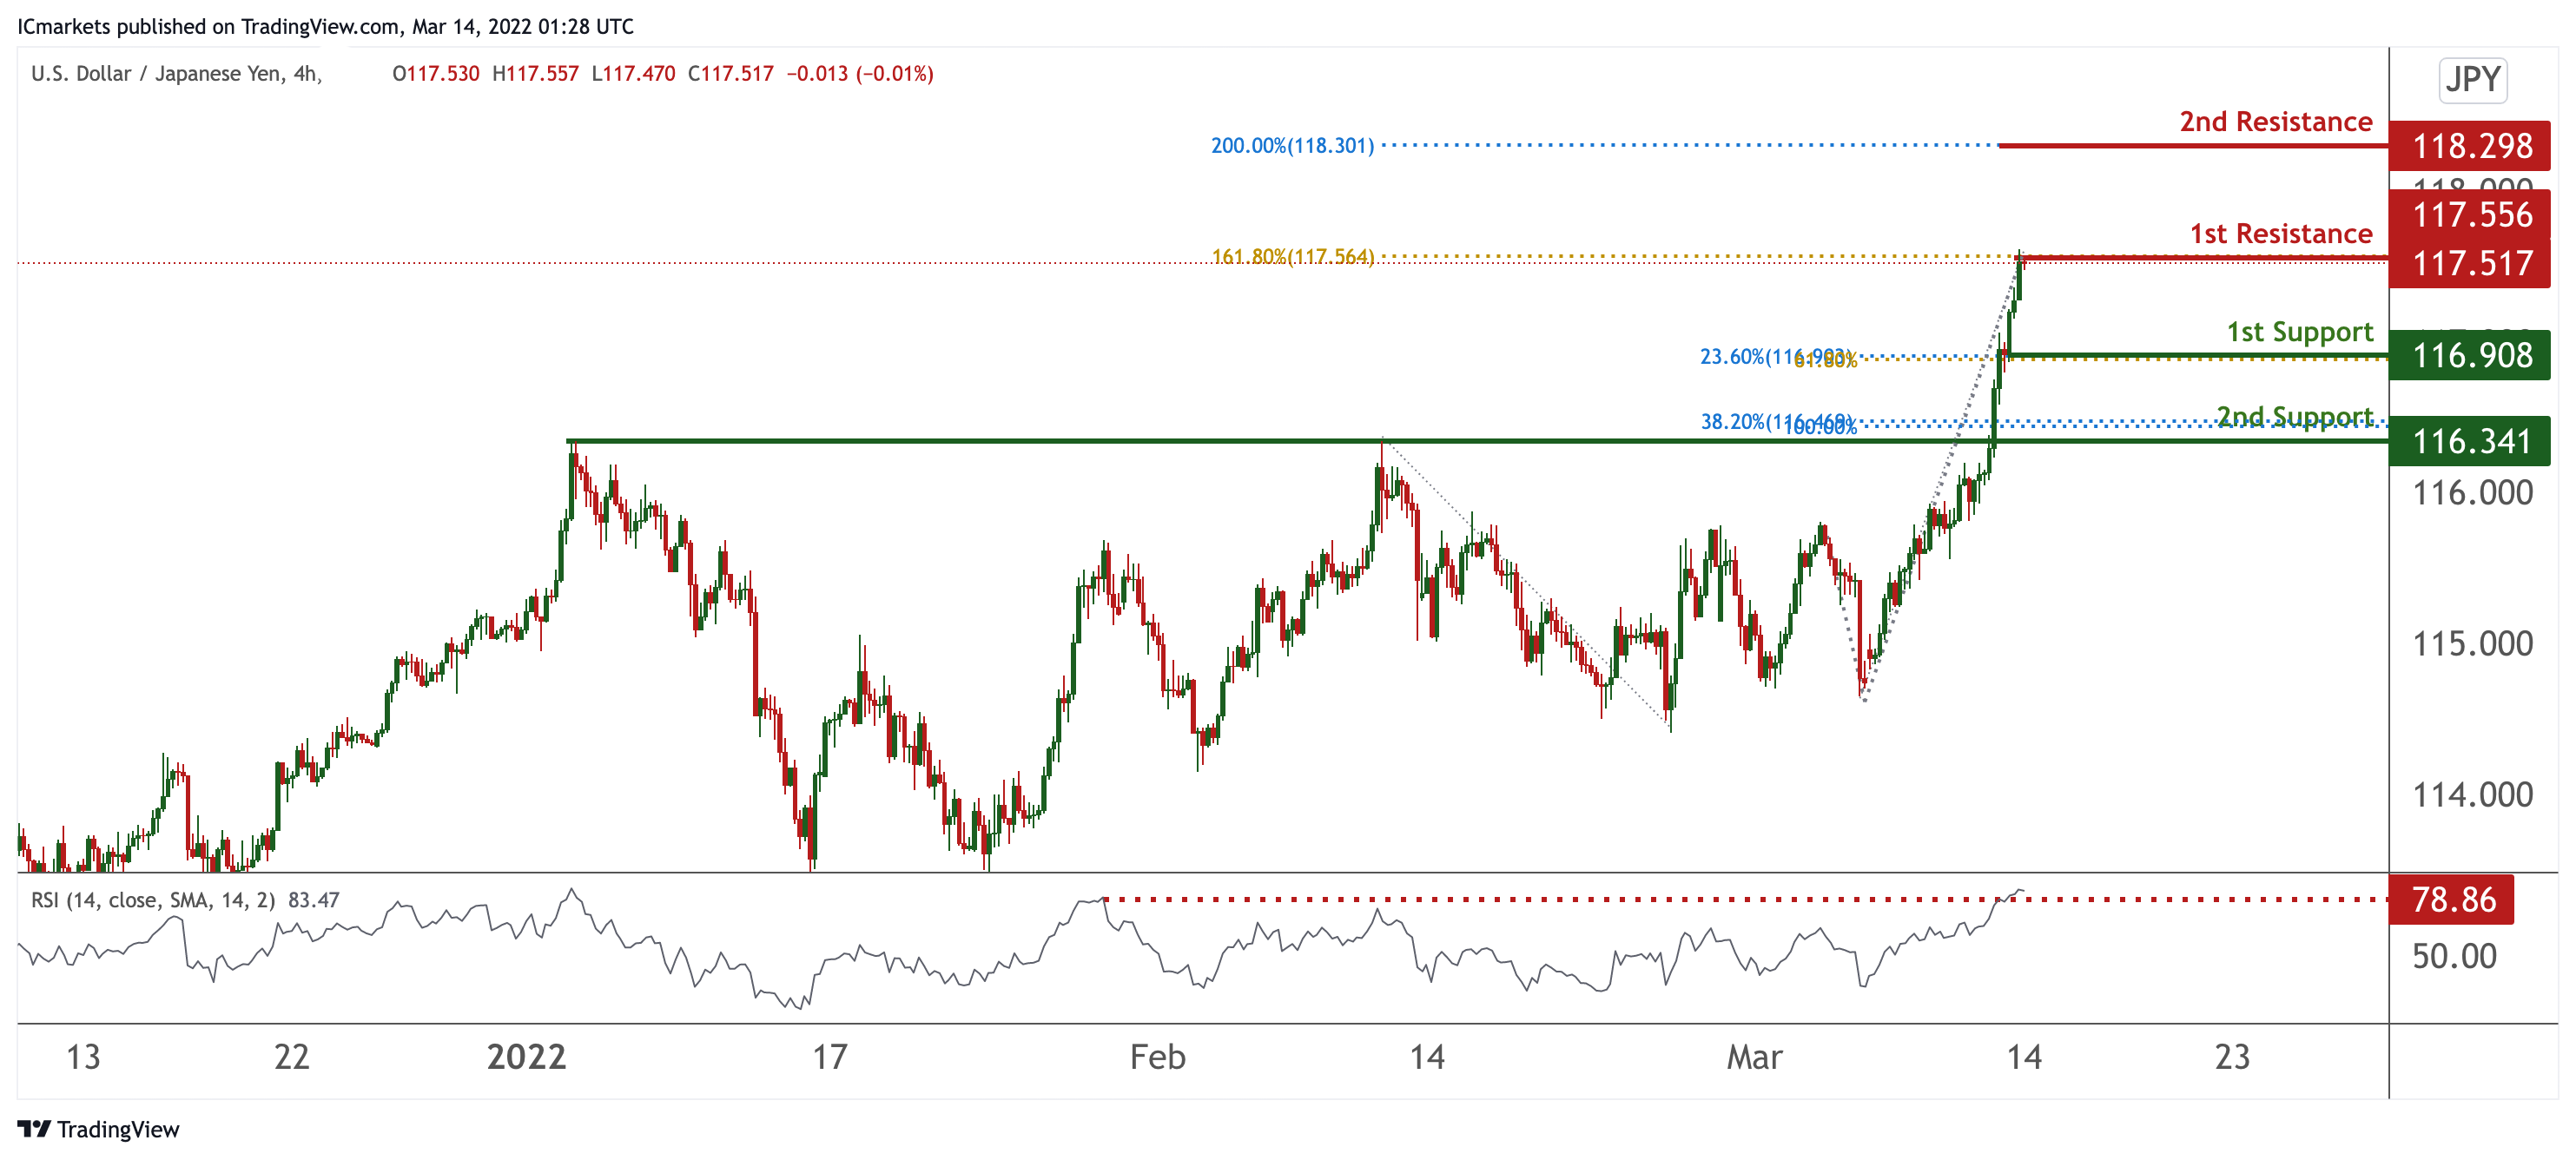
On the H4 timeframe prices are at a strong weekly resistance. We see the potential for a dip from our 1st resistance at 117.517 in line with 161.8% Fibonacci projection towards our 1st support at 116.908 in line with 23.6% Fibonacci retracement and 61.8% Fibonacci retracement. RSI is at levels where dips previously occurred, further supporting our bias of a pullback.
Areas of consideration:
- H4 time frame, 1st resistance at 117.517
- H4 time frame, 1st support at 116.908
AUD/USD:
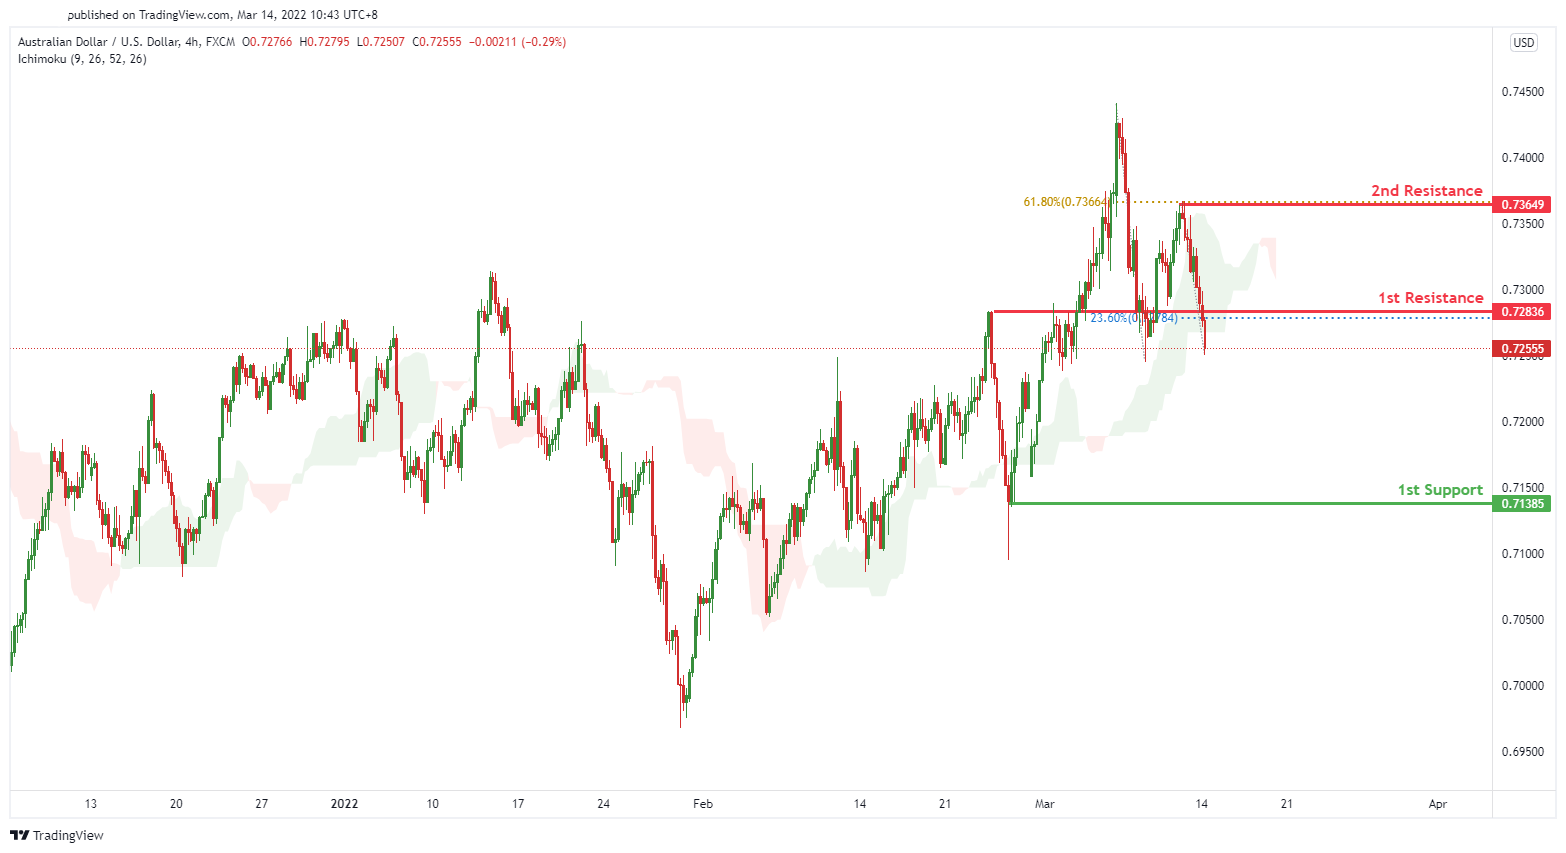
On the H4 chart, price is near the 1st resistance level of 0.72933 in line with 50% Fibonacci retracement and 100% Fibonacci projection. Price can potentially dip to the 1st support level of 0.69737 with a graphical swing low. Our bearish bias is further supported by the stochastic indicator whereby it is at support level.
Areas of consideration
- H4 1st resistance at 0.72933
- H4 1st support at 0.69737
NZD/USD:
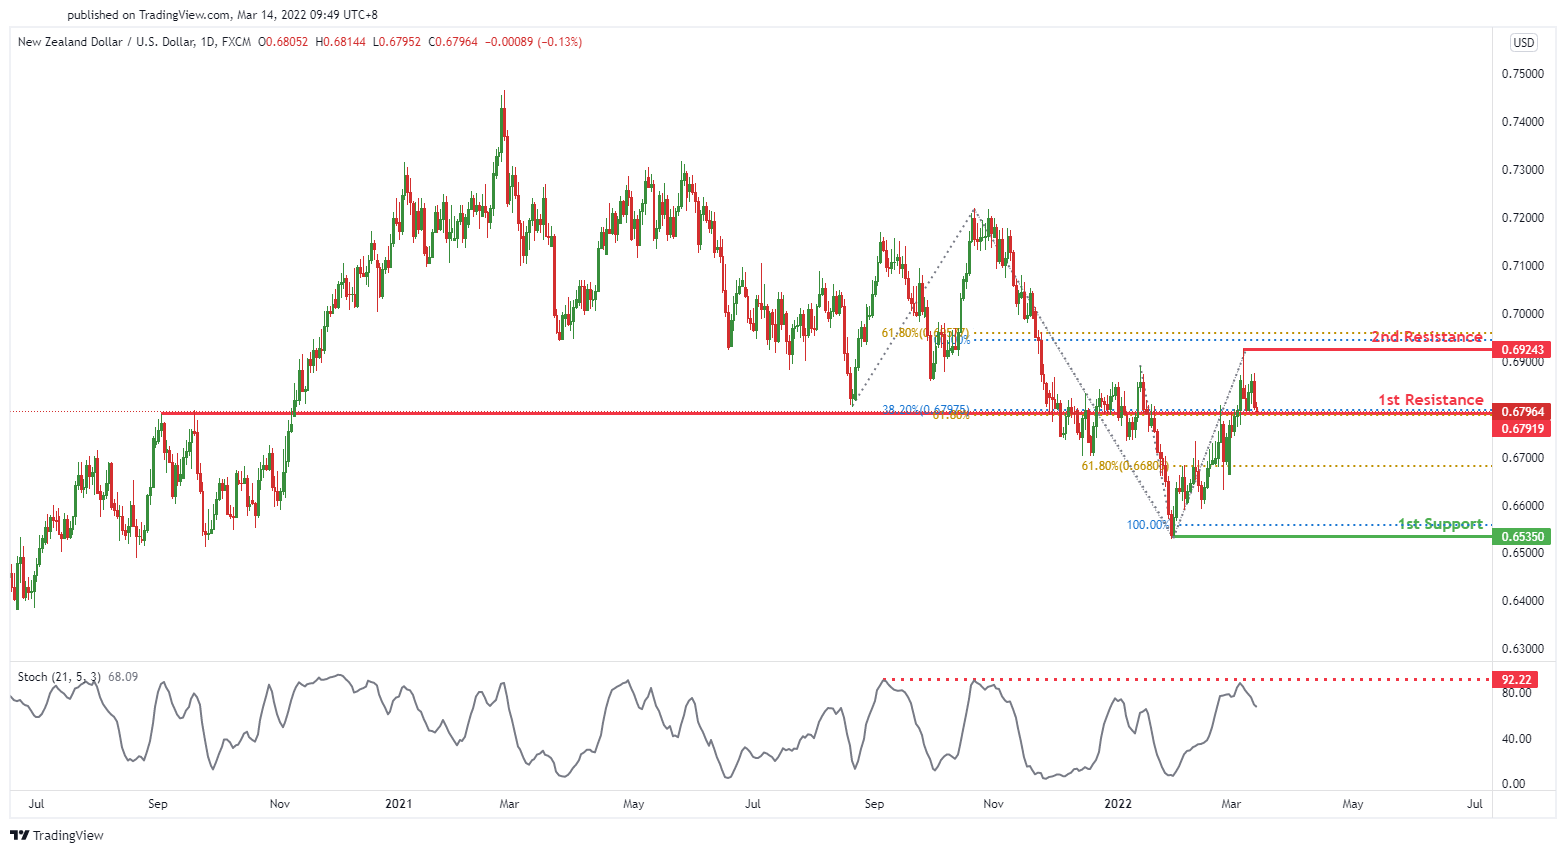
On the H4 price is near 1st resistance level of 0.67919 in line with 38.2% Fibonacci retracement. Price can potentially dip to the 1st support level at 0.65350 in line with 100% Fibonacci projection, which is also a graphical swing low. Our bearish bias is further supported by the RSI indicator as it is at resistance level.
Areas of consideration :
- H4 1st resistance at 0.67919
- H4 1st support at 0.65350
USD/CAD:
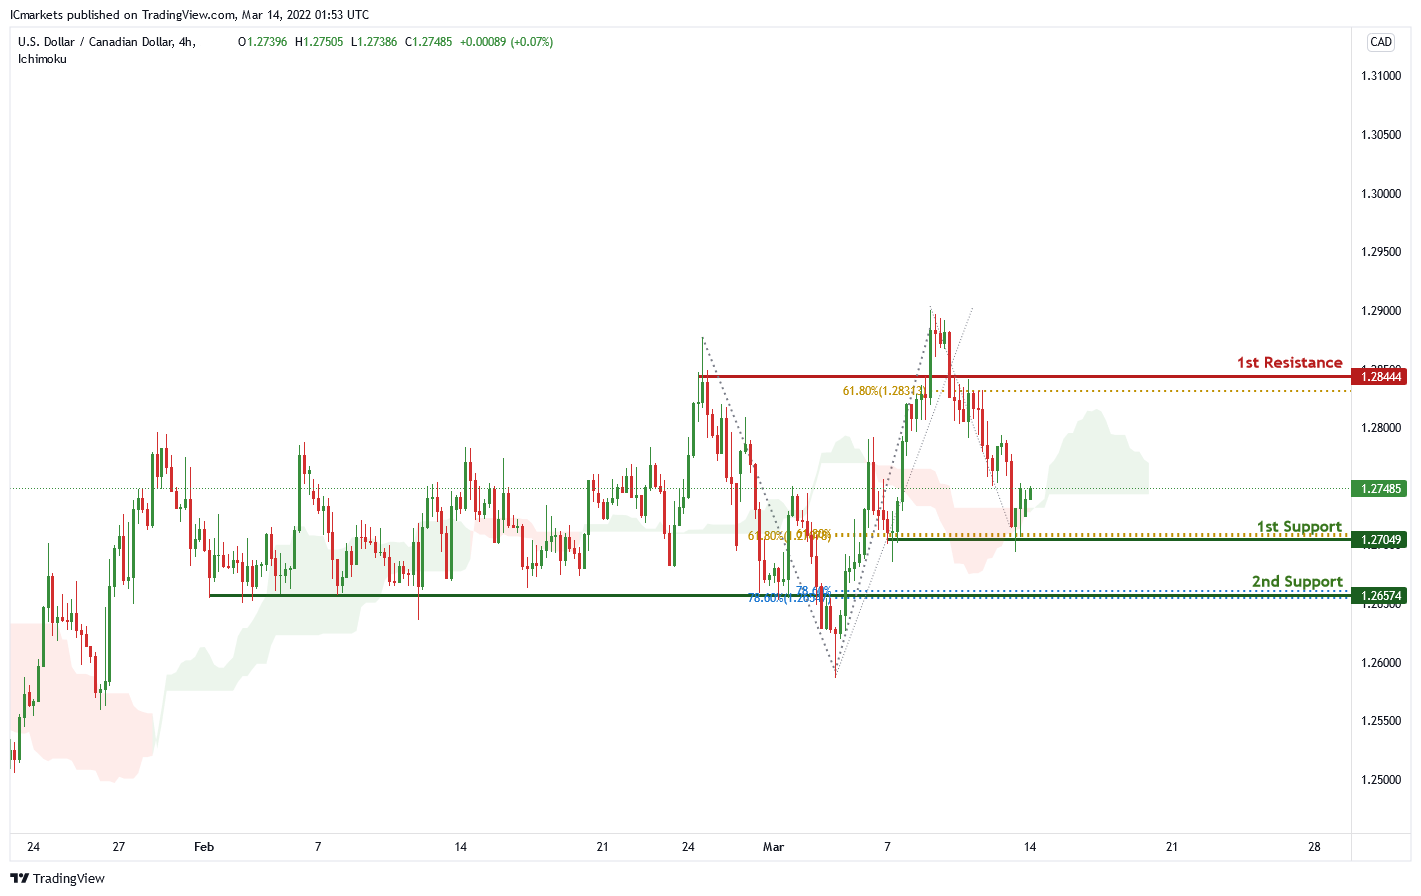
On the H4 chart , price is near 1st support level of 1.27049 in line with 61.8% Fibonacci retracement and 61.8% Fibonacci projection. Price can potentially go to the 1st resistance level of 1.2844 in line with 61.8% Fibonacci projection. Our bullish bias is supported by the ichimoku cloud indicator.
Areas of consideration:
- H4 time frame, 1st support at 1.27049
- H4 time frame, 1st resistance at 1.28444
OIL:
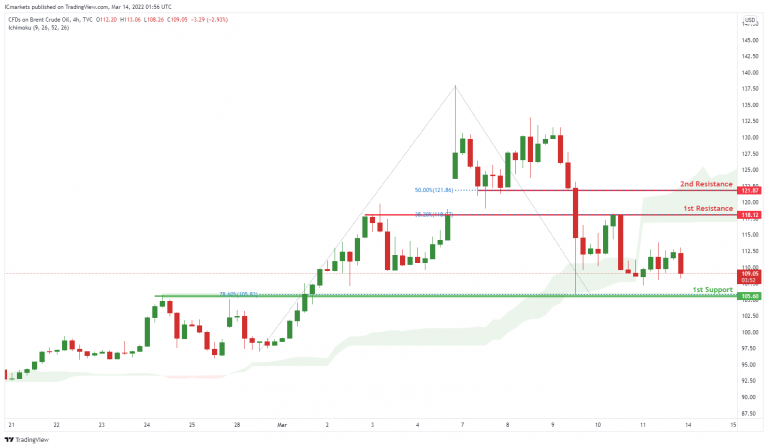
On the H4, with price moving below the ichimoku cloud, we have a bias that price will drop from 1st resistance at 118.12 in line with the 38.2% Fibonacci retracement to 1st support at 105.60 in line with the swing low support .Alternatively, price may break pivot structure and head for 2nd support at 121.87 in line with the 50% Fibonacci retracement.
Areas of consideration:
- H4 time frame, 1st resistance of 118.12
- H4 time frame, 1st support of 105.60
Dow Jones Industrial Average:
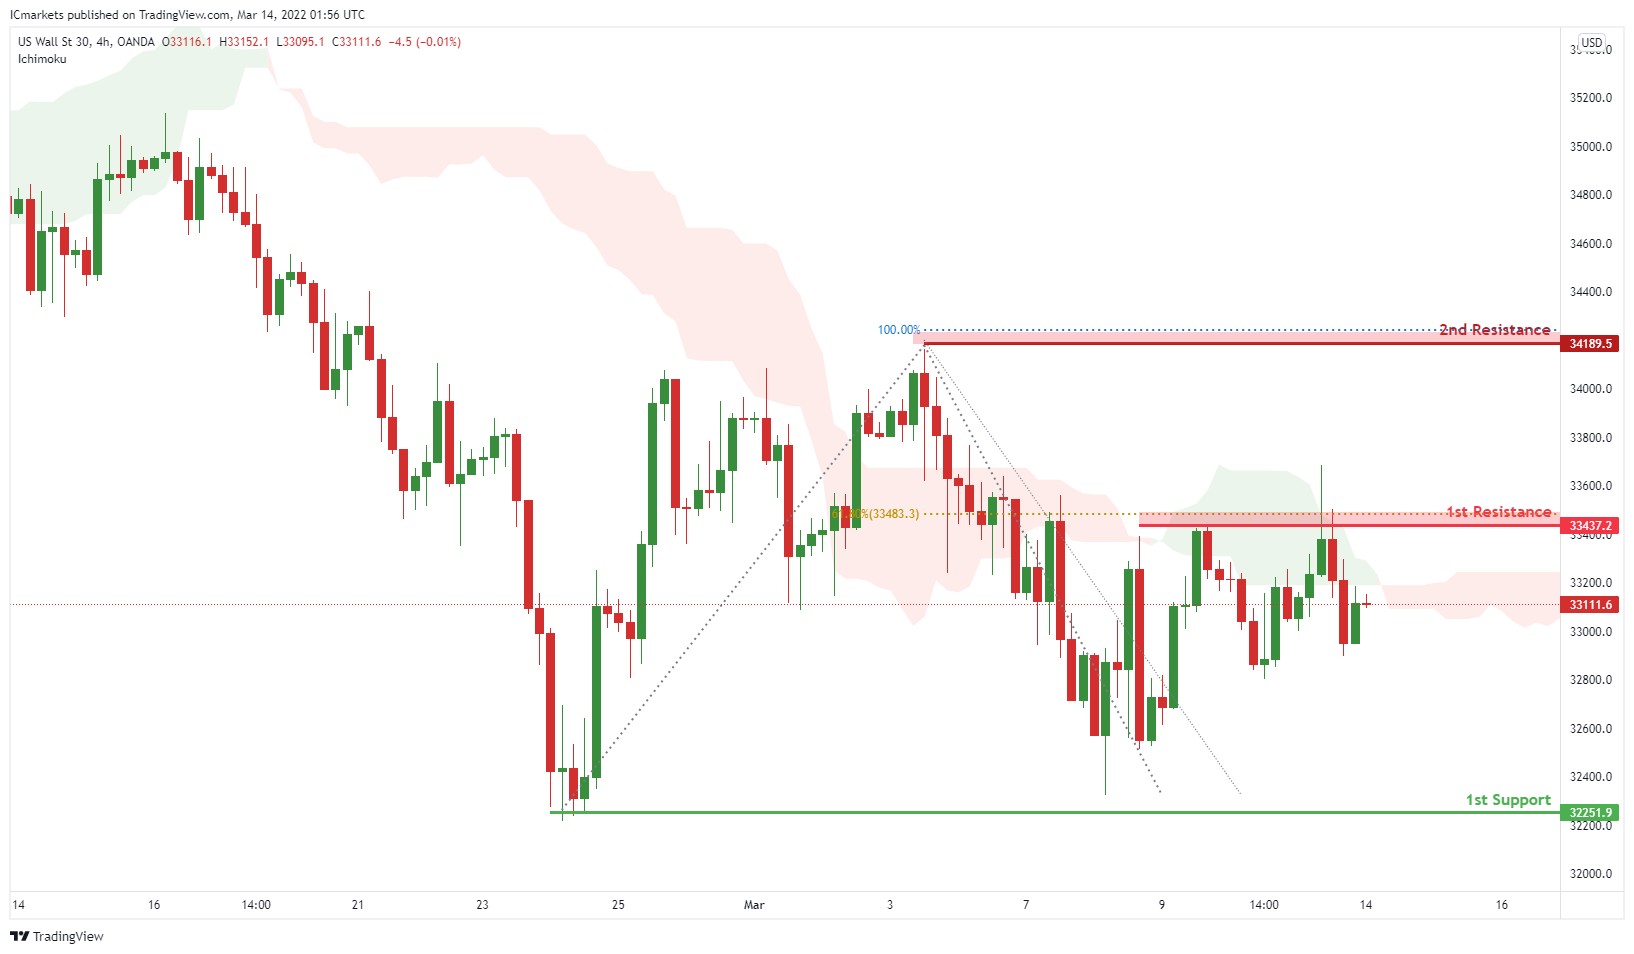
On the H4, with price moving below the ichimoku cloud, we have a bias that price will drop from 1st resistance at 33437 in line with the 61.8% Fibonacci retracement to 1st support at 32251 in line with the swing low support .Alternatively, price may break pivot structure and head for 2nd support at 34189 in line with the 100% Fibonacci projection.
Areas of consideration :
- H4 1st support at 32251
- H4 1st resistance at 33437