Sample Category Title
USD/JPY Mid-Day Outlook
Daily Pivots: (S1) 116.48; (P) 116.92; (R1) 117.73; More...
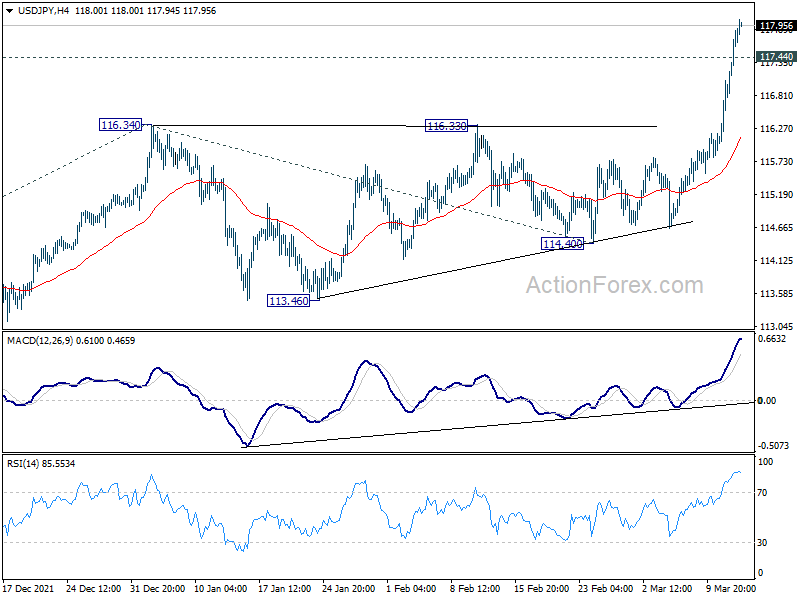
Intraday bias in USD/JPY remains on the upside for the moment. Current up trend from 102.58 should target 118.65 long term resistance next. Firm break there will target 100% projection of 109.11 to 116.34 from 114.40 at 121.63. On the downside, below 117.44 minor support will turn intraday bias neutral and bring consolidation first. But retreat should be contained by 116.34 resistance turned support to bring another rally.
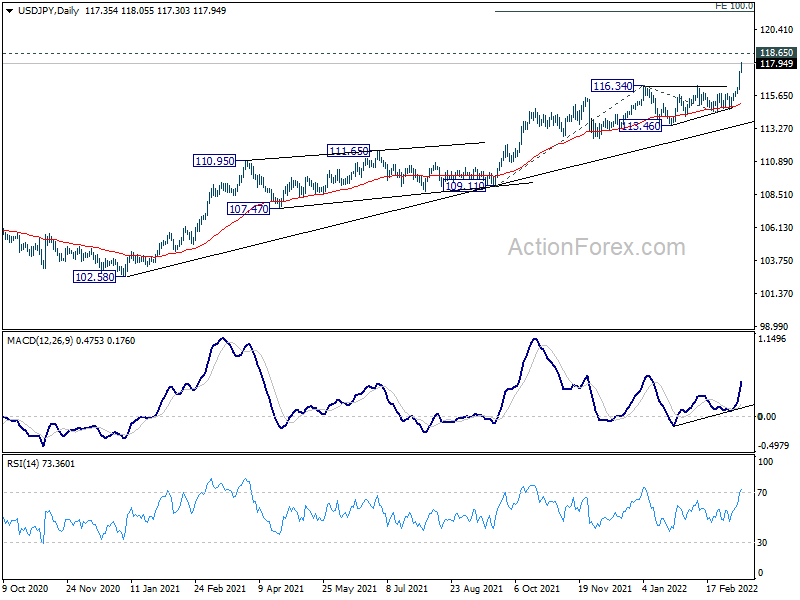
In the bigger picture, no change in the view that rise from 102.58 is the third leg of the up trend from 101.18 (2020 low). Such rally should target a test on 118.65 (2016 high). Sustained break there will pave the way to 125.85 (2015 high) and raise the chance of long term up trend resumption. This will remain the favored case as long as 113.46 support holds.
USD/CHF Mid-Day Outlook
Daily Pivots: (S1) 0.9310; (P) 0.9330; (R1) 0.9369; More....
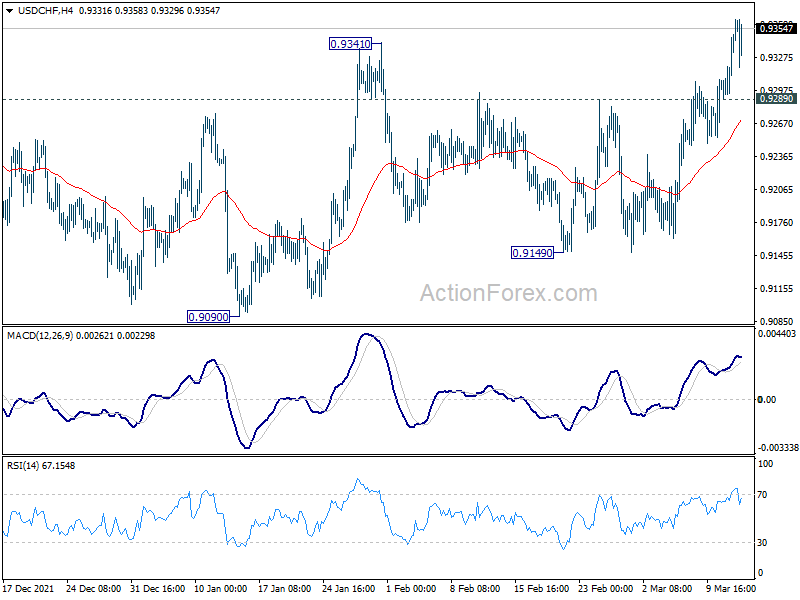
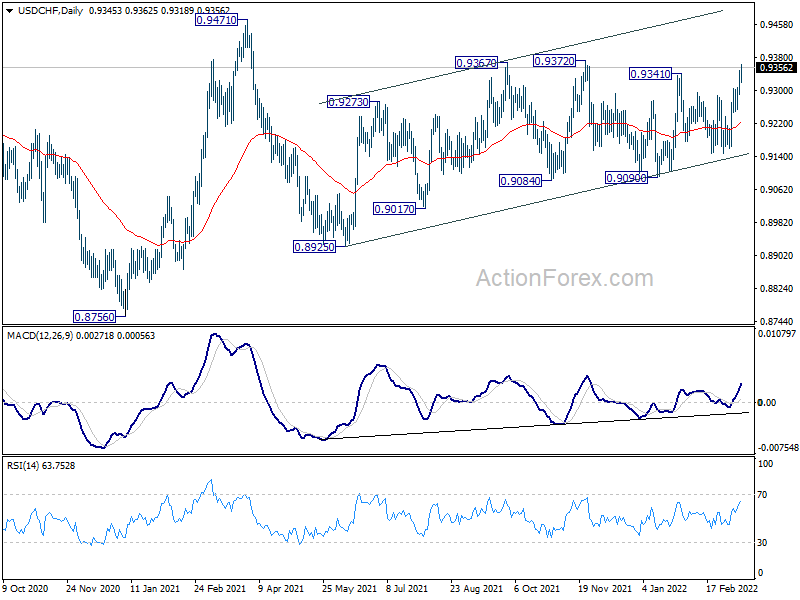
Intraday bias in USD/CHF stays on the upside for 0.9372 resistance. Choppy rise from 0.8925 might be ready to resume. Break will target 0.9371. However, on the downside, break of 0.9289 will turn intraday bias neutral again.
In the bigger picture, medium term outlook will be neutral at best as long as 0.9471 resistance holds. Larger down trend could still extend through 0.8756 (2021 low). However, firm break of 0.9471 will argue that the trend has already reversed and rebound the rally from 0.8756 with another impulsive move.
GBP/USD Mid-Day Outlook
Daily Pivots: (S1) 1.3004; (P) 1.3064; (R1) 1.3101; More...
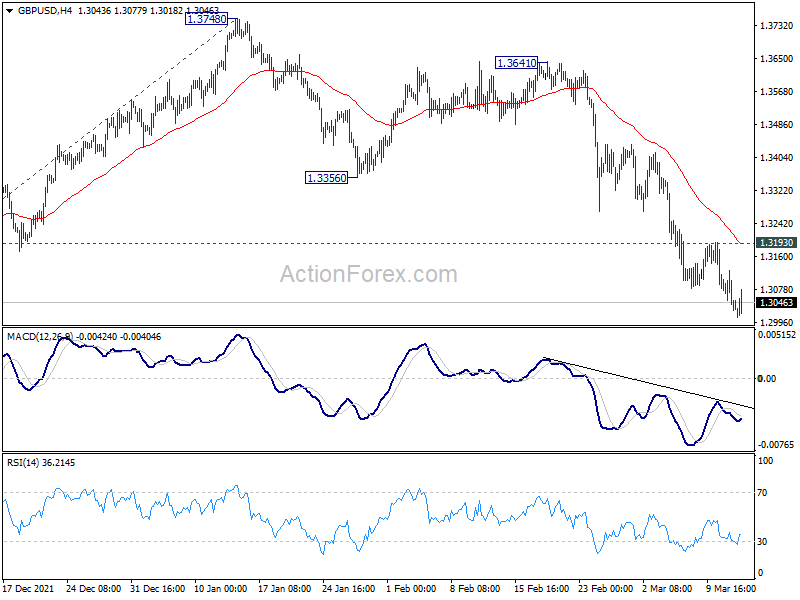
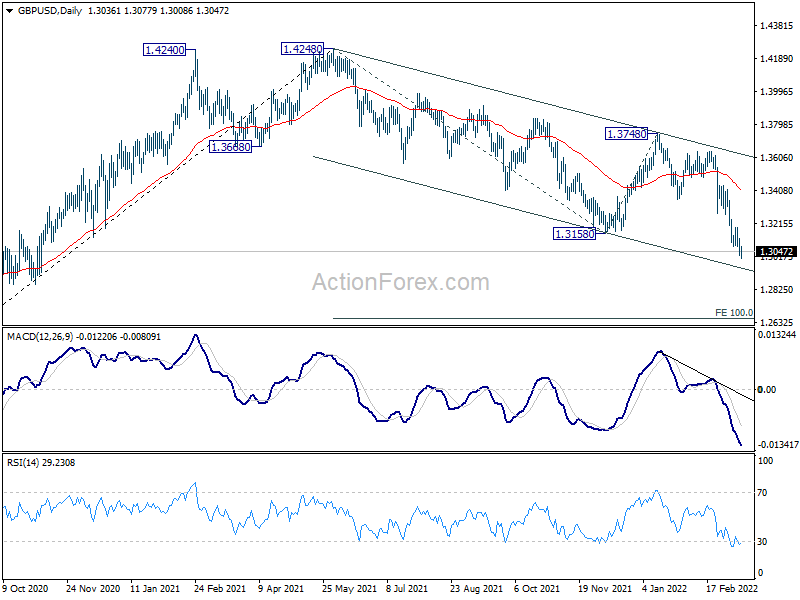
GBP/USD's decline is still in progress and intraday bias remains on the downside. Current down trend from 1.4248 should target 100% projection of 1.4248 to 1.3158 from 1.3748 at 1.2658 next. On the upside, break of 1.3193 resistance is needed to indicate short term bottoming. Otherwise, outlook will stay bearish in case of recovery.
In the bigger picture, current development suggests that the up trend from 1.1409 (2020 low) has completed at 1.4248. Decline from 1.4248 could still be a corrective move, or it could be the start of a long term down trend. In either case, deeper decline would be seen back to 61.8% retracement of 2.1161 to 1.1409 at 1.2493. In any case, break of 1.3748 resistance is needed to indicate medium term bottoming, or outlook will stay bearish.
EUR/USD Mid-Day Outlook
Daily Pivots: (S1) 1.0864; (P) 1.0953; (R1) 1.1005; More...
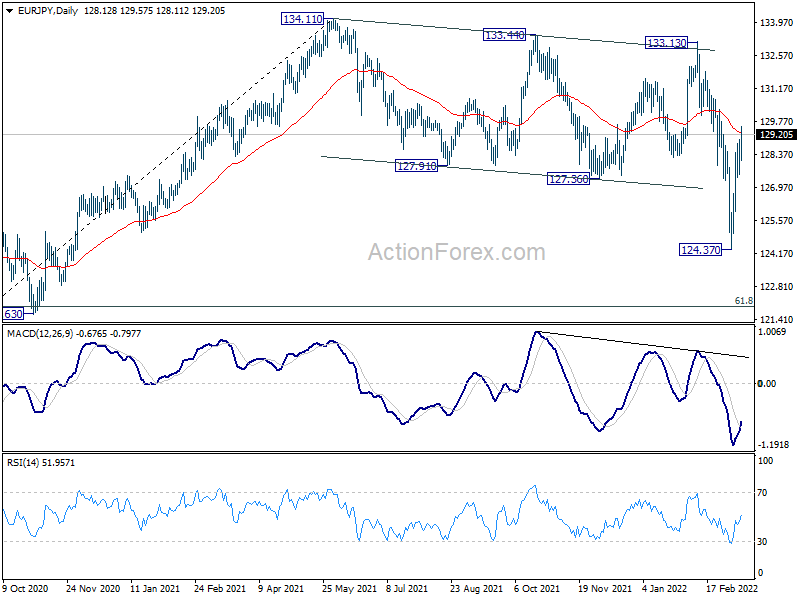
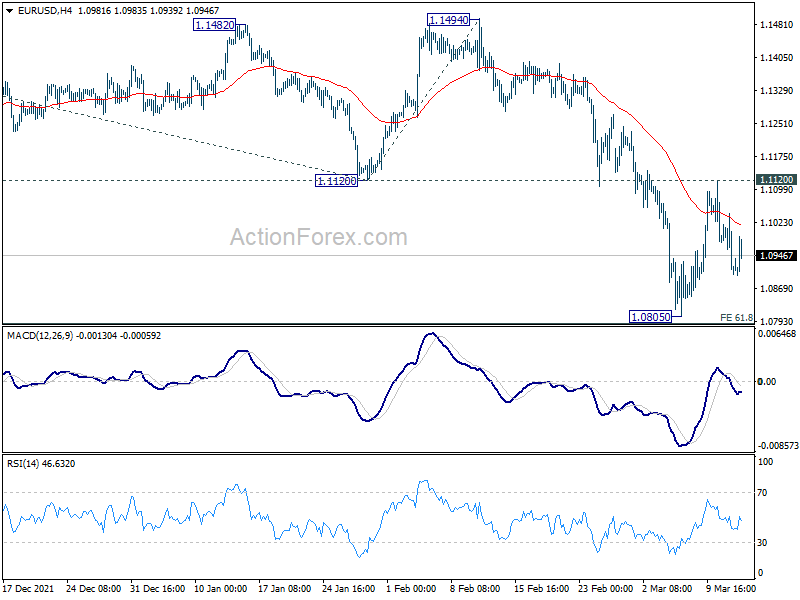
Intraday bias in EUR/USD stays neutral and outlook is unchanged. As long as 1.1120 support turned resistance holds, larger down trend from 1.1494 is still expected to continue. On the downside, firm break of 61.8% projection of 1.2265 to 1.1120 from 1.1494 at 1.0786 will pave they way to 100% projection at 1.0349 next. However, strong break of 1.1120 will confirm short term bottoming, at least, and bring stronger rebound back towards 1.1494 structural resistance instead.
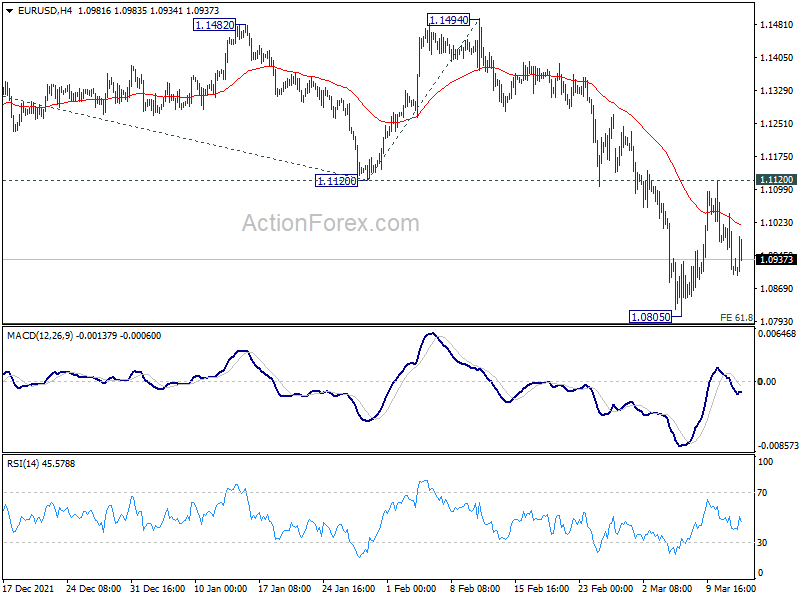
In the bigger picture, the decline from 1.2348 (2021 high) is expected to continue as long as 1.1494 resistance holds. Firm break of 1.0635 (2020 low) will raise the chance of long term down trend resumption and target a retest on 1.0339 (2017 low) next. Nevertheless, break of 1.1494 will maintain medium term neutral outlook, and extend range trading first.
EUR/JPY Mid-Day Outlook
Daily Pivots: (S1) 127.39; (P) 128.22; (R1) 128.86; More....
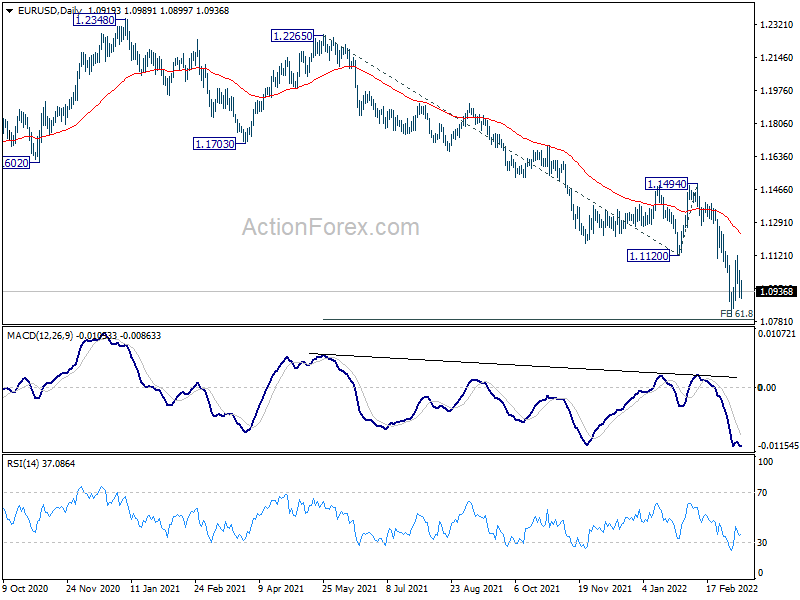
EUR/JPY's rebound from 124.37 resumed by breaking 129.01 temporary top. Intraday bias is back on the upside. Sustained trading above 55 day EMA (now at 129.30) will argue that correction from 134.11 has completed, and bring stronger rally to retest this high. On the downside, though, below 127.40 minor support will turn bias back to the downside for 124.37 support instead.
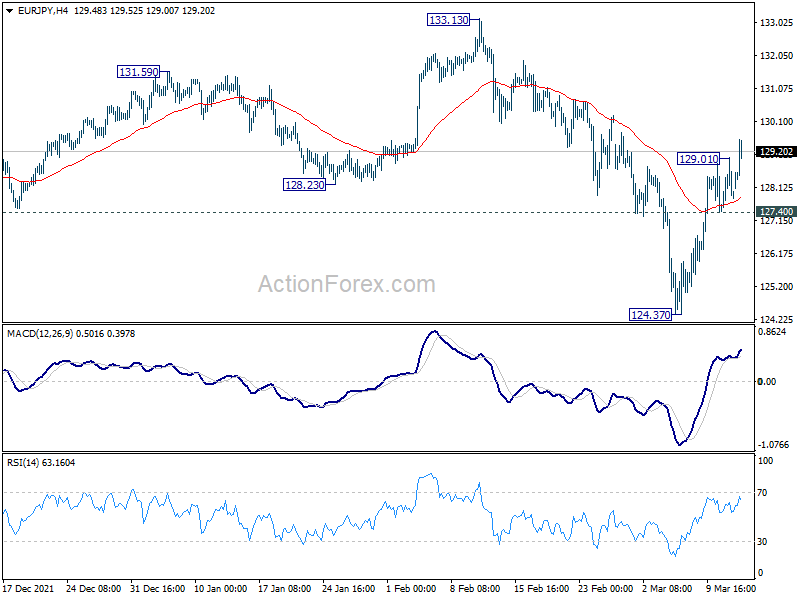
In the bigger picture, outlook is neutral at best for now until there is clear sign of up trend resumption. Corrective pattern from 134.11 could still extend further, sideway or downward. Break of 124.37 will target 61.8% retracement of 114.42 to 134.11 at 121.94.
Euro Recovering as Ukraine Holds Another Talk With Russia
European stocks are recovering mildly as Ukraine is going to have another round of talks. But overall sentiment is vulnerable is Russia continues massive shelling and there is no sign of a real stop in its invasion. In the currency markets, Yen's broad based decline continues today, but Aussie is the weakest, partly weighed down by the weakness in Chinese stock markets. Euro is currently the strongest one, followed by Sterling and then Dollar.
Technically, EUR/JPY resumed the rebound from 124.37 after brief retreat. That's a positive sign for Euro. But still, EUR/USD has to firmly take out 1.1120 support turned resistance to confirm short term bottoming. Otherwise, the larger down trend is still in favor to resume through 1.0805 at a later stage. That would keep rebound in Euro elsewhere capped.
In Europe, at the time of writing, FTSE is up 0.22%. DAX is up 2.25%. CAC is up 1.59%. Germany 10-year yield is up 0.947 at 0.345. Earlier in Asia, Nikkei rose 0.59%. Hong Kong HSI dropped -4.97%. China Shanghai SSE dropped -2.60%. Singapore Strait Times dropped -0.54%. Japan 10-year JGB yield rose 0.0113 to 0.195.
Swiss SECO cuts 2022 growth forecast, direct impact of Ukraine conflict on Switzerland limited
Swiss SECO export growth lowered 2022 GDP growth forecast from 3.0% to 2.8%. It said, "higher inflation and the Ukraine conflict are slowing the pace of recovery." It added, "the war in Ukraine poses major risks for the global economy." For 2023, growth projection is kept unchanged at 2.0%.
Recent appreciation of the Swiss Franc is " helping to contain price pressures within Switzerland, but higher inflation rates are still to be expected on the domestic front." 2022 inflation forecasts was raised sharply from 1.1% to 1.9, then slowed to 0.7% in 2023. .
SECO said: "The direct impact of the Ukraine conflict on Switzerland is likely to be limited, given the relatively low level of economic ties with Russia and Ukraine. Nonetheless, significant indirect effects are to be expected. World prices of key exports from Russia and Ukraine – energy resources as well as certain food staples and industrial metals – have soared. Global inflationary pressures will therefore remain high for now. "
China Shanghai SSE plunged on fresh pandemic lockdown
Chinese stocks plunged notably today on worries that continued surge of coronavirus cases would impose downside risks to the economy, at least for the near term.
More local symptomatic cases are reported so far this year than the whole of 2021. The even bigger question is on the vulnerability of people there against Omicron, as they're given locally development vaccine by the government only. Import of common vaccines like Astrazeneca and Pfizer Biontech are banned.
Massive lockdown is imposed in the southern technology hub of Shenzhen, including suspension of public transports start today. Meanwhile, the financial hub of Shanghai is also locking down some housing and office complexes.
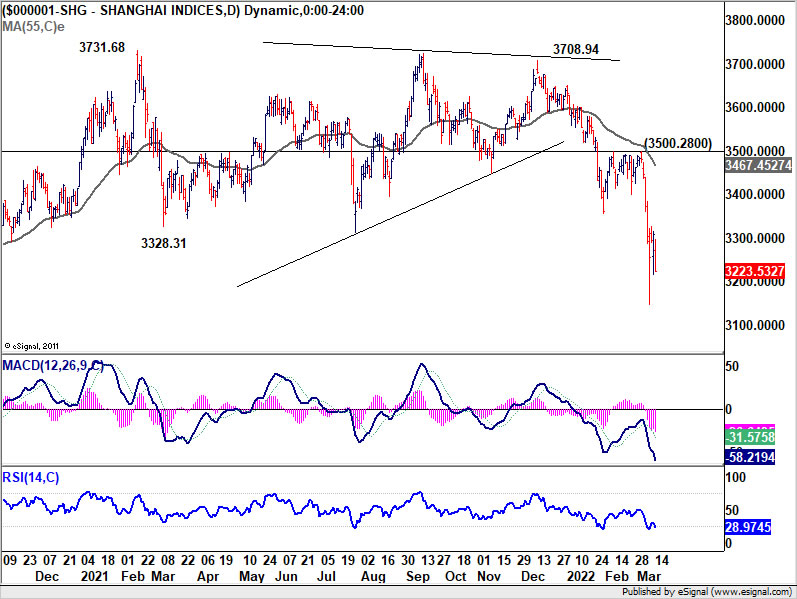
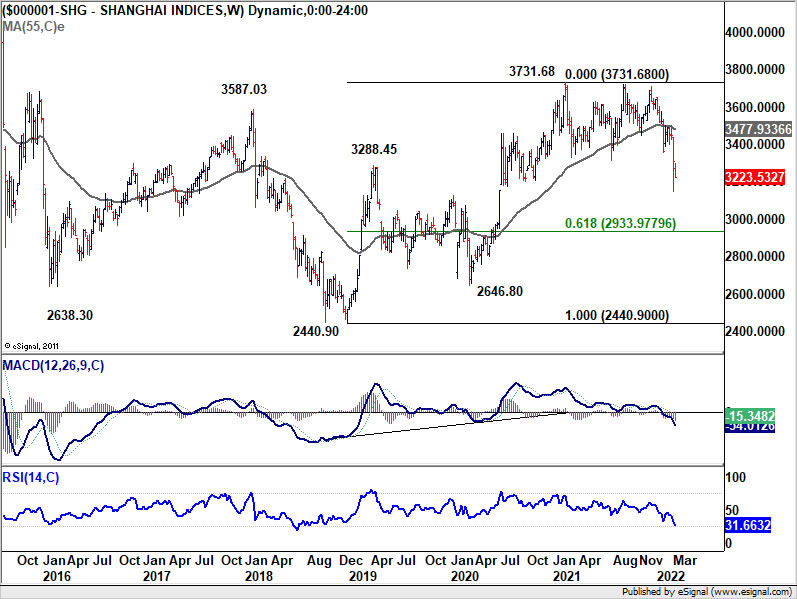
The Shanghai SSE closed down -2.60%, or -86.21 pts, at 3233.53. The recovery started last week could turn out to be very brief as the medium term decline from 3731.68 is set to continue downward as long as 3500.28 resistance holds.
In the picture, current development argues that whole up trend from 2440.90 (2018 low) has already complete with three waves up to 3731.68. Fall from there should at least have a take on 61.8% retracement at 2933.97 which is close to 3000 handle.
EUR/JPY Mid-Day Outlook
Daily Pivots: (S1) 127.39; (P) 128.22; (R1) 128.86; More....
EUR/JPY's rebound from 124.37 resumed by breaking 129.01 temporary top. Intraday bias is back on the upside. Sustained trading above 55 day EMA (now at 129.30) will argue that correction from 134.11 has completed, and bring stronger rally to retest this high. On the downside, though, below 127.40 minor support will turn bias back to the downside for 124.37 support instead.
In the bigger picture, outlook is neutral at best for now until there is clear sign of up trend resumption. Corrective pattern from 134.11 could still extend further, sideway or downward. Break of 124.37 will target 61.8% retracement of 114.42 to 134.11 at 121.94.
Economic Indicators Update
| GMT | Ccy | Events | Actual | Forecast | Previous | Revised |
|---|---|---|---|---|---|---|
| 07:45 | EUR | France Trade Balance (EUR) Jan | -8.0B | -12.3B | -11.3B | -11.4B |
| 08:00 | CHF | SECO Economic Forecasts |
New Zealand Dollar Under Pressure
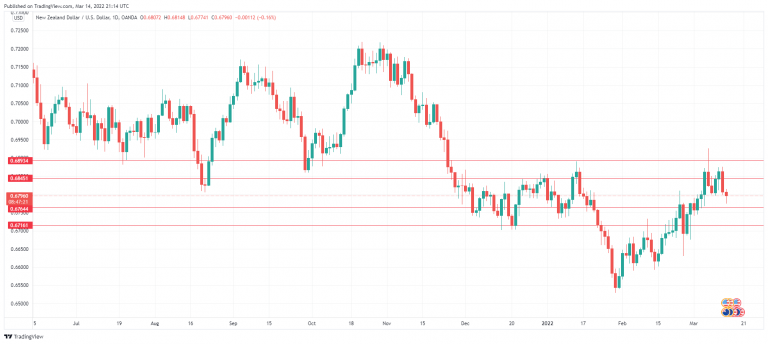
The New Zealand dollar is down slightly at the start of the week, after falling sharply in the Friday session. NZD/USD is trading at the 0.68 line in European trade.
NZ dollar eyes Services PMI
We’ll get a look at New Zealand Services PMI later in the day. The services sector has been struggling, with the PMI indicating contraction since July 2021. The manufacturing sector is in much better shape, with last week’s data pointing to growth. The Manufacturing PMI rose to 53.6, up from 52.3, while Manufacturing Sales showed a strong rebound of 12% in Q4, after a 2.3% decline in Q3.
The markets remain significantly volatile, and risk sentiment has been weak, especially with the severe crisis in Ukraine. The fighting continues, although the markets did react positively to reports that the sides were making some progress towards a cease-fire. It’s difficult to know if Putin is interested in a cease-fire or is just playing games with his adversaries.
The New Zealand dollar is risk-sensitive but has done quite well despite the lack of risk appetite in the markets. NZD/USD posted five straight winning weeks, but its luck ran out last week, as the currency was down almost 1%. The New Zealand dollar has been supported by the surge in commodity prices but remains vulnerable to a rotation into the safe-haven US dollar. The Ukraine crisis has been the factor in the loss of risk appetite, and a cease-fire would boost risk appetite and likely boost the New Zealand dollar.
The US dollar rebounded on Friday, as investors preferred to avoid risk over the weekend. On Friday, the dollar index rose 0.60% to 99.12. The index has dipped to 99.02, in the middle of the range of 98.50 – 99.50. A break above 99.50 will would provide room for the US dollar to rise, while a fall below 98.50 would cloud the bullish outlook for the greenback.
NZD/USD Technical
- NZD/USD has weak support at 0.6764. Below, there is support at 0.6716
- There is resistance at 0.6845 and 0.6893
Gold Finds Feet at 38.2% Fibonacci but Downside Risks Linger
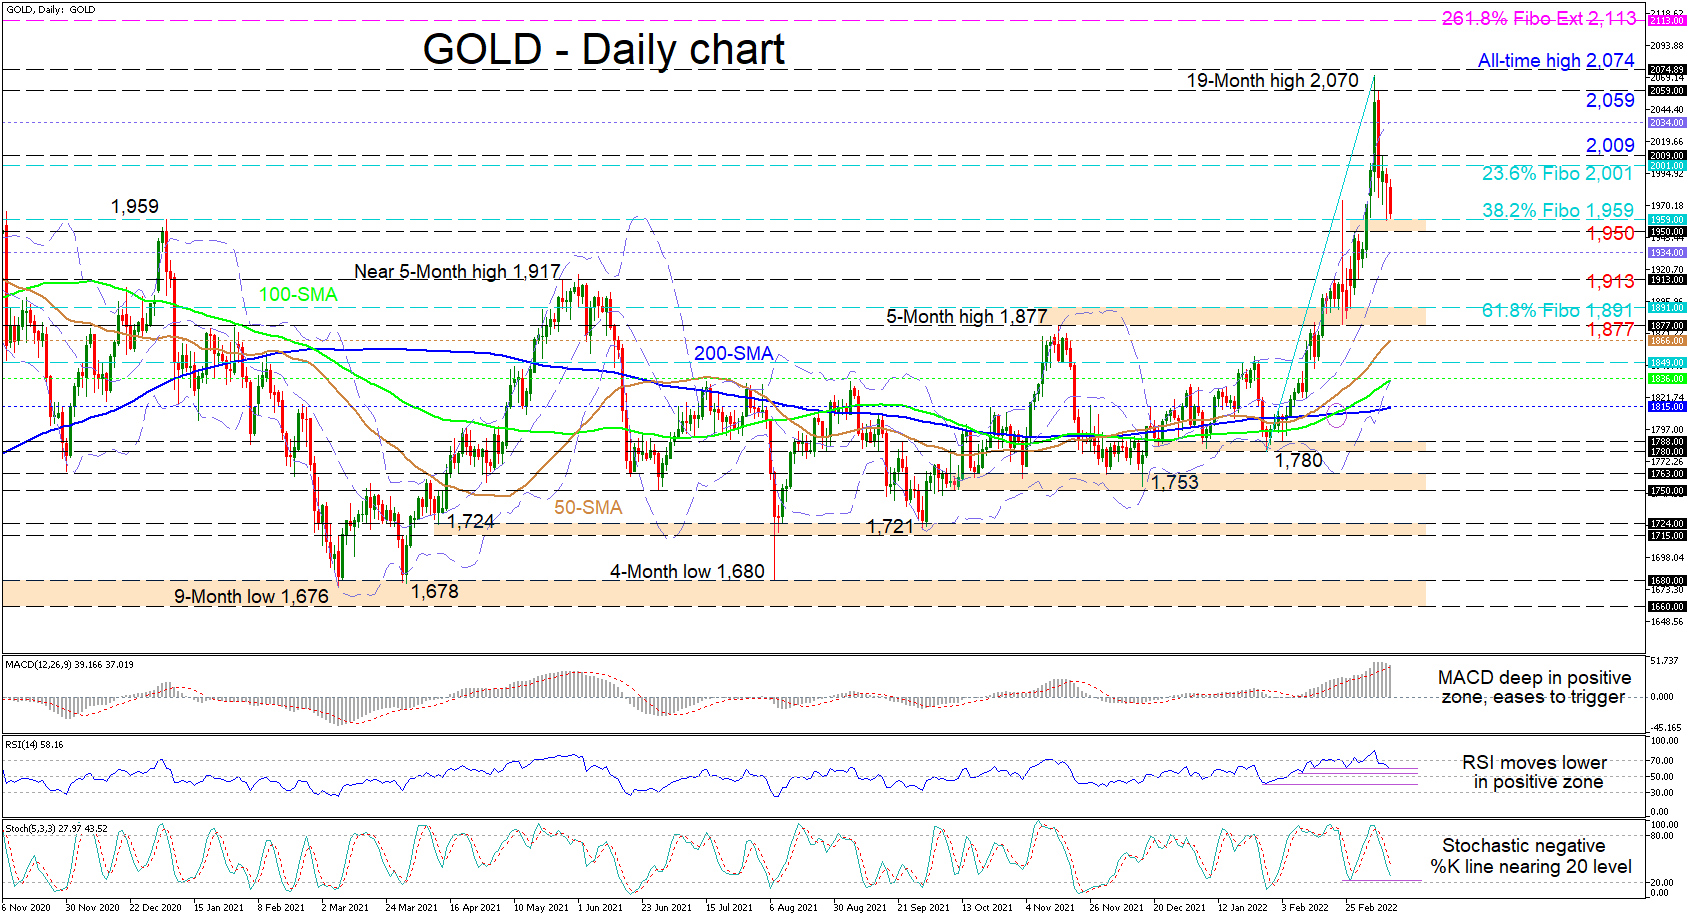
Gold's downward pressures are weighing on the 1,959 level, which is the 38.2% Fibonacci retracement of the recent 1,780-2,070 rally. Despite the deep retreat in the price of the commodity, the bullish simple moving averages (SMAs) continue to endorse the ascent in the precious metal.
Meanwhile, the short-term oscillators are skewed to the downside, confirming that positive impetus is fading. The MACD is far north of the zero threshold and looks set to slide beneath its red trigger line, while the RSI is falling in the bullish zone. Furthermore, the negatively charged stochastic oscillator is suggesting additional negative price action.
In the negative scenario, an immediate support band exists between the 38.2% Fibo of 1,959 and the inside swing high of 1,950. If this upside defence dissolves, sellers could meet the mid-Bollinger band at 1,934 before testing the 1,913 low. Surrendering extra ground, the bears may then target a buffer zone from the 61.8% Fibo of 1,891 until the 1,877 trough, recorded on February 24.
Alternatively, if buyers create positive traction off the 1,950-1,959 obstacle, upside constraints could emerge around the 23.6% Fibo of 2,001 and the 2,009 high overhead. If bullish drive grows, traders’ focus could shift to the upper Bollinger band at 2,034. Successfully overrunning it though, the price may revisit the section between the 2,059 barrier and the all-time high of 2,074, where the 19-month high also resides.
Summarizing, gold’s bullish bias is under strain but should remain active if the price holds above the 1,950-1,959 supporting barrier and the mid-Bollinger band at 1,934. Yet, in order to reinforce negative tendencies, the commodity’s price would need to sink past the 1,877-1,891 support border.
China Shanghai SSE plunged on fresh pandemic lockdown
Chinese stocks plunged notably today on worries that continued surge of coronavirus cases would impose downside risks to the economy, at least for the near term.
More local symptomatic cases are reported so far this year than the whole of 2021. The even bigger question is on the vulnerability of people there against Omicron, as they're given locally development vaccine by the government only. Import of common vaccines like Astrazeneca and Pfizer Biontech are banned.
Massive lockdown is imposed in the southern technology hub of Shenzhen, including suspension of public transports start today. Meanwhile, the financial hub of Shanghai is also locking down some housing and office complexes.
The Shanghai SSE closed down -2.60%, or -86.21 pts, at 3233.53. The recovery started last week could turn out to be very brief as the medium term decline from 3731.68 is set to continue downward as long as 3500.28 resistance holds.
In the picture, current development argues that whole up trend from 2440.90 (2018 low) has already complete with three waves up to 3731.68. Fall from there should at least have a take on 61.8% retracement at 2933.97 which is close to 3000 handle.
EURUSD Opens Neutral as Bearish Risk Still Lingers
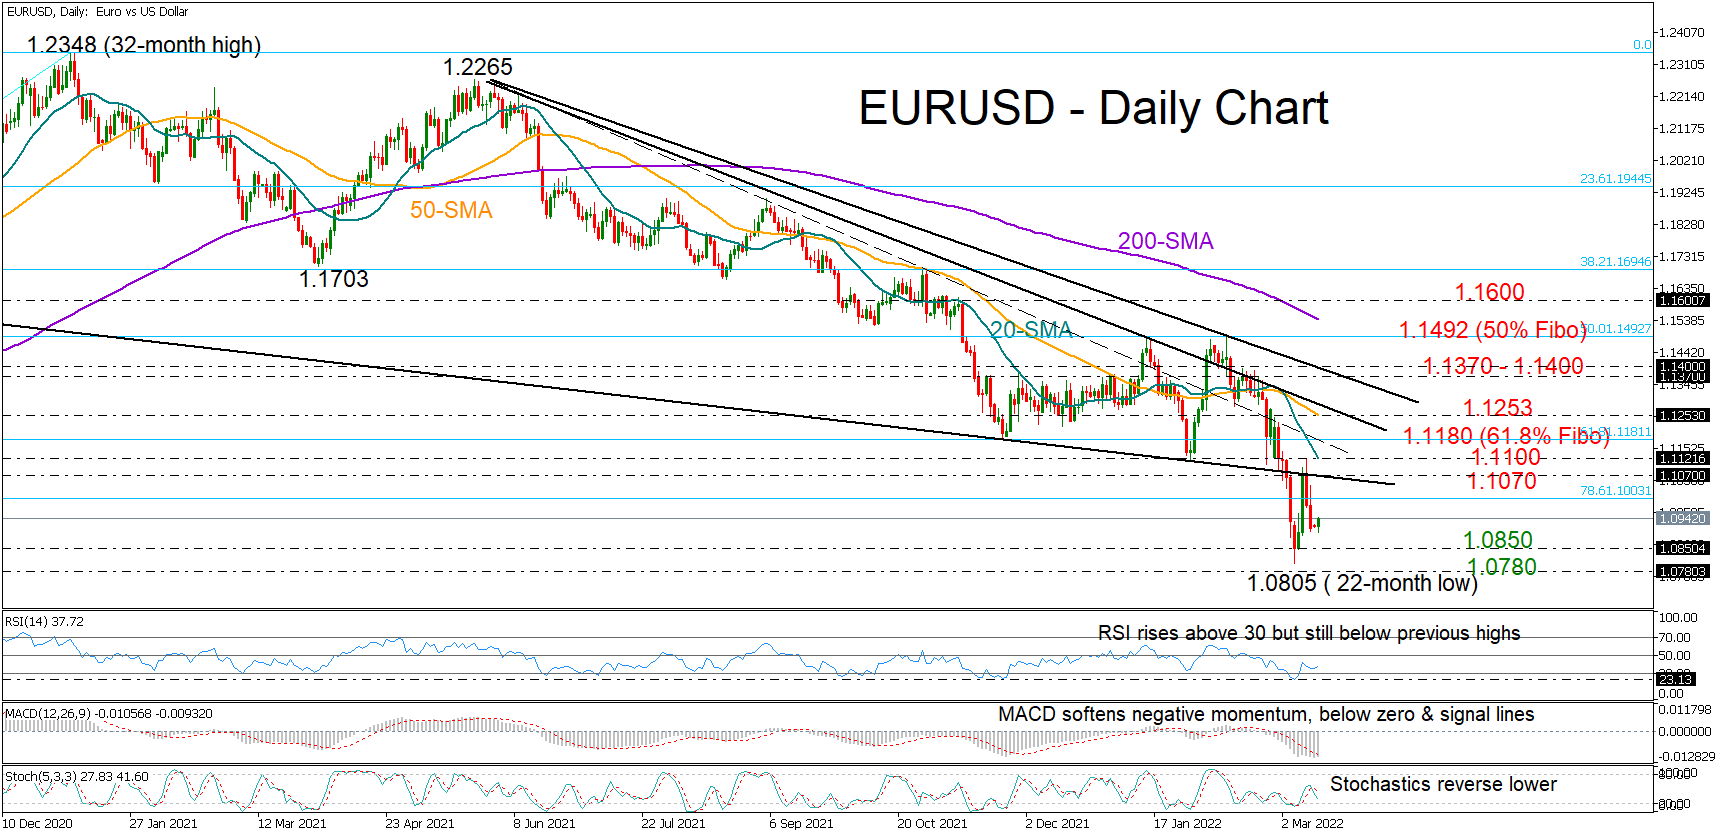
EURUSD has been silent near Friday’s low of 1.0900 during the early European trading hours on Monday. Previously, the pair got rejected near the 1.0730 territory, unable to climb back above the descending trendline, which is the upper boundary of the 2008 – 2020 bearish channel, raising fears that the series of lower lows could see further extension.
After some period of consolidation, the 20- and 50-day simple moving averages (SMAs) posted a bearish cross, endorsing the negative trend in the market. The momentum indicators are also sending discouraging signals. Despite the bounce off the oversold territory, the RSI has yet to confirm higher highs. Likewise, the MACD although moving with weaker negative momentum, is still below its red signal line and well below zero, while the Stochastics are reversing southwards again.
Looking for support levels, the 1.0850 region could come first into view if selling pressures resurface. A decisive close below that bar may initially take a breather near the 1.0780 level before heading for the 2020 low of 1.0636. Moving lower, the 1.0500 mark could next attempt to add some footing, preventing any declines towards the 2016 bottom of 1.0339.
On the upside, there are several obstacles which the bulls need to breach before they claim victory. The descending trendline at 1.1070 and the 1.1100 mark, where the 20-day SMA is currently placed, could immediately halt any bullish actions. If not, the next stop could be the 1.1180 area, which includes the 61.8% Fibonacci retracement of the 1.0636 – 1.2348 upleg and the dashed descending line drawn from May 2021. Higher, the focus will fall on the 50-day SMA at 1.1253, and if this proves easy to clear as well, the bulls could then attempt to brighten the short-term outlook above the tentative downward-sloping trendline at 1.1370 and the 1.1400 psychological level.
Nevertheless, some caution could remain in place unless the pair shapes a bullish structure above its previous high of 1.1492 and, more importantly, beyond the 200-day SMA.
In brief, EURUSD is expected to behave neutral-to-bearish in the short term. A successful step above 1.1100 could motivate additional buying actions, while a drop below 1.0850 could result in further depreciation.