Sample Category Title
Eco Data 3/7/22
[php_everywhere instance="1"]
ECB Preview – Inflation Forces the Normalisation Process to Continue
- A difficult ECB meeting is due to take place on Thursday next week. After the pivotal hawkish communication shift at the February meeting, the ECB will have to balance a stronger inflation outlook with the highly uncertain economic impact of the Ukraine-Russia war.
- We expect the ECB to continue its path towards entering a 'neutral' monetary policy calibration and formally set an end date for the APP programme (in September this year), due to the high inflation pressure, but fall short of giving a firm indication of an upcoming rate hike. We expect the ECB to remove the 'or lower' wording from the forward rates guidance and give no time indication between the end of APP and the first rate hike, by removing 'shortly before' from its decision statement.
- The staff projections are likely to contain exceptional uncertainties given the implications of the Ukraine-Russia war are not yet known. We expect the staff projections will point to 2% core inflation in 2023 and 2024, allowing the policy normalisation process to continue.
- We acknowledge there is a risk of our expected 'continuation of normalisation' process view only coming at a later stage, as it may be a politically difficult decision to tighten monetary policy with a war on the continent. However, we expect the high underlying inflation pressure to prevail in the discussion (especially after February's core inflation of 2.7% y/y, 0.4% m/m sa), despite the weaker growth outlook.
- The ECB is attentive to financial stability and may launch a 1y LTRO operation already in March 2022. We expect a formal end to the TLTRO discount to be set for June 2022, as widely expected.
- We think markets may be in for a hawkish surprise initially, but for now we find the 27bp priced for a December hike this year as fair from a risk/reward perspective.
Resilient economic backdrop with uncertainty due to war...
Russia's aggression in Ukraine is an unpleasant source of uncertainty for a central bank and particularly after the ECB's hawkish pivot at the February meeting, clearly raising expectations for policy tightening ahead. The stronger-than-expected economic backdrop and tight labour markets with high and more persistent inflation pressures should - all else being equal - make the ECB fairly confident that a gradual and flexible approach to monetary policy normalisation is needed. However, stressing a highly data-dependent stance with optionality will remain crucial in our view.
...but high inflation to keep pressure on ECB to start policy exit
It will be a difficult communication exercise awaiting the ECB at the March meeting. The economy rebounded at the turn of the year as fading Omicron headwinds and easing supply chain stress underpinned services and manufacturing activity. The labour market recovery also continued at a rapid pace, with the unemployment rate falling to a new all-time low of 6.8% in January and labour force participation standing above pre-crisis levels.
Forex and Cryptocurrency Forecast
EUR/USD: The Fate of the Euro Is Decided in Ukraine
Macro statistics were mixed last week. But few people pay attention to it at the moment. The dynamics of European currencies is determined by what is happening in Ukraine for the second week now. The escalation of the Russian-Ukrainian armed conflict is intensifying, increasing the demand for risk-free assets. And it is the dollar that acts as such, not the pan-European currency.
The difference in the monetary policies of the Fed and the ECB pushed the EUR/USD pair down both in 2021 and in January-February 2022. The tragic events of recent days have only given it an additional downward impetus. How else can the market react, say, to a rocket attack in the area of Europe's largest Zaporozhye nuclear power plant, located in southern Ukraine? The fire that arose not far from its power units was extinguished, but this did not make it any easier: Chernobyl has not been forgotten in Europe yet, and no one wants a new nuclear catastrophe that could claim millions of lives.
The negative outlook is reinforced by the extraordinarily tough economic sanctions that the EU has imposed against Russia to support Ukraine. They create huge problems in the supply of Russian energy resources to the EU, seriously limit industrial trade, and tighten the banking sector in a grip. It is difficult to imagine how, in such a situation, the ECB will be able to curtail monetary stimulus and raise interest rates. As for the US Federal Reserve, this regulator is unlikely to abandon its plans.
Speaking in Congress on Wednesday, March 02, Fed Chairman Jerome Powell named a number of advantages of the US currency. The first is the flight of investors from risk to such safe-haven assets as the dollar due to the events in Ukraine. Other trump cards include divergence in monetary policy with European countries and the growth of the US economy. By the way, such an important indicator as the number of new jobs created outside the US agricultural sector (NFP) has confirmed Powell's words, showing real growth to 678K against a forecast of 400K (481K a month ago).
Also, the US Central Bank believes that due to the events in Ukraine and the influence of Russia on commodity markets, inflation will be higher than previously predicted. And this, as Jerome Powell said, will require a more vigorous increase in interest rates. That is, they may be even higher by the end of 2022 than the market expects.
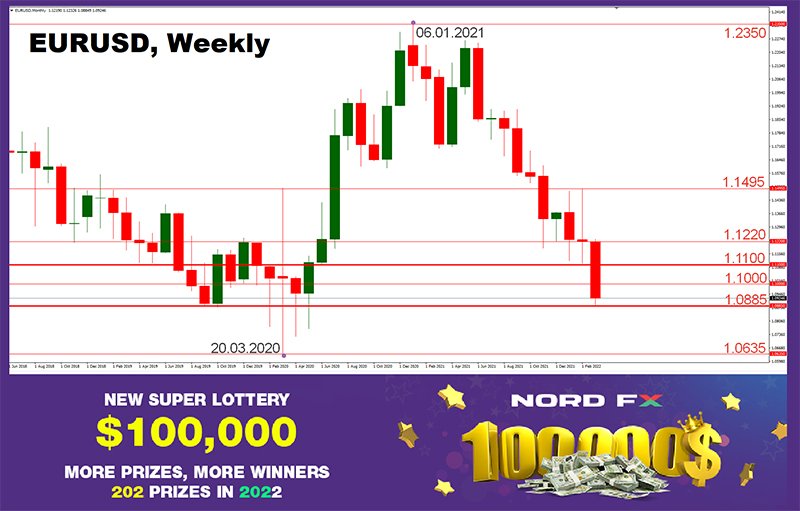
The previous week's forecast suggested that the EUR/USD pair would retest support at 1.1100, after which the bears would try to reach the landmark horizon of 1.1000. Such a scenario seemed very bold and almost unbelievable on February 25. But the events described above led to the fact that the pair easily broke through the seemingly "impenetrable" support of 1.1000 and collapsed to 1.0885, having lost 385 points in a week. The last chord, after a small correction, sounded at the level of 1.0932.
Amid mounting geopolitical tensions, the euro has lost more than 600 points to the dollar since February 10 and is now rapidly approaching the 2020 lows. And it is not far to parity 1:1. It is extremely difficult to predict where the bottom will be in the current situation. It was at around 1.0635 in 2020, the pair was falling to 1.0325 in 2016. Perhaps these values will become support levels.
As for the bulls, taking into account the increased volatility, their immediate goal is a return to the 1.1000 zone, followed by resistance in the 1.1100-1.1125 area, then a wide zone of 1.1280-1.1390, then - the highs of January 13 and February 10 in the 1.1485 area. However, the pair will be able to achieve them only if hostilities cease or, at least, when a stable truce is concluded. Most analysts hope for the best: 65% of them vote for the fact that EUR/USD will be able to return to at least 1.1200 within March. But trend indicators and oscillators on D1 have a completely different opinion: they are all colored red, although 25% of the latter are in the oversold zone.
As for economic statistics, data on retail sales in Germany will be published on Monday, March 07, then the data on GDP in the Eurozone on Tuesday. The event of the week can be Thursday, March 10, when the ECB meeting will take place. The interest rate is likely to remain the same at 0%, so the subsequent press conference of the regulator's management will be of more interest. Data on the US consumer market will come out on the same day, and we will find out the values of the harmonized consumer price index in Germany and the US University of Michigan consumer confidence index at the very end of the week, on Friday, March 11.
GBP/USD: Great Britain Is Europe as Well
The EU's dependence on Russian gas was about 45-50% before the introduction of sanctions. Unlike the countries of the European Union, the UK is practically independent of Russian gas supplies: this figure is less than 3%. Its trade turnover with the Russian Federation is much lower as well. And geographically, it is separated from the zone of the armed Russian-Ukrainian conflict by about 2,000 kilometers.
All these factors helped the GBP/USD pair to stay in a sideways trend for several days. But against the backdrop of events around the Zaporizhzhya NPP, it still could not resist and updated the February 24 low, dropping to the level of 1.3201. The week finished at 1.3246.
The experts' forecast for the pair for the next week is as follows: 50% of them vote for moving north and 25% for further movement to the south, the remaining 25% vote for a sideways trend. The indicator readings on D1 fully coincide with the readings for the EUR/USD pair. Strong support lies at 1.3170 (December 2021 lows), followed by 2020 supports. Resistance levels are 1.3270-1.3325, 1.3400, 1.3485, 1.3600, 1.3640.
Highlights of the upcoming week include the release of retail sales data for the UK on Tuesday March 08, and the release of UK output and GDP on Friday March 11.
USD/JPY: Yen or Dollar: Which Safe Haven Is Better?
Japan is even further from Ukraine than the UK, as much as 8,000 kilometers. Although it has joined the sanctions against Russia, this has not ceased to be a safe haven for investors. Therefore, everything that literally makes Europe feverish does not affect the dynamics of the USD/JPY pair. It continued to move along the 115.00 horizon last week, fluctuating in the range of 114.65-115.77. And it completed the five-day working week not far from its lower border, at 114.81. This decrease occurred on Friday, March 04, not because of the shelling of the Zaporizhzhya nuclear power plant, but because of the fall in the yield of US Treasury bonds.
That is, when the dollar rose against the euro and the pound, it fell against the yen. Competition between these two safe-haven assets will undoubtedly continue next week. 75% of analysts believe that the pair will return to the upper limit of the channel, while 25% believe that it may fall further down. As is usually the case in such situations, disagreements immediately arise among the indicators. Among the trend indicators on D1, 65% are for selling, 35% for buying. Among the oscillators, 20% vote for the purchase, 25% vote for the neutral status and 55% are for the sale, but at the same time, a quarter of them have signaled that the pair is oversold. The nearest resistance zone is 115.00-115.25, then 115.70. The main goal of the bulls is to renew the high of 116.34 and rise to where the pair has not been seen since January 2017. Support levels and zones: 114.40-114.65, 114.15, 113.75, 113.45, 113.20, 112.55 and 112.70.
The release of any significant macro statistics on the state of the Japanese economy, with the exception of data on GDP on Wednesday, March 09, is not expected next week.
CRYPTOCURRENCIES: Sanctions, Bitcoin and What Robots Choose
Immediately after the Bank of Russia asset freeze due to hostilities in Ukraine, bitcoin trading volumes increased sharply on Monday, February 28, and the coin itself jumped in price by almost 17% (from $37,840 to $44,220). The number of bitcoin addresses with balances over 1,000 BTC increased by more than 6% to 2,226. The indicator had not reached this level since March 2021. The number of addresses with a balance of 100 to 1000 BTC also increased on February 28, although not as noticeably. The indicator increased by 1.3%, to 15,929 over the day. This is evidenced by the data of the Glassnode service.
Some analysts suggest that such a rapid increase in the number of bitcoin whales is due to the attempts of the Russian elites to withdraw their assets to circumvent the sanctions and convert the depreciating rubles into cryptocurrency.
According to Bloomberg, the National Security Council of the White House and the US Treasury Department appealed to the operators of the world's largest centralized exchanges with a request to stop any attempts to circumvent the sanctions imposed on Russia. The White House spokesman said that cryptocurrencies are not a replacement for the US dollar, which is widely used in the Russian Federation. However, the US authorities intend to combat their misuse. European Central Bank President Christine Lagarde also called for increased regulation of digital assets in the euro area.
At least four cryptocurrency exchanges, including Coinbase and Gemini, have said they will take steps to tighten controls.
According to well-known economist and analyst Alex Kruger, if Russia uses cryptocurrencies to circumvent sanctions, this will be enough for US regulators to ban digital assets altogether. "Don't expect this to happen. But be careful in your actions," he warned, adding that if the geopolitical situation does not worsen, investors will soon see the growth of the crypto market.
The dynamics of the cryptocurrencies' movement between private and exchange wallets indicates the lack of certainty among investors regarding the further developments in the digital asset market. This is written by CoinDesk with reference to the report of Bank of America (BofA).
According to analysts, the tightening of the Fed's policy and macroeconomic factors will limit the growth of cryptocurrencies in the next six months. However, BofA emphasized that this will not be the beginning of a new "crypto winter", as the level of adoption of digital assets by users and the activity of developers has increased significantly.
The bank also added that it will be difficult for the digital asset market to move out of the current price range until fears of a possible recession are discarded.
After the jump on February 28, the upward movement of the BTC/USD pair slowed down on March 01-02, when approaching the strong $45,000 resistance zone. And then, after an unsuccessful attempt to break further up, it turned back to the south. (Recall that this resistance had already sent the pair down several times in January-February).
If the flagship currency still manages to rise above $45,700 at some point, we can expect its further growth to $47,000-50,000 due to the triggering of a large number of buy orders.
Legendary trader Henrik Zeberg, author of The Zeberg Report and expert on macroeconomic cycles, presented three charts to show that major stocks and cryptocurrencies are poised to rise in Elliot Wave 5. According to Zeberg, the most important stock market indices S&P500 and Nasdaq are approaching bullish reversals on the weekly charts. If his prediction comes true, bitcoin could once again increase its correlation with stocks and indices.
At the time of writing (the evening of March 04), the BTC/USD pair is trading around $39,300, the total market capitalization, after rising to $1.963 trillion, returned to the values of a week ago at $1.755 trillion, and the Crypto Fear & Greed Index grew by only 6 points (from 27 to 33 points), having firmly stuck in the zone of Fear.
Bloomberg Intelligence Chief Strategist Mike McGlone reiterated that bitcoin is well on its way to becoming an international reserve asset. He assured that the BTC rate will reach $100,000 in 2022. The analyst also emphasized that the price of the flagship digital currency will not drop to $30,000 despite the bearish sentiment in the market.
McGlone also believes that such coins as Dogecoin must lose their influence in order for bitcoin to finally establish itself as a reliable tool for protecting money savings.
An AI robot advisor created by Portuguese software developer Tiago Vasconcelos has supported Bloomberg Intelligence's chief strategist's point of view. The coder "trained the bot, explained the rules, candles, principles when you can either buy or sell, or do nothing." The bot receives one point for each profitable trade and loses it as a "punishment" for unprofitable trades. having talen thousands/millions of steps to increase the balance of the trading account, the robot advisor eventually opted for a "hodling" strategy, that is, accumulating bitcoin. (Recall that Hodl is a popular meme in the bitcoin space that arose from a message on the Bitcointalk forum in 2013 with a misprint in the word "hold").
EUR/USD Weekly Outlook
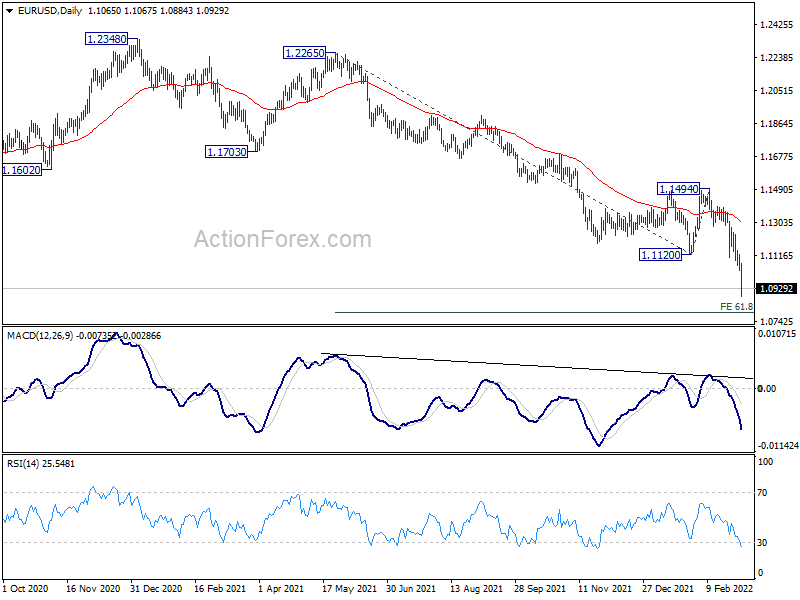
EUR/USD dived to as low as 1.0884 last week as the down trend from 1.2348 resumed. Initial bias stays on the downside this week. Next target is 61.8% projection of 1.2265 to 1.1120 from 1.1494 at 1.0786 next. On the upside, above 1.1038 minor resistance will turn intraday bias neutral and bring consolidations first, before staging another decline.
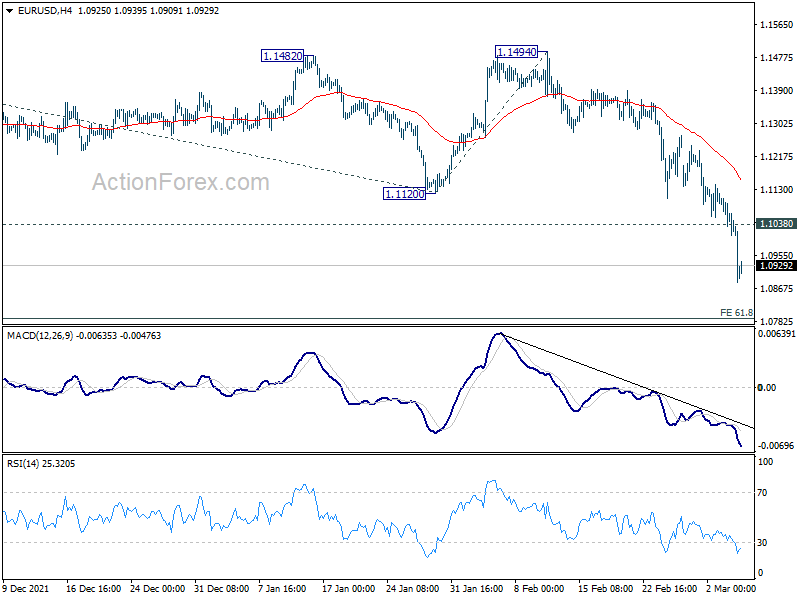
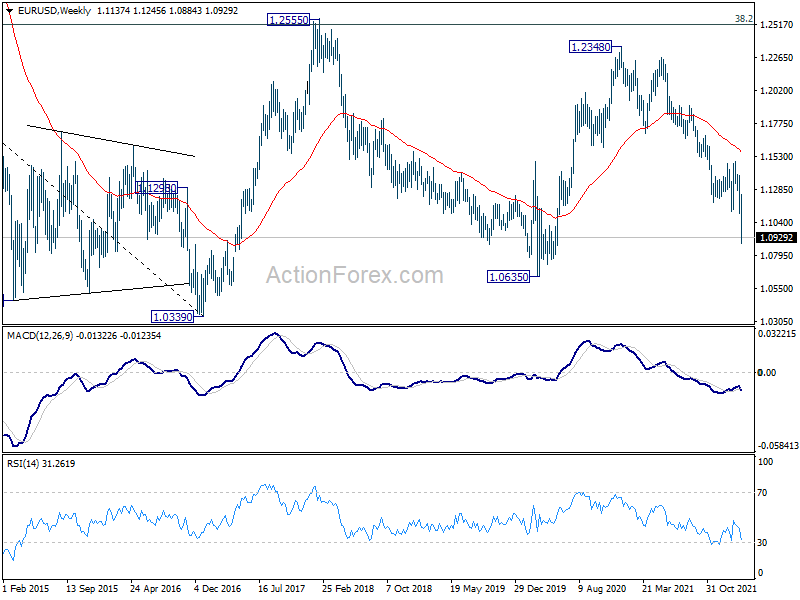
In the bigger picture, the decline from 1.2348 (2021 high) is expected to continue as long as 1.1494 resistance holds. Firm break of 1.0635 (2020 low) will raise the chance of long term down trend resumption and target a retest on 1.0339 (2017 low) next. Nevertheless, break of 1.1494 will maintain medium term neutral outlook, and extend range trading first.
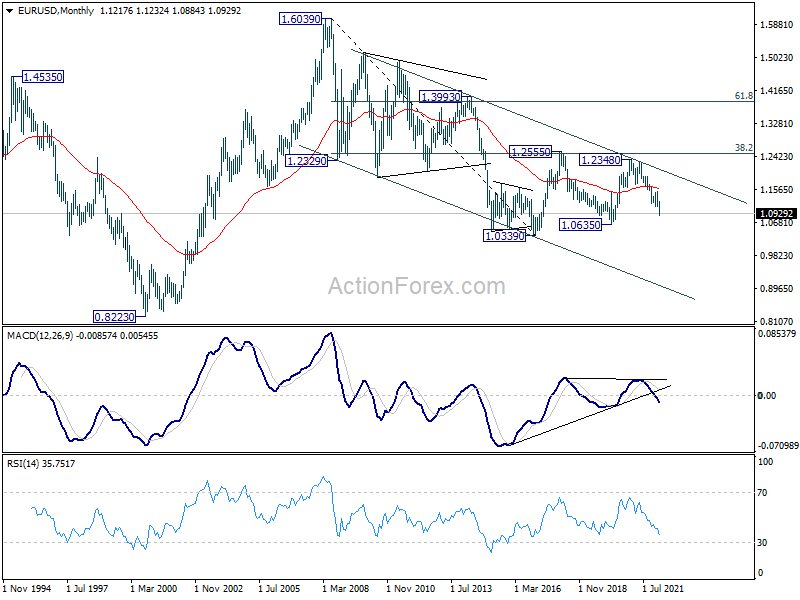
In the long term picture, in any case, as long as 38.2% retracement of 1.6039 (2008 high) to 1.0339 (2017 low) at 1.2516 holds, the down trend from 1.6039 could still resume through 1.0339 low. However, sustained trading above 1.2516 will argue that the long term trend has reversed.
USD/JPY Weekly Outlook
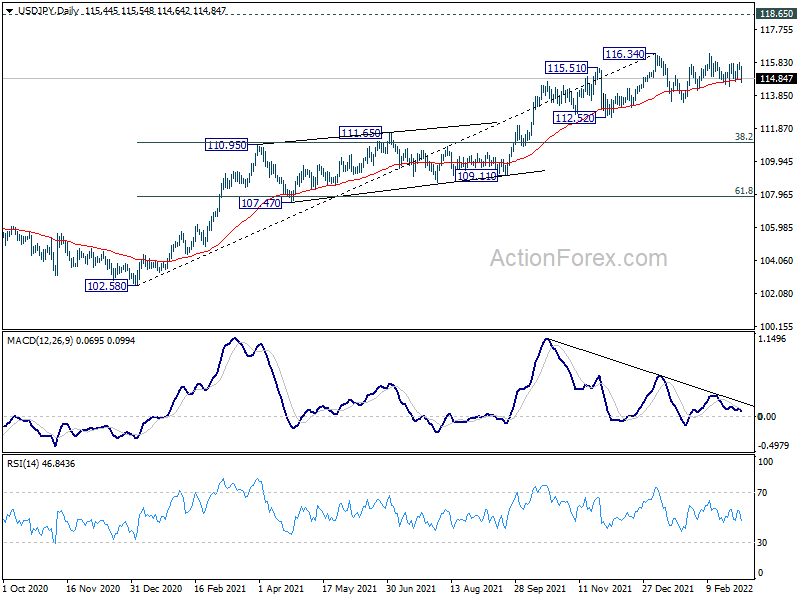
USD/JPY stayed in sideway trading last week and outlook is unchanged. Initial bias remains neutral this week first. On the upside, firm break of 116.34 will resume larger up trend from 102.58 to 118.65 long term resistance next. On the downside, though, break of 114.40 will continue the corrective pattern from 116.34 with another fall to 113.46 support.
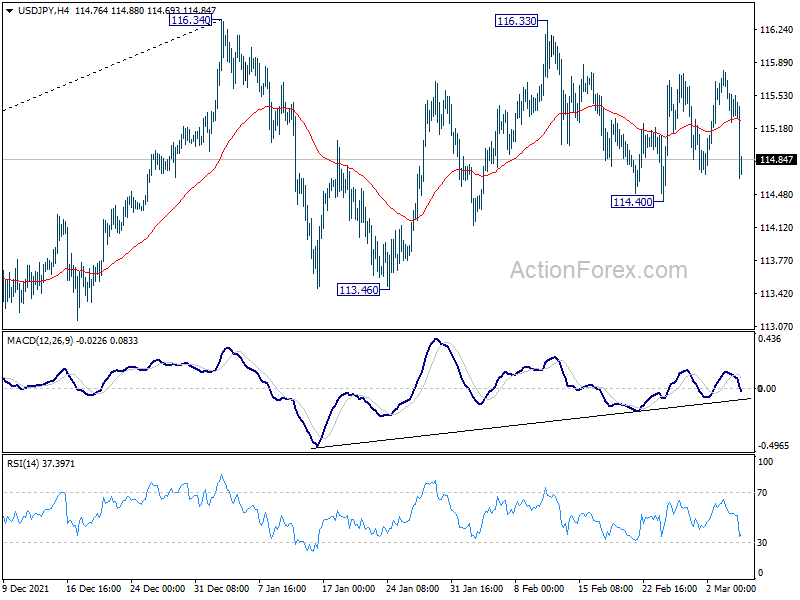
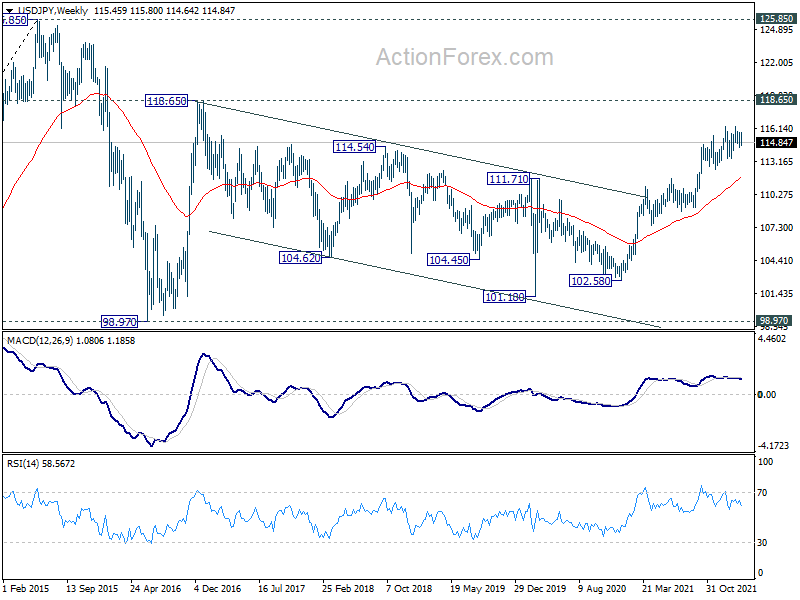
In the bigger picture, no change in the view that rise from 102.58 is the third leg of the up trend from 101.18 (2020 low). Such rally should target a test on 118.65 (2016 high). Sustained break there will pave the way to 120.85 (2015 high) and raise the chance of long term up trend resumption. This will remain the favored case as long as 55 week EMA (now at 111.64) holds.
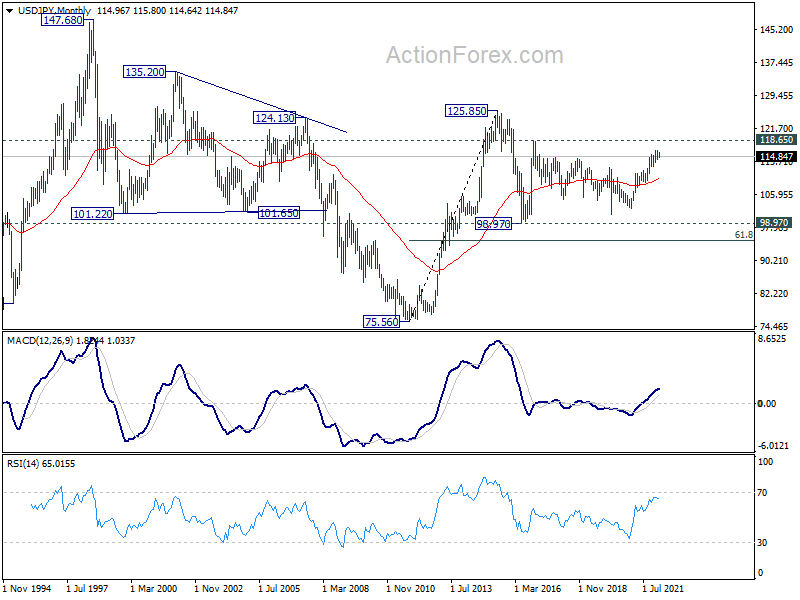
In the long term picture, the rise from 75.56 (2011 low) long term bottom to 125.85 (2015 high) is viewed as an impulsive move, no change in this view. Price actions from 125.85 are seen as a corrective pattern which could still extend. In case of deeper fall, downside should be contained by 61.8% retracement of 75.56 to 125.85 at 94.77. Up trend from 75.56 is expected to resume at a later stage for above 135.20/147.68 resistance zone.
GBP/USD Weekly Outlook
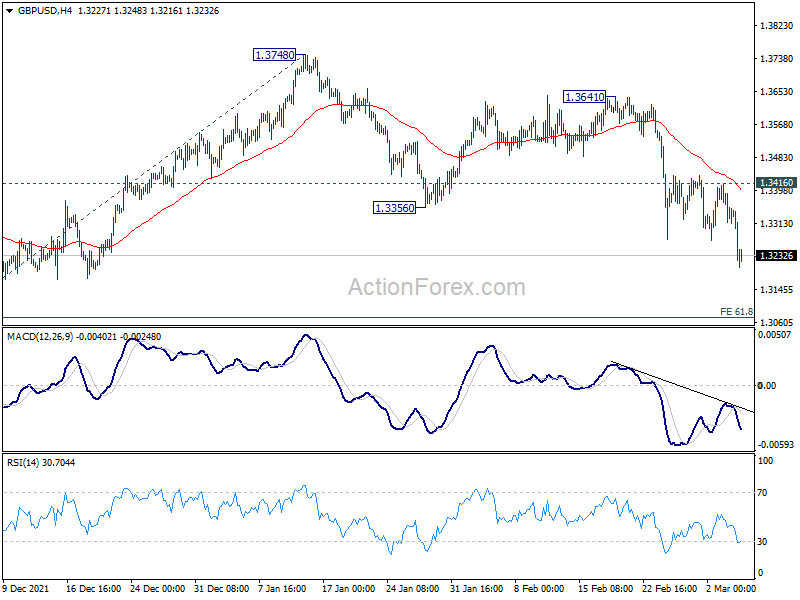
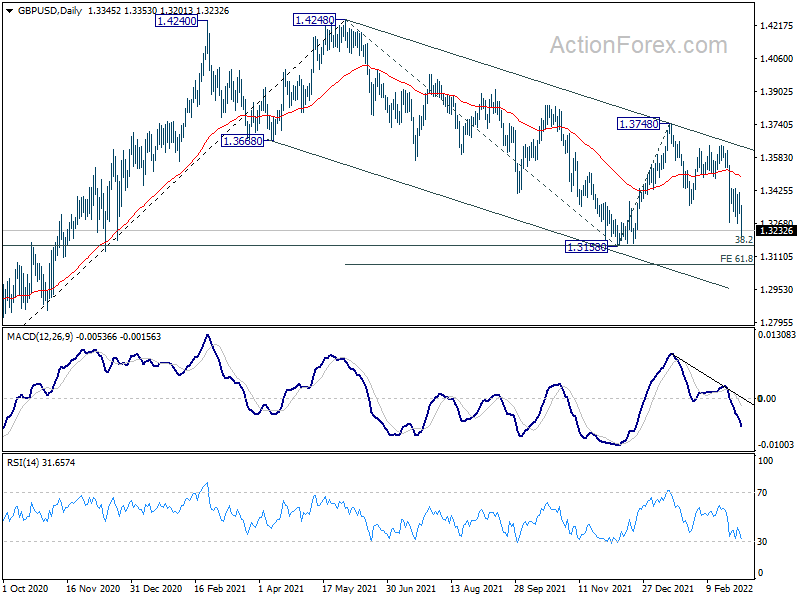
GBP/USD's fall from 1.3748 continued last week and there is no sign of bottoming yet. Initial bias stays on the downside this week for 1.3158 first. Firm break there will carry larger bearish implications. For now, outlook will stay bearish as long as 1.3416 resistance holds, in case of recovery.
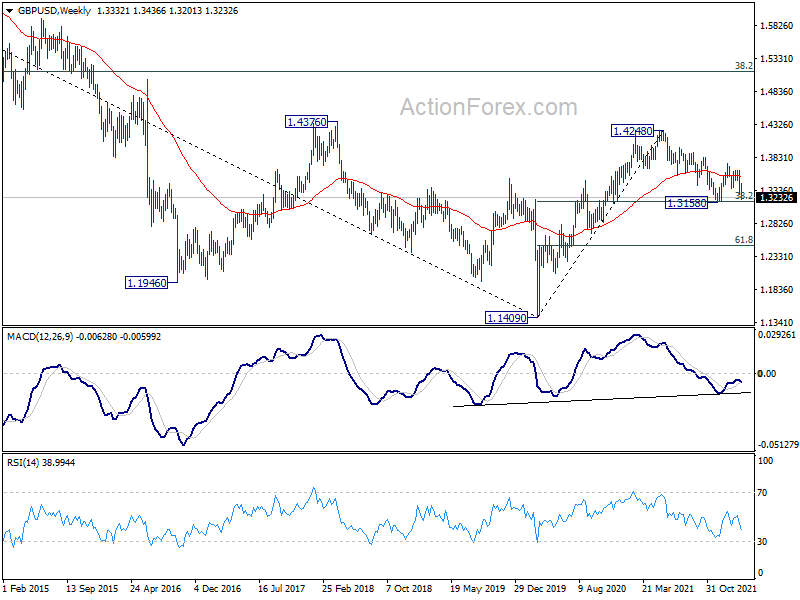
In the bigger picture, as long as 38.2% retracement of 1.1409 to 1.4248 at 1.3164 holds, up trend from 1.1409 (2020 low) is still in progress. On resumption, next target will be 38.2% retracement of 2.1161 to 1.1409 at 1.5134. Nevertheless sustained break of 1.3164 will argue that whole rise from 1.1409 has completed and bring deeper fall to 61.8% retracement at 1.2493.
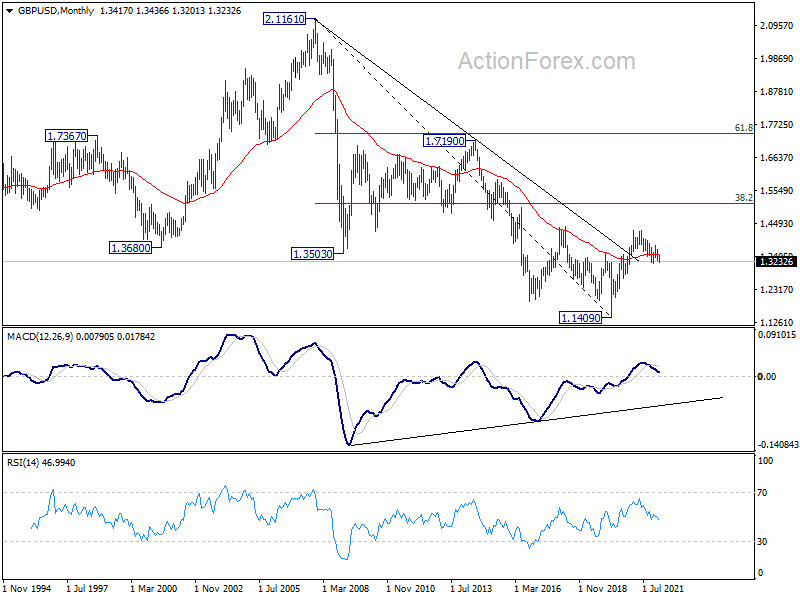
In the longer term picture, a long term bottom should be in place at 1.1409, on bullish convergence condition in monthly MACD. Rise from there would target 38.2% retracement of 2.1161 to 1.1409 at 1.5134. Reaction from there would reveal whether rise from 1.1409 is just a correction, or developing into a long term up trend.
USD/CHF Weekly Outlook
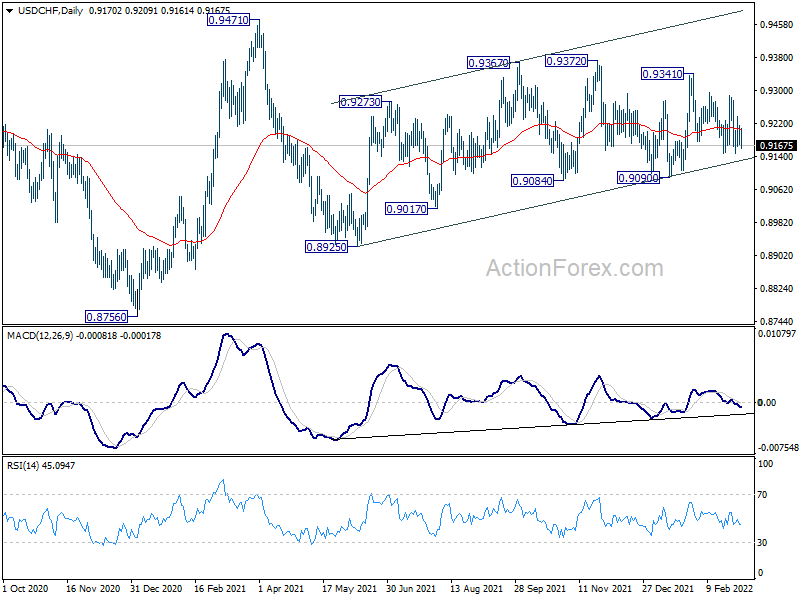
Range trading continued in USD/CHF last week and outlook is unchanged. Initial bias stays neutral this week first. Choppy rise from 0.8925 would still be in favor to extend higher as long as 0.9090 support holds. Break of 0.9341 will target 0.9372 resistance and then 0.9471. On the downside, however, break of 0.9090 will bring deeper fall back to 0.8925 support.
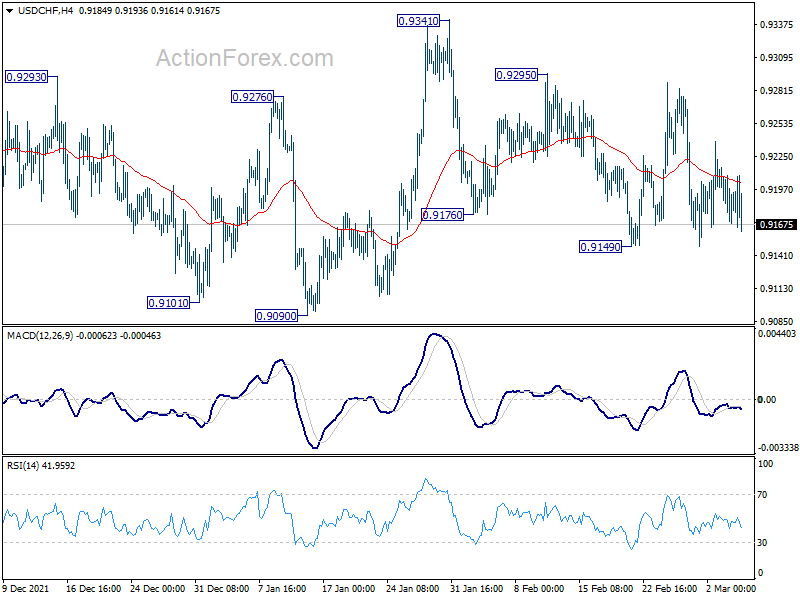
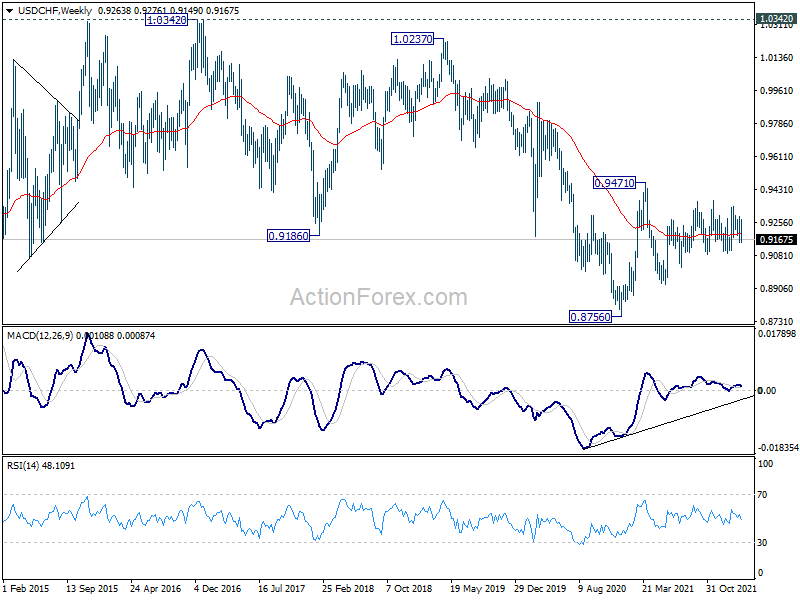
In the bigger picture, medium term outlook will be neutral at best as long as 0.9471 resistance holds. Larger down trend could still extend through 0.8756 (2021 low). However, firm break of 0.9471 will argue that the trend has already reversed and rebound the rally from 0.8756 with another impulsive move.
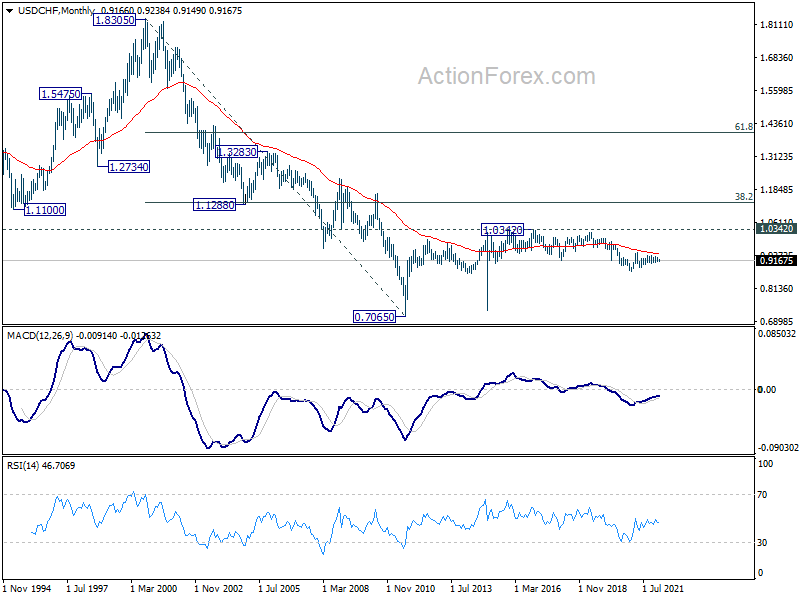
In the long term picture, price actions from 0.7065 (2011 low) are currently seen as developing into a long term corrective pattern, at least until a firm break of 1.0342 resistance.
AUD/USD Weekly Outlook
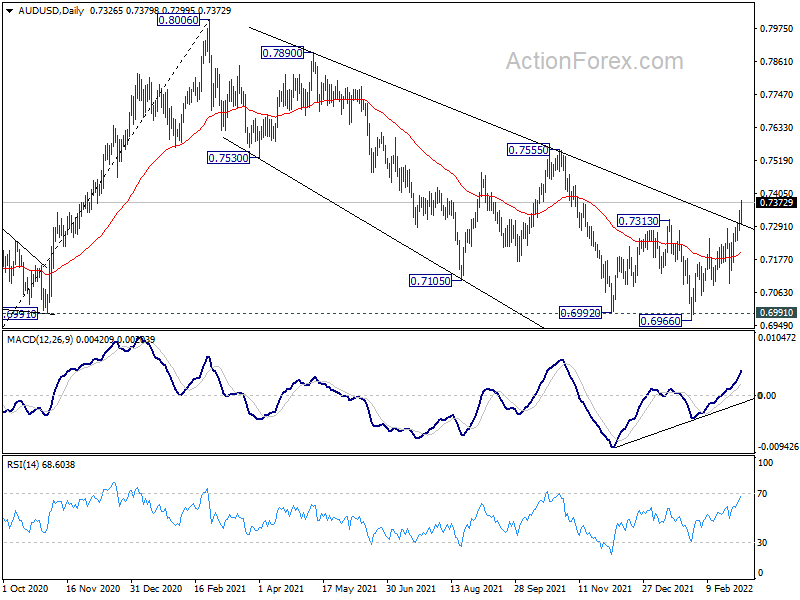
AUD/USD's rise from 0.6966 resumed last week and hit as high as 0.7379. The break of 0.7313 resistance argues that fall from 0.8006 has completed at 0.6966, after drawing support from 0.6991. Initial bias stays on the upside this week first 0.7555 resistance next. On the downside, break of 0.7275 minor support will turn intraday bias neutral first. But further rally is still in favor as long as 0.7093 support holds.
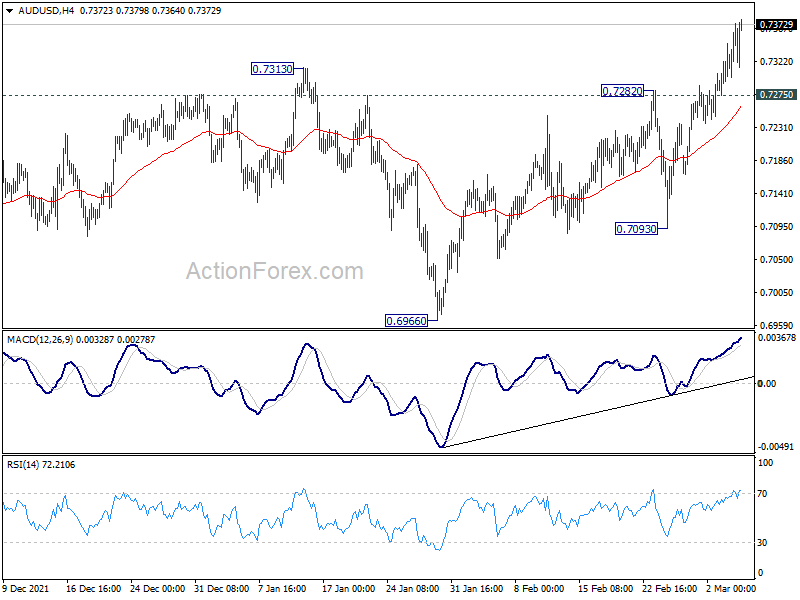
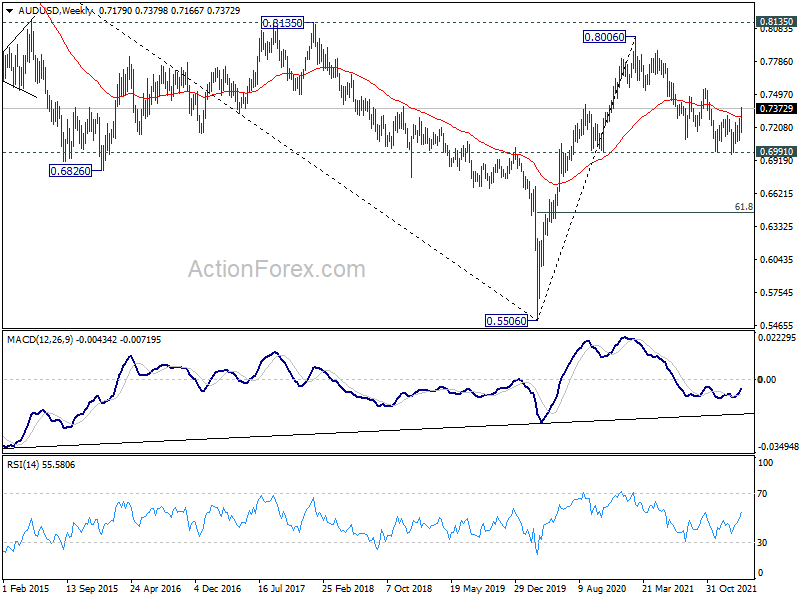
In the bigger picture, focus remains on 0.6991 key structural support. Sustained break there will argue that the whole up trend from 0.5506 might be finished at 0.8006, after rejection by 0.8135 long term resistance. Deeper decline would then be seen back to 61.8% retracement of 0.5506 to 0.8006 at 0.6461. Meanwhile, strong rebound from 0.6991 will retain medium term bullishness. That is, whole up trend from 0.5506 is still in progress for another rise through 0.8006 at a later stage.
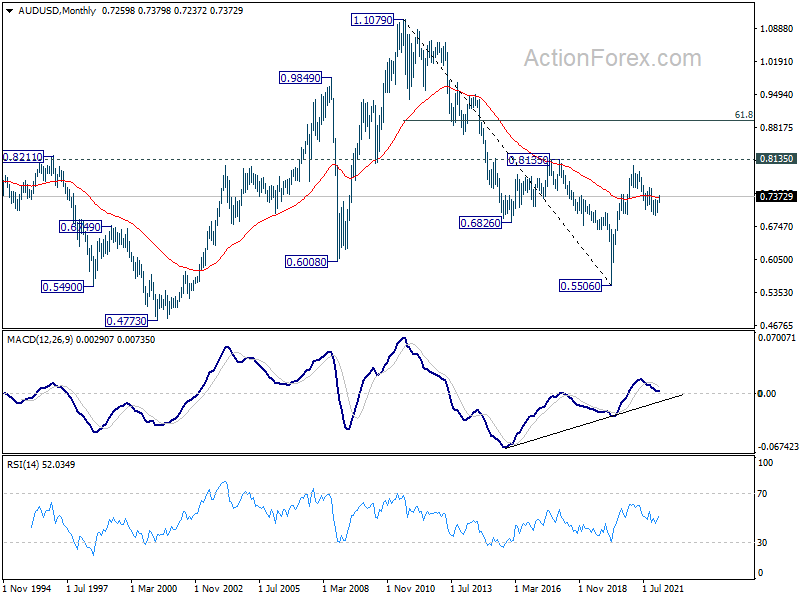
In the longer term picture, focus remains on 0.8135 structural resistance. Decisive break there will argue that rise from 0.5506 is developing into a long term up trend that reverses whole down trend from 1.1079 (2011 high). However, rejection by 0.8135 will keep long term outlook neutral at best.
USD/CAD Weekly Outlook
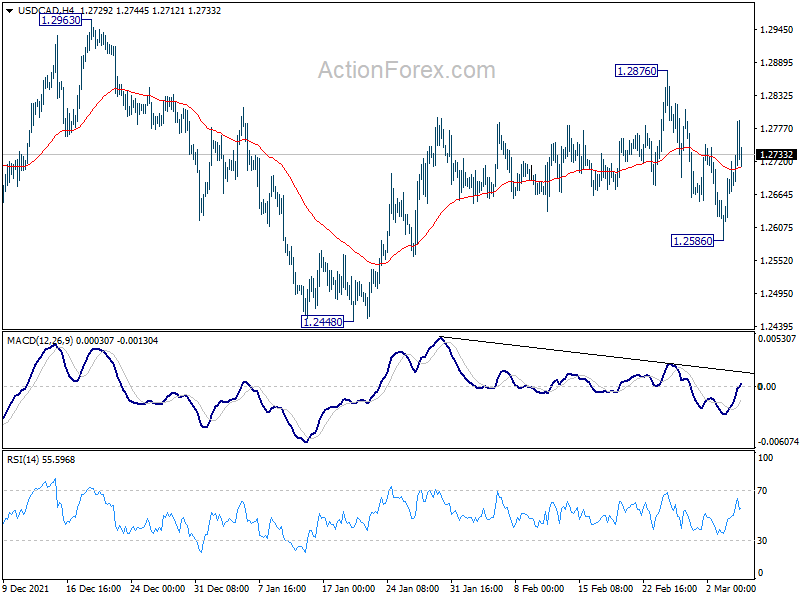
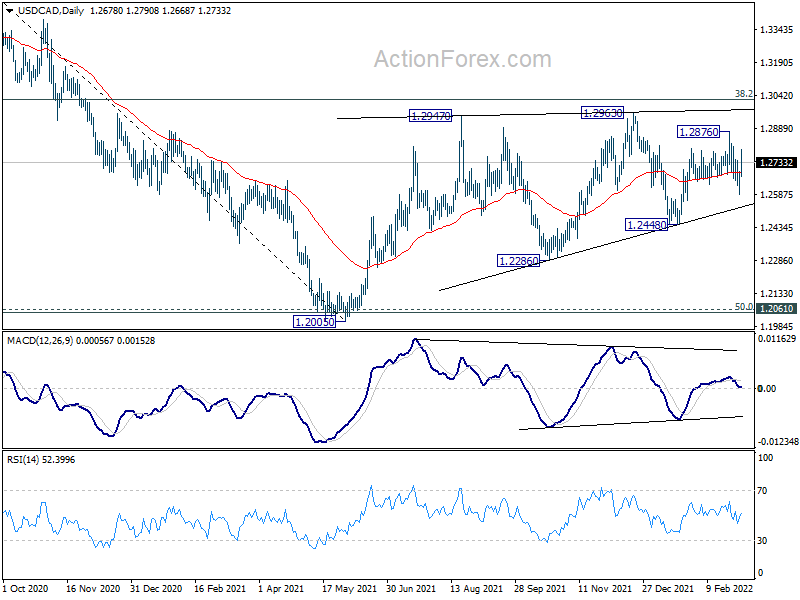
USD/CAD dropped to 1.2586 last week but quickly rebounded. Near term outlook is turned mixed for now, and initial bias is neutral this week first. On the upside, break of 1.2876 will resume the rally from 1.2448 to 1.2963 resistance. On the downside, break of 1.2586 will target 1.2448 support instead.
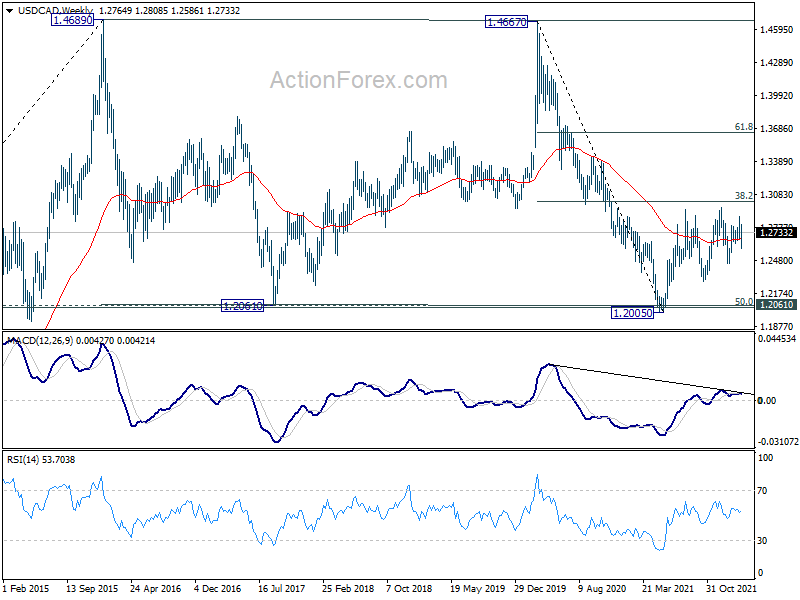
In the bigger picture, focus stays on 38.2% retracement of 1.4667 (2020 high) to 1.2005 (2021 low) at 1.3022. Sustained break there should confirm that the down trend from 1.4667 has completed after defending 1.2061 long term cluster support. Further rise would then be seen towards 61.8% retracement at 1.3650. However, rejection by 1.3022 will maintain medium term bearishness. Break of 1.2005 will resume the down trend from 1.4667 and that carries larger bearish implications too.
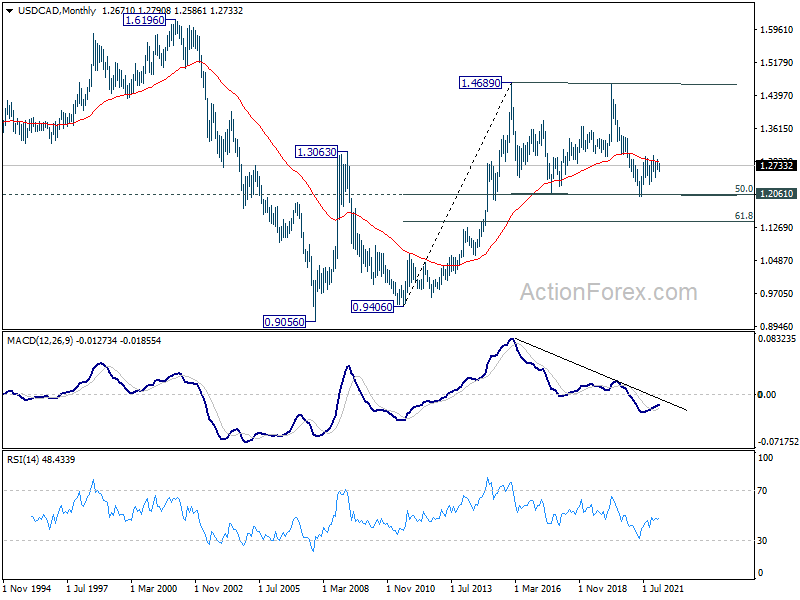
In the longer term picture, we're viewing price actions from 1.4689 as a consolidation pattern. Thus, up trend from 0.9506 (2007 low) is still expected to resume at a later stage. This will remain the favored case as long as 1.2061 support holds, which is close to 50% retracement of 0.9406 to 1.4689 at 1.2048. However, firm break of 1.2061 support will argue that USD/CAD has already started a long term down trend. Next target is 61.8% retracement of 0.9406 to 1.4689 at 1.1424.
GBP/JPY Weekly Outlook
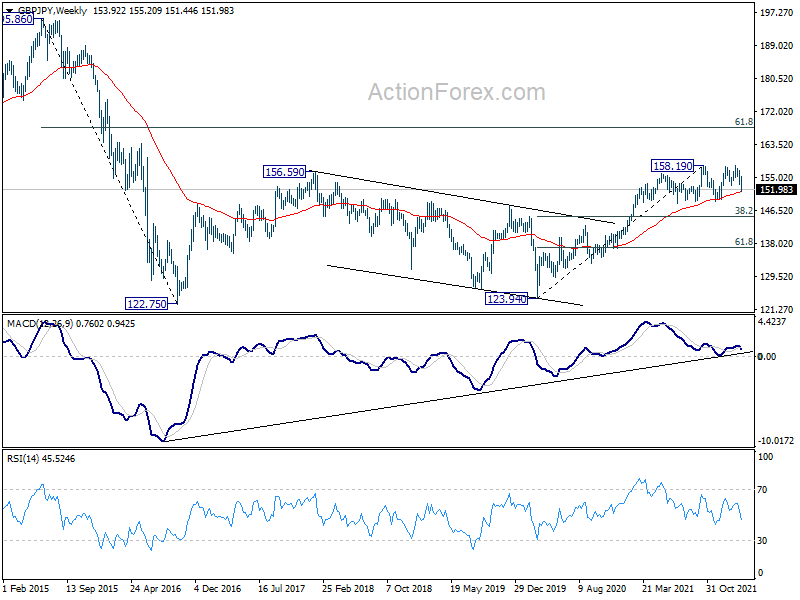
GBP/JPY's fall from 158.04 continued last week and hit as low as 151.44. Initial bias stays on the downside this week for 148.94 support next. On the upside, break of 155.20 resistance is needed to indicate completion of the decline. Otherwise, outlook will be mildly bearish in case of recovery.
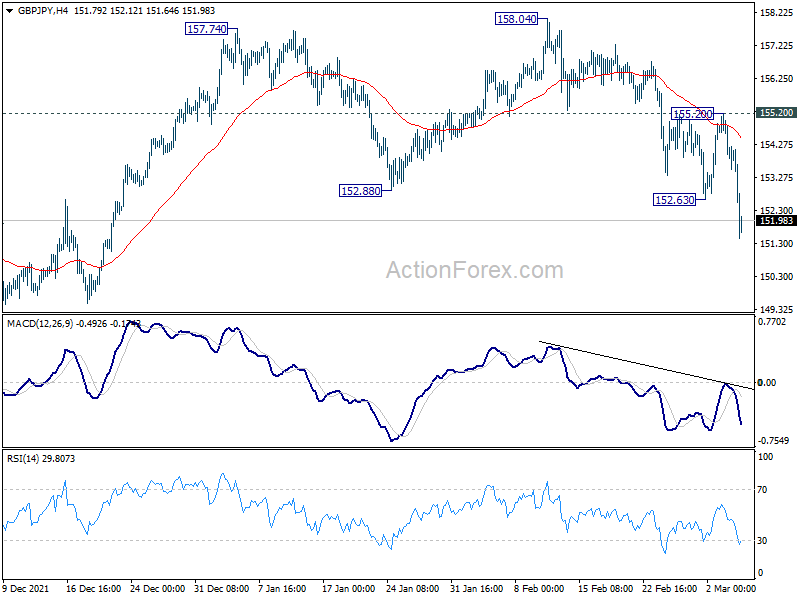
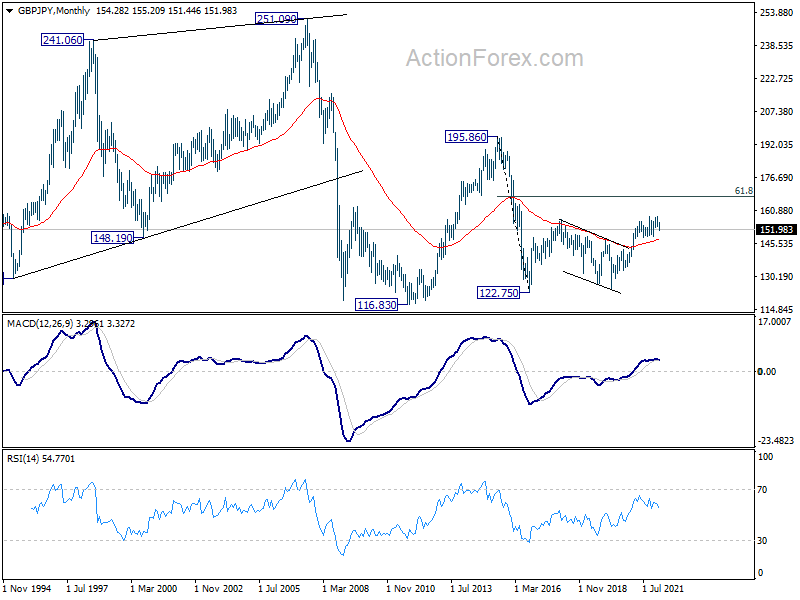
In the bigger picture, price actions from 158.19 are seen as developing into a consolidation pattern to up trend from 123.94 (2020 low). Downside should be contained by 38.2% retracement of 123.94 to 158.19 at 145.10 to bring rebound. Firm break of 158.19 will resume the up trend to long term fibonacci level at 167.93. However, sustained break of 145.10 will raise the chance of trend reversal and target 61.8% retracement at 137.02.
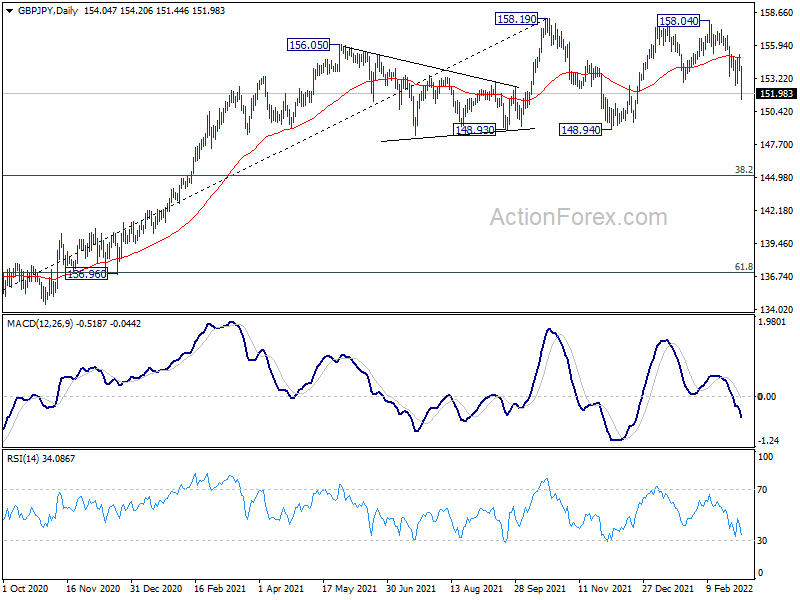
In the longer term picture, as long as 55 month EMA (now at 147.27) holds, we'd still favor more rally to 61.8% retracement of 195.86 to 122.75 at 167.93. But sustained trading below 55 month EMA will at least neutralize medium term bullishness and re-open the chance of revisiting 122.75 low (2016 low).