

Sample Category Title
EUR/USD Daily Outlook
Daily Pivots: (S1) 1.0855; (P) 1.0962; (R1) 1.1037; More...
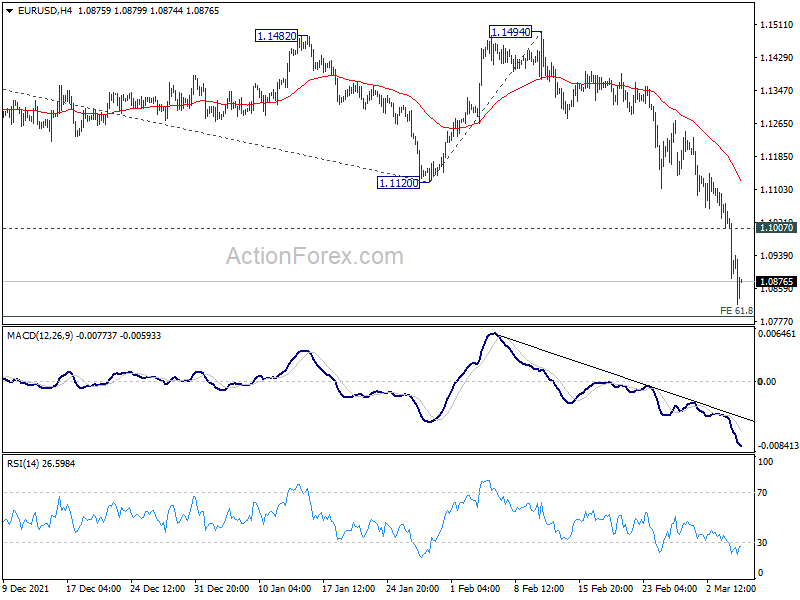
EUR/USD's decline continues today and intraday bias stays on the downside for 61.8% projection of 1.2265 to 1.1120 from 1.1494 at 1.0786. Sustained break there will target 100% projection at 1.0349 next. On the upside, above 1.1007 minor resistance will turn intraday bias neutral and bring consolidations first, before staging another decline.
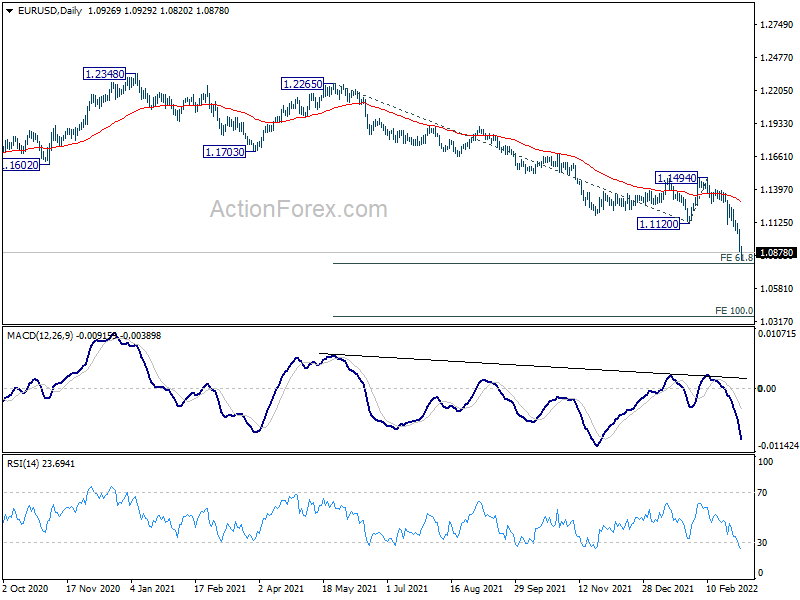
In the bigger picture, the decline from 1.2348 (2021 high) is expected to continue as long as 1.1494 resistance holds. Firm break of 1.0635 (2020 low) will raise the chance of long term down trend resumption and target a retest on 1.0339 (2017 low) next. Nevertheless, break of 1.1494 will maintain medium term neutral outlook, and extend range trading first.
Euro and Sterling Dive, Oil and Gold Surge
Moves in the markets are intensifying as another week starts, as Russia's invasion on Ukraine continues. US and allies rejected Ukrainian President Volodymyr Zelenskyy's plea for creating a no-fly zone over the country. But they're now considering to step up sanctions on Russia by banning its oil exports. Asian stocks are trading in deep red while oil prices and gold surge. European majors are under heavy selling, and Aussie is leading other commodity currencies sharply higher.
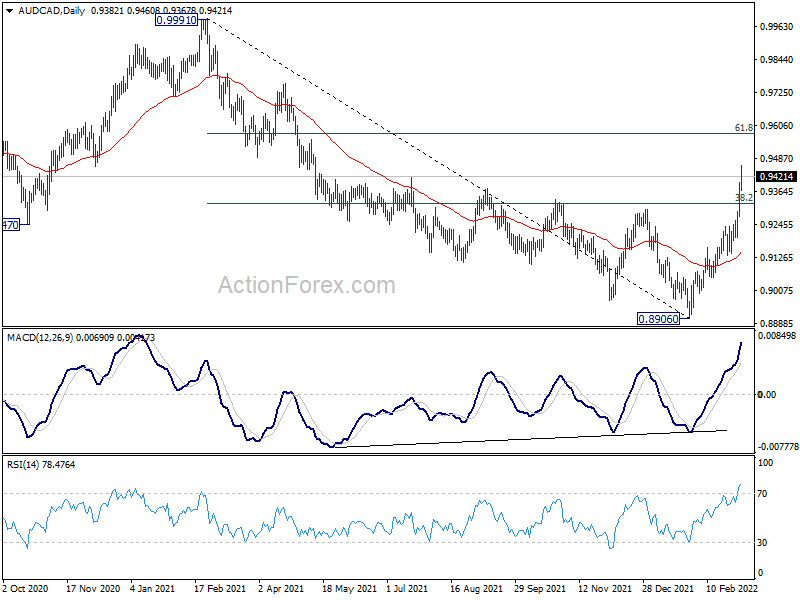
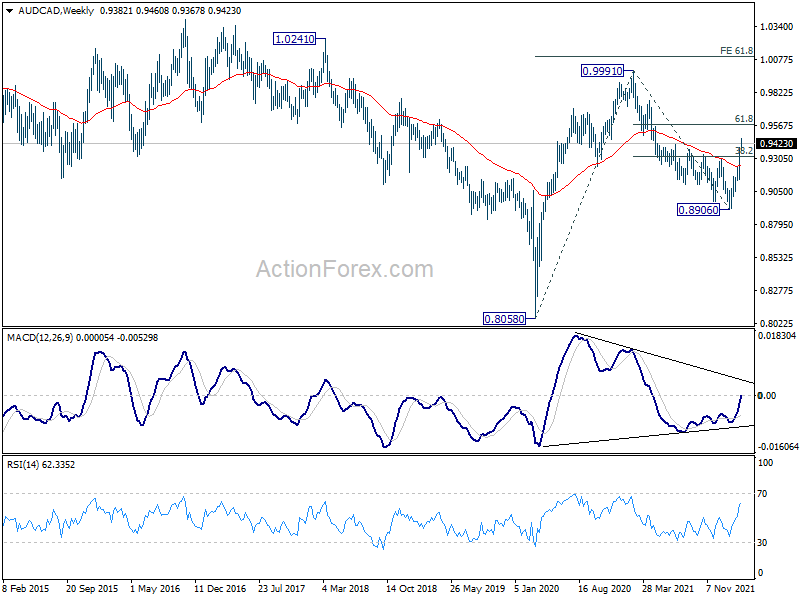
Technically, Aussie is having a clear advantage over Canadian as seen in AUD/CAD. With a strong break of 38.2% retracement of 0.9991 to 0.8906 at 0.9320, further rise should be seen to 61.8% projection at 0.9577. Sustained break there will raise the chance that AUD/CAD is indeed resuming the long term up trend from 0.8058 (2020 low). That is, there is prospect of Aussie continuing to outperform Canadian ahead.
In Asia, at the time of writing, Nikkei is down -2.95%. Hong Kong HSI is down -3.23%. China Shanghai SSE is down -1.81%. Singapore Strait Times is down -0.48%. Japan 10-year JGB yield is down -0.0066 at 0.146.
EUR/CAD and GBP/AUD extending free fall
Both Euro and Sterling are under heavy selling pressure today, against commodity currencies.
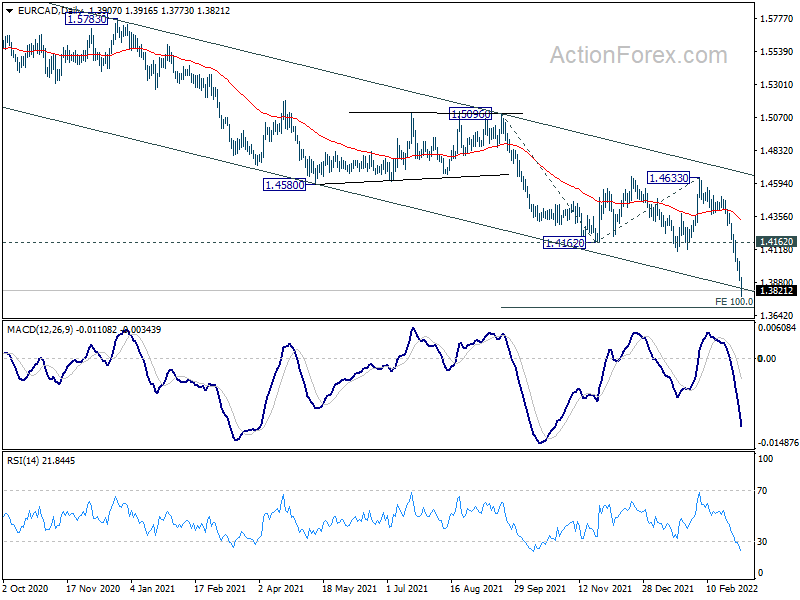
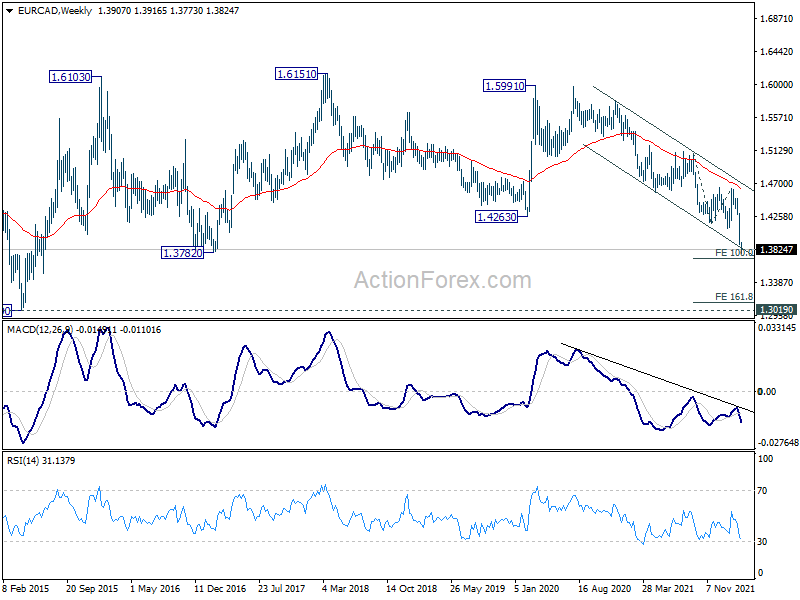
EUR/CAD dives to as low as 1.3773 so far and there is no sign of bottoming. Current fall from 1.4633 is part of the down trend from 1.5991 and should target 100% projection of 1.5096 to 1.4162 from 1.4633 at 1.3699.
Break of 1.3699, and sustained trading below medium term falling channel support, could prompt further downside acceleration to 161.8% projection at 1.3122, which is close to key long term support at 1.3019 (2015 low). Meanwhile, in any case, outlook will stay bearish as long as 1.4162 support turned resistances holds, in case of recovery.
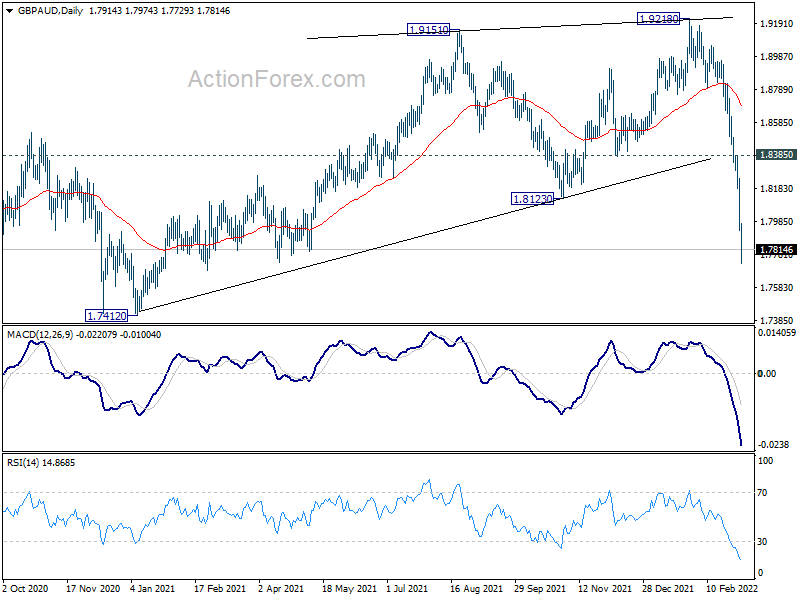
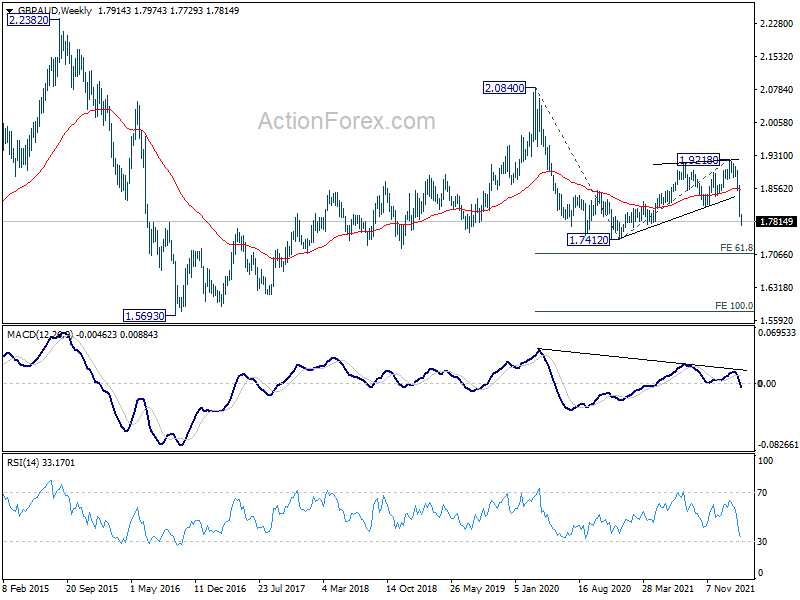
GBP/AUD also dives to as low as 1.7729 so far as all from 1.9218 accelerates. Near term outlook will stay bearish as long as 1.8385 minor resistance holds. Next target is 1.7412 low.
Also, the corrective three-wave structure of the rise from 1.7412 to 1.9218 suggests that down trend from 2.0840 (2020 high) might be ready to resume. Break of 1.7412 will confirm and target 61.8% projection of 2.0840 to 1.7412 from 1.9218 at 1.7099 first. It's a bit early to conclude. But firm break of 1.7099 could prompt further downside acceleration to 100% projection at 1.5790, which is close to long term support at 1.5693 (2016 low).
WTI oil hits 130, on track towards 147 record high
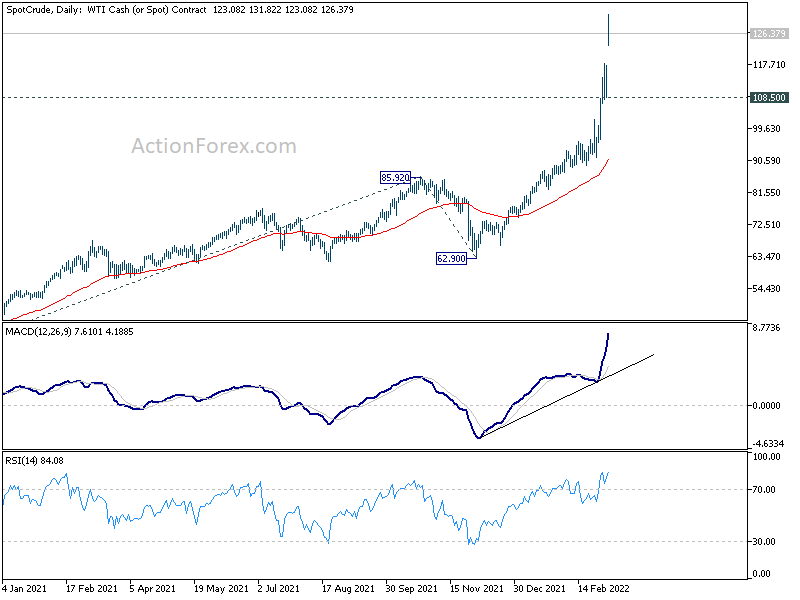
Oil prices surge gap up the week and surge to highest level since 2008. Both the US and its European allies are, responding to Ukrainian President Volodymyr Zelenskyy's request, considering to ban Russian oil imports for its continuous assault and invasion of Ukraine. Meanwhile, the Iran nuclear deal continued to drag on.
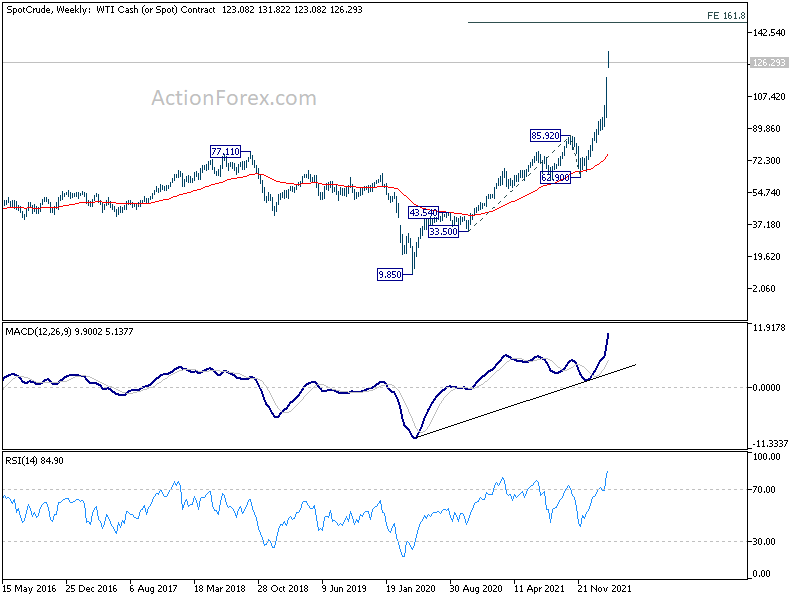
WTI crude oil breached 130 level and hit as high as 131.82 so far. For now, break of 108.50 support is needed to indicate short term topping, even in case of deep retreat. Further rise is expected to 161.8% projection 33.50 to 85.92 from 62.90 at 147.71. That's close to the historical high made in July 2008 at 147.27.
Gold gaps up and hits 2000, to target 2074 high first
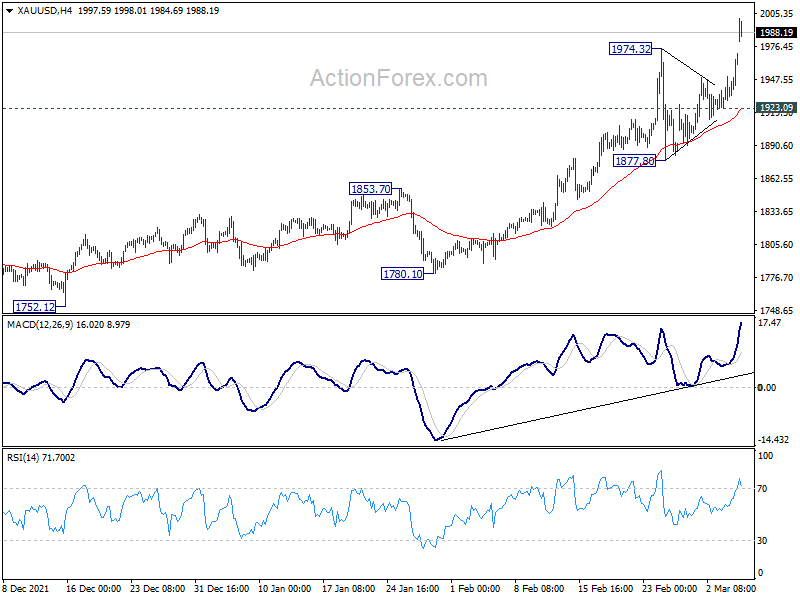
Gold gaps up as the week open and hit as high as 2000.73 so far. The break of 1974.32 resistance confirms resumption of rally from 1682.60. Further rally is expected as long as 1923.09 minor support holds, to retest 2074.84 high.
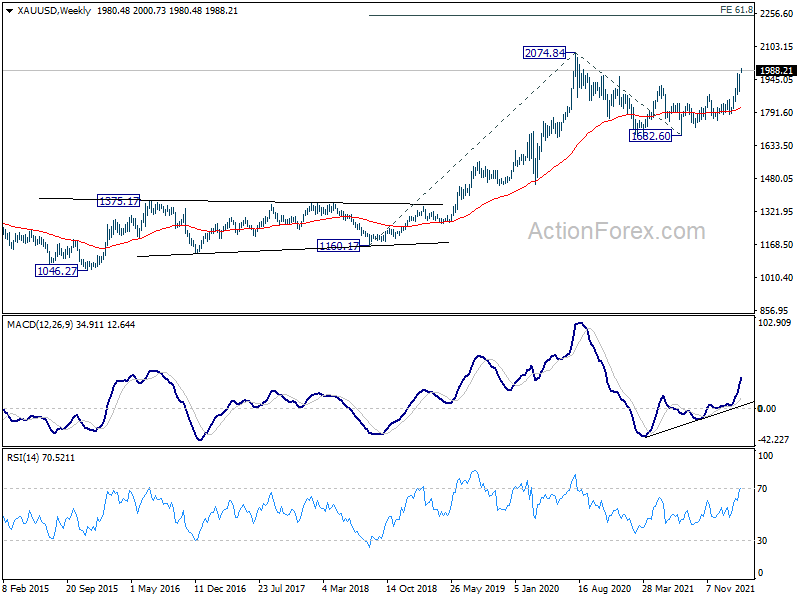
With current upside acceleration, it's getting more likely that Gold is resuming long term up trend. Break of 2074.84 will pave the way to 61.8% projection of 1160.17 to 2074.84 from 1682.60 at 2247.86.
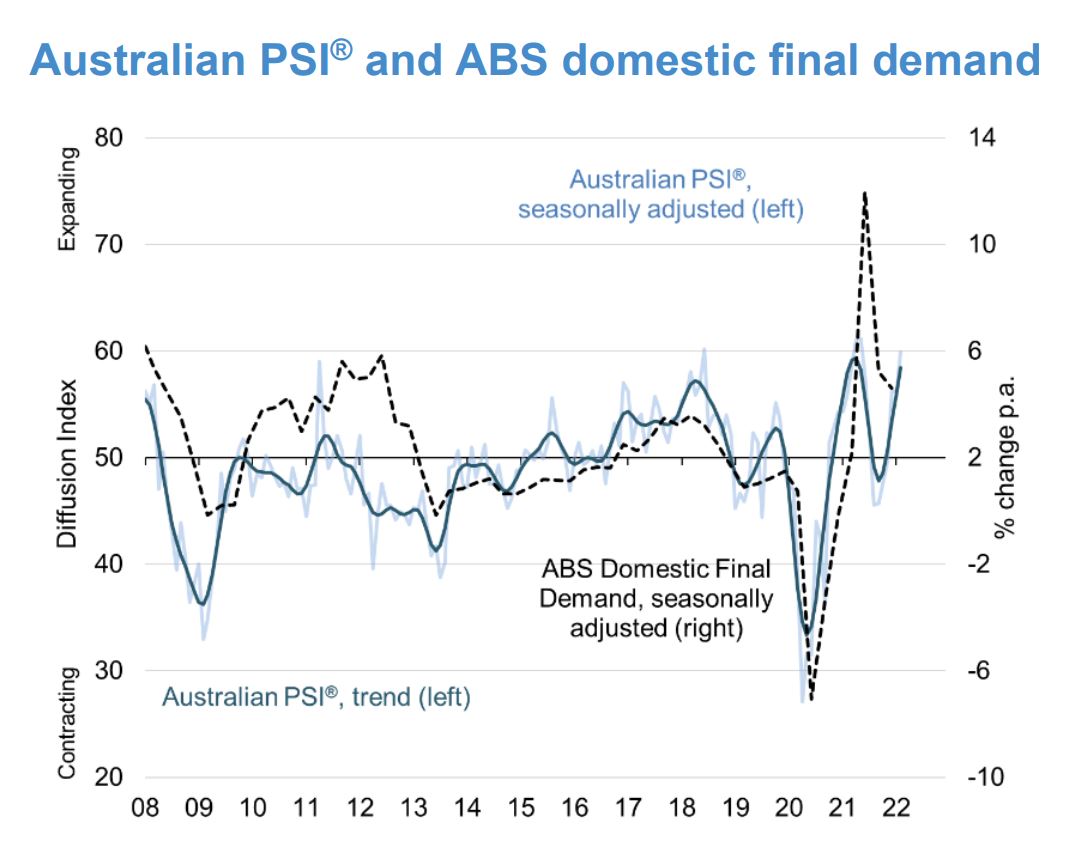
Australia AiG services rose to 60 in Feb, grew strongly
Australia AiG Performance of Services Index rose 3.8 pts to 60.0 in February. Looking at some details, sales rose 9.7 pts to 68.6. Employment dropped -2.0 to 54.7. New orders rose 3.2 to 61.1. Supplier deliveries rose 7.6 to 59.0. Input prices dropped -0.1 to 66.0. Selling prices dropped -1.9 to 60.3. Average wages dropped -1.0 to 55.9.
Innes Willox, Chief Executive of Ai Group, said: "Australian service sector businesses grew strongly in February with sales, employment and new orders all adding to the gains in the December-January period. Prices of inputs and wages were up but not as dramatically as in the manufacturing and construction sectors. Selling prices remained at a level that suggests a capacity to recover a proportion of cost increases in the market."
Lots of wild card elements in ECB meeting
ECB meeting will be a major focus this week. It's on the path to normalize monetary policy without a doubt. But there are now more uncertainty then ever on the path, due to Russia's invasion of Ukraine. There are a couple of wild cards which might trigger volatility in the markets, include any decision on an end date to APP purchases, the new economic projections, views of risk of stagflation and impact of war, the free fall in Euro and European stocks.
On the data front, US CPI will be the major focus. Some data to note including Eurozone Sentix, UK GDP, Canada employment, and China CPI and PPI. Here are some highlights for the week:
- Monday: Australia AiG services; China trade balance; Swiss unemployment rate, foreign currency reserves; Germany factory orders, retail sales; Eurozone Sentix investor confidence.
- Tuesday: Japan cash earnings, current account, leading indicators; Australia NAB business confidence; Germany industrial production; Italy retail sales; Eurozone GDP revision; Canada trade balance; US trade balance.
- Wednesday: New Zealand manufacturing sales; Australia Westpac consumer sentiment; Japan GDP final; China CPI, PPI; Italy industrial production.
- Thursday: Japan PPI; ECB rate decision; US CPI, jobless claims.
- Friday; Japan household spending, BIS manufacturing index; Germany CPI final; UK GDP , production, trade balance; Canada employment; US U of Michigan sentiment.
EUR/USD Daily Outlook
Daily Pivots: (S1) 1.0855; (P) 1.0962; (R1) 1.1037; More...
EUR/USD's decline continues today and intraday bias stays on the downside for 61.8% projection of 1.2265 to 1.1120 from 1.1494 at 1.0786. Sustained break there will target 100% projection at 1.0349 next. On the upside, above 1.1007 minor resistance will turn intraday bias neutral and bring consolidations first, before staging another decline.
In the bigger picture, the decline from 1.2348 (2021 high) is expected to continue as long as 1.1494 resistance holds. Firm break of 1.0635 (2020 low) will raise the chance of long term down trend resumption and target a retest on 1.0339 (2017 low) next. Nevertheless, break of 1.1494 will maintain medium term neutral outlook, and extend range trading first.
Economic Indicators Update
| GMT | Ccy | Events | Actual | Forecast | Previous | Revised |
|---|---|---|---|---|---|---|
| 21:30 | AUD | AiG Performance of Services Index Feb | 60 | 56.2 | ||
| 02:00 | CNY | Trade Balance (USD) Jan | 115.95B | 95.5B | 94.5B | |
| 02:00 | CNY | Exports (USD) Y/Y Jan | 16.30% | 15.00% | 20.90% | |
| 02:00 | CNY | Imports (USD) Y/Y Jan | 15.50% | 16.50% | 19.50% | |
| 02:00 | CNY | Trade Balance (CNY) Jan | 738.8B | 450B | 605B | |
| 02:00 | CNY | Exports (CNY) Y/Y Jan | 13.60% | 19.10% | 17.30% | |
| 02:00 | CNY | Imports (CNY) Y/Y Jan | 12.90% | 21.30% | 16.00% | |
| 06:45 | CHF | Unemployment Rate Feb | 2.30% | 2.30% | ||
| 07:00 | EUR | Germany Retail Sales M/M Jan | 1.90% | -5.50% | ||
| 07:00 | EUR | Germany Factory Orders M/M Jan | 1.00% | 2.80% | ||
| 08:00 | CHF | Foreign Currency Reserves (CHF) Feb | 947B | |||
| 09:30 | EUR | Eurozone Sentix Investor Confidence Mar | 5.1 | 16.6 |
EUR/CAD and GBP/AUD extending free fall
Both Euro and Sterling are under heavy selling pressure today, against commodity currencies.
EUR/CAD dives to as low as 1.3773 so far and there is no sign of bottoming. Current fall from 1.4633 is part of the down trend from 1.5991 and should target 100% projection of 1.5096 to 1.4162 from 1.4633 at 1.3699.
Break of 1.3699, and sustained trading below medium term falling channel support, could prompt further downside acceleration to 161.8% projection at 1.3122, which is close to key long term support at 1.3019 (2015 low). Meanwhile, in any case, outlook will stay bearish as long as 1.4162 support turned resistances holds, in case of recovery.
GBP/AUD also dives to as low as 1.7729 so far as all from 1.9218 accelerates. Near term outlook will stay bearish as long as 1.8385 minor resistance holds. Next target is 1.7412 low.
Also, the corrective three-wave structure of the rise from 1.7412 to 1.9218 suggests that down trend from 2.0840 (2020 high) might be ready to resume. Break of 1.7412 will confirm and target 61.8% projection of 2.0840 to 1.7412 from 1.9218 at 1.7099 first. It's a bit early to conclude. But firm break of 1.7099 could prompt further downside acceleration to 100% projection at 1.5790, which is close to long term support at 1.5693 (2016 low).
Gold gaps up and hits 2000, to target 2074 high first
Gold gaps up as the week open and hit as high as 2000.73 so far. The break of 1974.32 resistance confirms resumption of rally from 1682.60. Further rally is expected as long as 1923.09 minor support holds, to retest 2074.84 high.
With current upside acceleration, it's getting more likely that Gold is resuming long term up trend. Break of 2074.84 will pave the way to 61.8% projection of 1160.17 to 2074.84 from 1682.60 at 2247.86.
WTI oil hits 130, on track towards 147 record high
Oil prices surge gap up the week and surge to highest level since 2008. Both the US and its European allies are, responding to Ukrainian President Volodymyr Zelenskyy's request, considering to ban Russian oil imports for its continuous assault and invasion of Ukraine. Meanwhile, the Iran nuclear deal continued to drag on.
WTI crude oil breached 130 level and hit as high as 131.82 so far. For now, break of 108.50 support is needed to indicate short term topping, even in case of deep retreat. Further rise is expected to 161.8% projection 33.50 to 85.92 from 62.90 at 147.71. That's close to the historical high made in July 2008 at 147.27.
Australia AiG services rose to 60 in Feb, grew strongly
Australia AiG Performance of Services Index rose 3.8 pts to 60.0 in February. Looking at some details, sales rose 9.7 pts to 68.6. Employment dropped -2.0 to 54.7. New orders rose 3.2 to 61.1. Supplier deliveries rose 7.6 to 59.0. Input prices dropped -0.1 to 66.0. Selling prices dropped -1.9 to 60.3. Average wages dropped -1.0 to 55.9.
Innes Willox, Chief Executive of Ai Group, said: "Australian service sector businesses grew strongly in February with sales, employment and new orders all adding to the gains in the December-January period. Prices of inputs and wages were up but not as dramatically as in the manufacturing and construction sectors. Selling prices remained at a level that suggests a capacity to recover a proportion of cost increases in the market."
Technical Outlook and Review
DXY:
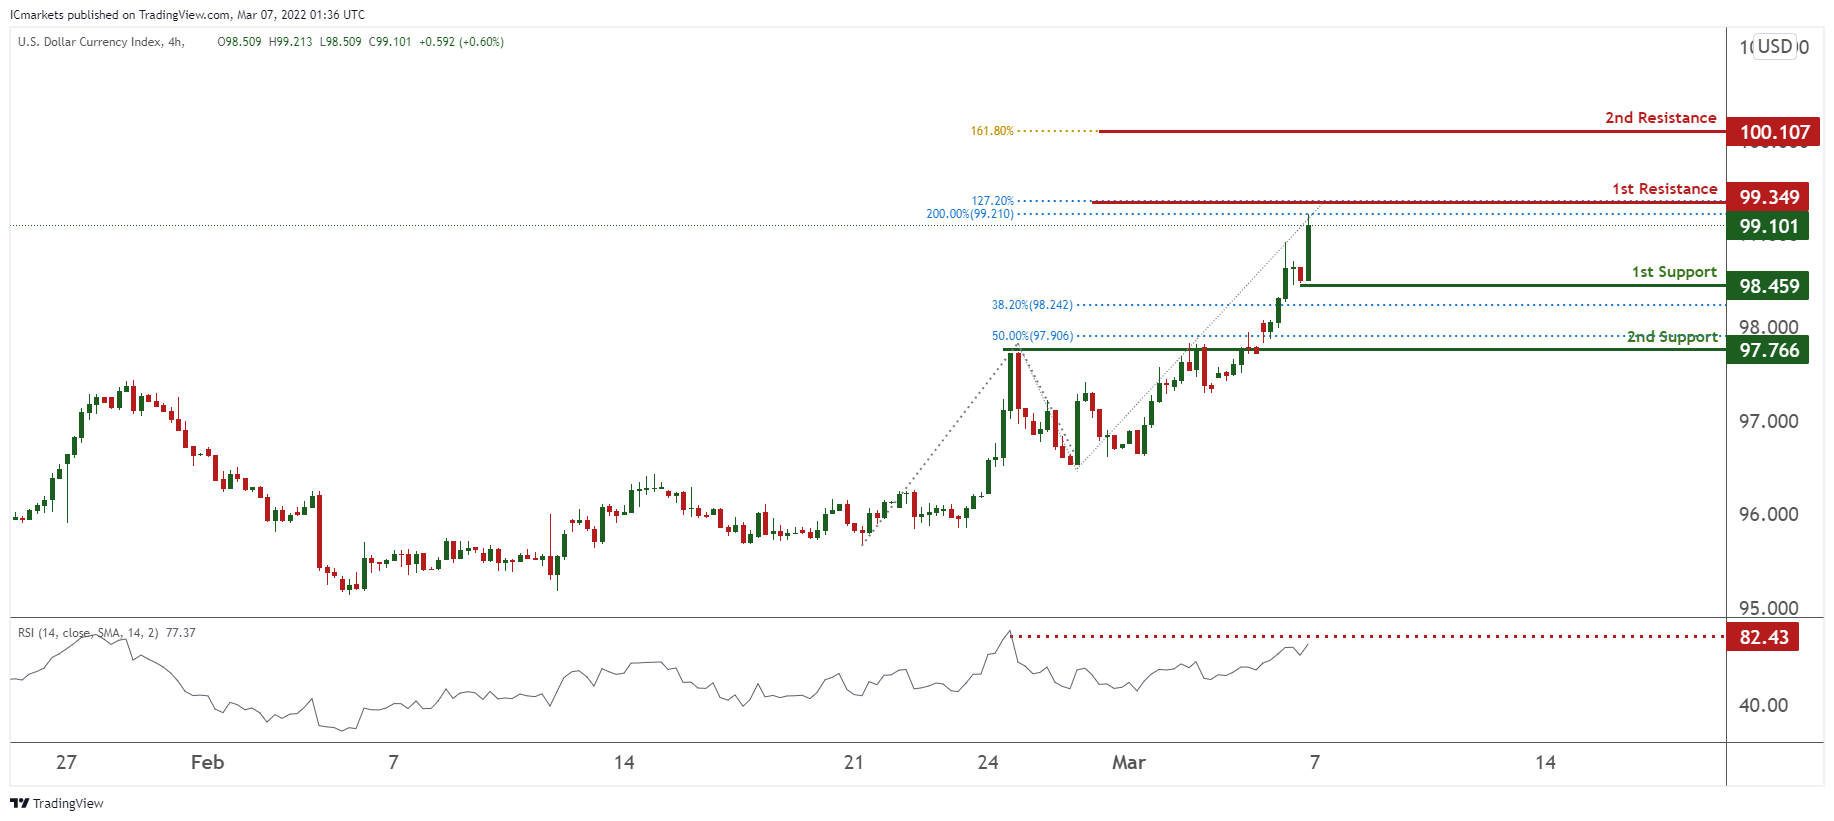
On the H4 timeframe, prices are at a recent high and approaching our pivot. We see the potential for a pullback from our 1st resistance at 99.349 in line with 127.2% Fibonacci extension and 200% Fibonacci Projection towards our 1st support at 98.459 in line with 38.2% Fibonacci retracement. RSI is at levels where dips previously occurred, further supporting our bearish bias.
Areas of consideration:
- H4 time frame, 1st resistance at 99.349
- H4 time frame, 1st support at 98.459
XAU/USD (GOLD):
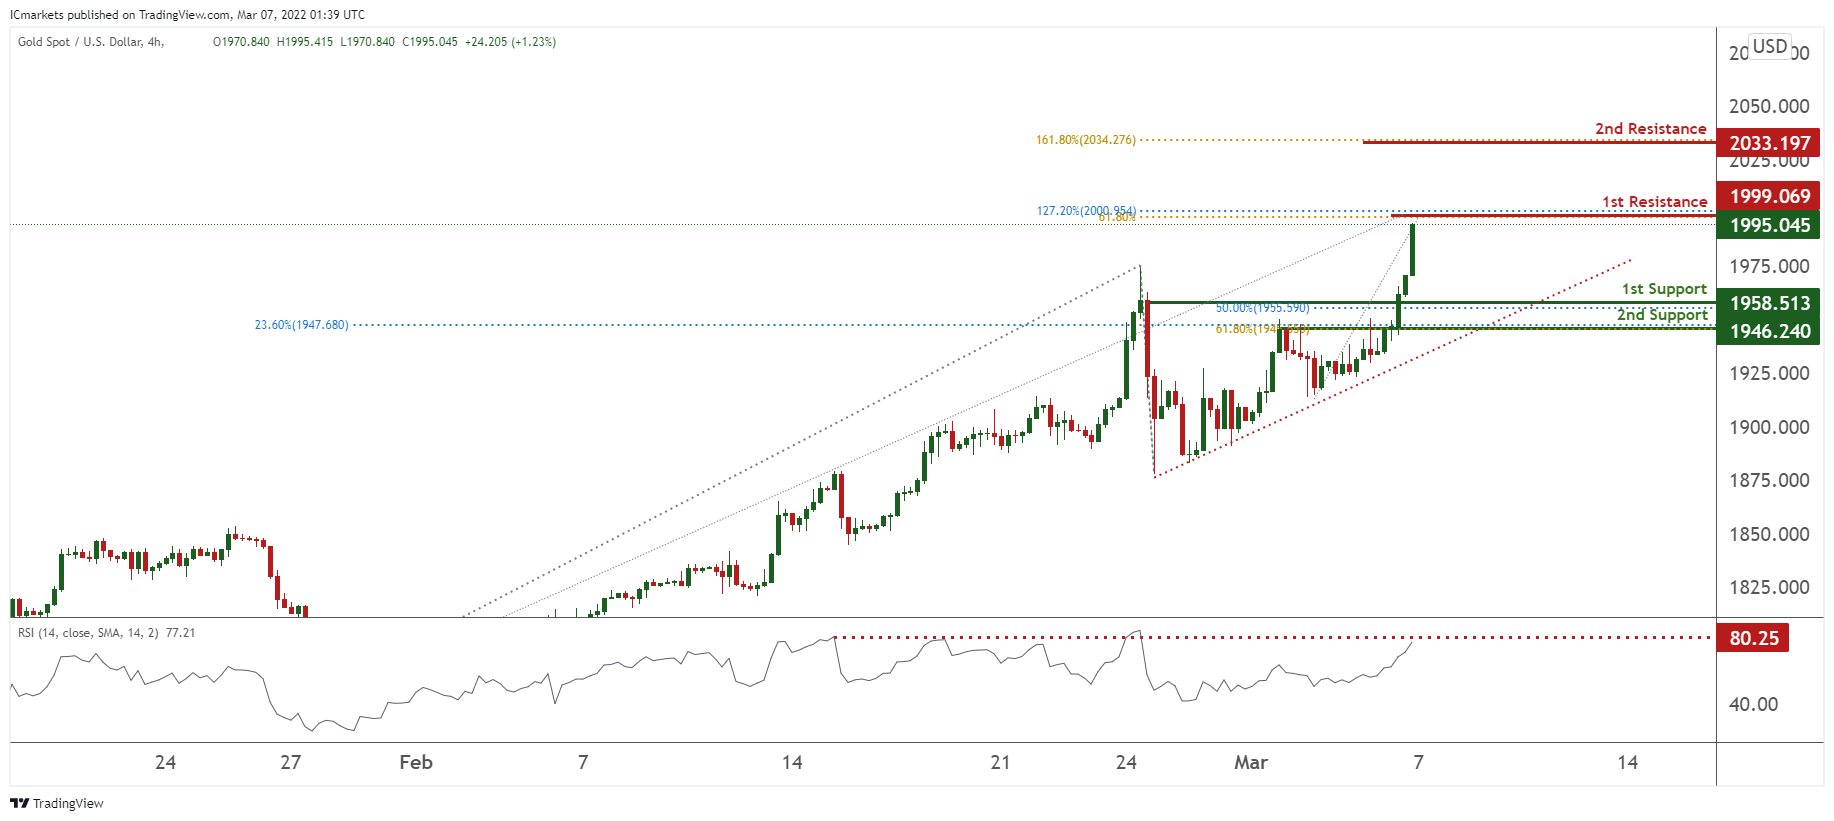
On the H4 chart, prices are on strong bullish momentum and abiding to our ascending trendline support. We see potential for prices to dip from our 1st resistance at 1999.069 in line with 61.8% Fibonacci extension and 127.2% Fibonacci Projection towards our 1st support at 1958.513 in line with 50% Fibonacci retracement. RSI is at levels where dips previously occurred, further supporting our bearish bias.
Areas of consideration:
- 4h 1st support at 1958.513
- 4h 1st resistance at 1999.069
GBP/USD:
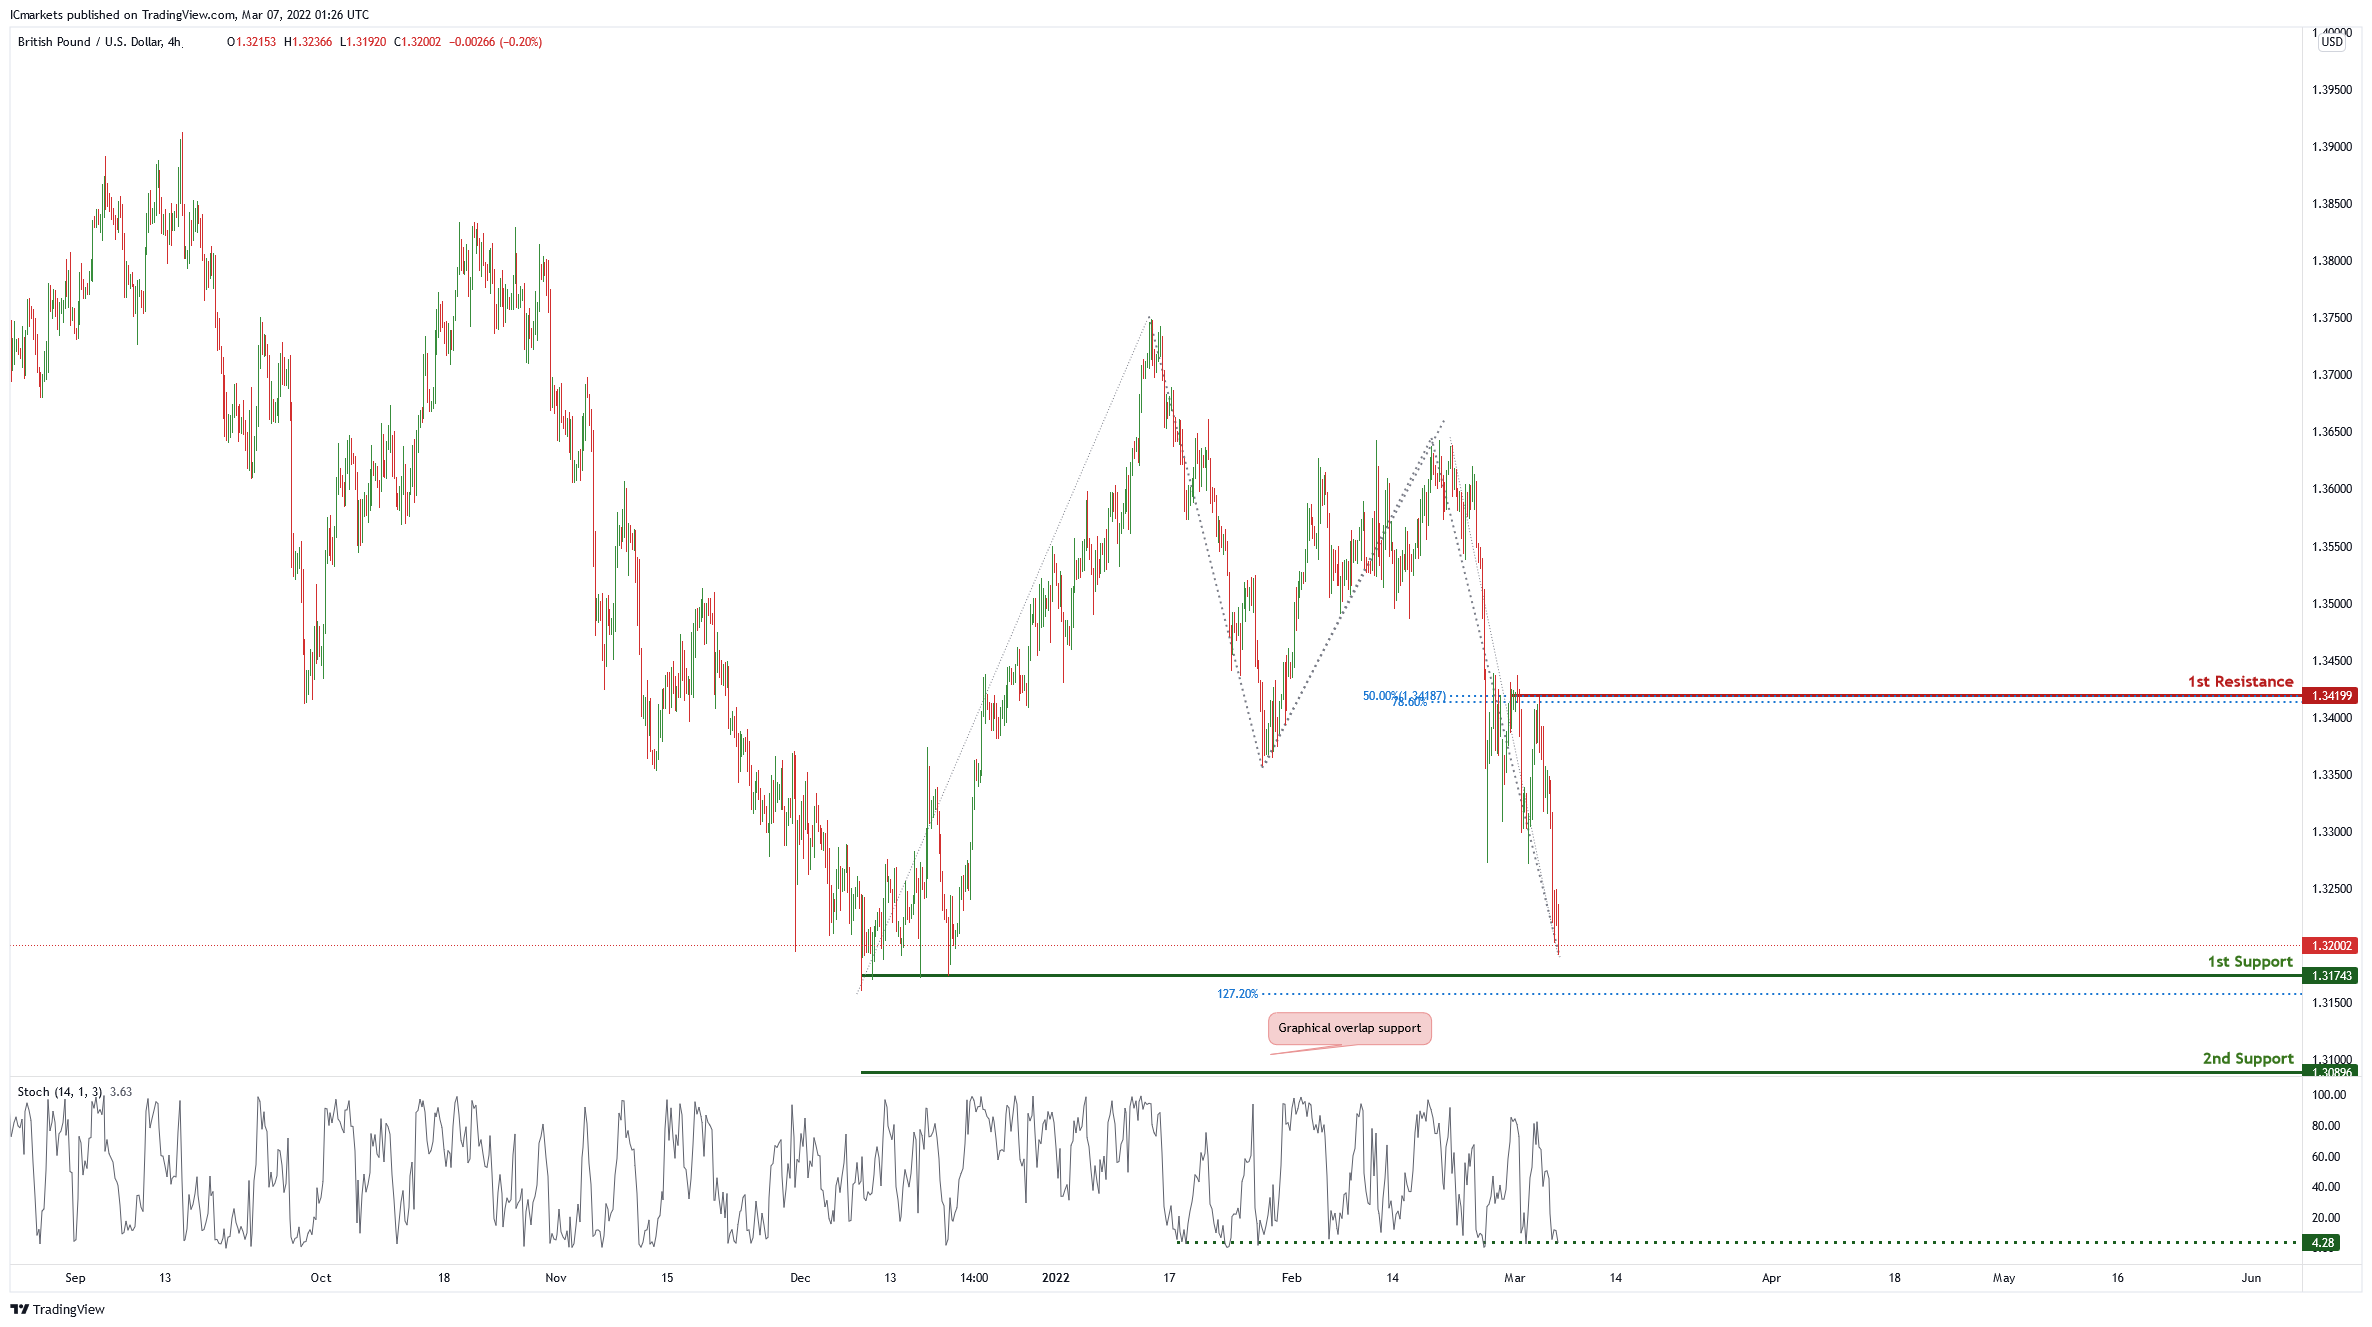
On the H4 chart price is near 1st support level of 1.131743 in line with 127.2% Fibonacci projection and graphical swing low. Price can potentially bounce from 1st support to 1st resistance level of 1.34199 in line with 50% Fibonacci retracement and 78.6% Fibonacci projection. Our bullish bias is supported by stochastic as it is a support level
Areas of consideration
- H4 1st resistance at 1.34199
- H4 1st support at 1.31743
USD/CHF:
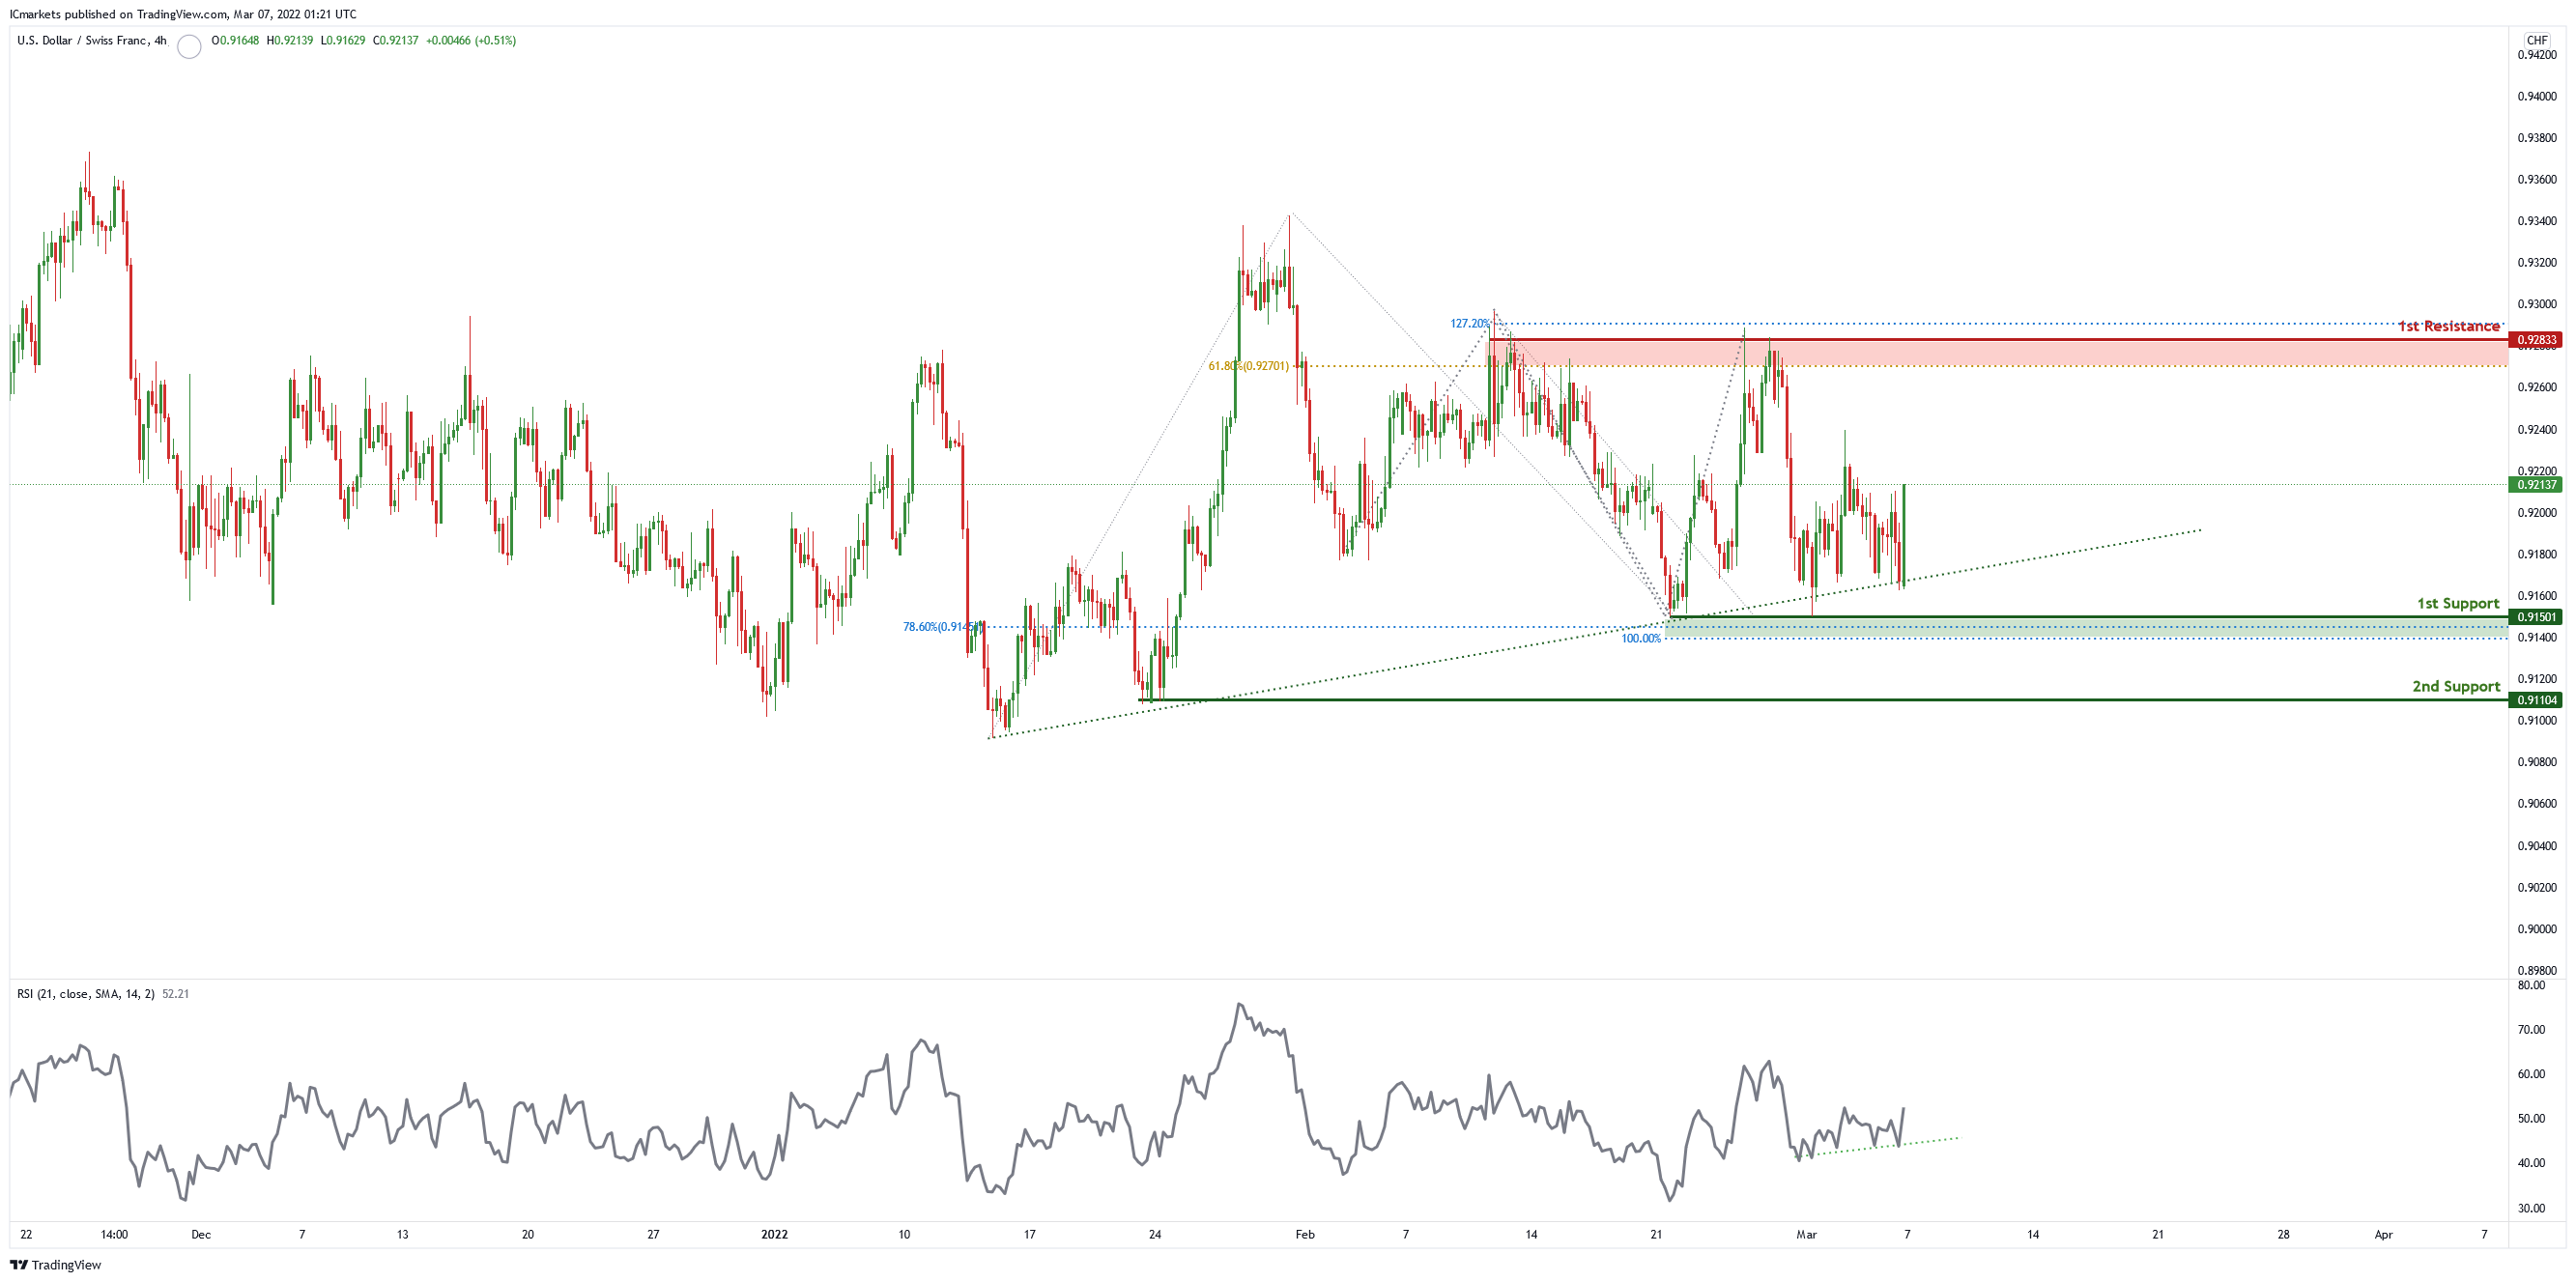
On the H4, price is abiding by an ascending trendline and near 1st support level of 0.91501 in line with 78.% Fibonacci retracement and 100% Fibonacci projection. Price can potentially bounce to the 1st resistance level of 0.92251 in line with 61.8% Fibonacci retracement and 127% Fibonacci projection. Our bullish bias is supported by the stochastic indicator as it is at support level.
Areas of consideration
- 1st support level at 0.91501
- 1st resistance level at 0.92833
EUR/USD :
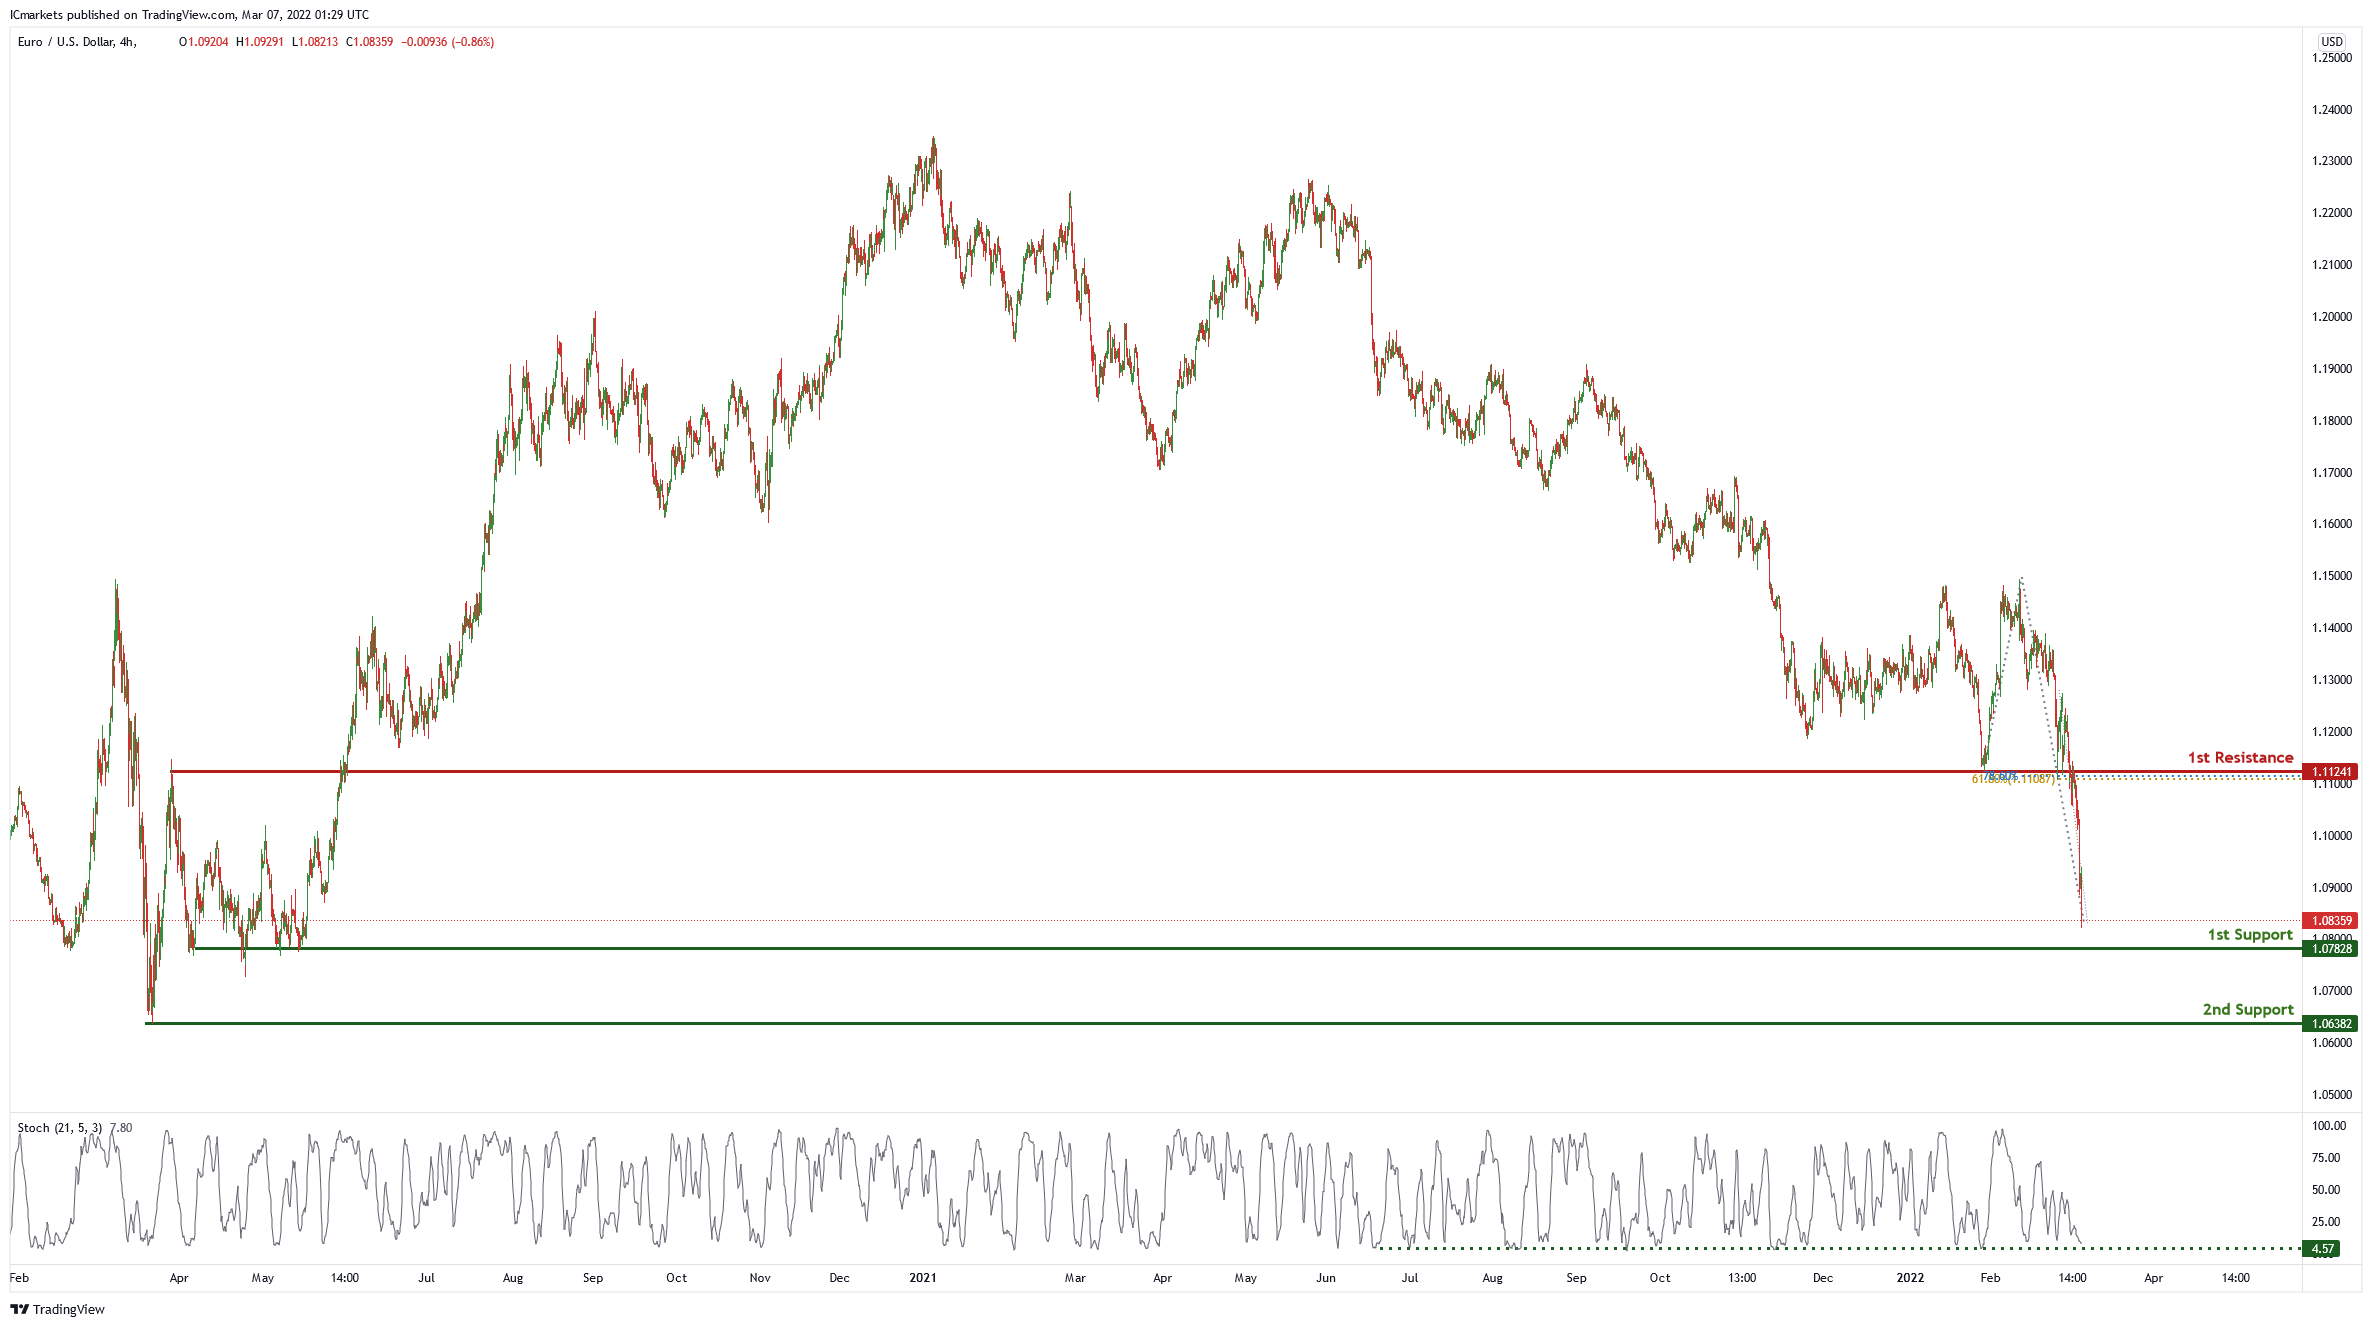
On the H4 chart price is near 1st support level of 1.07828 in which is also the graphical overlap support. Price can potentially bounce from this support level to 1st resistance of 1.11241 in line with 78.6% Fibonacci projection and 61.8% Fibonacci retracement. Our bullish bias is supported by the stochastic indicator as it is at support level.
Areas of consideration :
- H4 1st resistance at 1.11241
- H4 1st support at 1.07828
USD/JPY:
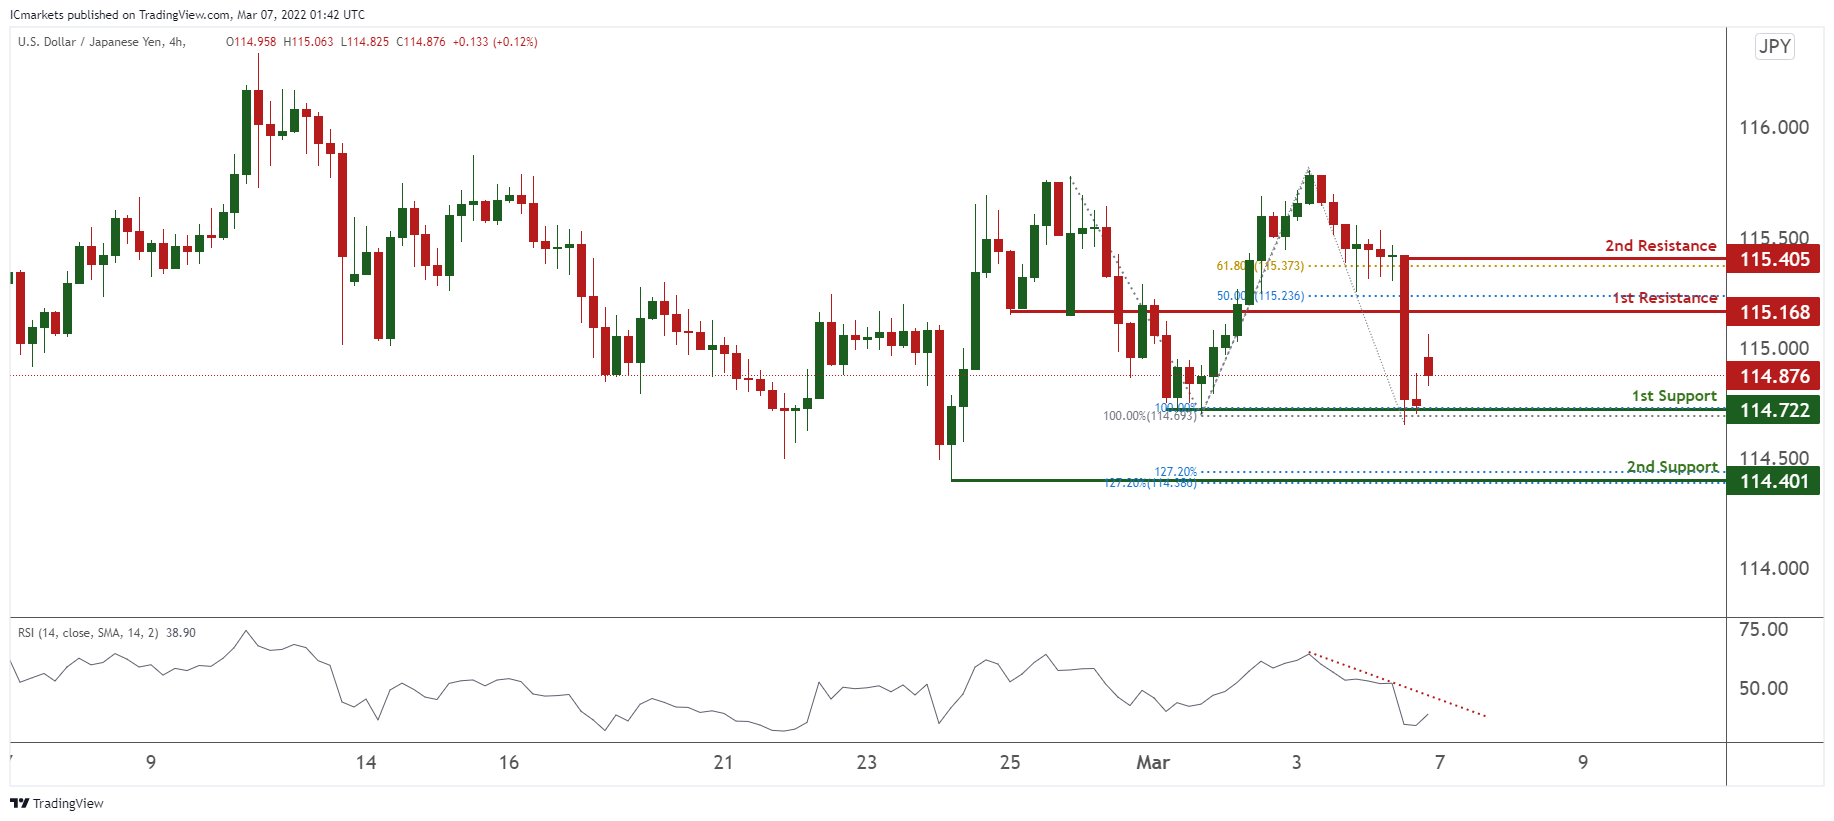
On the H4 timeframe, prices are forming a potential double top. We see the potential for further bearish momentum from our 1st resistance at 115.168 in line with 50% Fibonacci retracement towards our 1st support at 114.722 which is in line with 100% Fibonacci retracement and 100% Fibonacci extension. Our bearish bias is RSI being on bearish momentum.
Areas of consideration:
- H4 time frame, 1st resistance at 115.168
- H4 time frame, 1st support at 114.722
AUD/USD:
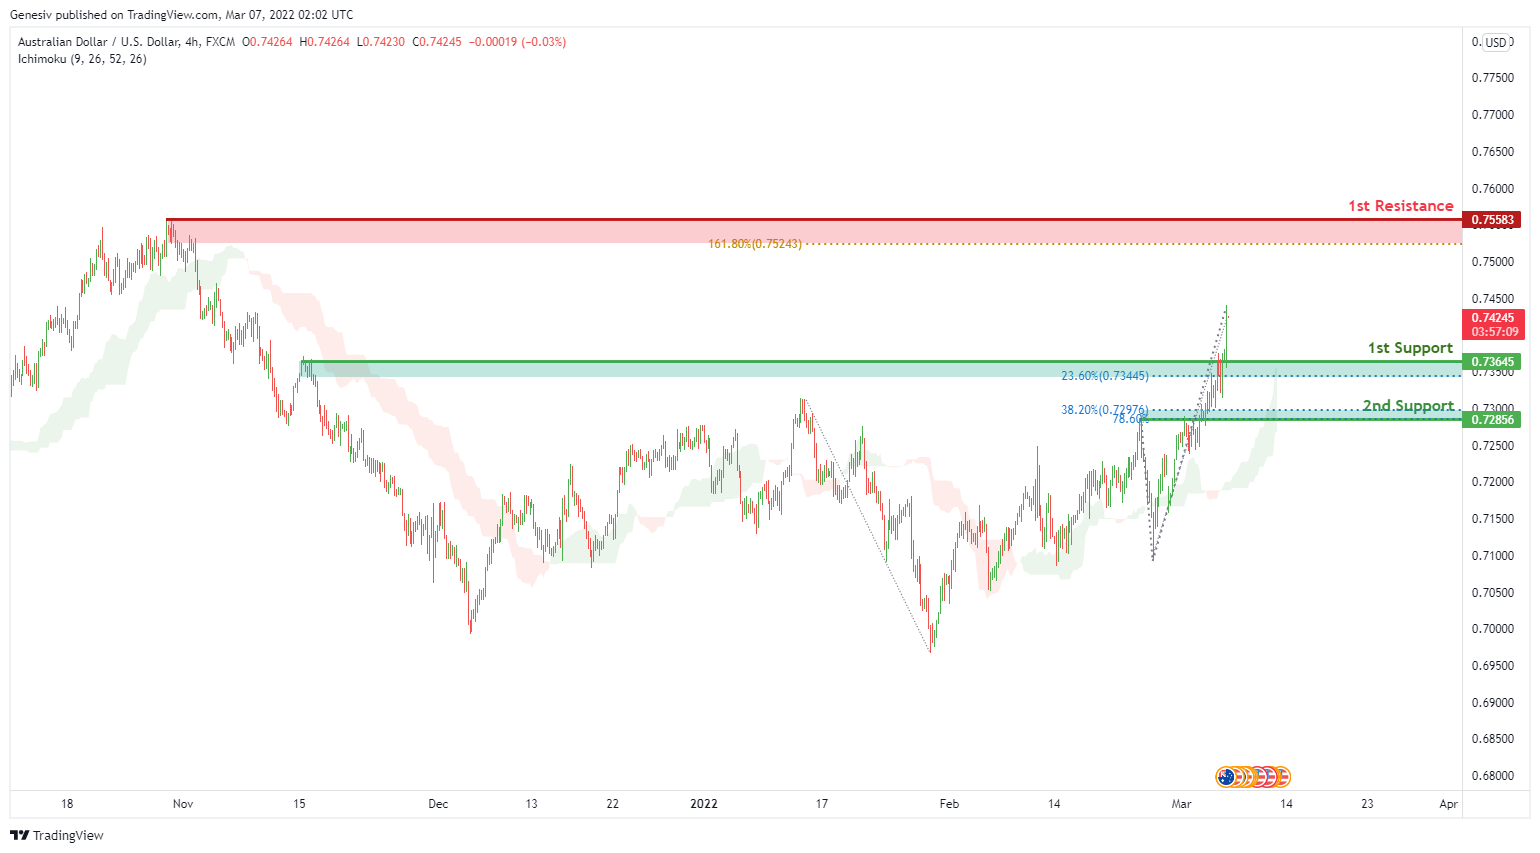
On the H4 timeframe, we see the potential for further bullish momentum from our 1st support at 0.73645 in line with 23.6% Fibonacci retracement towards our 1st resistance at 0.75583. which is in line with 161.8% Fibonacci extension. Our bullish bias is further supported by prices trading above the Ichimoku cloud. Alternatively, prices from 1st support might dip to 2nd support at 0.72856 in line with 38.2% Fibonacci retracement and 78.6% Fibonacci projection.
Areas of consideration :
- H4 1st support at 0.73645
- H4 1st resistance at 0.72856
NZD/USD:
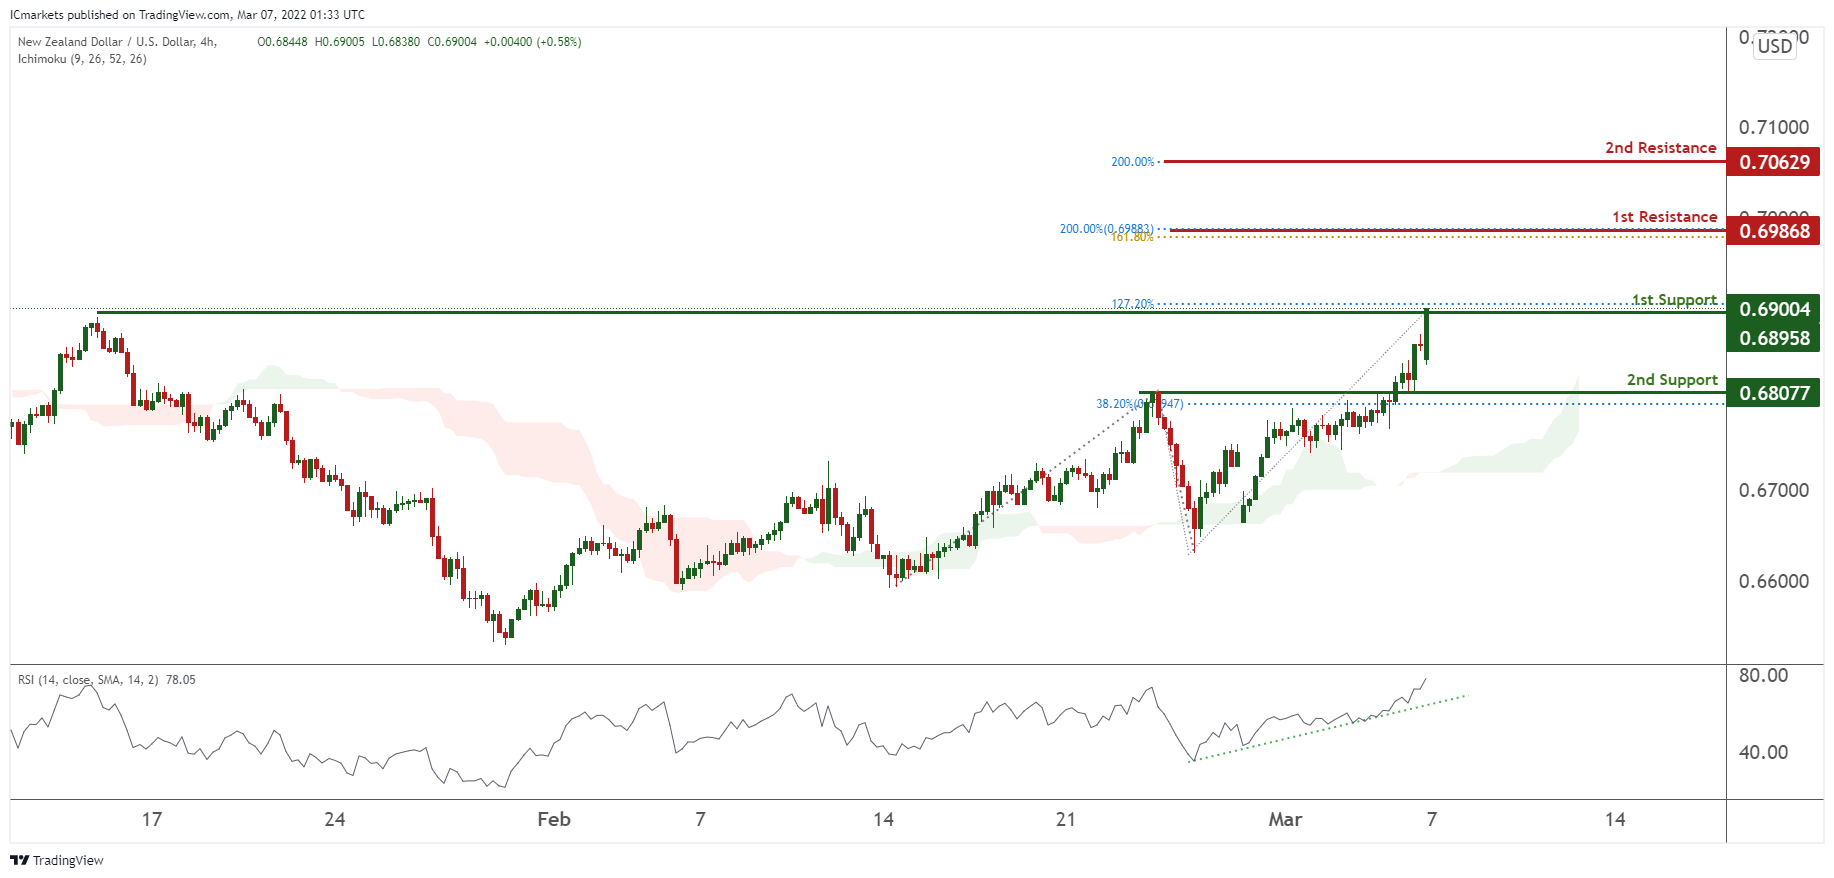
On the H4 chart, prices are on bullish momentum. We see the potential for further bullish momentum from our 1st support at 0.69004 in line with 127.2% Fibonacci extension towards our 1st resistance at 0.69868 in line with 161.8% Fibonacci Projection and 200% Fibonacci Projection. Our bullish bias is further supported by prices trading above our ichimoku cloud support and also RSI being on bullish momentum. Alternatively, prices may dip towards our 2nd support at 0.68077 in line with 38.2% Fibonacci retracement.
Areas of consideration:
- H4 time frame, 1st resistance at 0.69868
- H4 time frame, 1st support at 0.69004
USD/CAD:
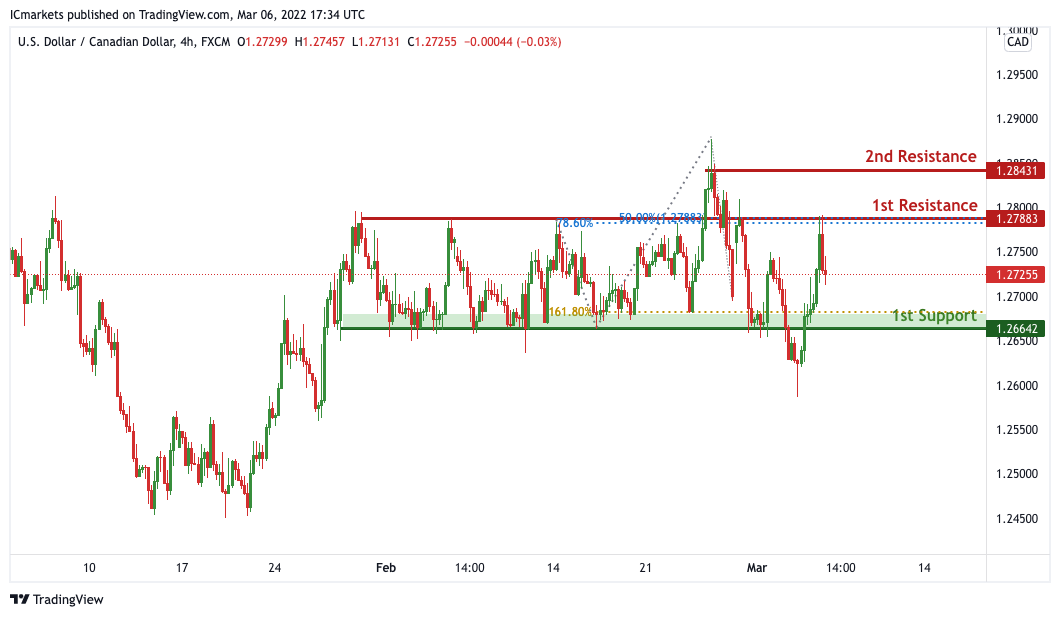
On the H4, with price having no clear indication of where it’s headed for, we have a bias that price will continue to range within our support and resistance of 1.27883 and 1.26642.
Areas of consideration:
- H4 time frame, 1st support at 1.26642
- H4 time frame, 1st resistance at 1.27883
OIL:
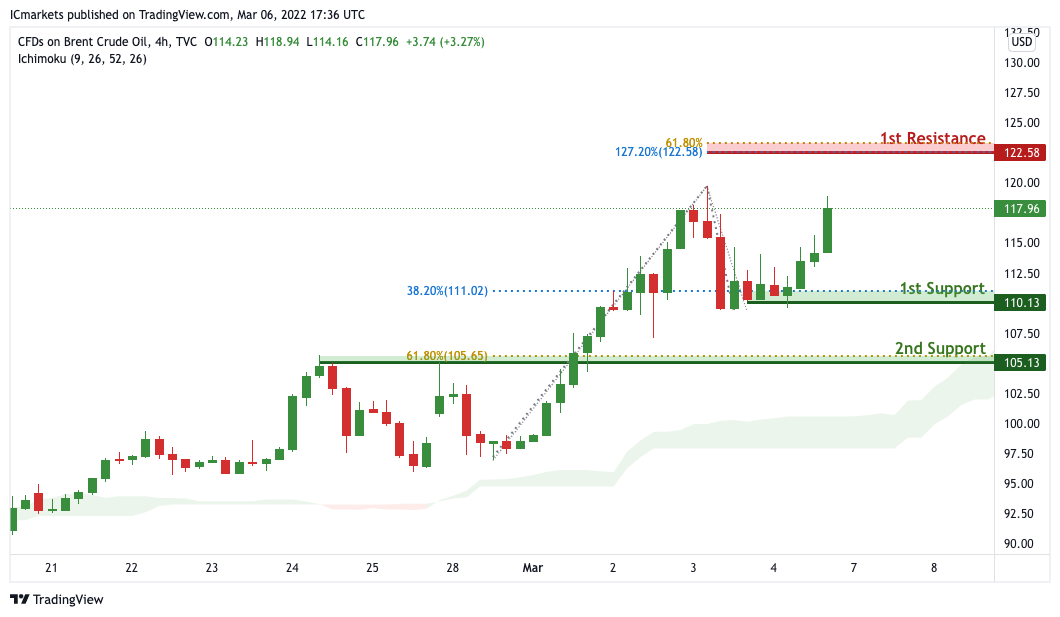
On the H4 timeframe, price is near 1st support level of 110.13 in line with horizontal overlap support and 38.2% Fibonacci retracement. Price can potentially rise to the 1st resistance level of 122.58 in line with the 127.2% Fibonacci extension and 61.8% Fibonacci projection. Alternatively, price may break 1st support and head for 2nd support at 105.13. Our bullsh bias is supported by how price is moving above the ichimoku cloud.
Areas of consideration:
- H4 time frame, 1st resistance of 122.58
- H4 time frame, 1st support of 106.99
Dow Jones Industrial Average:
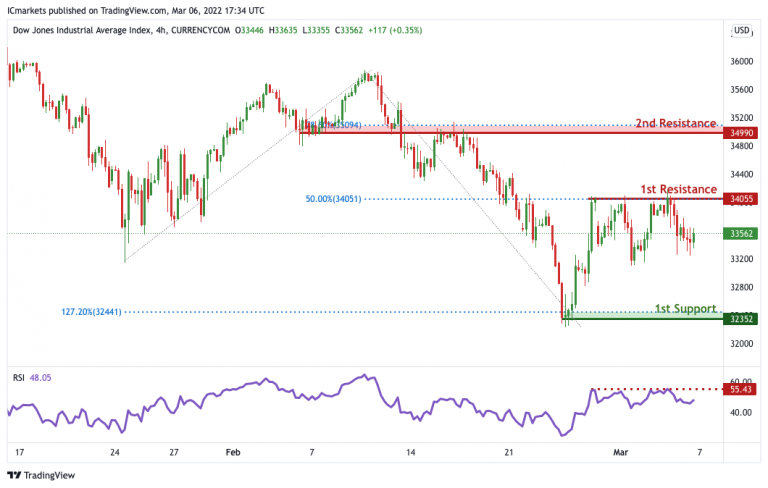
On the H4 timeframe, We see the possibility of bearish continuation from our 1st resistance at 34055 in line with horizontal overlap resistance towards our 1st support at 32352 in line with the horizontal swing low support. Alternatively, price may break 1st resistance and head for 2nd resistance at 34990 in line with the 78.6% Fibonacci retracement level. Our bearish bias is further supported by how price is expected to reverse off the RSI indicator.
Areas of consideration :
- H4 1st support at 32352
- H4 1st resistance at 34055
EUR/USD Nosedives, Gold and Oil Outperform
Key Highlights
- EUR/USD extended decline below the 1.1120 support zone.
- A key bearish trend line is forming with resistance near 1.1180 on the 4-hours chart.
- Gold is eyeing upside break to $2,000, and oil price broke the $125.00 resistance.
- GBP/USD traded below the key 1.3280 support zone.
EUR/USD Technical Analysis
The Euro started a major decline after it failed to surpass 1.1300 against the US Dollar. EUR/USD gained bearish momentum after it broke the 1.1120 support zone.
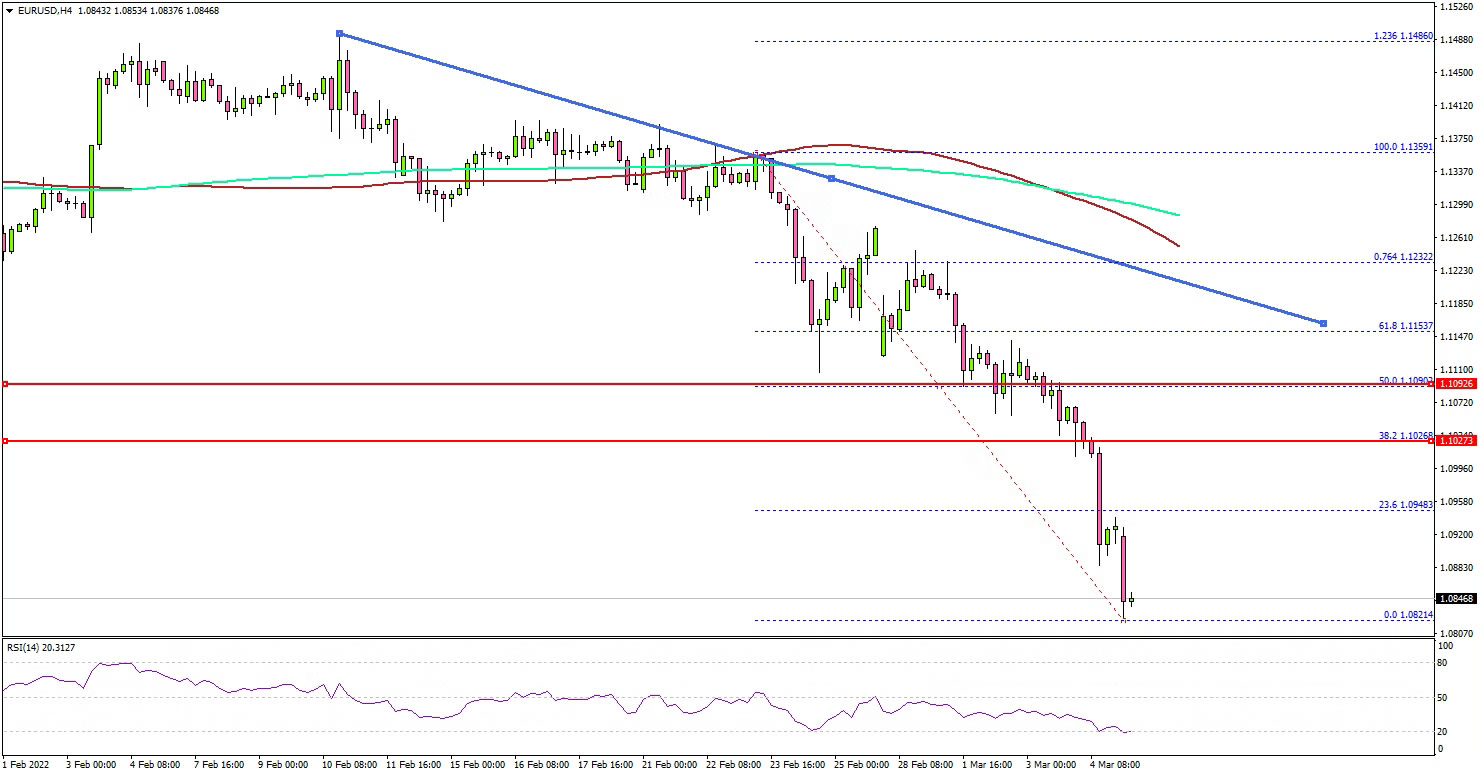
Looking at the 4-hours chart, the pair settled below the 1.110 level, the 100 simple moving average (red, 4-hours), and the 200 simple moving average (green, 4-hours).
There was a clear move below the 1.1050 support zone. It even spiked below the 1.1000 level and is showing a few bearish signs. If there is a recovery wave, the pair could face resistance near the 1.100 level.
The next major resistance is near the 1.1060 level. To start a decent recovery wave, EUR/USD must clear the 1.1060 and 1.1080 resistance levels.
If not, the pair might continue to move down below the 1.0880 support zone. The next key support is near 1.0820 level, below which there is a risk of a move towards the 1.0750 level.
Looking at GBP/USD, the pair extended decline below the 1.3280 and 1.3250 levels. Conversely, gold and oil prices rallied above major hurdles near $1,950 and $125.00.
Economic Releases
- German Retail Sales for Jan 2022 (MoM) – Forecast +1.5, versus -5.5% previous.
- German Retail Sales for Jan 2022 (YoY) – Forecast 9.5%, versus 0% previous.
- German Factory Orders for Jan 2022 (MoM) – Forecast +1.0%, versus +2.8% previous.
EURUSD Elliott Wave : Calling The Decline After Irregular Flat Pattern
Hello Fellow Traders. In this technical blog we’re going to take a look at the Elliott Wave charts charts of EURUSD forex pair published in members area of the website. The pair is trading within the cycle from the January 2021 peak which is having the form of impulsive structure. Recently the pair corrected the short term cycle from the September 2021 peak. Recovery unfolded as Elliott Wave Irregular Flat structure. Once target area was reached, EURUSD found sellers as expected and we got turn lower. In further text we’re going to explain the forecast and Elliott Wave Pattern.
Before we take a look at the real market example of Expanded Flat, let’s explain the pattern in a few words.
Elliott Wave Expanded Flat Theory
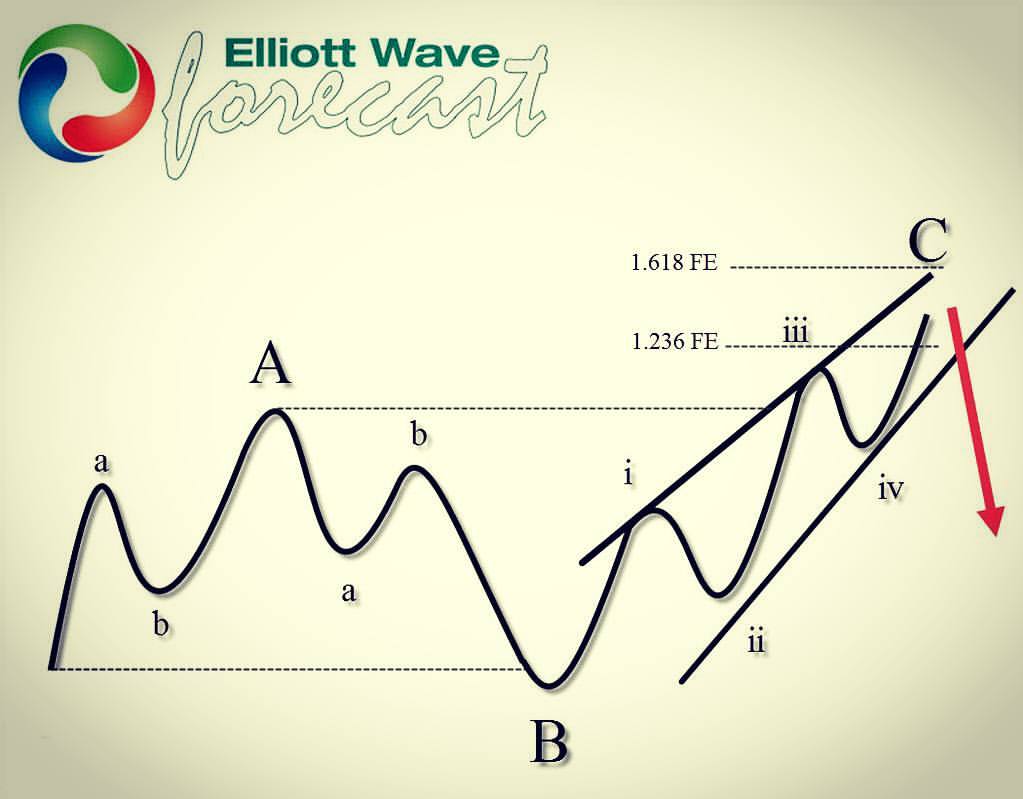
Elliott Wave Flat is a 3 wave corrective pattern which could often be seen in the market nowadays. Inner subdivision is labeled as A,B,C , with inner 3,3,5 structure. Waves A and B have forms of corrective structures like zigzag, flat, double three or triple three. Third wave C is always 5 waves structure, either motive impulse or ending diagonal pattern. It’s important to notice that in Irregular Flat Pattern wave B completes below the starting point of wave A. Wave C ends above the ending point of wave A . Wave C of Flat completes usually between 1.00 to 1.236 Fibonacci extension of A related to B, but sometimes it could go up to 1.618 fibs ext.
At the graphic below, we can see what Expanded Flat structure looks like
Now, let’s take a look what Elliott Wave Flat Pattern looks like in the real market
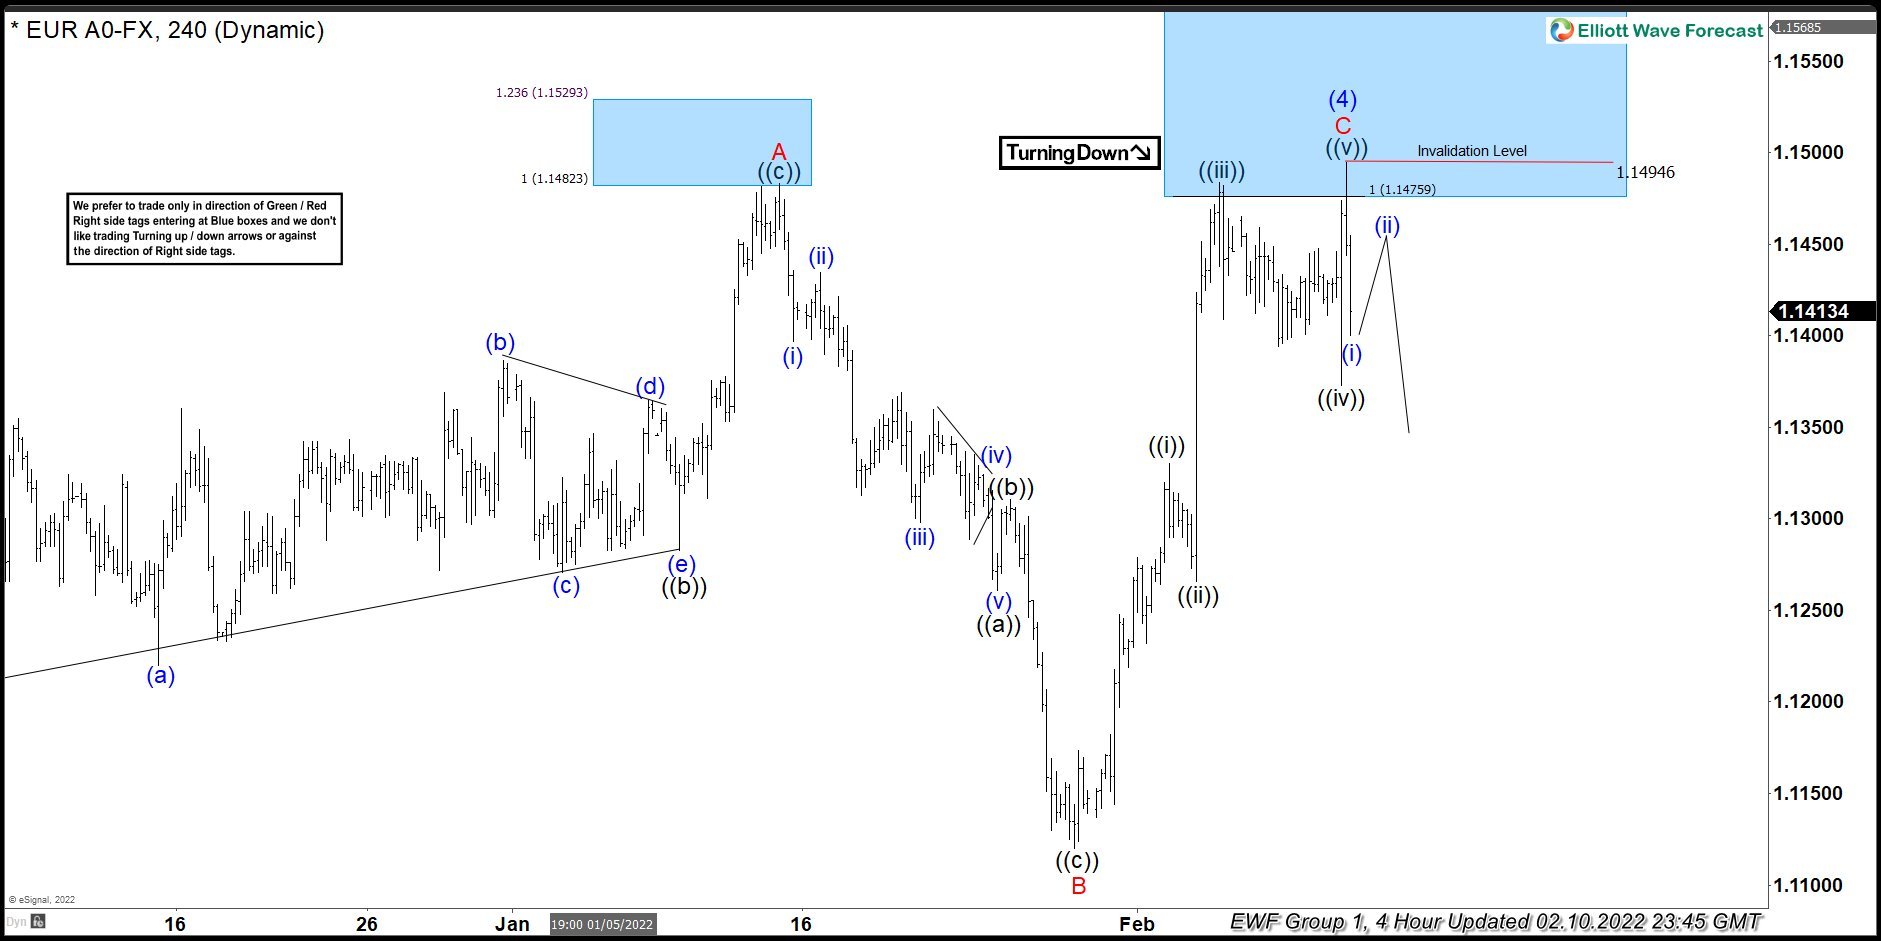
EURUSD 4h Hour Elliott Wave Analysis 2.10.2022.
EURUSD has given us recovery against the September 2021 peak. Waves A and B red are showing corrective sequences. Wave B red has broken the starting point of A red, which makes this Flat Irregular. At this stage we can see that the price has reached equal legs area A-B at 1.14759 which is minimum requirement for a correction to complete. We can already count clear 5 waves up from the recent low: 01.28.- B red, which is the last leg C red of proposed (4) blue recovery. Wave (4) correction looks to be completed at 1.14946 high as Elliott Wave Flat Pattern. We would like to see further separation lower against that peak. As our members know, flat patterns can be tricky to trade. We rather avoid forcing trades when corrections are having forms of Flats.
EURUSD 4h Hor Elliott Wave Analysis 2.10.2022.
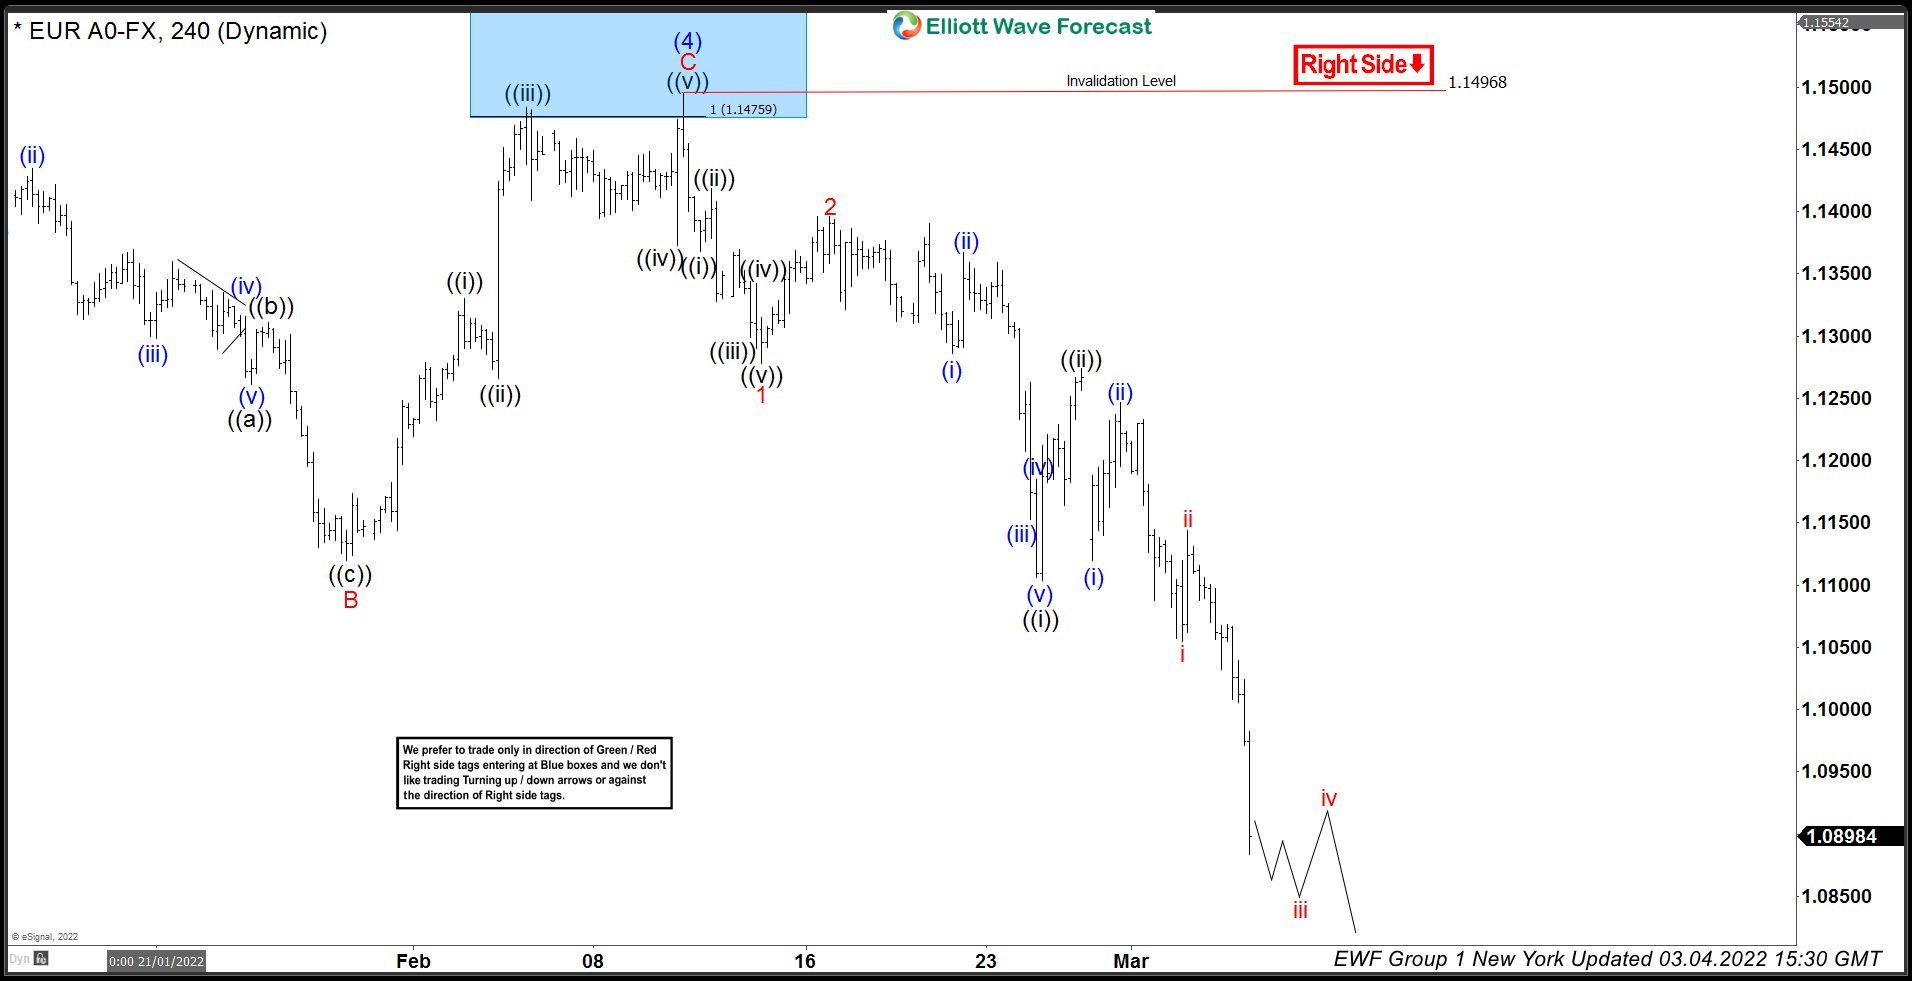
1.14946 high held nicely during the short term bounces. The pair made further decline as we expected. Eventually EURUSD broke the previous low: January 28th, which made bearish sequences again in the pair. EURUSD is now bearish against the 1.14968 pivot, and remains sell in short term rallies in 3,7,11 swings.
Keep in mind that market is dynamic and presented view could have changed in the mean time. You can check most recent charts in the membership area of the site. Best instruments to trade are those having incomplete bullish or bearish swings sequences. We put them in Sequence Report and best among them are shown in the Live Trading Room.
Week Ahead Preview: 7 March 2022
The new week has started with a bang, with stocks tumbling and crude oil soaring at the Asian open overnight as traders woke up to weekend news that the US and its allies are discussing a coordinated embargo on Russian crude supplies, while trying to prevent a global supply shock. The news saw Brent oil soar 17% and lifted it near the $140 handle, some 20 bucks higher than the previous week’s high, before prices quickly erasing some of those massive gains. Stock index futures slumped with the DAX futures slipping another 3% while US futures all lost over 1% each. Safe haven gold and government bonds gained further ground, as yields slipped further.
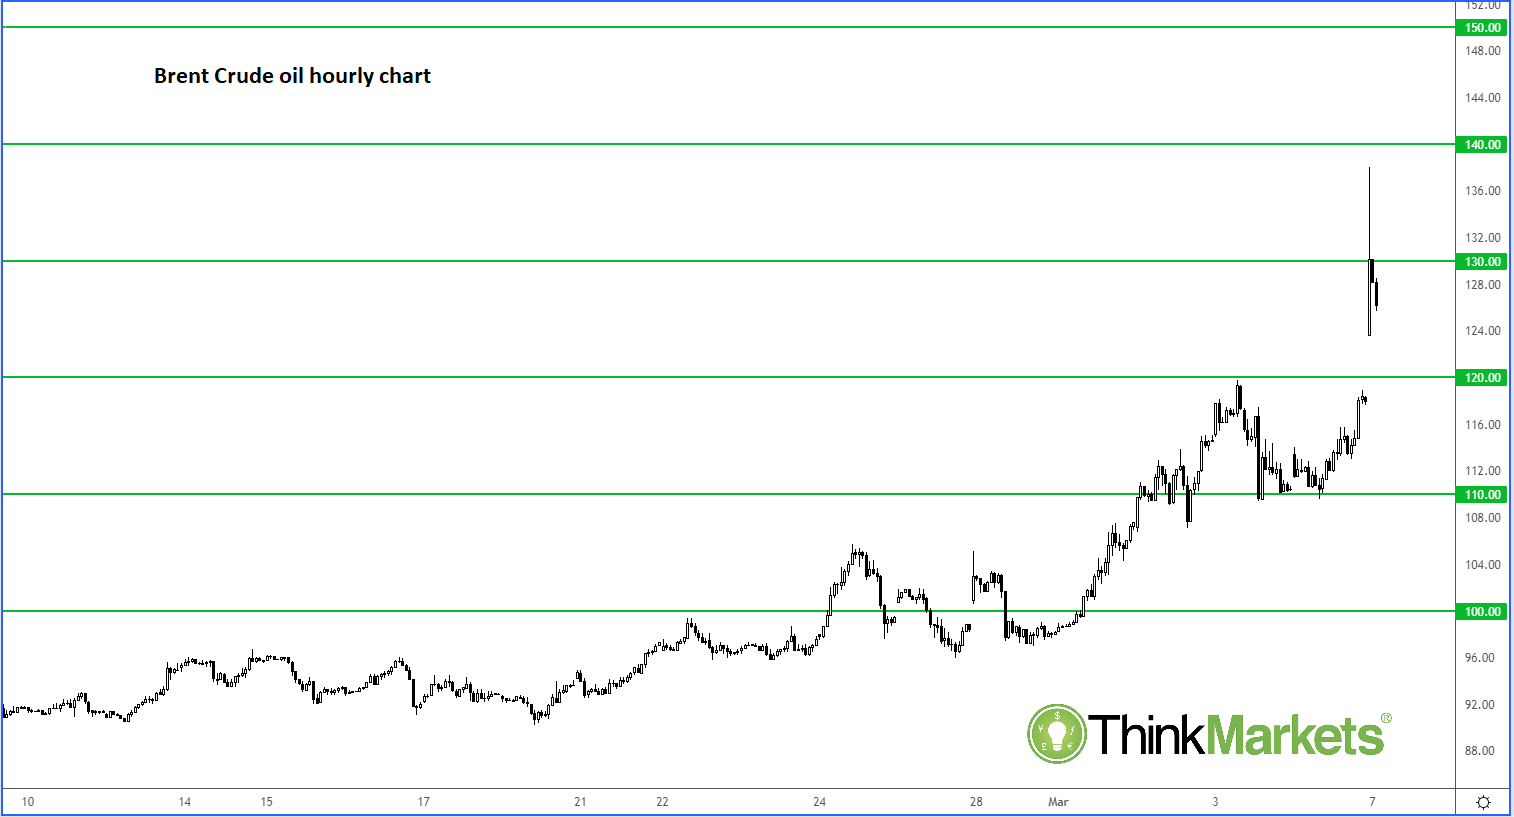
Source: ThinkMarkets and TradingView.com
The latest falls come on the back of continued conflict in Ukraine and a growing list of Western sanctions on Russia. These events have roiled the markets in recent weeks, sending commodity prices surging higher on fears over supply shortages. Extremely high energy prices, and well as other commodities like wheat and corn threaten to stall global growth, which is why we are seeing so much weakness in risk appetite. European stocks have sunk due mainly to their huge exposures to Russia, and fears the situation is going to tip the Eurozone into a period of stagflation. The DAX for example has now erased its entire 2021 gains in the space of just 58 days, slumping back below the pre-pandemic high of around 13830.
Ukraine situation remains keys event
So, as we have already seen, it is once again all about Ukraine and sanctions from the West on Russia that is going to dominate the agenda once again this week. The ECB meeting and US CPI data aside, nothing else is going to matter this week, you would feel. The focus will be fixated on the Ukrainian situation and unless something changes dramatically, I am expecting risk aversion to remain the dominant theme. Any rebound we might see in the stock markets should be taken with a pinch of salt, while there is no resolution in the conflict.
ECB policy decision (Thursday)
With regards to the ECB’s decision, will the market certainly don’t expect to hear any hawkish surprises from Christine Lagarde and her colleagues. They are facing a major dilemma, like all other major central banks. With the euro having slipped below $1.10, the market is convinced there will not be any rate hikes this year at all.
So, after the ECB's hawkish pivot at the February meeting, are we going to see yet another twist? It all depends on how the ECB will see the situation in Ukraine and Russia impacting growth and inflation. Had it not been for the intense geopolitical situation, the ECB would have probably talked up the first rate hike in H2 because of the recent improvement in data and surging inflationary pressures. At this meeting, the ECB is likely to go ahead with ending PEPP but warn that the outlook could change depending on what happens with in the Ukraine situation. It is possible that if tensions de-escalate quickly, the ECB will probably turn hawkish quickly. A gradual and flexible approach to monetary policy normalisation is the message we will likely hear from the ECB President Lagarde.
US Feb CPI (Thursday)
Consumer prices are expected to have risen further, to +7.8% in annualised basis from +7.5% previously.
But will it matter how hot CPI is going to be? Fed Chair Jay Powell has already come out and said he will recommend a 25 basis point hike at their meeting later this month. Inflationary pressures are surging. This week, we have seen commodities such as crude oil, wheat and corn rise massively, along with aluminium and a few other base metals. This is all to do with Russia’s invasion of Ukraine, fuelling fears of supply crunches.
The US is relatively less impacted economically by the situation between Ukraine and Russia, compared to, for example, Germany. This means, the Fed is going to go ahead with its rate hike.