Sample Category Title
Here’s Why USD/JPY Could Revisit 116.40
Key Highlights
- USD/JPY is showing positive signs above 115.20.
- A key bullish trend line is forming with support at 115.20 on the 4-hours chart.
- EUR/USD extended decline and traded below 1.1080.
- The US nonfarm payrolls could increase 400K in Feb 2022.
USD/JPY Technical Analysis
The US Dollar remained well bid above the 114.50 level against the Japanese Yen. USD/JPY started a fresh increase and was able to surpass 115.00.
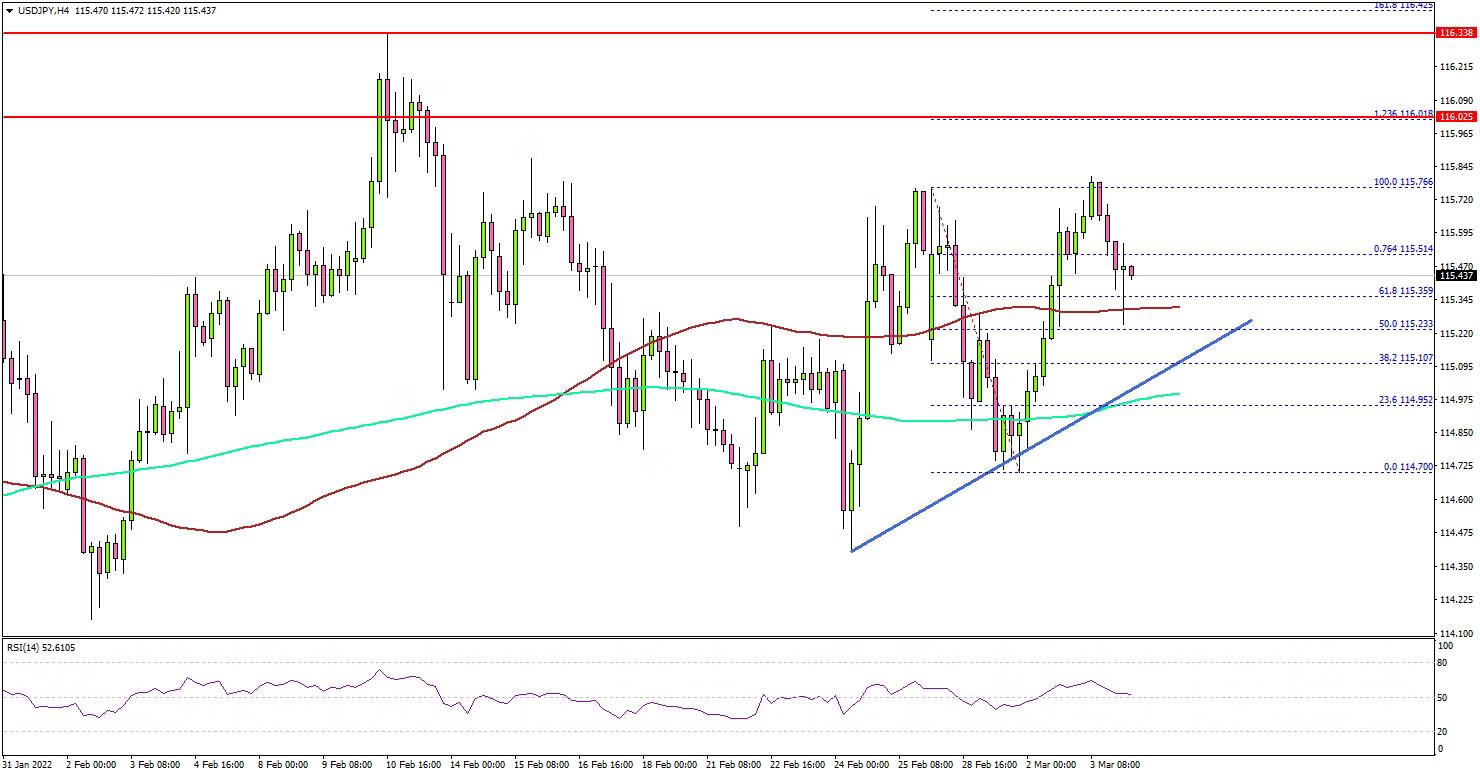
Looking at the 4-hours chart, the pair traded above the 115.20 resistance, the 100 simple moving average (red, 4-hours), and the 200 simple moving average (green, 4-hours).
There was a clear move above the 76.4% Fib retracement level of the downward move from the 115.76 swing high to 114.70 low. It is now showing positive signs above the 115.20 level. There is also a key bullish trend line forming with support at 115.20 on the same chart.
On the upside, the pair is facing a strong resistance near the 116.00 zone. The next major resistance sits near the 116.40 level. A close above 116.40 might start a strong move towards 117.20.
If not, the pair might correct lower below the trend line support. The next key support is near 114.95 and the 200 simple moving average (green, 4-hours), below which USD/JPY could revisit 114.60.
Fundamentally, the US Services Purchasing Managers Index (PMI) for Feb 2022 was released yesterday by Markit Economics. The market was looking for no change in the PMI from 56.7.
The actual result was below the market forecast, as the US Services Purchasing Managers Index (PMI) declined from 56.7 to 56.5.
Looking at EUR/USD, the pair extended decline below the 1.1100 and 1.1080 levels. Besides, GBP/USD is struggling to stay above 1.3300.
Economic Releases
- US nonfarm payrolls for Feb 2022 – Forecast 400K, versus 467K previous.
- US Unemployment Rate for Feb 2022 - Forecast 3.9%, versus 4.0% previous.
Cliff Notes: Central Banks to Hike through 2022 amid Global Uncertainties
Key insights from the week that was.
Australia received a run of robust data this week as global markets remained focused on the terrible developments in Ukraine and their global repercussions.
The prime data release for Australia in the past 7 days was the Q4 GDP report. A strong 3.4% gain was recorded for activity in the three months to December, leaving annual growth at 4.2%. The primary driver of this gain was a resurgent consumer in NSW and Victoria, consumption rising 11% and 7.5% in the two states as delta restrictions were removed for a 6.3% national gain.
Restrictions and supply shortages weighed on housing investment in the quarter, though it still ended 2021 5.3%yr higher. A similar narrative applies for business investment (-0.3%; +5.4%yr); the outlook for this sector is also healthy, with Australian businesses positive on the domestic outlook and cognisant of limited existing excess capacity. For 2022, the still-elevated savings rate and strong labour market are big positives for consumption and investment alike, particularly facing into a monetary tightening cycle.
On monetary policy, this week’s RBA meeting communications highlighted the underlying strength of the Australian economy, but also the immense uncertainty facing the world owing to Russia’s invasion of Ukraine. Specifically, the broadening of the discussion around wages recognises the limitations of the headline Wage Price Index and the greater momentum being shown in other measures of labour costs that incorporate bonuses and promotion-related pay rises.
On Ukraine, the Governor stated that “the war in the Ukraine is a major new source of uncertainty” and “how long it takes to resolve the disruptions to supply chains is an important source of uncertainty regarding the inflation outlook, as are developments in global energy markets.” Chief Economist Bill Evans subsequently investigated these themes in depth in a video update.
Of the other Australian data out this week, the Balance of Payments (BOP) release was most notable. With respect to trade, in Q4 2021, Australia experienced its 11th consecutive quarterly surplus; while smaller than Q3, it was still sizeable at 2.3% of GDP. Commodity prices are behind this trend, the past 3 years seeing a 17% increase in export earnings on the back of a 30% gain in prices.
Of course, the other half of the BOP release is detail on Australia’s financial position, another big positive for our nation. Direct investment in Australia has rallied strongly from the early days of the pandemic, with annualised inflows from foreign investors in the second half of 2021 back above the average of the 5 years prior to the pandemic – a period of strength. Australia’s proximity to Asia and the opportunities created by global recovery bodes well for a continuation of this trend.
The other major positive for Australia’s long-term health is that Australian investors continue to invest offshore in equity investments, at pace. Our workforce’s commitment to building wealth through superannuation and the sector’s global investment mandate is key here, but the momentum in investment signals households are investing offshore in excess of super. Combined with the savings held domestically at banks, this wealth bolsters the prospects for future consumption.
The strength of commodity prices, opportunities in Asia and investment inflows into Australia are all constructive for the Australian dollar. Notably, despite a further escalation of tensions in Ukraine and consequent uncertainty over the economic outlook for Europe and inflation globally, the Australian dollar appreciated over the past week from around USD0.7180 as our Weekly went to press on Westpac IQ to around USD0.7320 currently.
While we still see a setback for the Australian dollar as the FOMC tightens policy ahead of the RBA in coming months, a return to USD0.73 is expected by year end and a push up to USD0.78 is forecast by end-2023. Arguably, recent developments for commodities and the desire of authorities to promote robust activity point to upside risks for our currency over the forecast period.
Then to developments in the US. Speaking before House and Senate Committees this week, FOMC Chair Powell made clear that the FOMC would continue to carefully assess the implications of Russia’s invasion of Ukraine but believe the strength of the US economy and inflation risks warrant commencing policy tightening at their March meeting.
A 25bp rate hike is expected at that meeting, and the Committee is also set to give guidance on the speed and timing of balance sheet reduction. We expect the latter to begin in Q2, around the time of the second and third rate hikes for this cycle (May and June). Thereafter, the combined effect of these two forms of policy tightening on financial conditions and a rapid reduction in inflation and related risks will see rate hikes move to a quarterly schedule until a fed funds rate peak of 1.875% in June 2023. A positive spread between fed funds and the US 10-year is expected to remain in place throughout the forecast period, with US growth at or above trend and inflation converging to target.
President Biden’s State of the Union address and subsequent sanctions against Russia’s oligarchs continued to build pressure on Russia this week. However, it is the sanctions on the Russian central bank combined with the removal of some Russian banks from SWIFT that has done the most damage to their economy. The impact of these policies has been further accentuated by Western banks and corporates imposing their own restrictions/ bans on Russian entities.
In short, Russia’s central bank has lost access to most of its foreign reserves as these are invested/ held outside their borders and can therefore be withheld by their counterparties. Another large portion of their reserves are physical gold in Russia. While under their full control, these reserves also have little use unless a foreigner is willing to purchase or lease the asset – an unlikely outcome in the current circumstances. Russia’s central bank has therefore had to rely on capital controls and closing the stock market to limit the Ruble’s decline, further destabilising confidence.
Russia’s private sector therefore increasingly finds itself without access to foreign currency and global banks to finance trade. Shipping is also becoming more and more difficult given issues with insurance and trade finance. Russia’s access to foreign income is narrowing to the proceeds they receive from energy sales to Europe and elsewhere, which are exempt from the sanctions.
These developments are incredibly destabilising for Russia’s economy and can only be endured for a short period before considerable hardship is placed on ordinary Russian businesses and households. While a full ban of energy imports from Russia is highly unlikely given its significant share of global supply, there are growing calls from politicians in several nations, including the US, to cut Russia’s income by banning imports. Canada, which imports only a very small amount, has already banned crude oil imports. The global community continues to hope that a negotiated resolution to this conflict can be encouraged by their actions.
Gold Eyes $2K amid Ukraine conflict
Once again, investor optimism has faded quickly over the prospects of a ceasefire in Ukraine. Unsurprisingly, European stocks sank into the close, while safe-haven gold remained poised for a fresh breakout. There’s a growing understanding by European leaders that Russia will continue it operation in Ukraine until it achieves its goals. Macron, the French President, held a telephone conversation with Putin, but it looks like the talks were fruitless. Nothing else matters right now for the markets. Tensions between Russia and the West continue to wreak havoc across financial markets and the energy sector in particular, after oil prices nearly hitting $120 per barrel earlier, before easing back.
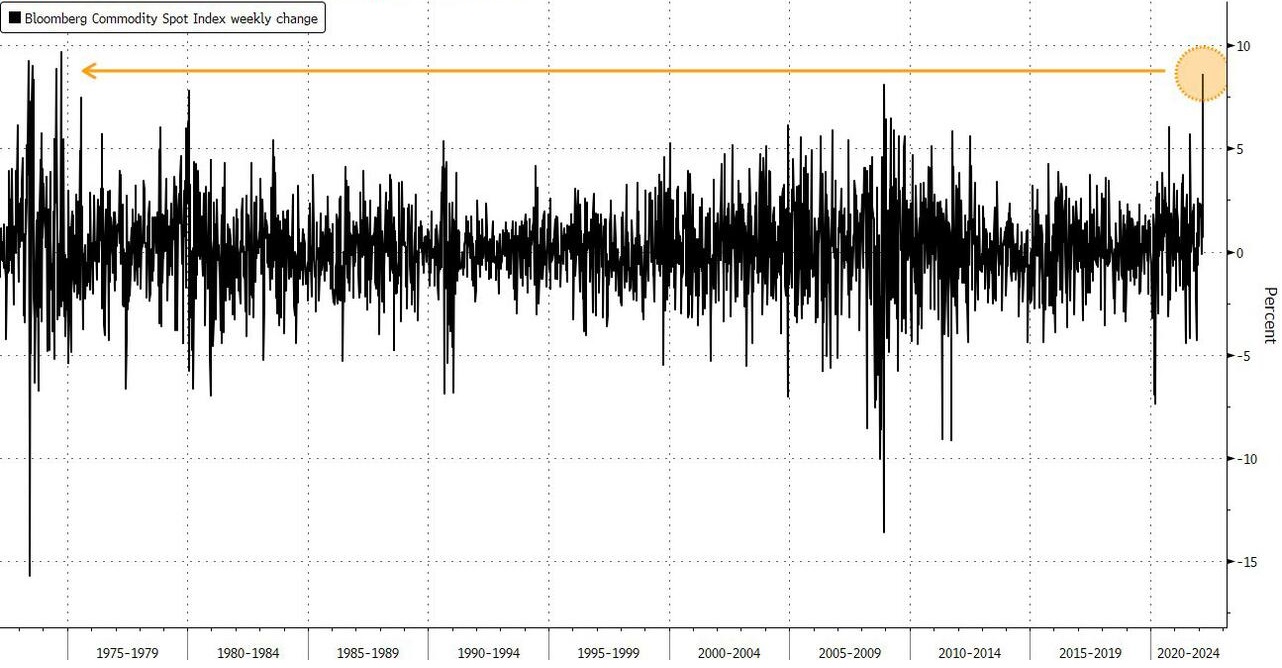
The Ukraine conflict has added another big source of support for gold, but the precious metal was already on the rise before all this happened. The metal, which has also found additional support from the recent fall in bond yields, was already looking bright amid soaring inflationary pressures. Today we saw further evidence of that, with Eurozone Producer Prices jumping another +5.2% on month. The day before, annual CPI came in at a fresh record high of 5.8%. If you thought inflation in US or Eurozone was very high, spare a thought for Turkey, where CPI jumped to a new 20-year high of 54.4% in February. Wheat prices have broken out, while other commodities have all soared. Indeed, the Bloomberg commodity spot index has had its best week since the 1973 oil crisis:
Source: Bloomberg
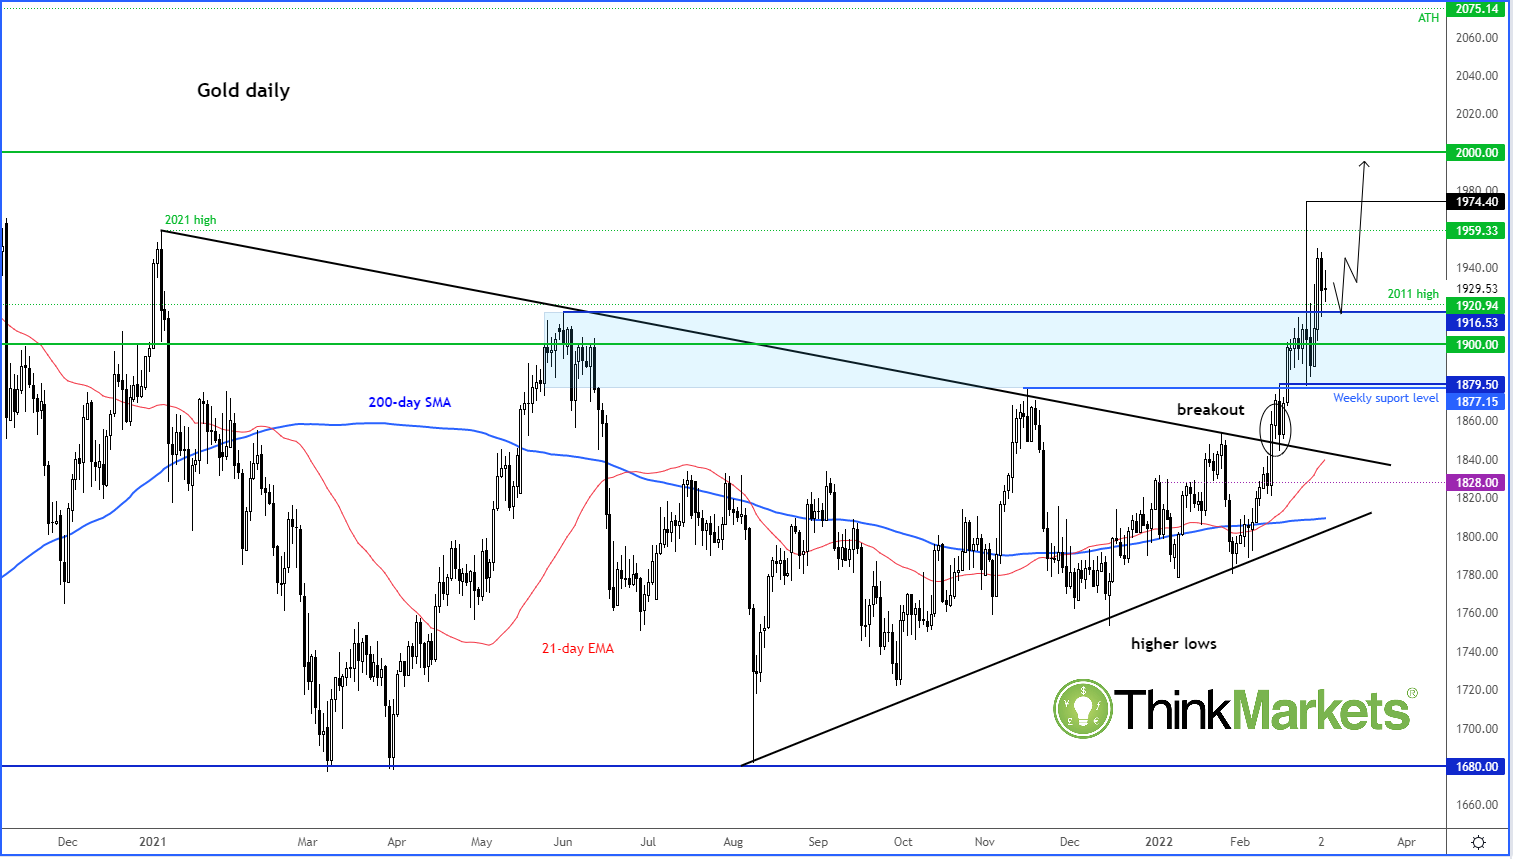
Against this backdrop, I am expecting gold to go well north of $2,000. The precious metal is currently consolidating its gains after the big breakout recently. But as nothing has changed fundamentally, I expect a continuation in the ongoing bullish trend.
Source: ThinkMarkets and TradingView.com
Oil Report: WTI Prices High Up in the Sky
WTI prices moved significantly higher in the latest sessions, capturing new multi-year high levels. The current week has been extremely favorable for Oil prices and the accompanied volatility seems to excite traders and market participants. This report can be used as a brief update of the Oil market, presenting the principal subjects that are motivating traders in the current moment. Through this Oil report we aim to provide clear and detailed information creating awareness among traders but also identifying important technical price levels.
We make a start with the weekly Oil market data from the US which is monitored by traders due to the fact that it can produce great opportunities. On the 1st of March the American Petroleum Institute inventory levels displayed a significant drawdown of -6.1M barrels. Upon release and in the next few minutes, WTI jumped approximately $0.6 and continued to ascend in the next hour. On the following day the 2nd of March the Energy Information Administration’s (EIA) Crude Oil inventories indicated a considerable drawdown of -2.6M barrels. Upon release WTI gained approximately $0.90 in the next few minutes. The market reaction on both occasions seems to provide evidence that traders remain prepared in anticipation of the releases and take action accordingly. In this case the drawdowns have traditionally supported Oil prices thus the outcome may have been somewhat foreseeable. On the other hand, during the past Friday the Baker Hughes Oil rig count showed an increase of 2 Oil rigs with the total number now reaching 522 active Oil rigs. Very interesting is the fact that some of the biggest Oil companies in the US, have decided to keep limited their production growth this year despite Oil prices sky rocketing and making it worth the risk. US firms seem to remain disciplined after a series of unprofitable years.
Yesterday the 26th OPEC and non-OPEC Ministerial Meeting took place and was also in the market’s focus with very low expectations for a change, however. The OPEC plus group remains dedicated to its conservative stance and the decision to adjust upward the monthly overall production by 0.4 mb/d for the month of April 2022 was confirmed.
On a separate note as a non-OPEC member, Russia’s military attacks on Ukraine are currently a great contributor to the recent Oil market volatility. With the ongoing tensions Oil traders are constantly following developments, as Russia remains a great Oil and Gas exporter to the world but especially to Europe. On Wednesday various media sources like Reuters noted that after excluding Russia from the SWIFT payment system, the US is now targeting Russia’s Oil industry. According to the report the US is putting pressure on Russia through its refining sector with new export curbs and targeted Belarus with sweeping new export restrictions. Russia remains among the top world producers and exporters of Oil to global markets. Regardless of the tensions in Ukraine, Oil demand continues to be on the rise. We do not see demand for Oil being reduced but rather the opposite. In this case, if Russia’s Oil trade is limited to the market due to restrictions, Oil prices may continue to be on the rise.
Finally, in the past days the International Energy Agency announced the coordinated effort to release 60 million barrels of Oil from their emergency stockpiles. The International Energy Agency is a Paris-based group that includes the U.S., Japan and much of Europe. This action could be indirectly sending a message that Russia’s restrictions to global Oil supply can be overcome with alternative sources.
Technical Analysis
WTI H1
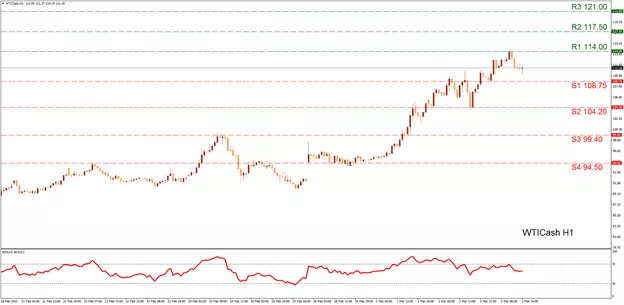
At the moment, WTI is retreating after testing the (R1) 114.00 resistance during today’s early European session. The (R1) is currently the multiyear high level for WTI and a possible breach above it can be a signal of a strong bullish interest. In this case traders could be searching for a target higher which can easily be the (R2) 117.50 level. However, if the bullish interest is extended abruptly then it may be more beneficial to focus on the (R3) 121.00 resistance hurdle. On the contrary, if the selling interest is increased then the (S1) 108.75 support level could be tested first as it was used in the past sessions as both a resistance and a support proving its relevance to recent price action. In an even more intense selling scenario we could see the (S2) 104.20 which was a distinctive support level tested yesterday. If the selling orders continue to reel in then the (S3) 99.40 could also be engaged. In our opinion, at this stage a breach below $100 per barrel could signal a selling interest with sideways tendencies. Very important is also the range between the (S3) 99.40 support and the (S4) 94.50 which was used broadly in the current week. The RSI indicator below our H1 chart seems to be in a decline for now, yet as the market continues to make new highs our personal bias remains bullish.
USDCAD Wave Analysis
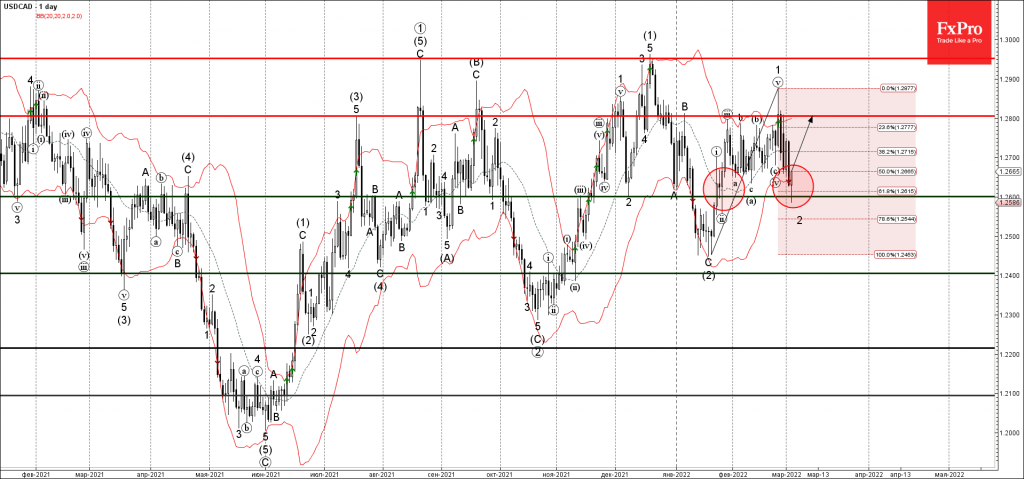
- USDCAD reversed from support level 1.260
- Likely to rise to resistance level 1.2800
USDCAD currency pair recently reversed up from the key support level 1.260 (which has been reversing the pair from the end of January).
The upward reversal from the support level 1.260 stopped the previous intermediate ABC correction 2.
Given the prevailing daily uptrend – USDCAD can be expected to rise further toward the next resistance level 1.2800.
Natural gas Wave Analysis
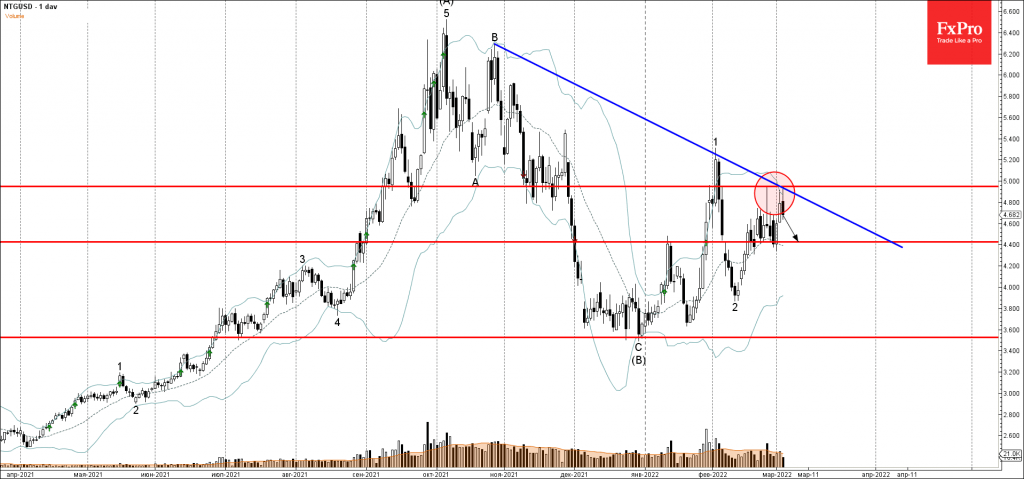
- Natural gas reversed from resistance level 5.000
- Likely to fall to support level 4.40
Natural gas recently reversed down from the key resistance level 5.000 (which has been reversing the pair from the end of January).
The resistance zone near the resistance level 5.000 was strengthened by the upper daily Bollinger Band and by the resistance trendline from last October.
Given the strength of the nearby resistance level 5.000 – Natural gas can be expected to fall further toward the next support level 4.40 (which has been reversing the price from the middle of February).
Eco Data 3/4/22
[php_everywhere instance="1"]
Silver’s Advance Falters But Bias Remains Bullish
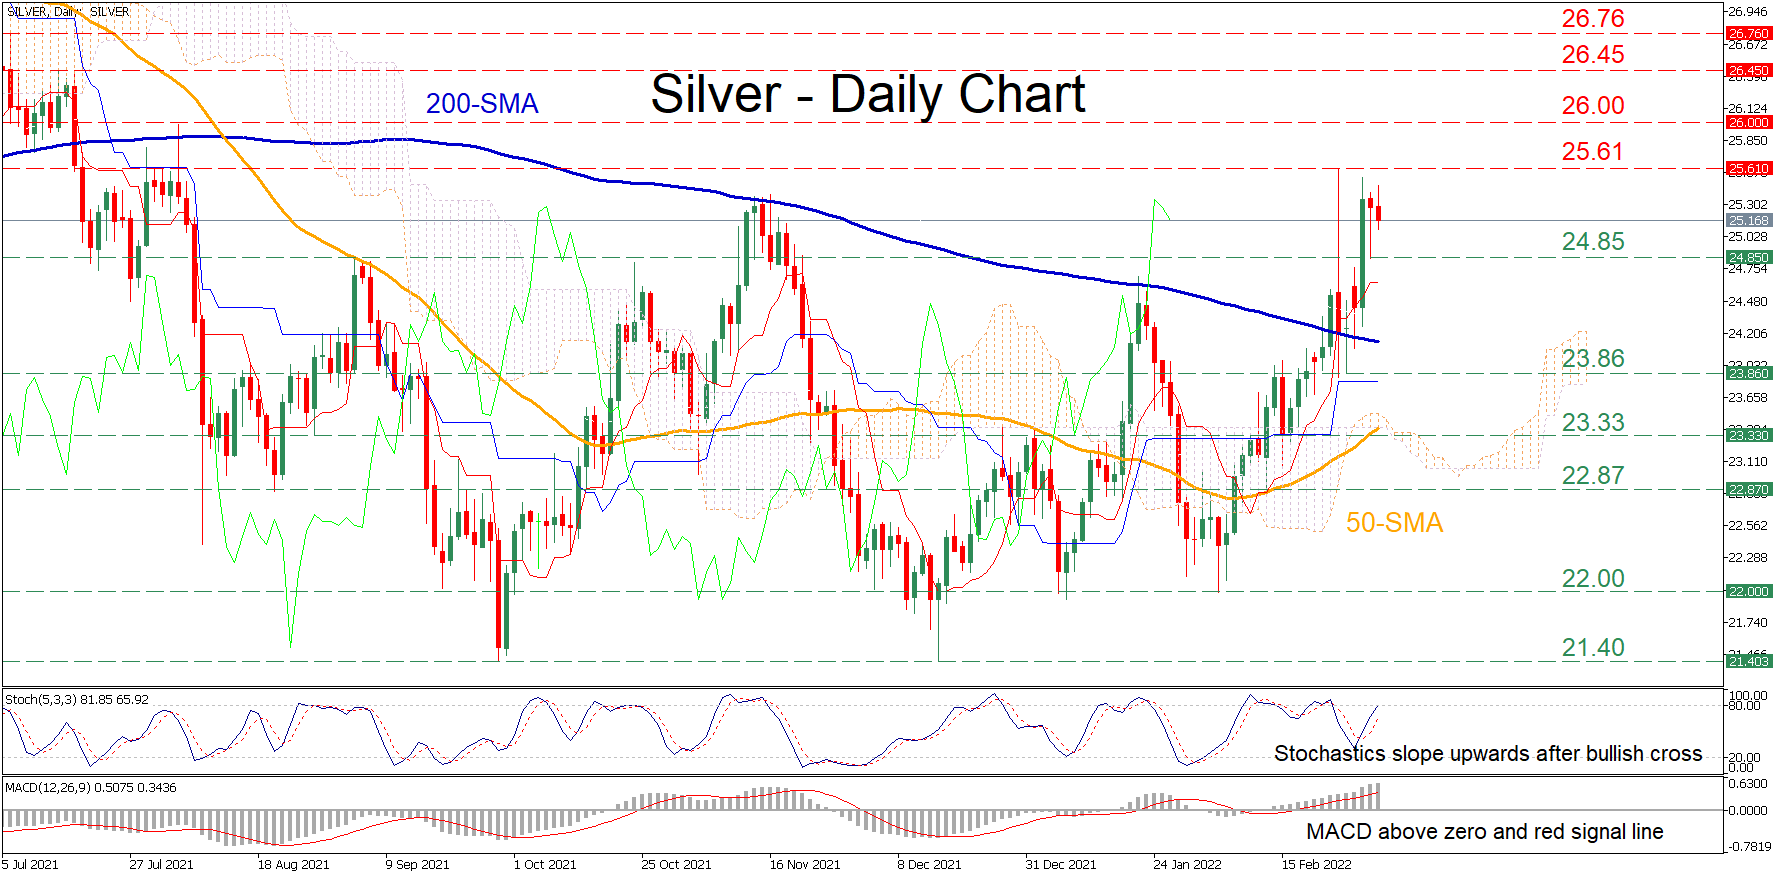
Silver has been edging higher in the short term, generating a clear structure of higher highs and higher lows. Although in the last few sessions the precious metal appears to be running out of steam, the ascending 50-day simple moving average (SMA) is closing the gap with the 200-day SMA, where a potential crossover could endorse the case of a more sustained rally.
The momentum indicators suggest that bullish forces are still in control. The stochastic oscillator is storming higher after posting a bullish crossover, while the MACD histogram is found above both zero and its red signal line. In addition, the price is trading way above the Ichimoku cloud, confirming the broader bullish short-term picture.
Should the positive momentum intensify further, the recent high of 25.61 might be the initial resistance point for the price. Failing to stop there, the bulls could aim for the 26.00 psychological mark before the spotlight turns to the 26.45 barrier. Further upside pressure could send the price to test the 26.76 hurdle.
On the flipside, if sellers re-emerge and regain the upper hand, the commodity might confront immediate support at its recent low of 24.85. Breaching this floor, the price could dip towards 23.86, a violation of which could send the price to challenge the 23.33 obstacle. Diving below this region, the 22.87 barricade may appear on the radar.
Overall, despite silver’s recent lack of strength to push higher, its short-term picture remains positive, while near-term risks are also tilted to the upside. Therefore, a break above the 25.61 ceiling could signal the continuation of its upside trajectory.
Euro area PPI passed 30% mark
Euro area producer prices accelerated their rise in January – a significant early signal of a further increase in consumer inflation. A fresh Eurostat report showed that PPI rose by 5.2% in the first month of the year, twice as much as expected and by 30.6% to the same month a year earlier.
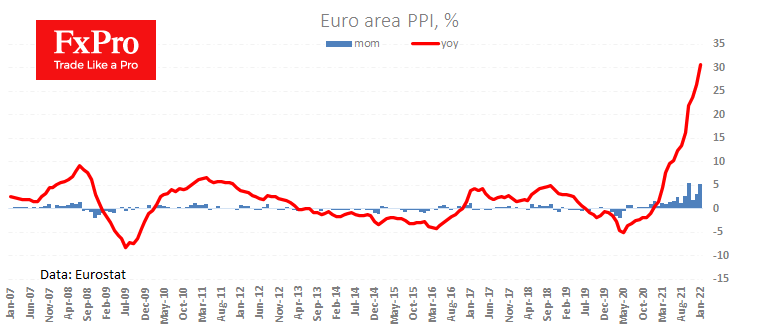
Until the middle of last year, the year-over-year growth rate had not exceeded 10% in the indicator’s 40-year history. However, the combination of a low base and subsequent supply-chain disruptions for some commodities and energy are feeding this wave.
The latest spike in gas prices and Brent’s jump by a third since the start of February indicates that price pressure promises to remain extremely high next month.
A couple of months ago, this would have been good news for the euro, as markets would have reinforced expectations of policy tightening. Now the figures point to a looming inflationary horror in the eurozone, which the ECB is unlikely to tackle in order not to multiply the region’s economic shock.
XAU/USD Outlook: Bulls Taking a Breather But Gold Remains Supported By Risk Aversion
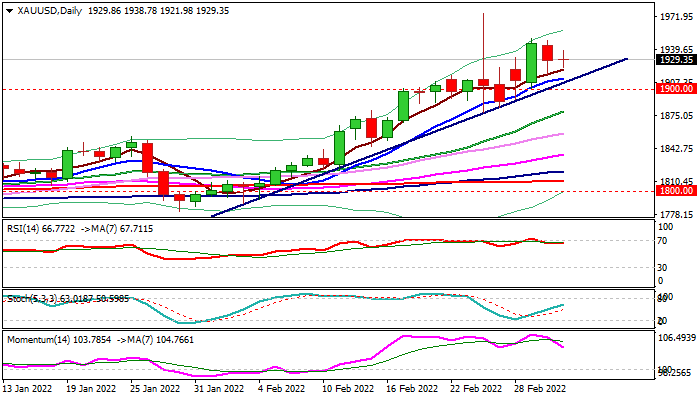
Spot gold is trading within a narrow range on Thursday, with the action being so far shaped in a Doji candle, signaling near-term indecision.
The metal remains supported by the uncertainty over the war in Ukraine, while less hawkish than expected Fed’s stance implies the central bank would be less aggressive in its policy meeting later this month that adds to positive signals for gold.
Also, surging inflation so far shows no signs of easing that would provide additional boost the price of the yellow metal, usually used as a hedge against inflation.
Bulls face obstacles at $1950 (Mar 1 high) and $1974 (Feb 24 spike high) ahead of $2000 level.
Rising 10DMA tracks the action since Feb 7 and marks solid support at $1911, expected to keep the downside protected and guard psychological $1900 level (also Fibo 38.2% of $1780/$1974 upleg), loss of which would ease the upside pressure and expose lower pivot at $1877 (Feb 24 trough / 20DMA / 50% retracement).
Res: 1950; 1957; 1974; 2000.
Sup: 1920; 1911; 1900; 1882.