Sample Category Title
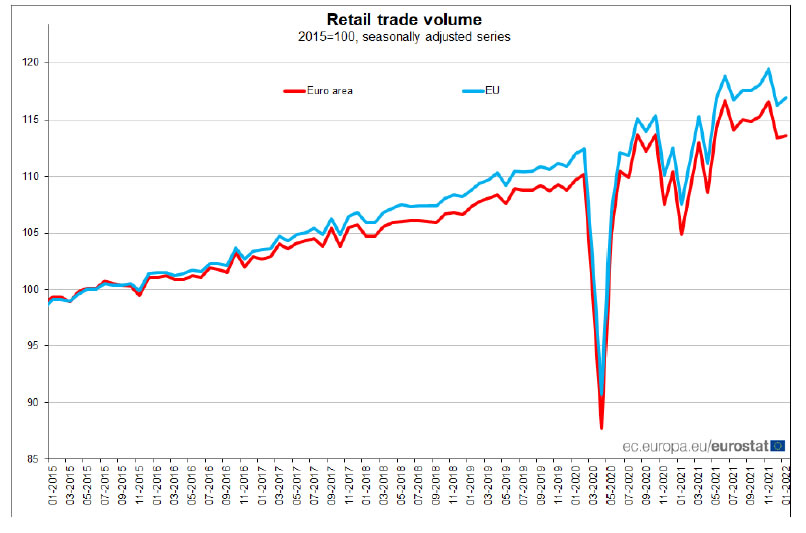
Eurozone retail sales rose 0.2% mom in Jan, EU up 0.6% mom
Eurozone retail sales rose only 0.2% mom in January, well below expectation of 1.5% mom. Volume of retail trade increased by 0.2% for non-food products, remained unchanged for food, drinks and tobacco, and fell by -1.3% for automotive fuels.
EU retail sales rose 0.6% mom. Among Member States for which data are available, the highest monthly increases in the total retail trade volume were registered in Poland (+5.9%), Luxembourg (+4.2%) and Denmark (+3.7%). The largest decreases were observed in Slovenia (-4.6%), Portugal (-2.8%), and Lithuania (-2.5%).
UK PMI construction rose to 59.1, input cost inflation eased
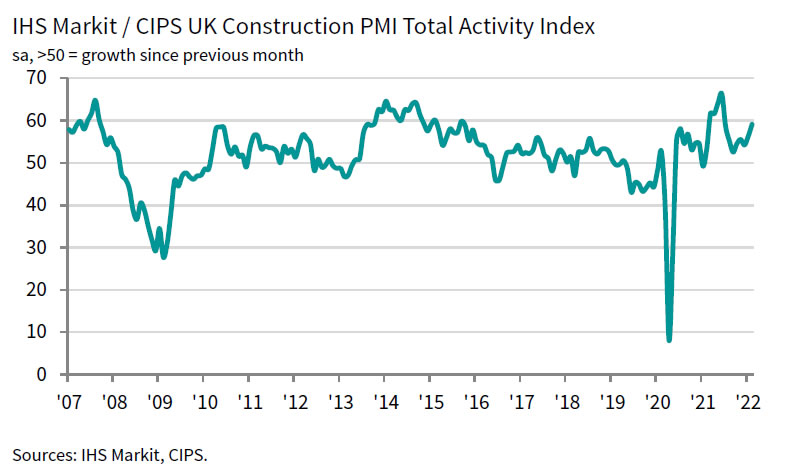
UK PMI Construction rose from 56.3 to 59.1 in February, above expectation of 57.4. Markit said growth was led by marked and accelerated rise in housing activity. Input cost inflation dipped to 11-month low. Business confidence eased to softest since January 2021.
Usamah Bhatti, Economist at IHS Markit:
"UK construction companies achieved a faster expansion in output volumes in February as the economy recovered from the recent wave of COVID-19 infections related to the Omicron variant. House building had the strongest showing, as signalled by the fastest rise in residential work for eight months.
"Despite continued volatility in price and supply conditions, the overall rate of new order growth accelerated from January to reach the fastest since last August as client confidence improved in line with economic activity as Plan B restrictions were fully lifted.
"Nonetheless, widespread reports of shortages of materials and labour continued to plague the UK construction sector, while rising input costs placed further strain on businesses. It appears that the peak of price pressures has passed as the rate of input cost inflation eased for the sixth month in a row to reach the softest since last March. At the same time, reports of supplier delays were considerably lower than those seen in the middle of last year. Yet, price and supply constraints weighed on overall business confidence, which eased to the softest in just over a year."
NZDUSD rejuvenates its one-month bullish climb
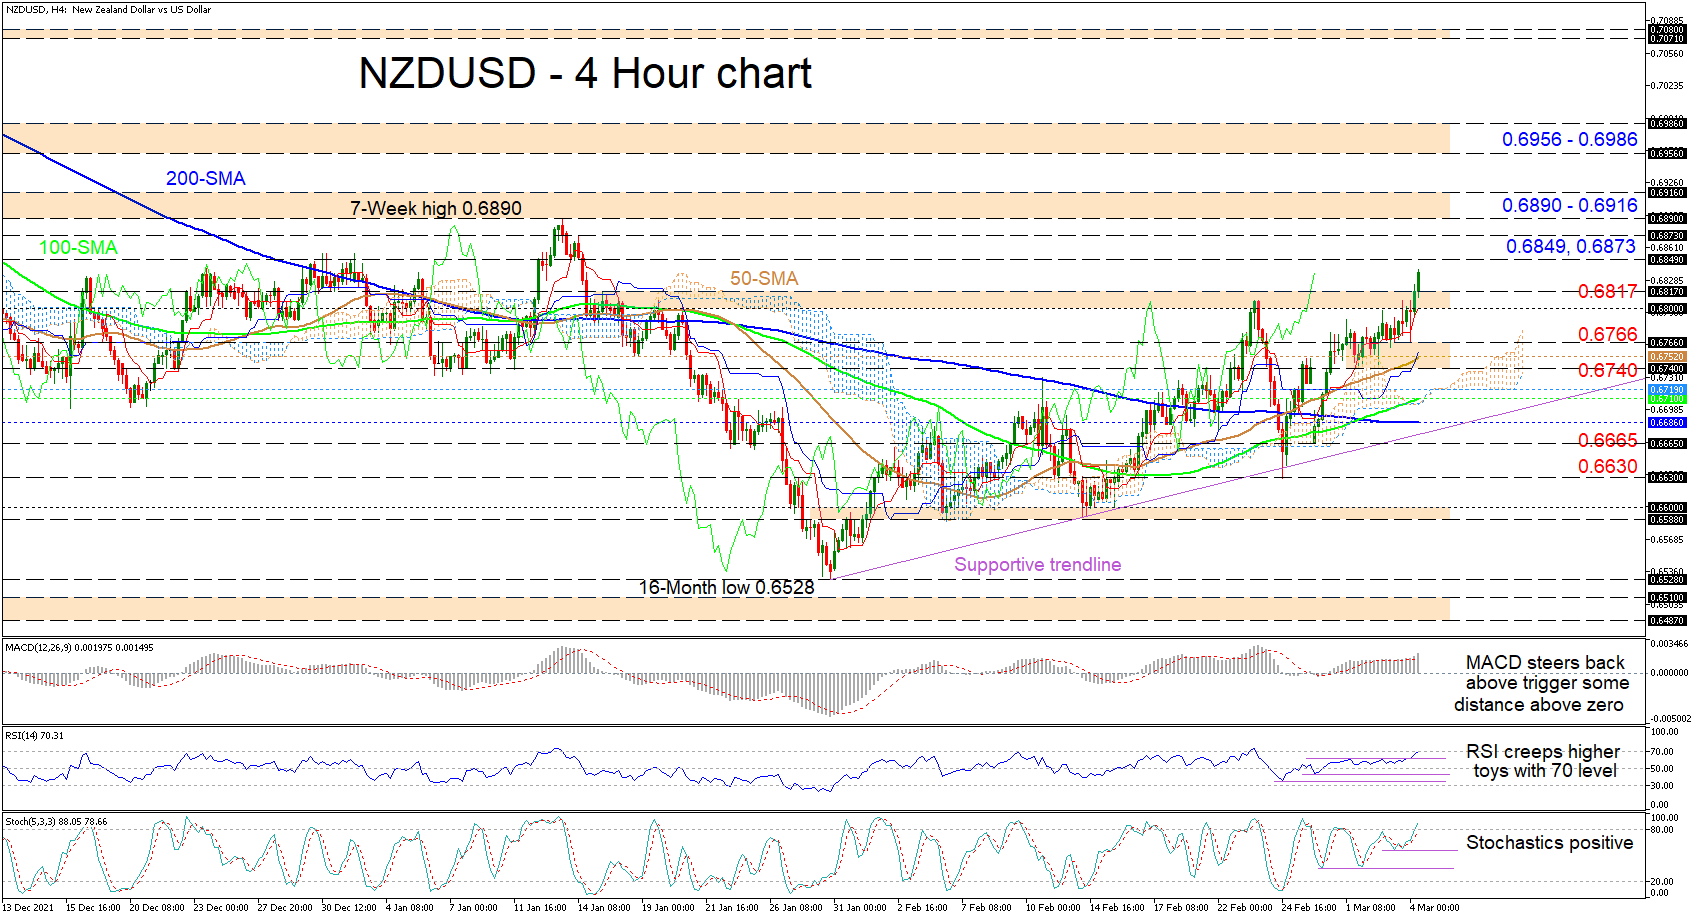
NZDUSD has steered decisively beyond the 0.6800-0.6817 resistance border that has capped advances since mid-January and is looking buoyant. Above the 200-period simple moving average (SMA), the ascending 50- and 100-period SMAs continue to endorse the bullish structure.
The rising Ichimoku lines are implying that positive forces are growing, while the short-term oscillators are reflecting the increase in positive momentum. The MACD, far north of the zero threshold, is strengthening above its flattened red trigger line, while the RSI is flirting with the 70 overbought level. Currently, the stochastic oscillator is exhibiting a strong positive charge and the %K line is improving in overbought territory, which is only an optimistic signal for price gains.
If the positive trajectory endures, nearby upside constraints could emanate from the 0.6849 barrier and the 0.6873 high. However, should the price move through these obstacles, the 0.6890-0.6916 resistance border, which has prevailed since the early part of October 2021, may be challenged. In the event this downside defence fails to dismiss additional gains, buyers could then target the 0.6956-0.6986 resistance band that extends back to mid-November 2021.
If upside pressures start to wane, initial downside hindrance could evolve at the 0.6800-0.6817 zone (previous resistance-now-support), where the red Tenkan-sen line also lies. If selling pressures overlook this obstacle, the fortified region from the 0.6766 low until the 0.6740 barrier may try to shape some footing for the bulls. Yet should a deeper retreat in the pair unfold, a key region between the cloud’s floor at 0.6719 and the 200-period SMA at 0.6686 may draw traders’ attention. Should this section, involving the 100-period SMA and a potentially still valid uptrend line pulled from the 16-month low of 0.6528, struggle to keep sellers at bay, the 0.6665 level, where a recent negative gap formed a foothold, could come under fire.
Summarizing, NZDUSD’s one-month uptrend remains intact above the 0.6800-0.6817 boundary. Upside momentum is likely to bolster with a price jump above the 0.6890-0.6916 border. That said, a break below the diagonal support, which extends past the 0.6665 low could strengthen negative tendencies. Meanwhile, a close below the 0.6630 trough may trigger worries about the near-term positive trend.
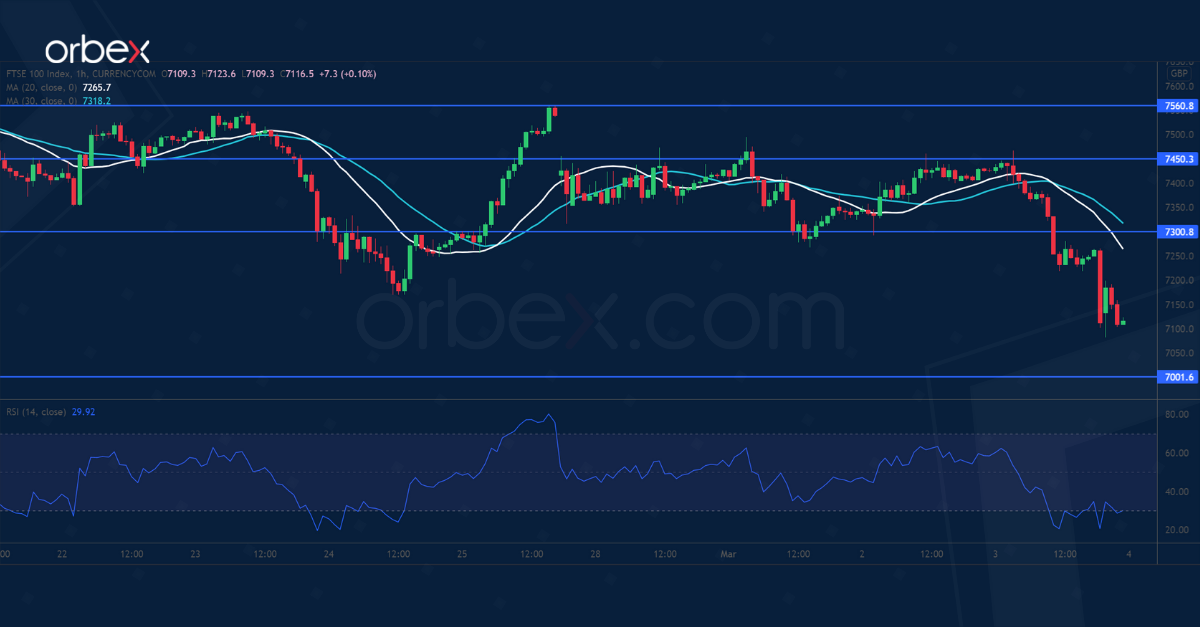
FTSE 100 Lacks Support
The FTSE 100 slipped after the second round of talks between Russia and Ukraine ended without much result.
The index met stiff selling pressure at 7560 then fell below the critical floor at 7170. Increasingly bearish sentiment triggered a new round of sell-off to the psychological level of 7000 from last November.
A deeper correction would lead to a retest of 6850, dampening the market mood in the medium-term. On the upside, the bulls must clear 7300 and 7450 to reclaim control of the direction.
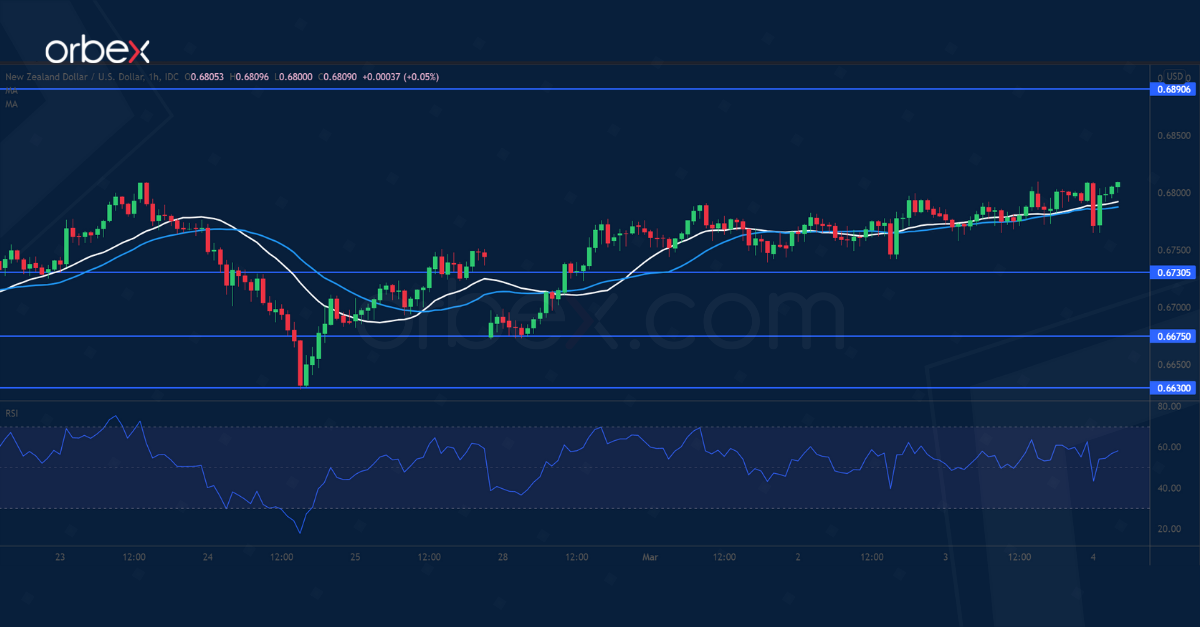
NZD/USD Breaks Resistance
The New Zealand dollar recovers amid commodity price rallies.
After the pair found support near last September’s lows (0.6530), a bullish MA cross on the daily chart suggests that sentiment could be turning around. A bullish breakout above the recent high (0.6810) would further boost buyers’ confidence and lift offers to January’s high at 0.6890.
On the downside, 0.6730 is the first support if buyers struggle to gather more interest. 0.6675 would be a second layer to keep the current rebound intact.
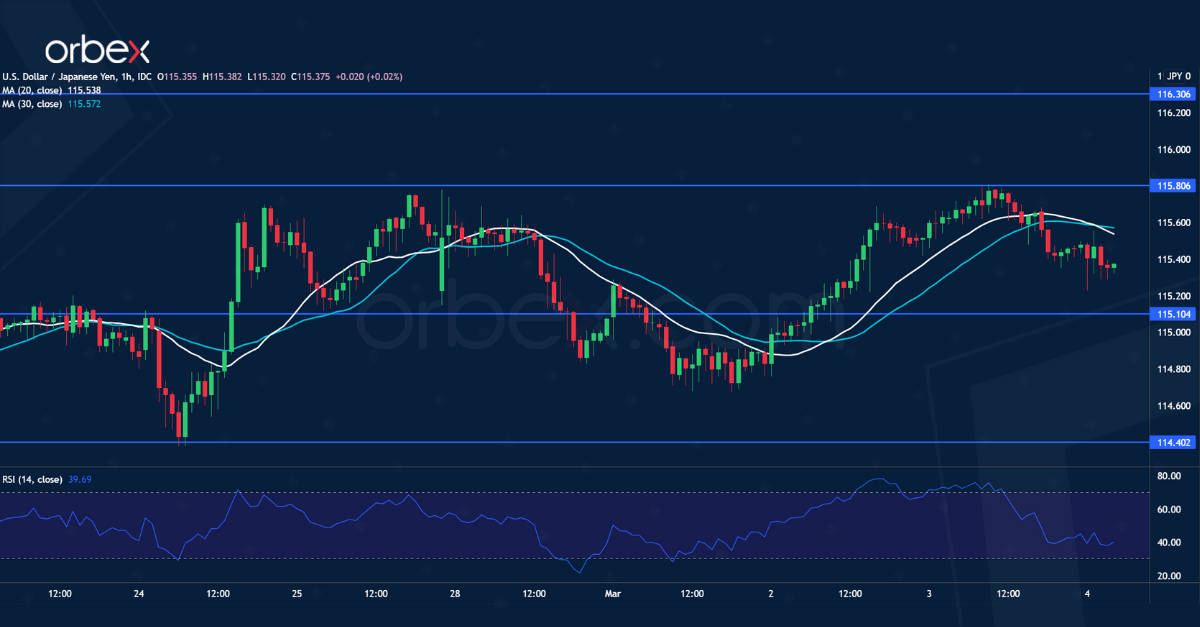
USD/JPY Tests Supply Area
The Japanese yen stalled after an increase in January’s unemployment rate.
The pair’s rally above the supply zone around 115.80 has put the US dollar back on track. The general direction remains up despite its choppiness. 114.40 has proved to be solid support and kept the bulls in the game.
A close above 115.80 would extend the rally to the double top (116.30), a major resistance on the daily chart. Meanwhile, an overbought RSI caused a limited pullback, with 115.10 as fresh support.
Global Growth and Inflation Impact of the Russia-Ukraine Crisis
Summary
The circumstances surrounding the Russian invasion of Ukraine and resulting military confrontation continue to evolve quickly, and at times in unexpected ways. The conflict between Ukraine and Russia is occurring not only in the eastern part of Ukraine, but also in major cities around the country. In response, the United States, European countries, and other western allies have imposed a range of severe economic sanctions on Russia. While the negative economic effects will clearly be most heavily felt in Russia itself, there is potential for a moderate negative impact on other economies through various economic channels. In this report we examine some possible growth and inflation implications to assess how key economies could be impacted if the Russia/Ukraine crisis persists, or even intensifies.
Ukraine Crisis: A Modest Hit to Global Economic Growth...
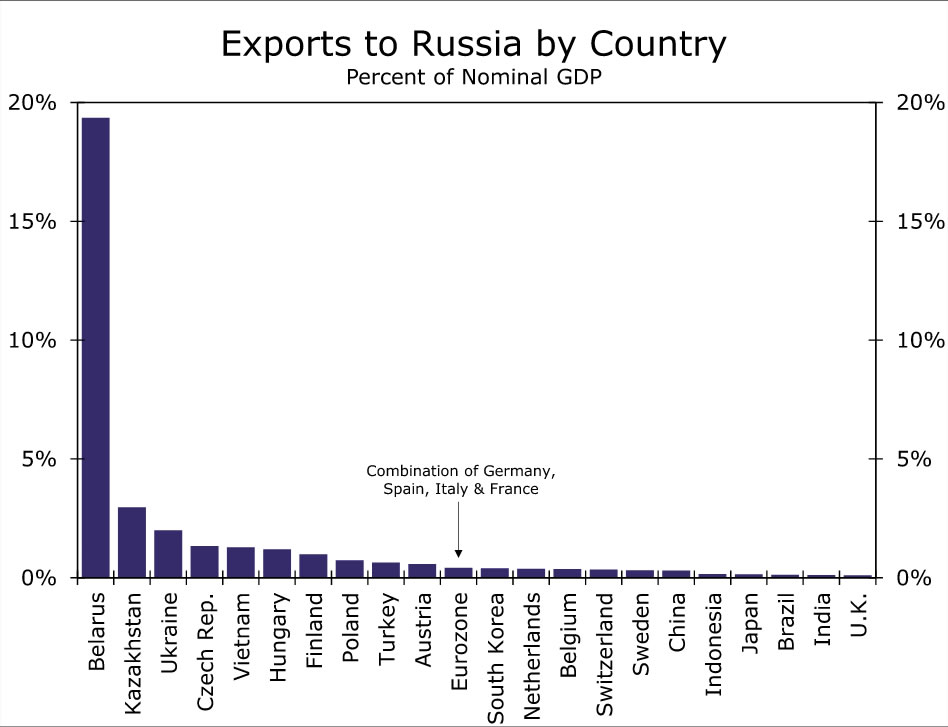
As we have noted in a series of reports on the Russia/Ukraine conflict, we expect the Russia/Ukraine crisis is likely to only have a moderately negative impact on global GDP growth. One channel this negative influence should be felt is through direct trade linkages between Russia and its various trading partners. Figure 1 below shows exports by country to Russia, as a proportion of that respective country's GDP. Overall, we expect the hit to global growth through this trade linkage channel to not be significant. Even for countries where the trade exposures are largest (for example, Eastern European countries), exports to Russia account for only 2%-3% of GDP for Ukraine and Kazakhstan, and approximately 1.25% of GDP for the Czech Republic and Hungary. Eurozone economies will also likely experience a modest negative impact through the trade channel, with exports to Russia for the region's largest economies accounting for just 0.4% of their GDP. Belarus has the most exposure to Russian demand, exporting goods worth almost 20% of GDP to Russia; however, Belarus' role in global economic output is negligible. Meanwhile, for other western economies the trade effect should have negligible influence. As examples, exports to Russia account for just 0.1% of GDP for the United Kingdom and Japan, while trade exposures for many Southeast Asian economies as well as China are also low.
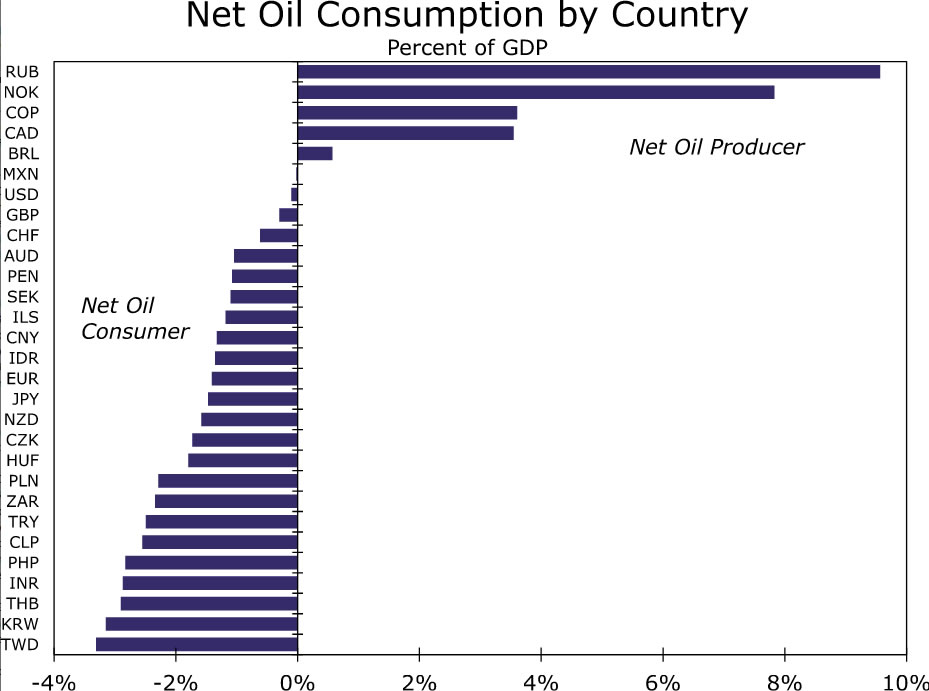
An alternative channel that could have somewhat more significant growth implications is the potential for a sustained spike in oil prices. An oil price shock could and should have different effects on economies based on whether each country is a net oil producer and net oil consumer. The Russia/Ukraine crisis has generated concern about possible supply disruptions for oil in particular, but as well as for some other key commodities. While the outlook for the oil market is inherently uncertain, and even more so when a major producer is involved in military conflict, concerns over oil supply disruption could continue to see oil prices move higher. In this environment, countries that are net oil producers or exporters would likely see economic growth positively impacted due to a boost from higher oil prices. In contrast, net oil consumers or importers would likely see economic growth weighed down by higher oil prices. We examine this energy-related channel by looking at oil production and consumption data for the 2019 calendar year from the Energy Information Agency. This is the most recent year for which both widespread oil production and consumption figures are available for several countries. In addition, the 2019 data of course represent production and consumption patterns that prevailed prior to the onset of the COVID-19 pandemic and should be considered more "normal."
The results are shown below (Figure 2). While Russia is a very significant net oil producer (that is, production exceeds consumption) to the tune of 9.6% of its GDP, the country may not be able to reap the full benefits given the push back on purchasing Russian produced oil. Instead, looking at some other countries that are also significant net oil producers (Norway at 7.8% of GDP, Colombia 3.6% and Canada 3.5%, and to a lesser extent Brazil), these economies could be reasonably well insulated from spillover tied to the Russia/Ukraine crisis. These countries could conceivably see a modest positive benefit to their respective economies. The United States, United Kingdom and Mexico are essentially close to balance in terms oil production versus consumption and, as a result, should feel only moderate negative effects from higher oil prices. China and the Eurozone are only moderate net oil consumers to the tune of around 1.5% of their respective GDPs. Thus, the Chinese and Eurozone economies could be weighed down a bit more. However, the negative economic impact is likely to be felt most acutely in several emerging Asian economies (including Taiwan, South Korea, Thailand, India, Philippines), where net oil consumptions accounts for around 2.75% to 3.25% of those countries' economies.
To wrap up, we expect the direct trade exposure channel and the oil price channel could see the Russia/Ukraine crisis lower global GDP growth by around 0.25% for 2022. Should that transpire we would lower our 2022 global growth forecast from 4.0% to 3.75%.
...A Slightly Larger Boost to Global Inflation
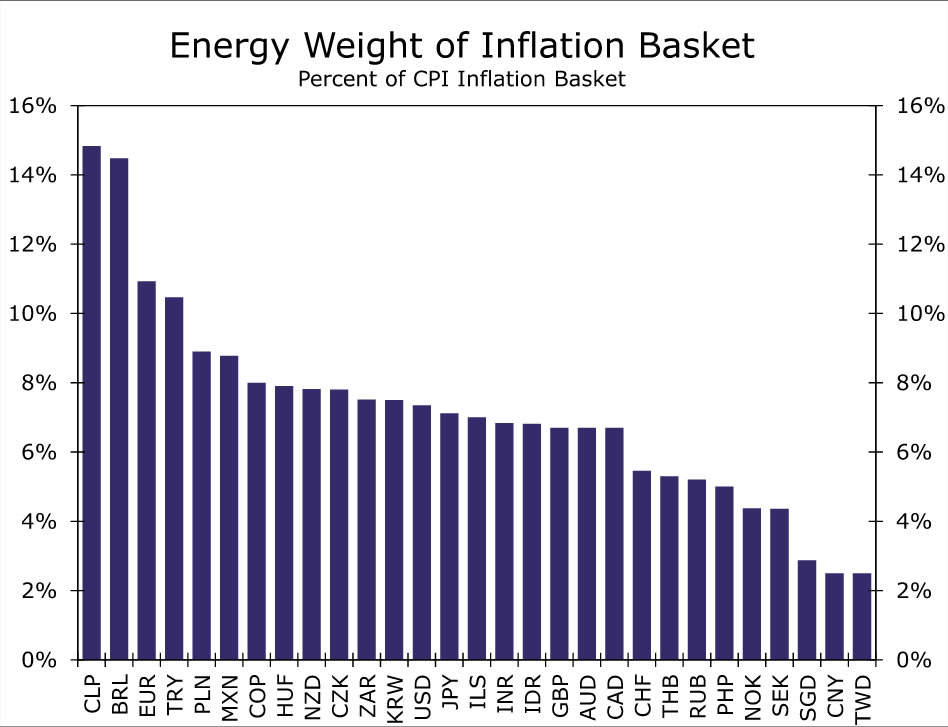
While we only expect modest negative effects to global growth, the Russia/Ukraine crisis could have a more pronounced impact on global inflation. Inflation is likely to be impacted through higher energy prices, but also food prices as well as select precious metal prices. Given most of the commodity shock has hit oil prices, we looked at energy's share of the Consumer Price Inflation (CPI) basket for the same range of countries. The results vary across region and by country. Of the countries we analyzed, energy prices make up the largest share of the CPI basket in Latin America as well as the Europe, Middle East & Africa (EMEA) region (Figure 3). To that point, energy prices account for around 15% of the CPI basket in Chile and Brazil, notable outliers as far as energy's share of their inflation basket. Also in Latin America, Mexico and Peru weight fuel prices at around 9% of their respective CPI indices, while Colombia is not far behind at 8%. In EMEA, almost 11% of the Eurozone CPI basket is weighted toward energy prices. We have highlighted in the past how sensitive the Eurozone is to the current surge in energy prices, while also noted how the Eurozone imports the majority of its oil, coal and natural gas directly from Russia. At the same time, given the Eurozone does not include all owner occuppied housing costs in its CPI, it is possible the energy weight could be slightly inflated. Elsewhere, emerging European countries could also be at risk of an additional boost to local inflationary pressures. Turkey, Poland, Hungary, the Czech Republic, South Africa all have energy represent about 8% of their inflation basket, while Israel's CPI has about a 7.5% weight toward energy. And finally, we highlighted Asia as a country that could experience negative growth repercussions from higher energy prices; however, with the exception of India and Indonesia, energy prices do not represent a significant portion of inflation baskets across the region. In the case of India and Indonesia, energy represents around 7% of the CPI, a relatively large percentage, and 4.5% in Thailand and the Philippines. Singapore, China and Taiwan are less exposed as energy accounts for only 2%-2.5% of their CPIs.
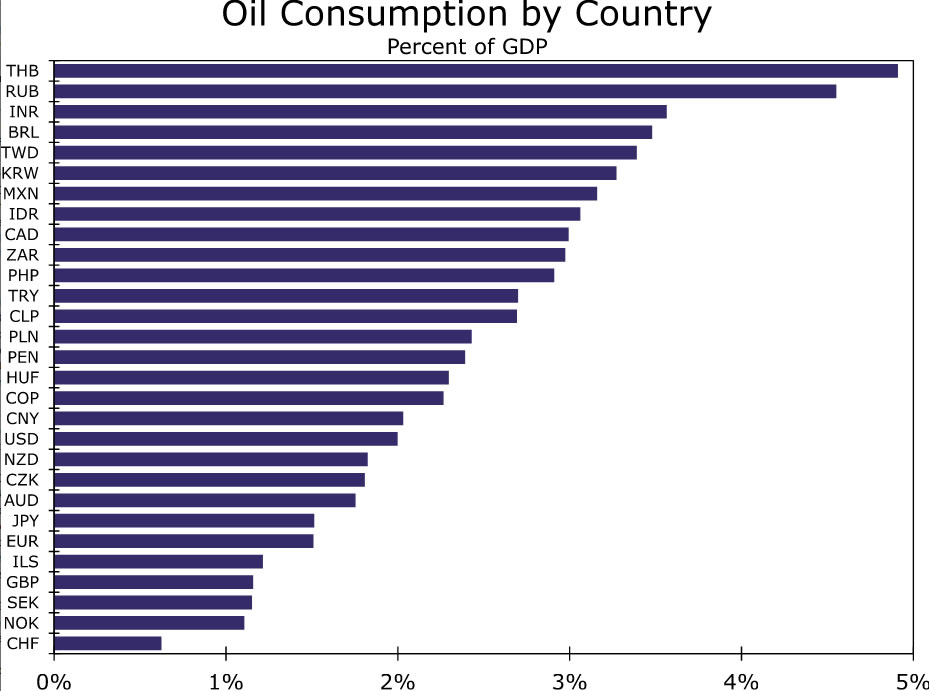
Of course, the actual consumption of oil plays in a role in whether inflation will be affected as well. In that sense, emerging Asia is a bit more exposed given the relatively high levels of consumption across the region. According to 2019 EIA data, Thailand, as a share of its economy, is a large consumer of oil as the population consumes oil worth around 5% of its economy (Figure 4). India, Taiwan as well as South Korea also consume a relatively large amount of oil, close to 4% of their respective economies, leaving these countries CPIs exposed to higher oil prices. As far as China, similar to the weight in the CPI basket, China does not appear to be particularly exposed as oil consumption is lower at only 2.5% of GDP. Latin America is sensitive to energy price swings via the CPI basket; however, Latin American countries are also exposed through the consumption channel as well. In fact, Latin America may be the most sensitive, from an inflation perspective, of any region in the world. Brazil and Mexico are large consumers of oil, while Chile, Peru and Colombia are not far behind. Given the large weight of energy in the inflation basket and relatively high level of overall oil consumption, we would expect inflationary pressures across Latin America to rise as a result of the Russia/Ukraine conflict. Europe, both developed and emerging, are not large consumers of oil. Turkey and South Africa seem to consume the largest amount of oil in the EMEA region, while the rest of EMEA's oil consumption is more modest. G10 countries, on balance, are lower on the list of oil consumers. In terms of the Eurozone, the region consumes oil worth only 1.5% of economic output. Within the G10, the United States is among the larger consumers of oil; however, oil consumption is only worth around 2.5% of GDP.
The takeaway from these data is that we expect broad inflationary pressures to build as an aftershock of the war in Ukraine. Latin America and emerging Asia are most exposed, and we would expect a pick up in most country-specific CPIs across both regions. In the G10, we also expect price pressures to build; however, likely at differing magnitudes. When we add all this up, we believe the inflationary impact will outpace the growth effects. In that sense, our global CPI forecast could rise to 5.75% from 5.0% by the end of this year.
What About External Linkages?
One final perspective we consider is how higher oil and energy prices might interact with a country's external balance. As far as external balances, we refer to a nation's trade and current account balance, which for most countries, can be heavily influenced by commodity price swings. Large swings in the external balance could potentially lead to capital outflows, and eventually follow through to currency weakness. Vulnerable economies include significant oil importers which are already running large current account deficits. These countries could see their respective external balances deteriorate even further, potentially pressuring their currencies.
In this context, we again highlight countries across emerging Asia. As of the latest update, the IMF forecasts India to run a current account deficit of close to 1.5% of GDP and for Indonesia to run a current account deficit of over 1% of GDP. Also, the Philippines has an external deficit closer to 2% of GDP and could see its external balance move further into deficit as energy prices move higher. In that sense, the rupee, rupiah and Philippine peso could experience the largest capital outflows in emerging Asia and could see weaker currencies. Thailand on the other hand has a healthy current account surplus, worth over 2% of GDP according to IMF forecasts. In this scenario, we would expect the Thai economy to potential experience less significant capital outflows and for the baht to be more protected given the existing surplus. The same can be said for South Korea. While Korea is a large consumer of energy and we would expect the current account to suffer as a result, a 4% external surplus could give the country a bit of cover and protect the won from excess volatility. Aside from Asia, select EMEA countries could be at risk as well. We choose to particularly highlight Turkey and South Africa as both countries are large net importers of oil. Despite a weaker Turkish lira, Turkey's external balance is still in deficit. Higher oil prices should push the current account deeper into deficit and should place pressure on capital outflows in Turkey. While we already forecast a significantly weaker Turkish lira over time, higher oil prices and a deteriorating current account balance could place added pressure on the lira going forward. South Africa's current account has moved closer to balance lately; however, with net oil consumption of around 2.5% of GDP, the rand could experience depreciation pressure as a result of potentially pending capital outflows. We also forecast the rand to underperform relative to peer emerging market currencies; but similar to Turkey, higher oil prices could be a new source of depreciation pressure on the South African rand.
On the other hand, Latin American currencies could experience some support and be considered "winners" of the Russia/Ukraine conflict. Most of Latin America are net oil exporters, or at least close to neutral (i.e: Brazil, Colombia and Mexico) and could see their existing current account balances improve. As current account balances improve, Latin America could experience capital inflows and support could build for the Brazilian real and Colombian peso in particular. We would note, however, that while higher oil prices can help the Brazilian real and Colombian peso over the course of the crisis, we are not ready to reverse course and forecast stronger currencies over the entirety of our forecast horizon. Local politics in both countries are precarious ahead of presidential elections this year, and if inflation pressures build as we expect, diminished purchasing power could result in elevated political risk ahead of those elections.
Yields, Equities and Euro Most Likely Start Under Substantial Downward Pressure
Markets
There was still no reason for investors to consider rowing against the ruling risk-off yesterday as there was no evidence on any solution to Russian invasion in Ukraine. Persistent uncertainty on the length and the outcome of the conflict propelled a further rise in a broad range of commodity prices with aggressive price rises in the likes of wheat. The US contract ($12.09 p/bushel) reached the highest level since 2008. Brent briefly touched $120 p/b early in the session but gradually came off the intraday peak levels, amongst others due to rumours that a nuclear deal with Iran might be reached.
Logically, eco data again were of little importance. US jobless claims declined more than expected to 215k, but the services ISM delivered quite a big miss, unexpectedly declining from 59.9 to 56.5 with activity indicators showing a broad-based loss of (still-elevated) momentum. Prices paid remain near recent peak levels. As said, the report was no important factor, but didn’t help investor confidence either.
In the second part of his hearing before Congress, Fed Chair Powell, reconfirmed that the Fed will start hiking rates this month. However, despite higher inflation, in the current uncertain environment, a cautious start apparently is preferred.
US yields changed between + 1.8 bps (2-y) and -3.9 bps (30-y). German yields lost about 1.5 bps at the front end. On FX, the dollar remains in the driver’s seat with DXY closing near 97.78. Yen gains vs USD were close to non-existent (USD/JPY close 115.46). The euro continues fighting an uphill battle with EUR/USD (close 1.1066), EUR/CHF (1.0150) but also EUR/GBP (0.8290) all facing similar downward pressures. CE currencies (CZK, forint, zloty) all closed substantially lower despite authorities’ efforts to curb the trend (Polish PLN buying, MNB rate hike).
Overnight sentiment deteriorated even further as Russian shelling caused a fire at a major nuclear plant in the east of Ukraine. The damage is said to be ‘under control’. Even so, it illustrates of the broad range of risks potentially resulting from the conflict.
Markets are again in outright risk-off modus. Treasury yields are declining up 4-5 bps. Asian equities are losing up to 2.0%. The dollar extends gains. The euro extends its journey south with the 1.10 barrier coming with reach. (currently 1.1025 area).
Usually, at the first Friday of the month, market focus is on the US payrolls. A solid report is expected. However, the impact on global markets will probably be limited, maybe with a small asymmetric risk in case of a negative surprise (further risk-off).
Yields, equities and the euro will most likely start under substantial downward pressure. Interestingly, oil doesn’t rise any further ($111.50 p/b). For EUR/USD it will be difficult to avoid a break below the 1.10 barrier. From a technical point of view, that would bring the 1.08/1.0636 area again on the radar. EUIR/GBP is sliding below the 0.8277 end 2019 low. For EUR/CHF (1.0125) the parity levels looms on the horizon. In CE, the FX defense of the national banks of Poland, Hungary and the Czech Republic will again be challenged.
News Headlines
February inflation in South Korea printed at a higher-than-expected 0.6% m/m to be up at an accelerated 3.7% y/y. Consensus was for a 0.5%/3.5% increase. Higher commodity/oil costs remain a key driver. Core inflation however sped up as well, going from 3% to a decade-high of 3.2% as services costs continued to climb, underscoring demand-side pressures. The central bank in South Korea kept policy rates unchanged at the last meeting at 1.25% but its sharp upward revision of inflation forecasts suggested more hikes to follow soon. Outgoing governor Lee said one more rate hike would not be considered tightening since the degree of accommodation has risen due to inflation.The EU is seeking to remove Russia’s most-favored nation status at the World Trade Organization. Such a move is possible on the basis of the WTO’s national security exemption and would further hit the €95bn Russian exports to its biggest trade partner by slamming it with tariffs. Canada revoked most-favored nation status for Russia and Belarus on Thursday. In the US, lawmakers proposed legislation that seeks to end permanent normal trade relations with Russia and urges president Biden to start the process of suspending the country as WTO member.
Nasdaq 100 Retreats as the Bear Market Continues
US equities retreated on Friday as concerns over the Russian invasion of Ukraine continued. On Thursday, several rating agencies like Fitch and Moody’s downgraded the Russian economy and warned that the country could miss an upcoming debt payment. At the same time, many companies like Mercedes Benz, Nike, and BP announced that they will pause offering services in Russia. The EU and American government are also boosting their sanctions on the country, pushing its currency to a record low. The Dow Jones declined by 153 points while the Nasdaq 100 fell by 190 points.
The euro dropped to the lowest point since June 2020 as concerns about the impact of the current war to the European economy. The bloc will be hit by the rising gas and oil prices. Wholesale gas prices in Europe have risen to an all-time high while oil prices have risen to their highest level in more than a decade. Therefore, the main risk to Europe is stagflation, a situation where high inflation is accompanied by low economic growth. On Friday, Germany will publish the latest trade numbers.
The key economic numbers to watch on Friday will be jobs data from the US and Canada. Analysts expect the data will show that the economy added 400k jobs in February after it added 467k jobs. At the same time, they believe that the unemployment rate dropped to 3.9% while average wages rose by 5.8%. Just this week, Target announced that it will add its minimum wage to about $24 per hour. Canada will also publish its jobs and PMI numbers. Analysts believe that the economy returned to growth in February after it lost thousands of jobs in January.
EURUSD
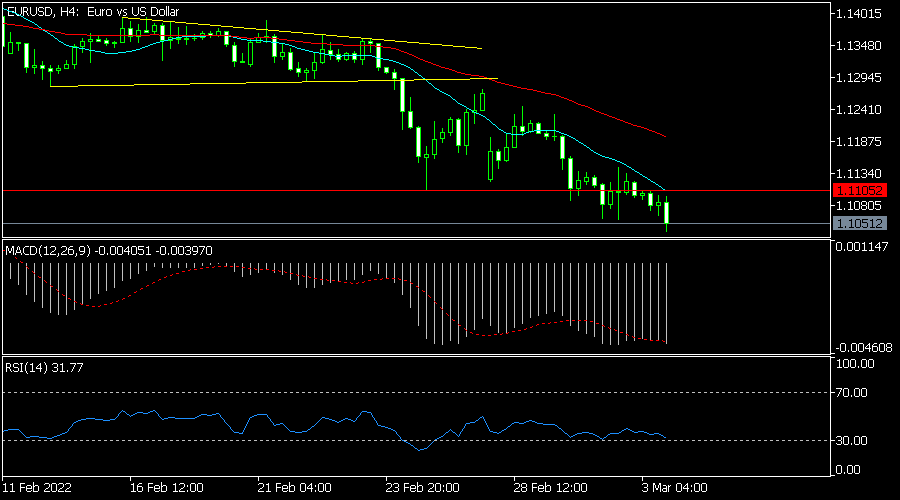
The EURUSD downward trend continued Friday morning as worries about the European economy continued. The pair is trading at 1.1047, which is the lowest it has been since 2020. On the four-hour chart, the pair has moved below all moving averages while the MACD and the Relative Strength Index have all dropped. Therefore, the downward trend will continue if the pair is below the 25-day and 50-day moving averages.
USDMXN
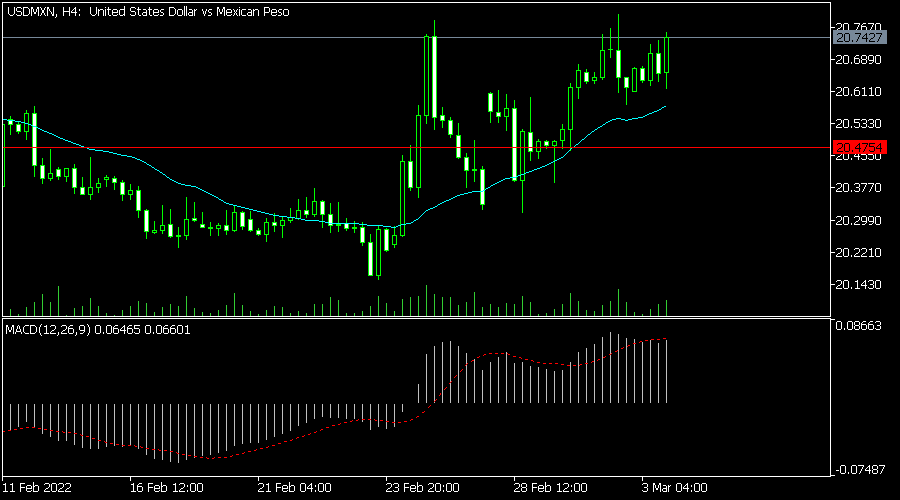
The USDMXN pair rose as the Fed chair hinted that the bank would stick to its plan to hike interest rates this month. The pair rose to a high of 20.75, which was the highest level since March 2. It moved above the 25-day moving average and is approaching the key resistance level at 20.80. The MACD has also moved above the neutral line. Therefore, the pair will likely keep rising in the near term.
NAS100
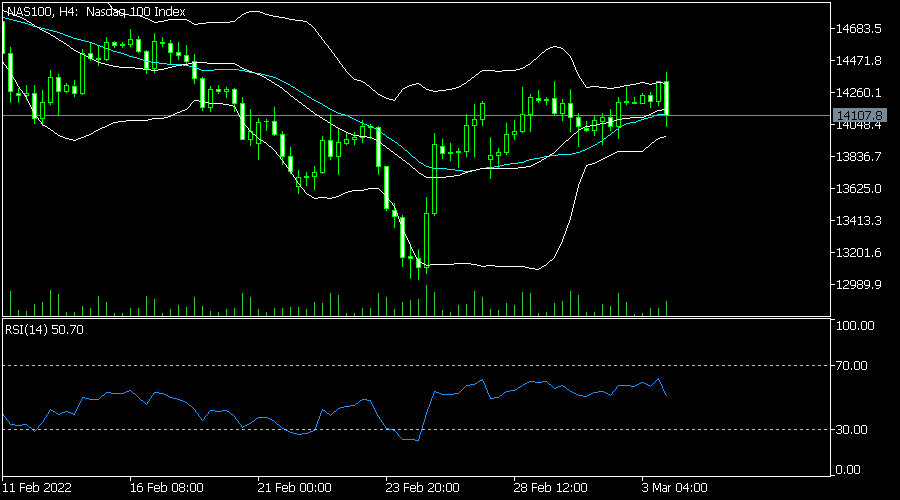
The Nasdaq 100 index dropped sharply on Thursday as worries about the economy and the Fed remained. The stock is trading at $14,100, which was lower than this week’s high of $14,400. On the four-hour chart, it is along the middle line of the Bollinger Bands while the Relative Strength Index has also tilted lower. The index will likely keep falling as the bear market continues.
USDCAD Recovers from Monthly Lows but Still in Confusion
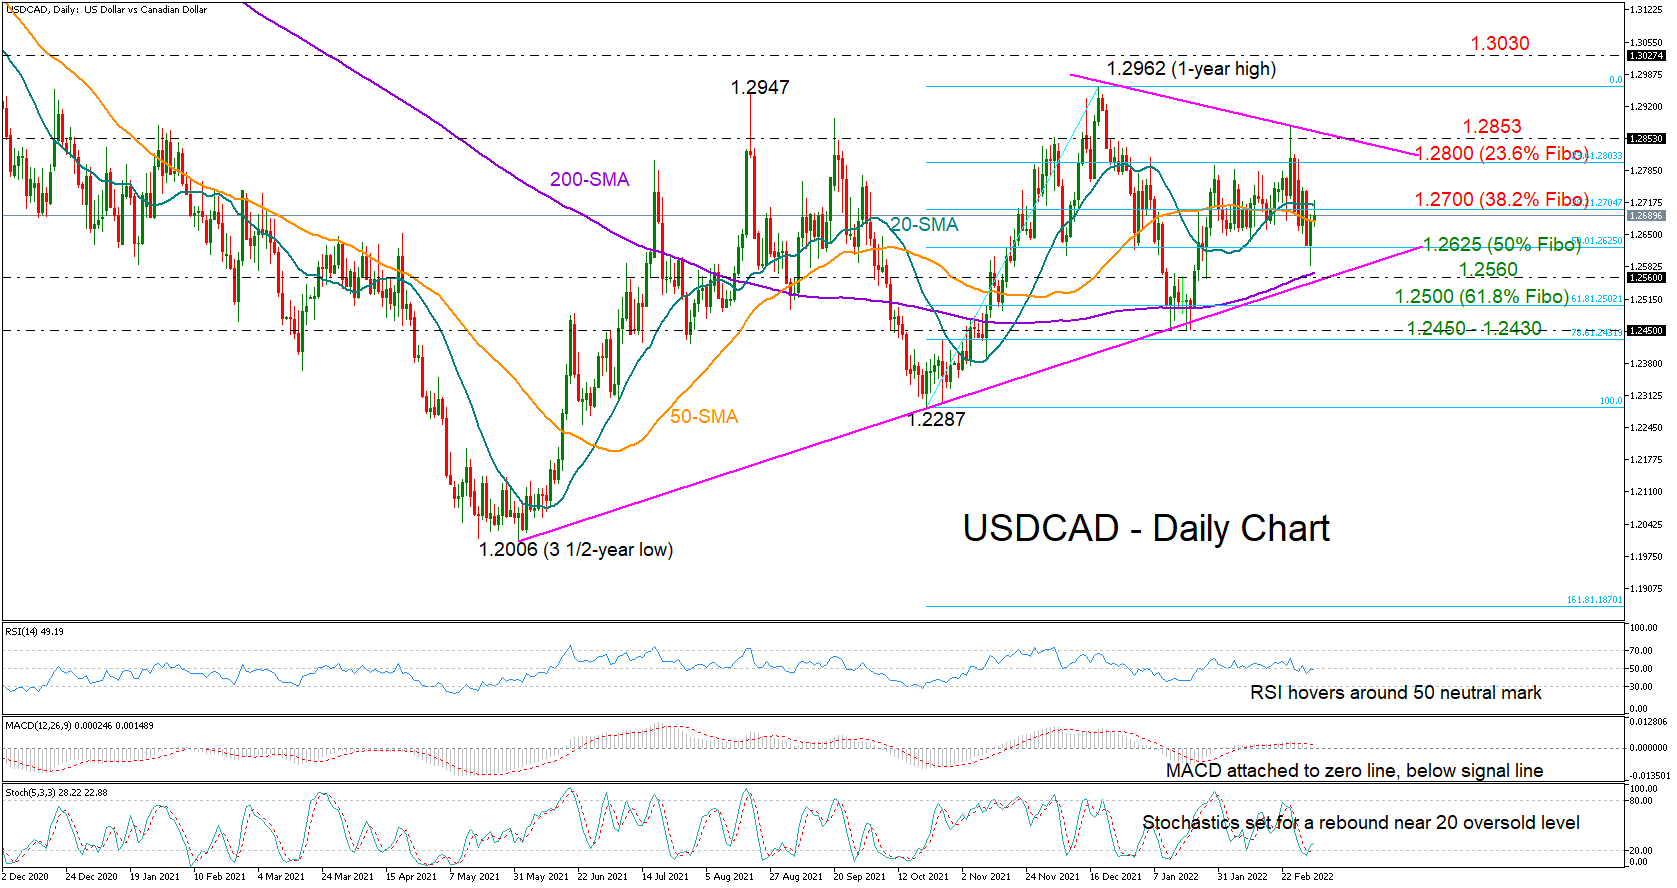
USDCAD bounced up immediately after the dive to a one-month low of 1.2589 on Thursday, with the price currently pushing for an advance above the 1.2700 level and beyond the 20-day simple moving average (SMA).
Although the price has rejected a close below the 50% Fibonacci retracement of the 1.2287 – 12962 upleg, the momentum indicators are still in confusion as the RSI is hovering around its 50 neutral mark, the MACD remains attached to its zero line, and the Stochastics look to be pivoting northwards near their 20 oversold number.
Hence, buyers may wait and see whether the price can sustain its positive momentum above the 1.2700 number before they target the 1.2800 resistance. An extension higher from here could test the tentative descending trendline around 1.2853, a break of which could give the green light for a continuation towards the one-year high of 1.2962. A new higher high above the latter may bolster buying appetite, bringing the 1.3030 barricade next under examination.
A close below 1.2625 could confirm additional declines, though traders may not strongly engage in selling activities unless the price crosses below the 200-day SMA and the supportive trendline drawn from the 2021 low of 1.2006 at 1.2560. If that turns out to be the case, the bearish wave could extend straight to the 61.8% Fibonacci of 1.2500, while lower, a step below the 1.2450 – 1.2430 base could squeeze the price towards October’s low of 1.2287.
In brief, the sideways trajectory in USDCAD is expected to remain intact unless the price rallies above 1.2853 or plummets below 1.2560.