Sample Category Title
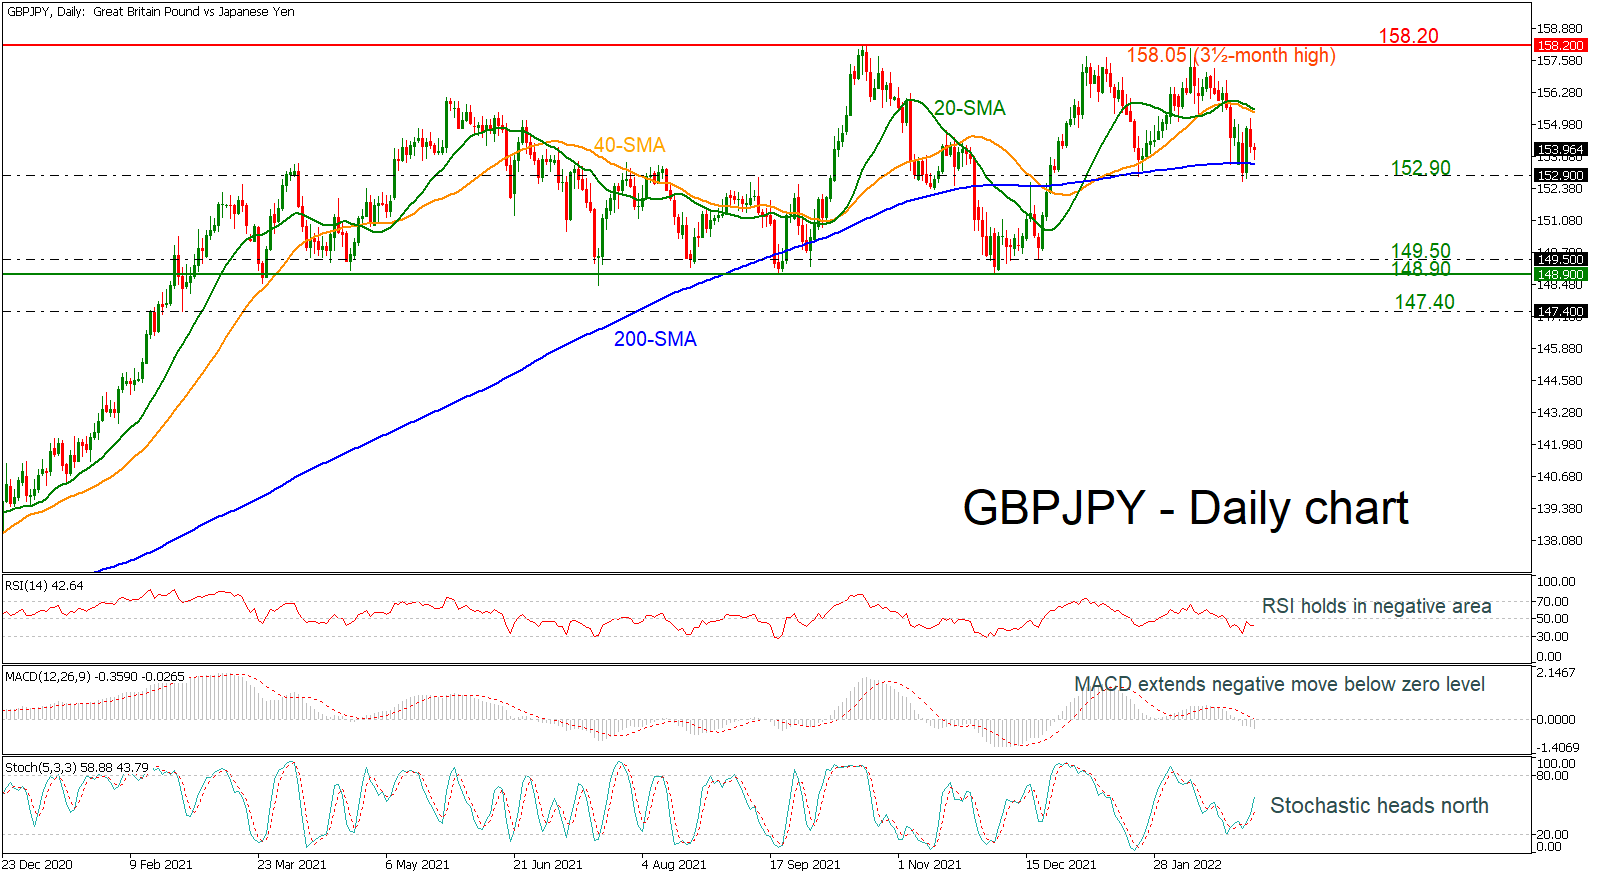
GBPJPY Seems to be Looking Weak within SMAs
GBPJPY has been trading sideways since the day it dived below the 20- and 40-day simple moving averages (SMAs) at 155.60 in the short-term, unable to close below the 200-day SMA and the 152.90 support.
The momentum indicators, though, are currently encouraging that the sell-off may have found a bottom and the pair may be pushing for some recovery. The RSI and the Stochastics are pointing up and are ready to leave the negative zone, while the MACD seems to be stabilizing in the negative area.
Practically speaking, a closing price above the SMAs could boost buying interest in the near term and confirm additional gains towards the 158.20 resistance level, which is the upper boundary of the long-term trading range. Higher still, the 160.20 barrier, taken from the high in June 2016 could also react as resistance.
In the event of a pullback below 152.90, the bears may push harder to clear the 149.50 and the 148.90 floor and head for the 147.40 level, which stands below the sideways channel.
Meanwhile in the long-term picture, the outlook has been remaining in a consolidation area since the last year, with traders waiting a rally above 158.20 to eliminate fears of a down-trending market.
Daily Technical Analysis
EUR/USD
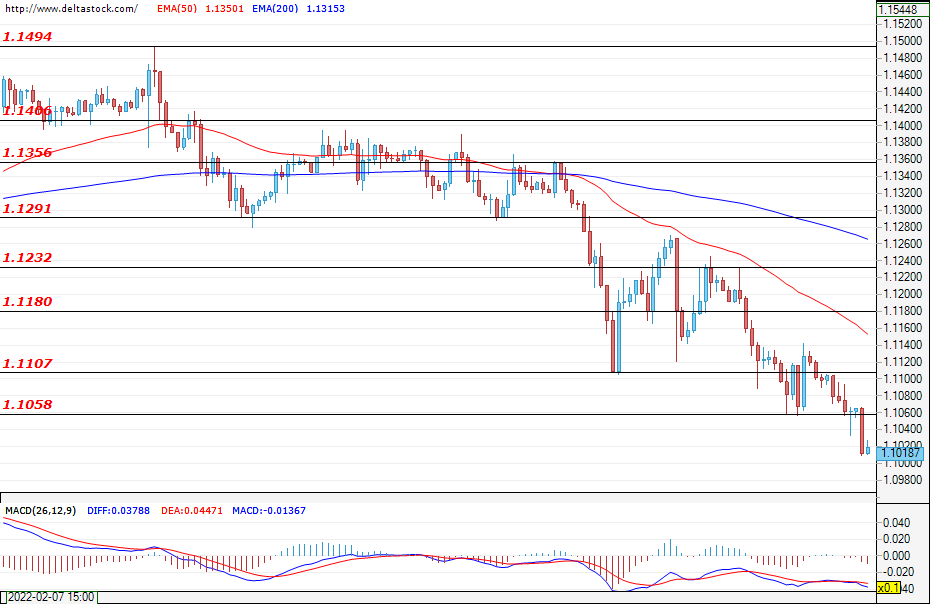
The negative sentiment remained unchanged and the European common currency continued to lose grounds against the U.S dollar. The pair violated the support zone at 1.1058 and during the early hours of today`s trading the price is consolidating around the current level at 1.1018. If the bearish momentum continues, expectations are for a test of the lower zone at 1.1000. Successful breach could easily continue the sell-off and could lead to new losses for the pair. First target for the bulls can be found at the mentioned level at 1.1058, which acts as resistance now , followed by the upper zone at 1.1107.
USD/JPY
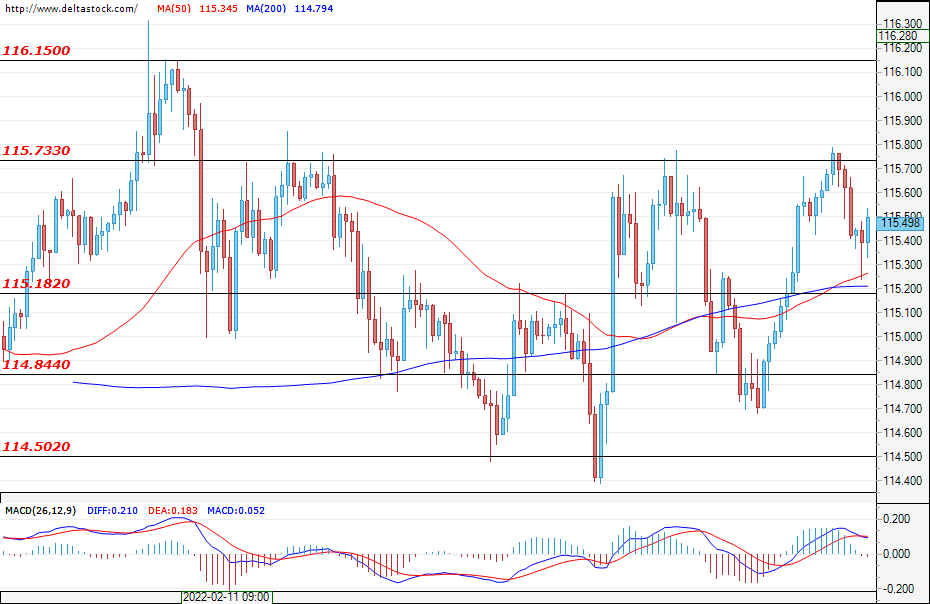
The bulls did not manage to gain enough momentum for a successful breach of the resistance zone at 115.73 and the trading continued in the zone between 115.18 and 115.73. New attack and violation of the upper border could strengthen the positive expectations for the future path of the Ninja and could easily lead to a test of the higher level at 116.15. If bears take the control, they could head the price for an attempt for breach of the support at 115.18, a successful violation could deepen the correction to the lower target at 114.84.
GBP/USD
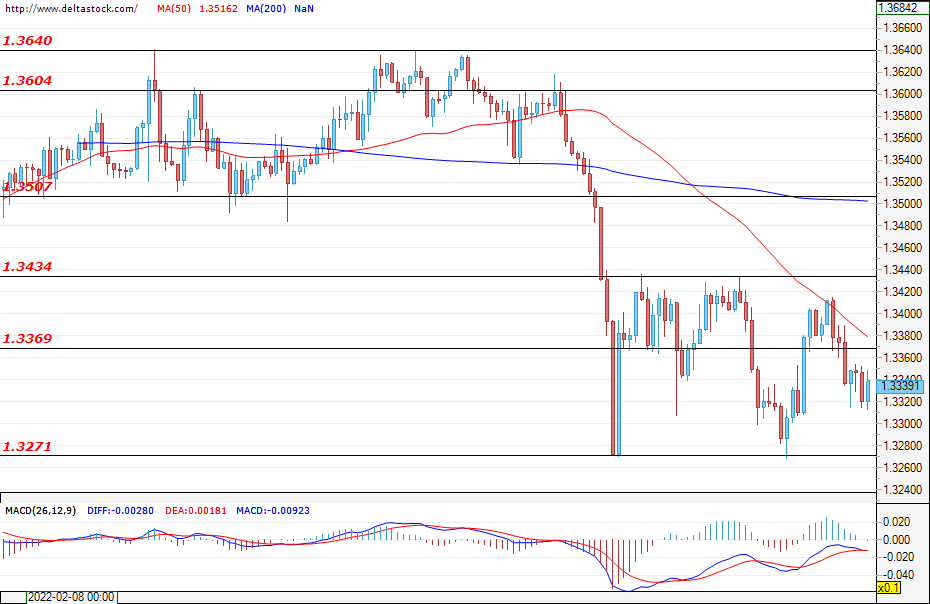
The breach of the resistance zone at 1.3369 was not confirmed and the trading remained limited under the mentioned level. If bears prevail, a successful test of the support zone at 1.3271 would most-probably lead to a future depreciation and heading the Cable towards the levels from December 2021 at 1.3200. However if the bulls re-enter, violation of the resistance at 1.3369, followed by a breach of the upper zone at 1.3434 could help for a rally and reaching the important level at 1.3507.
EUGERMANY40
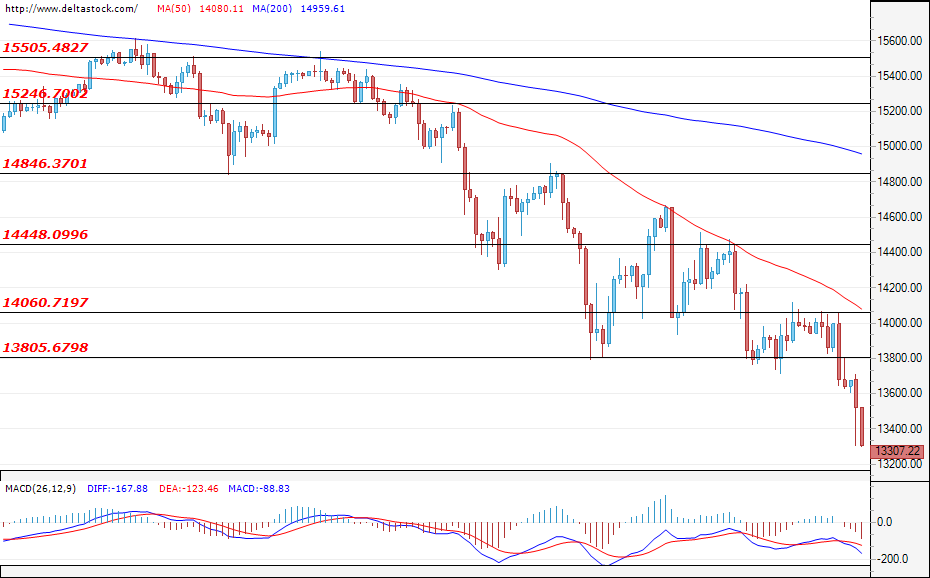
During the early hours of today`s trading the German index lost quite a bit of ground and the price dropped to the levels from January 2021 – around 13300. Rising tensions after the latest news for the military conflict in Ukraine could easily lead to new future losses and could easily head the price for a test of the support zone at 13200.If bearish momentum fades, the first target for the bulls is the level at 13805. A successful breach of the next resistance at 14006 could continue the recovery towards 14448.
US30
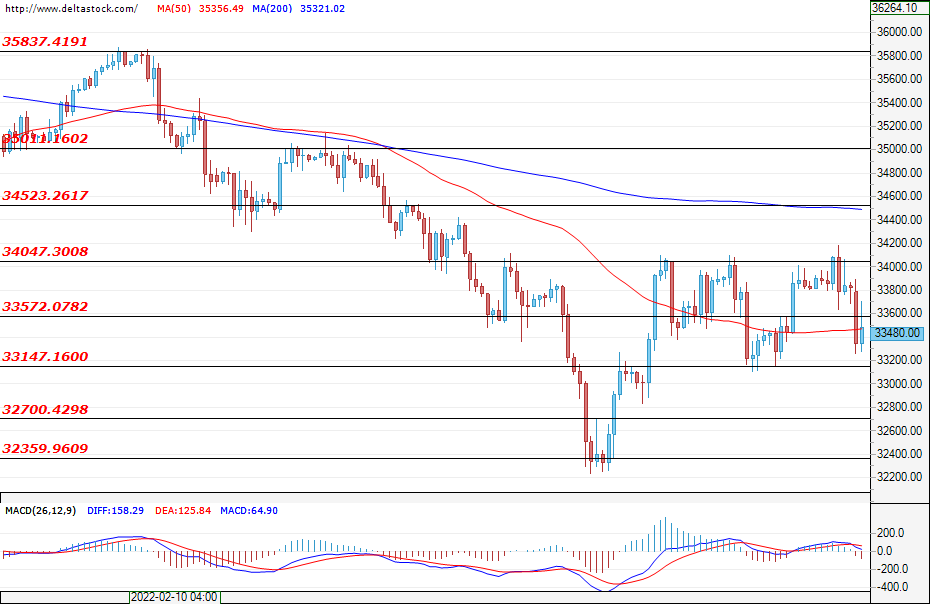
As the other world leading indices, after the Russian troops shelled the largest nuclear European power plant in Ukraine, the US30 depreciated. The sell-off erased more than 300 points and the price breached the support zone at 33572. Violation of the important level at 33147 could deepen the decline and could easily pave the way for a test of the lower zone at 32700. Better than expected data in the U.S.A for the Non-farm payrolls change as well as data for the Unemployment rate (today; 13:30 GMT) could help bulls to prevail. A successful violation at the level at 33572 could encourage an attack of the main resistance at 34047, where a violation could lead to a change of the current sentiment of the market participants.
No Appetite
Risk appetite remains limited as the war in Ukraine intensifies. The price of US crude eased below the $110 per barrel yesterday then jump back above $114, on reports that smoke was visible from a nuclear power plant in Ukraine. Although the rising hope that a nuclear deal with Iran could unlock the potential of the Iranian all, and bring some 800’000 barrels of additional oil per day, the latter may not be enough to reverse the positive course of oil prices.
Fundamentally, just a week into the war, two thirds of Russian oil is struggling to find buyers. Some businesses don’t want to do business with Russia as the reputational risk of doing business with an aggressor became too high, and some simply try to cut exposure to the Russian oil as early as possible and to find alternative suppliers in fear and in preparation of future sanctions on Russian oil.
The barrel of US crude could advance toward the $1450/150 if the tensions in Russia doesn’t ease.
The market mood is deep red. The European stocks continue feeling the pinch of an escalating war, as the US major indices remain under a decent selling pressure, with the fading optimism about Jerome Powell’s announcement that he would back a 25bp hike in March meeting.
The S&P500 fell 0.53% yesterday as Nasdaq slid more than 1.56%, and futures traded in the red during the overnight trading session, hinting that there may not be relief before the weekly closing bell.
Investors are unlikely to open or to hold a long position without putting a hedge on it. This is why we shall continue seeing a solid demand in the safe haven gold in the coming days, the price of an ounce consolidates above the $1930 mark this morning.
Commodities perform well in the actual war-shaken market environment, as well, given that the disruptions to the Russian and Ukrainian supply push the commodity prices higher, from grains to industrial metals.
However, if the things get bad enough to push investors to close their positions, then the US dollar would be, by far, the best hedge.
Bitcoin is giving back the early week gains as it becomes clearer by the day that it won’t be a hassle-free safe haven to investors, as the Western forces are going after the coin to impose strict regulations to prevent Russians from going around the sanctions that are imposed to them. The price of a coin is headed toward the $40K mark, and it’s likely we start seeing Bitcoin trade parallel to the risk assets yet again.
We are the first Friday of the month, and investors will keep an eye on the US jobs data. Released Wednesday, the ADP report showed almost half a million job additions in the US last month, while the consensus for the nonfarm payrolls is a solid 400’000.
Does it really matter? No, not if we don’t see a very surprisingly low figure. What will really matter is the average hourly earnings which is expected to have risen to 5.8% year-on-year, and which would be the strongest since 2007, except from two pandemic-distorted data points in 2020.
Rise in earnings means a higher and a more sustainable pressure on inflation, which calls for higher interest rates, but the potential to boost the Fed hawks remains limited, as, although Jerome Powell made clear that the Federal Reserve’s (Fed) priority is to fight inflation, no one really knows how bad the war will impact the global economic growth, and to which extend it could get the Fed to change its plans about tightening its policy. For now, we stick with a 25bp hike in March.
EUR/USD Daily Outlook
Daily Pivots: (S1) 1.1026; (P) 1.1074; (R1) 1.1114; More...
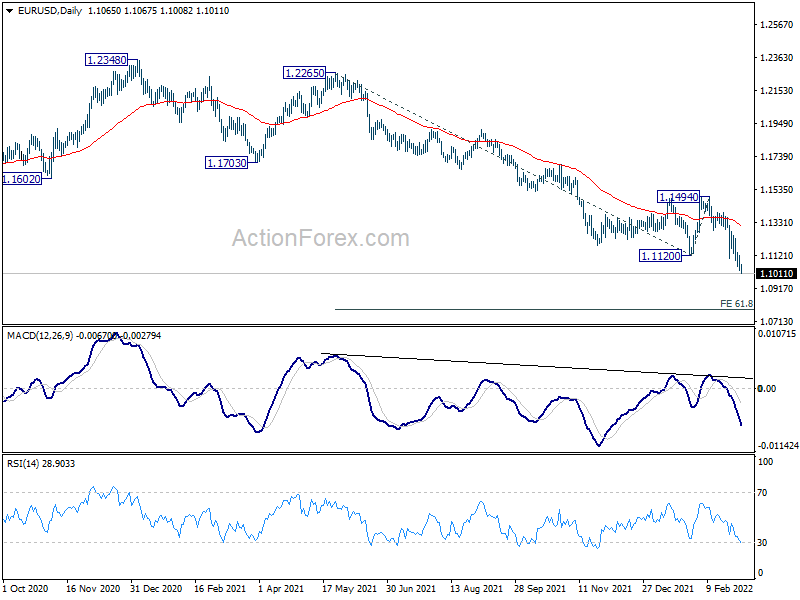
EUR/USD falls to as low as 1.1008 so far and intraday stays on the downside. Current fall is part of the down trend from 1.2348. Next target is 61.8% projection of 1.2265 to 1.1120 from 1.1494 at 1.0786. On the upside, above 1.1142 minor resistance will turn intraday bias neutral and bring consolidations first, before staging another decline.
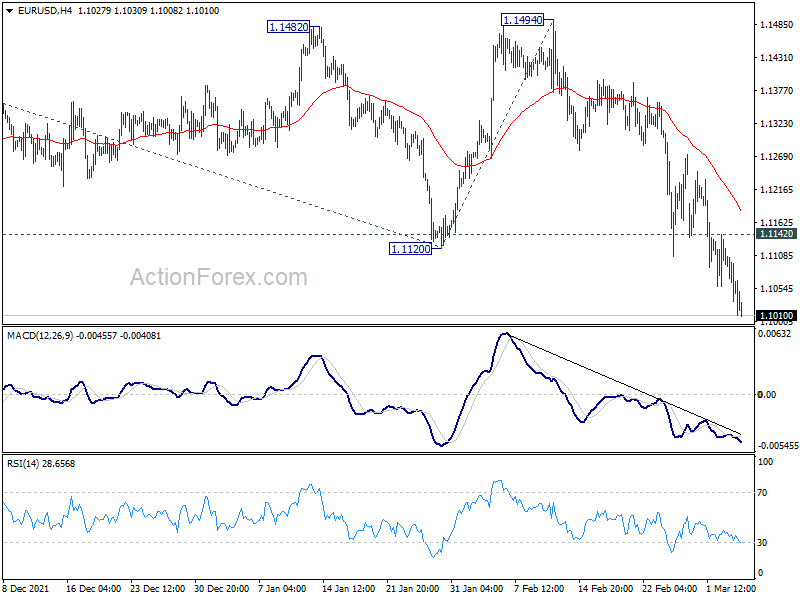
In the bigger picture, the decline from 1.2348 (2021 high) is expected to continue as long as 1.1494 resistance holds. Firm break of 1.0635 (2020 low) will raise the chance of long term down trend resumption and target a retest on 1.0339 (2017 low) next. Nevertheless, break of 1.1494 will maintain medium term neutral outlook, and extend range trading first.
GBP/USD Daily Outlook
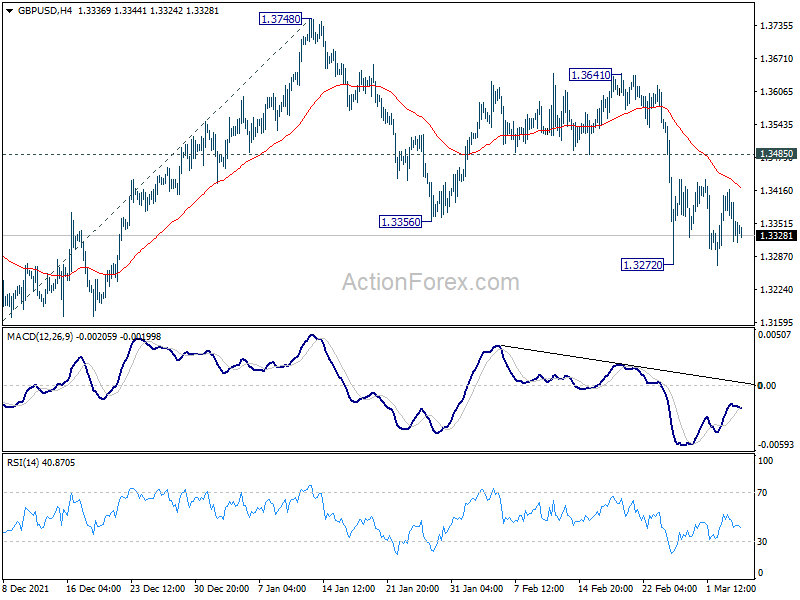
Daily Pivots: (S1) 1.3305; (P) 1.3362; (R1) 1.3405; More...
Intraday bias in GBP/USD remains neutral and further decline is expected with 1.3485 support turned resistance intact. On the downside, break of 1.3272 will target 1.3158 low. Further break there will resume larger down trend from 1.4248. However, firm break of 1.3485 will dampen this bearish view and turn bias back to the upside for 1.3641 resistance.
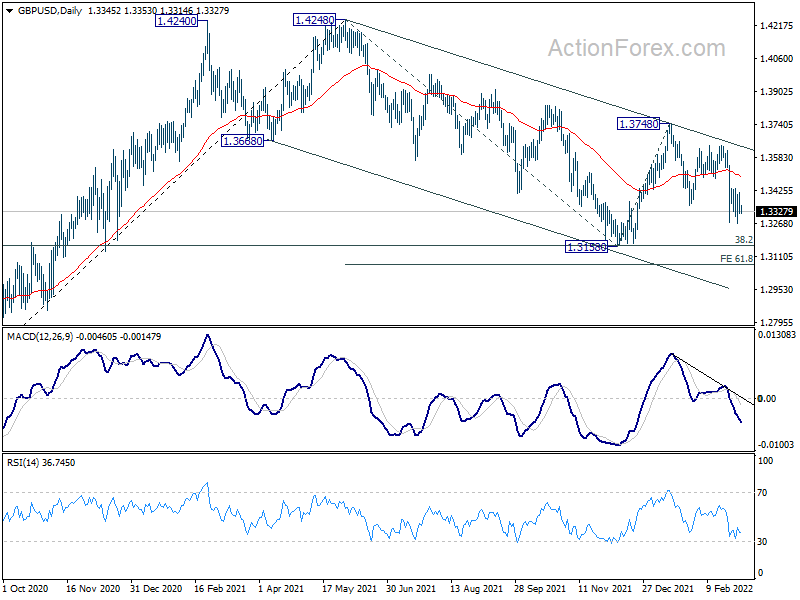
In the bigger picture, as long as 38.2% retracement of 1.1409 to 1.4248 at 1.3164 holds, up trend from 1.1409 (2020 low) is still in progress. On resumption, next target will be 38.2% retracement of 2.1161 to 1.1409 at 1.5134. Nevertheless sustained break of 1.3164 will argue that whole rise from 1.1409 has completed and bring deeper fall to 61.8% retracement at 1.2493.
USD/CHF Daily Outlook
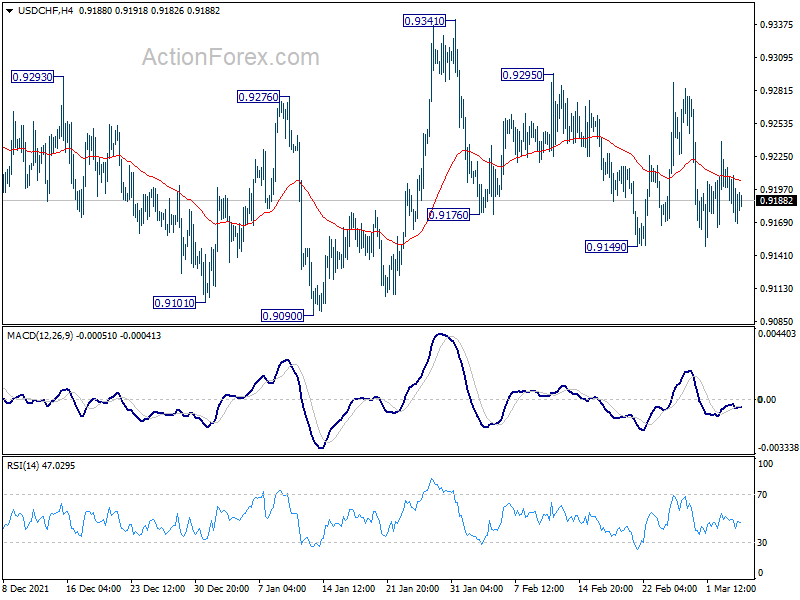
Daily Pivots: (S1) 0.9161; (P) 0.9189; (R1) 0.9203; More....
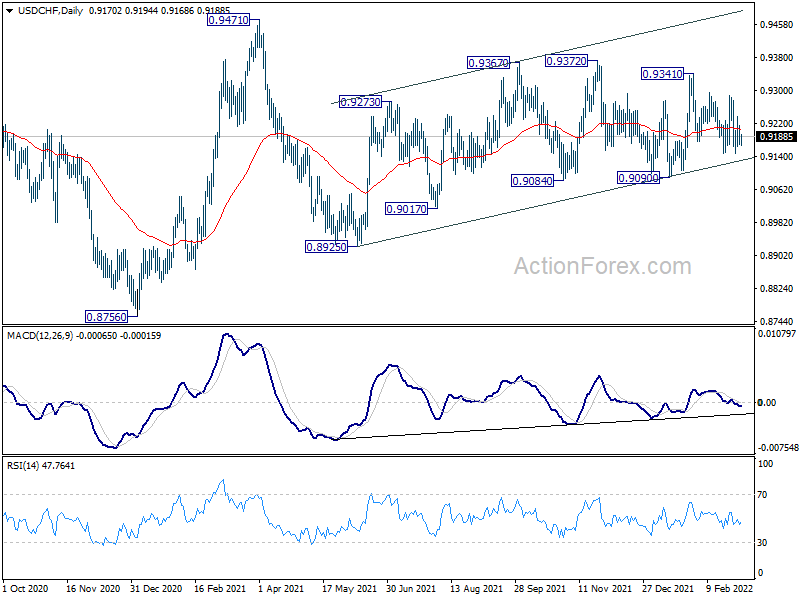
Sideway trading continues in USD/CHF and intraday bias remains neutral. Choppy rise from 0.8925 would still be in favor to extend higher as long as 0.9090 support holds. Break of 0.9341 will target 0.9372 resistance and then 0.9471. On the downside, however, break of 0.9090 will bring deeper fall back to 0.8925 support.
In the bigger picture, medium term outlook will be neutral at best as long as 0.9471 resistance holds. Larger down trend could still extend through 0.8756 (2021 low). However, firm break of 0.9471 will argue that the trend has already reversed and rebound the rally from 0.8756 with another impulsive move.
USD/JPY Daily Outlook
Daily Pivots: (S1) 115.30; (P) 115.55; (R1) 115.72; More...
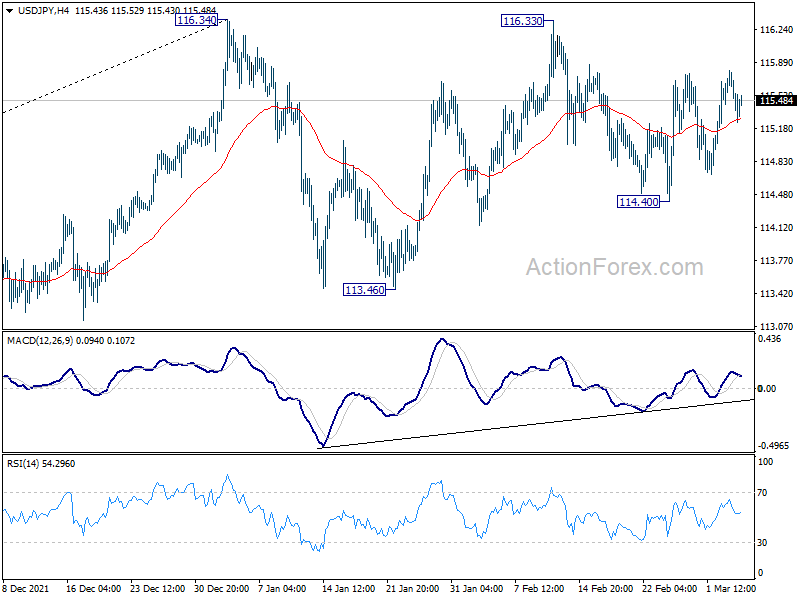
Sideway trading continues in USD/JPY and intraday bias remains neutral. On the upside, firm break of 116.34 will resume larger up trend from 102.58 to 118.65 long term resistance next. On the downside, though, break of 114.40 will continue the corrective pattern from 116.34 with another fall to 113.46 support.
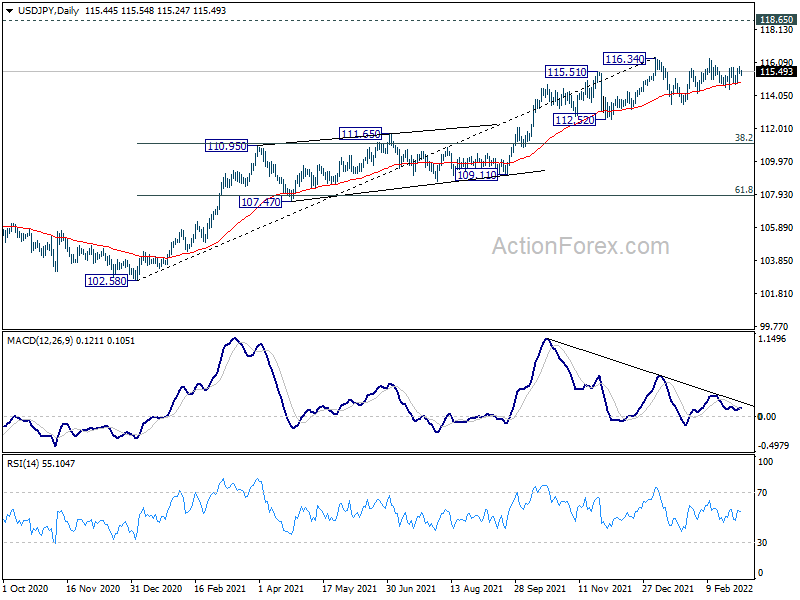
In the bigger picture, no change in the view that rise from 102.58 is the third leg of the up trend from 101.18 (2020 low). Such rally should target a test on 118.65 (2016 high). Sustained break there will pave the way to 120.85 (2015 high) and raise the chance of long term up trend resumption. This will remain the favored case as long as 55 week EMA (now at 111.64) holds.
AUD/USD Daily Report
Daily Pivots: (S1) 0.7287; (P) 0.7318; (R1) 0.7359; More...
Intraday bias in AUD/USD remains on the upside at this point. Corrective decline from 0.8006 could have completed at 0.6966 after hitting 0.6991 key support. Further rise should be seen to 0.7555 resistance for confirmation. On the downside, break of 0.7237 minor support will turn intraday bias neutral first. But further rally is still in favor as long as 0.7093 support holds.
In the bigger picture, focus remains on 0.6991 key structural support. Sustained break there will argue that the whole up trend from 0.5506 might be finished at 0.8006, after rejection by 0.8135 long term resistance. Deeper decline would then be seen back to 61.8% retracement of 0.5506 to 0.8006 at 0.6461. Meanwhile, strong rebound from 0.6991 will retain medium term bullishness. That is, whole up trend from 0.5506 is still in progress.
USD/CAD Daily Outlook
Daily Pivots: (S1) 1.2613; (P) 1.2653; (R1) 1.2719; More...
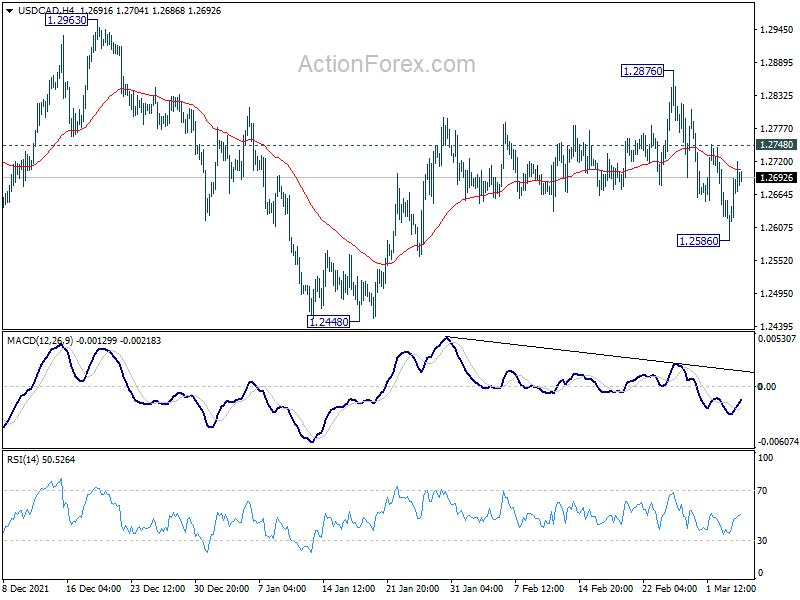
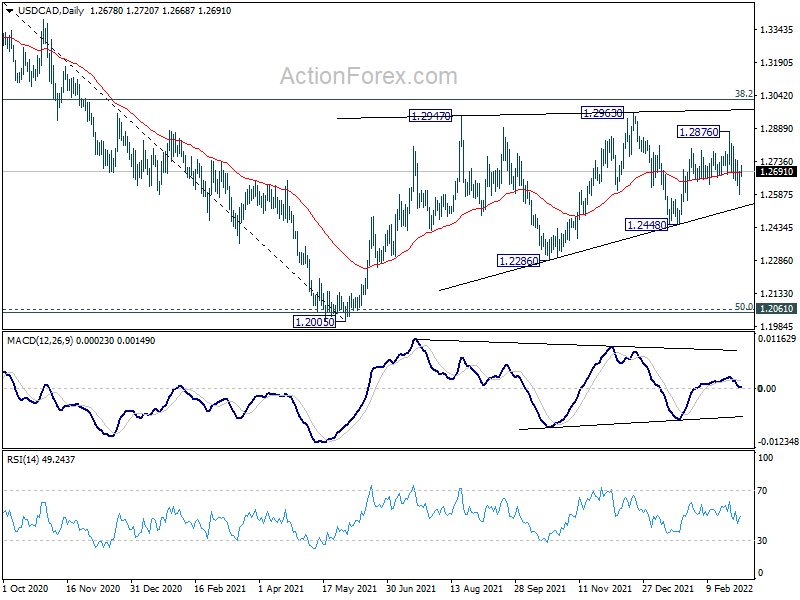
USD/CAD recovered again after hitting 1.2586 and intraday bias is turned neutral. Further decline is still expected as long as 1.2748 minor resistance holds. Below 1.2586 will target 1.2448 support. On the upside, above 1.2748 minor resistance will turn bias back to the upside for 1.2876 resistance instead.
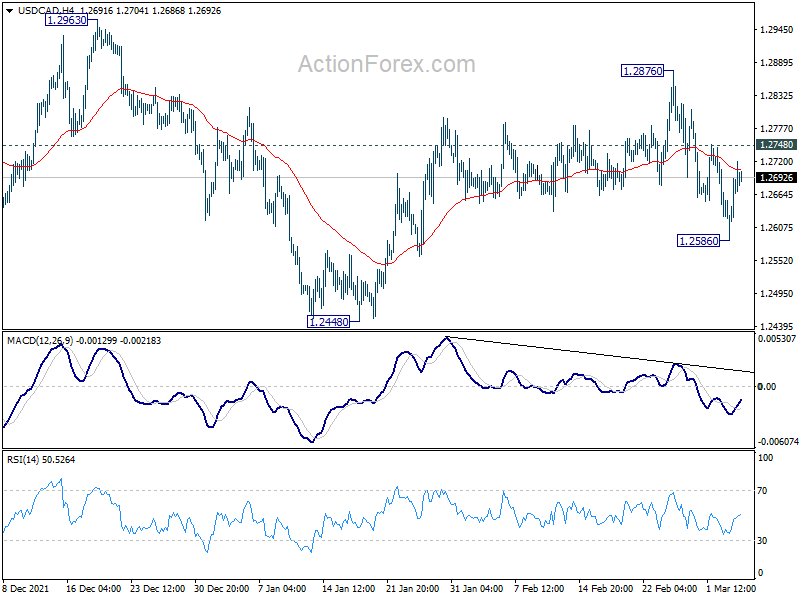
In the bigger picture, focus stays on 38.2% retracement of 1.4667 (2020 high) to 1.2005 (2021 low) at 1.3022. Sustained break there should confirm that the down trend from 1.4667 has completed after defending 1.2061 long term cluster support. Further rise would then be seen towards 61.8% retracement at 1.3650. However, rejection by 1.3022 will maintain medium term bearishness. Break of 1.2005 will resume the down trend from 1.4667 and that carries larger bearish implications too.
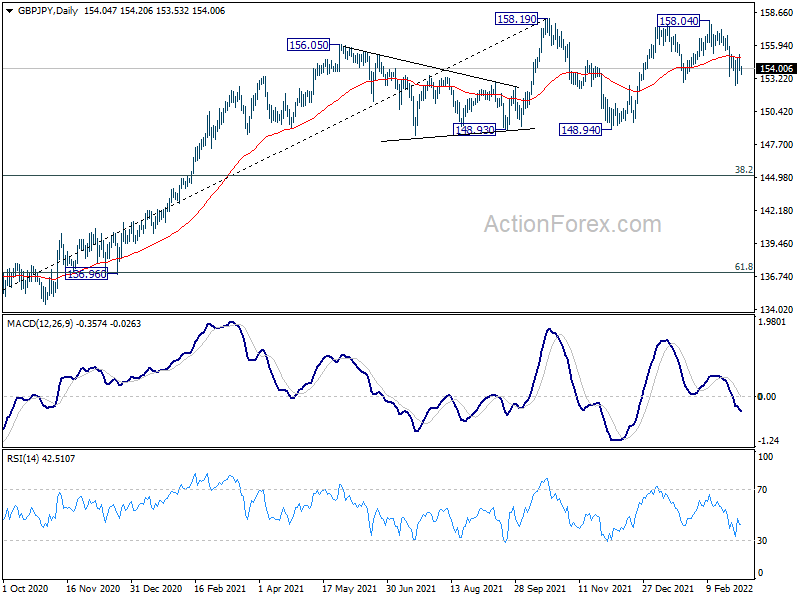
GBP/JPY Daily Outlook
Daily Pivots: (S1) 153.59; (P) 154.41; (R1) 154.95; More...
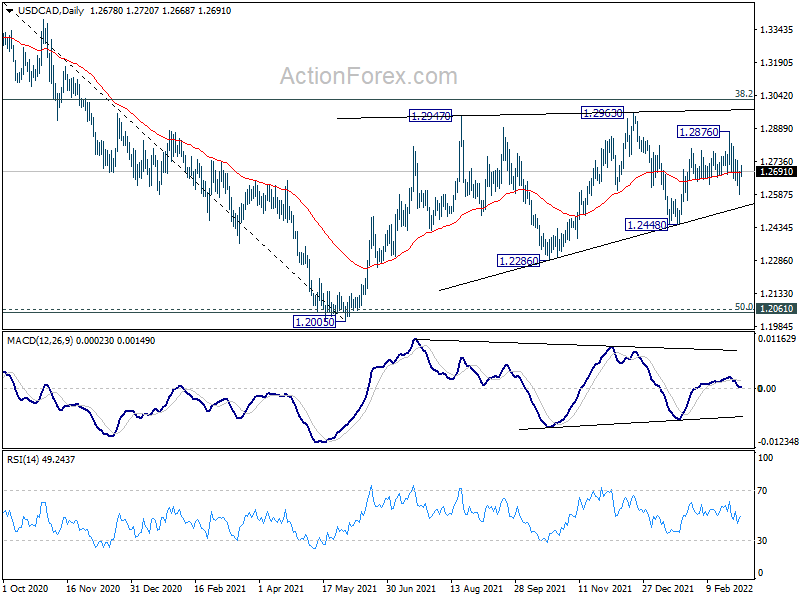
Intraday bias in GBP/JPY remains neutral first and another fall is expected with 155.16 resistance intact. Break of 152.63 will resume the fall from 158.04 to 148.94 support. However, firm break of 155.16 will argue that fall from 158.04 has completed, and turn bias back to the upside for retesting 158.04/19.
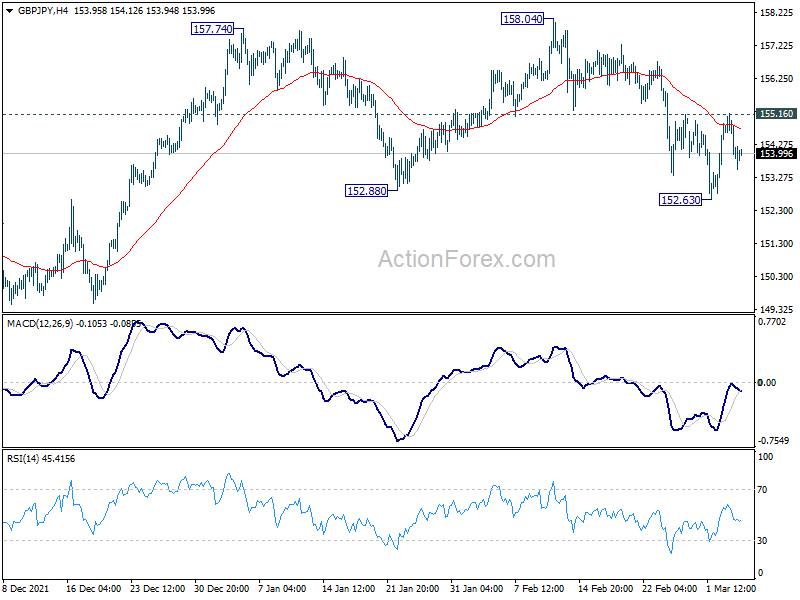
In the bigger picture, price actions from 158.19 are seen as developing into a consolidation pattern to up trend from 123.94 (2020 low). Downside should be contained by 38.2% retracement of 123.94 to 158.19 at 145.10 to bring rebound. Firm break of 158.19 will resume the up trend to long term fibonacci level at 167.93. However, sustained break of 145.10 will raise the chance of trend reversal and target 61.8% retracement at 137.02.