

Sample Category Title
EUR/JPY Daily Outlook
Daily Pivots: (S1) 127.40; (P) 127.96; (R1) 128.32; More....
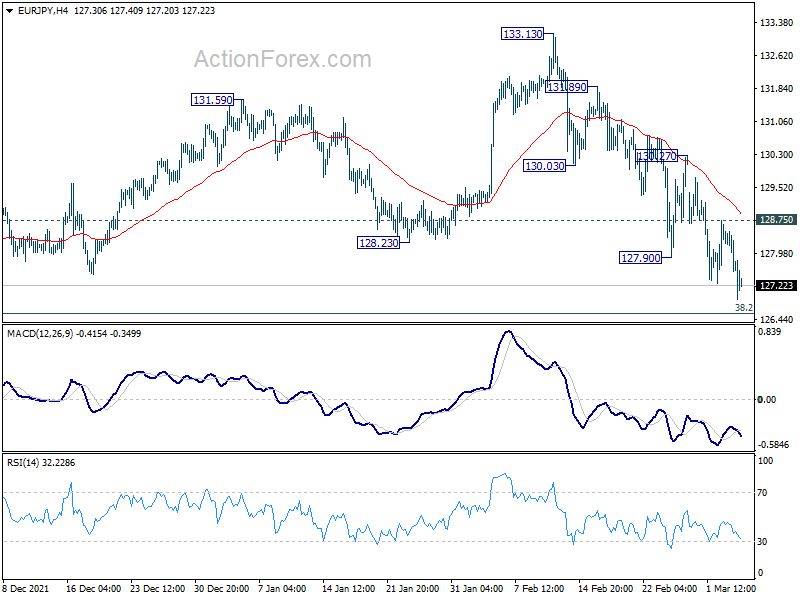
Intraday bias in EUR/JPY stays on the downside for 126.58 fibonacci level. Sustained break there will carry larger bearish implications. Meanwhile, on the upside, above 128.75 minor resistance will turn intraday bias neutral first. But risk will stay on the downside as long as 130.27 resistance holds.
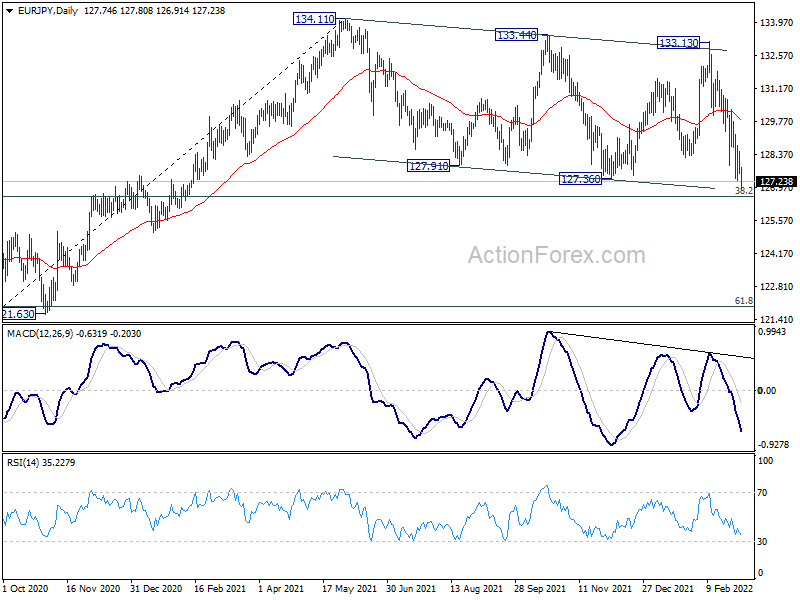
In the bigger picture, price actions from 134.11 are currently seen as a consolidation pattern only. As long as 38.2% retracement of 114.42 (2020 low) to 134.11 at 126.58 holds, up trend from 114.42 is still in favor to continue. Break of 134.11 will target long term resistance at 137.49 (2018 high). However, sustained break of 126.58 will raise the chance of bearish reversal. In this case, deeper decline would be seen to 61.8% retracement at 121.94, and possibly below.
EUR/GBP Daily Outlook
Daily Pivots: (S1) 0.8277; (P) 0.8288; (R1) 0.8302; More...
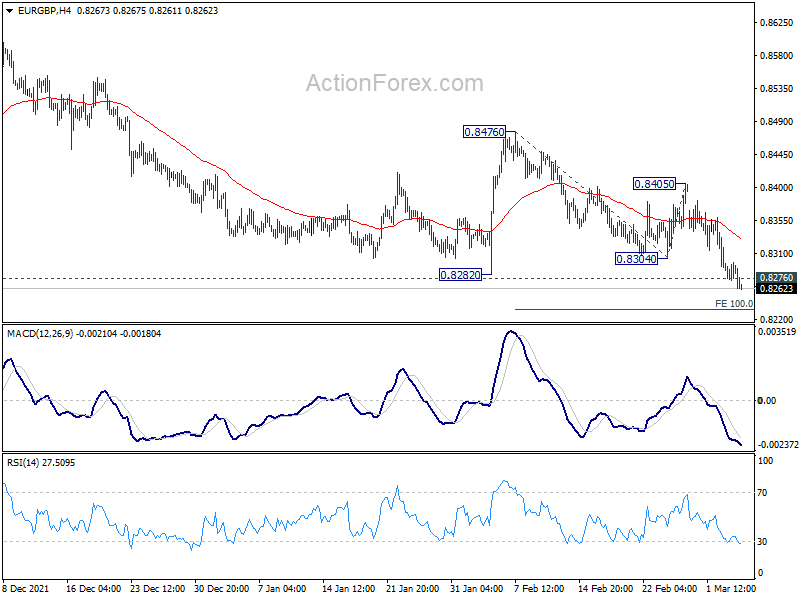
Intraday bias in EUR/GBP remains on the downside. Sustained break of 0.8276 long term support will carry larger bearish implications. Next near term target is 100% projection of 0.8476 to 0.8304 from 0.8405 at 0.8233 and then 161.8% projection at 0.8127. On the upside, break of 0.8405 is needed to indicate short term bottoming. Otherwise, outlook will stay bearish in case of recovery.
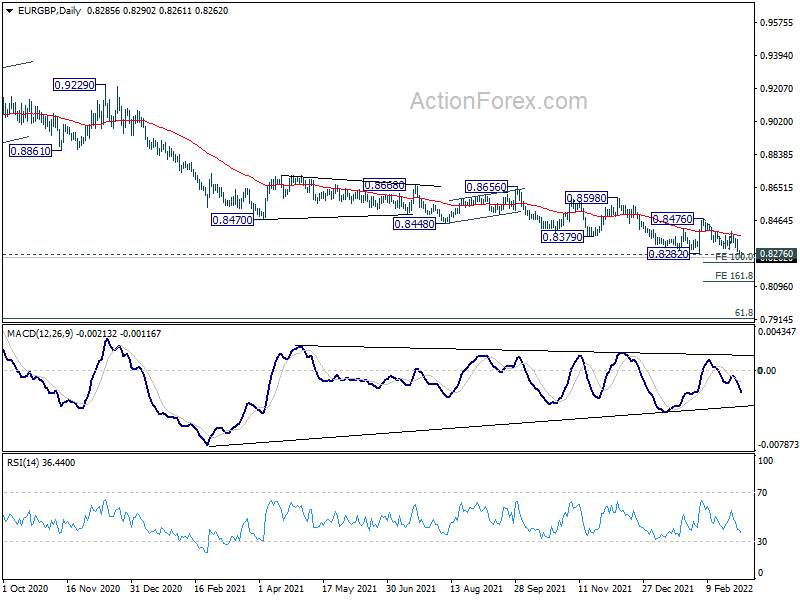
In the bigger picture, focus is now on 0.8276 long term support (2019 low). Sustained break there will argue that the long term trend has reversed. Deeper decline would be seen to 61.8% retracement of 0.6935 to 0.9499 at 0.7917. Nevertheless, break of 0.8476 resistance will indicate medium term bottoming, after drawing support from 0.8276, and bring stronger rally.
EUR/AUD Daily Outlook
Daily Pivots: (S1) 1.5035; (P) 1.5141; (R1) 1.5208; More...
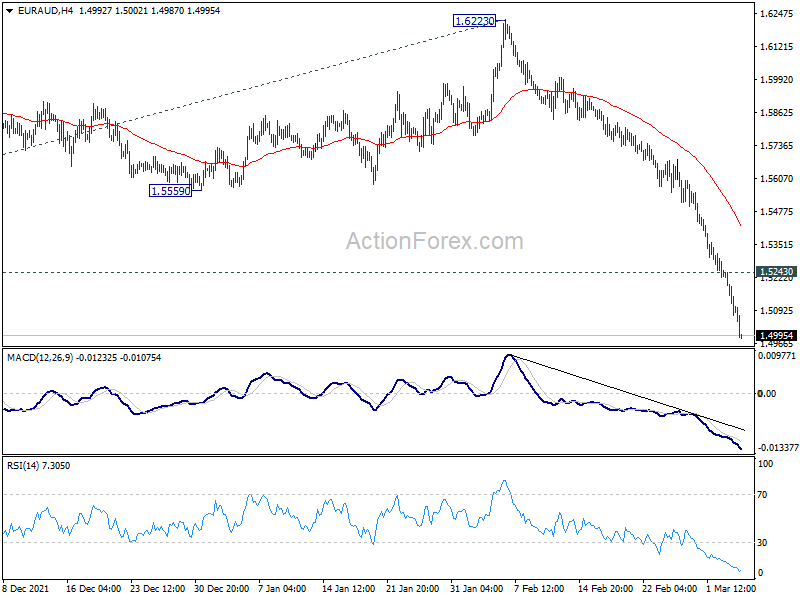
EUR/AUD drops to as low as 1.4987 so far today and there is no sign of bottoming yet. Current decline is part for the down trend from 1.9799. Intraday bias stays on the downside for 161.8% projection of 1.6343 to 1.5354 from 1.6223 at 1.4476. On the upside, above 1.5243 minor resistance will turn intraday bias neutral and bring consolidations, before staging another fall.
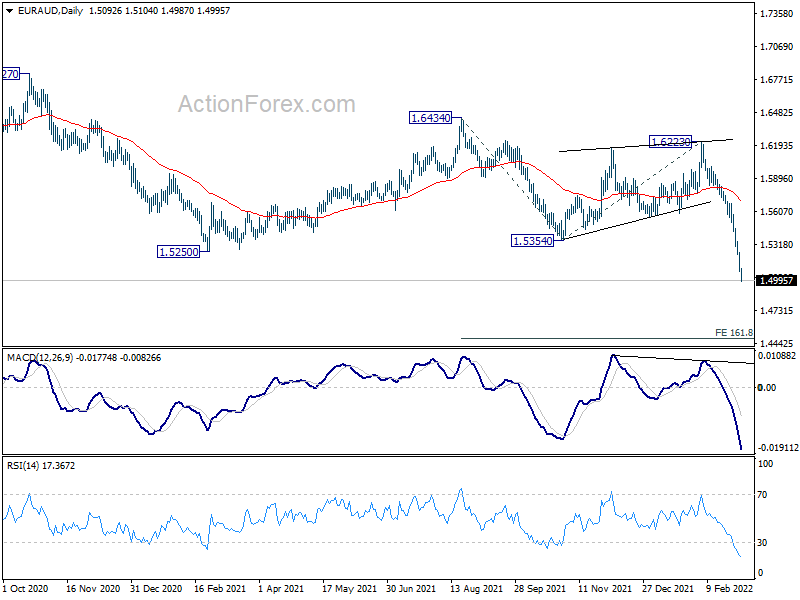
In the bigger picture, down trend from 1.9799 (2020 high) in in progress for 61.8% retracement of 1.1602 (2012 low) to 1.9799 at 1.4733 and below. But we'd tentatively look for bottoming sign above 1.3624 long term support, for an interim rebound. However, break of 1.5354 support turned resistance is now needed to be the first sign of medium term bottoming. Otherwise, outlook will stay bearish in case of rebound.
EUR/CHF Daily Outlook
Daily Pivots: (S1) 1.0125; (P) 1.0183; (R1) 1.0211; More....
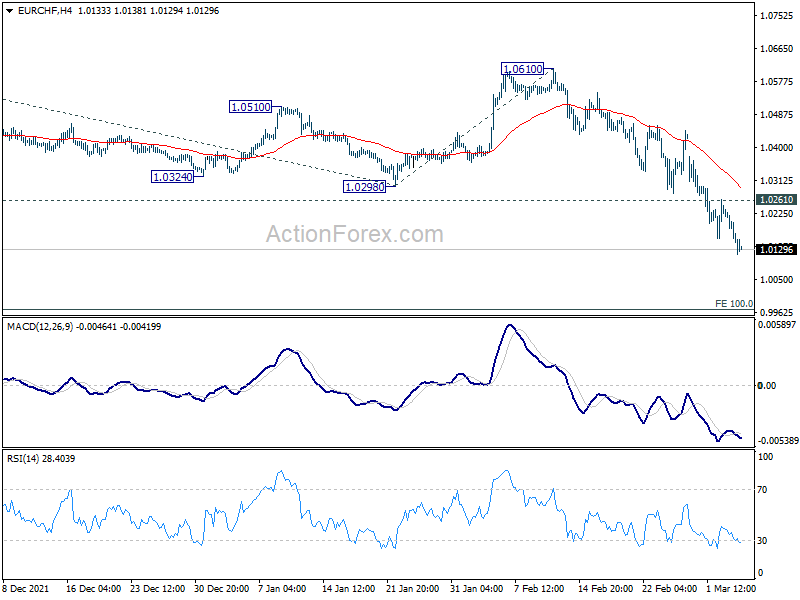
EUR/CHF drops further to as low as 1.0115 so far and intraday bias remains on the downside. Current fall is part of the down trend from 1.1149, and should target 100% projection of 1.0936 to 1.0298 from 1.0610 at 0.9972. On the upside, break of 1.0251 minor resistance will turn intraday bias neutral and bring consolidations first, before staging another decline.
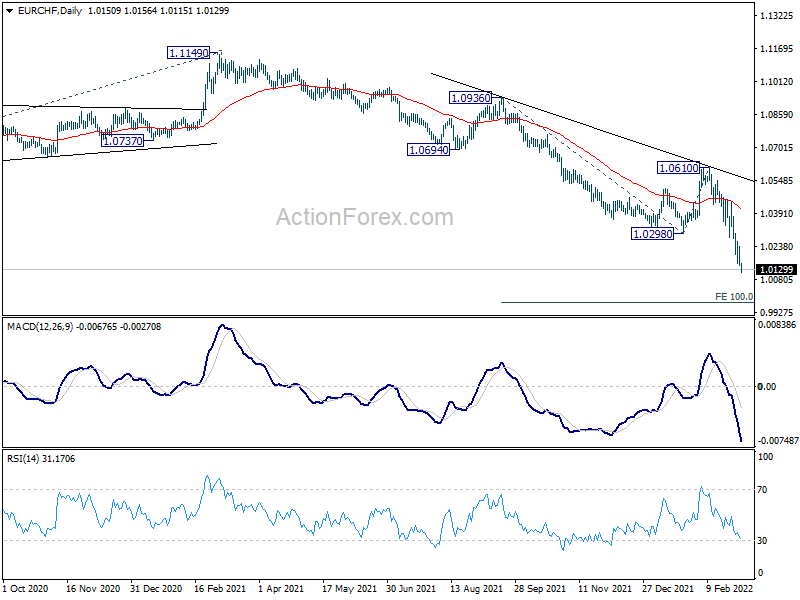
In the bigger picture, long term down trend from 1.2004 (2018 high) is still in progress. Next target is 100% projection of 1.2004 to 1.0505 to 1.1149 at 0.9650. In any case, break of 1.0610 resistance is needed to be the first sign of medium term bottoming. Otherwise, outlook will remain bearish.
Euro Still in Decline, No End in Sight Yet
Markets sentiment took another dive on reports of Russia's attack on a nuclear complex in Ukraine. Euro is extending recent decline, together will steep selloff in Asian stocks. Meanwhile, Australian Dollar is solidifying upside momentum, taking New Zealand Dollar higher too. Dollar remains mixed and will look into non-farm payroll report from the US. But the data would likely be overwhelmed by any developments in Russia's invasion of Ukraine.
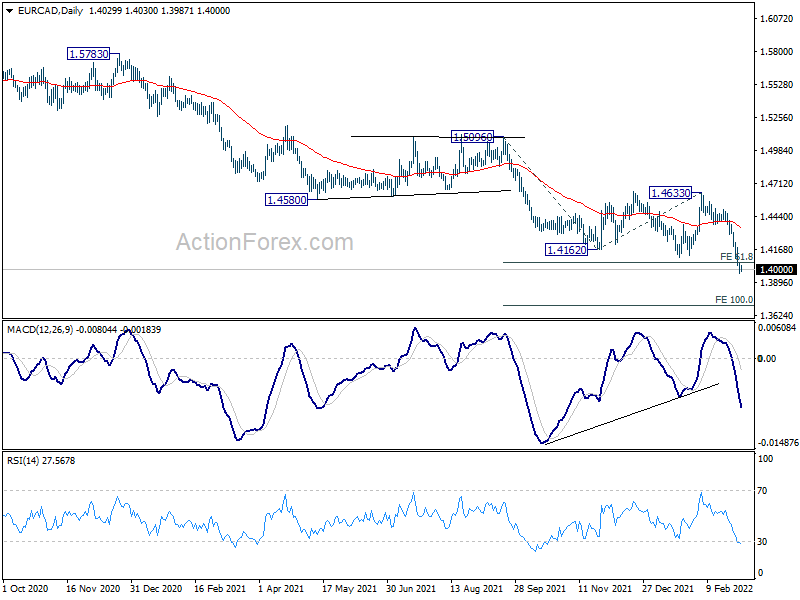
Technically, EUR/CAD took out initial target of 61.8% projection of 1.5096 to 1.4162 from 1.4633 at 1.4056, without much hesitation. Deeper fall should be seen to 100% projection at 1.3699. EUR/AUD broke 100% projection of 1.6343 to 1.5354 from 1.6223 at 1.5143, and it's on track to 161.8% projection at 1.4476. EUR/CHF is also on the way to 100% projection of 1.0936 to 1.0298 from 1.0610 at 0.9972. Things are not looking good for the common currency.
In Asia, Nikkei closed down -2.32%. Hong Kong HSI is down -2.38%. China Shanghai SSE is down -0.96%. Singapore Strait Times is down -0.14%. Japan 10-year JGB yield is down -0.0148 at 0.154. Overnight, DOW dropped -0.29%. S&P 500 dropped -0.53%. NASDAQ dropped -1.56%. 10-year yield dropped -0.021 to 1.844.
BoC Macklem not fulling out a 50bps hike if needed
BoC Governor Tiff Macklem said in a speech yesterday, "tighter monetary policy is necessary to lower the parts of inflation that are driven by domestic demand. And that is critical to bringing price increases back in line with our 2% inflation target."
BoC will also be considering when to move to quantitative tightening, or QT. "The timing and pace of further increases in the policy rate, and the start of QT, will be guided by the Bank's ongoing assessment of the economy and its commitment to achieving the 2% inflation target," he added.
In the Q&A session, Macklem said, there is certainly considerable space to raise interest rates over the course of the year". "If we have to move more quickly, we are prepared to do that," he added. "I am not going to rule out a 50-basis-point move in the future."
Fed Williams: Higher oil prices not a stagflation issue
New York Fed President John Williams said the higher oil prices stemming from Russia invasion of Ukraine may act like a "tax" on American consumers. But, "the economy is coming into this with a lot of forward momentum. It's definitely not a stagflation issue."
Williams expect inflation to come down later this year but stays "well above" 2% target. He emphasized Fed has the "ability to adjust interest rates higher if inflation ends up being much more persistent or staying much higher than we expect or want".
New Zealand ANZ consumer confidence dropped to record low
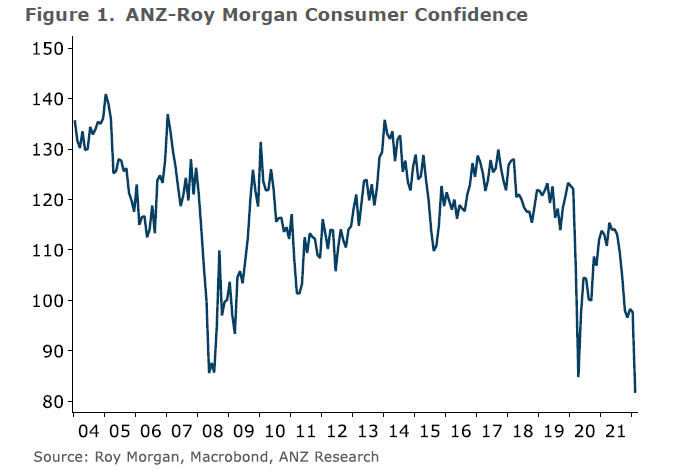
New Zealand ANZ-Roy Morgan consumer confidence dropped -16 pts to 81.7 in February, hitting a record low since data began in 2004. Inflation expectations were little changed at 5.6% while house price inflation expectations eased from 5.3% to 4.8%.
ANZ said: "This month's data looks grim, but there are undoubtedly some temporary impacts in there. Time will tell what the other side looks like, but we do know that Omicron is fast and furious, and will blow through relatively quickly.
Australia retail sales rose 1.8% mom in Jan
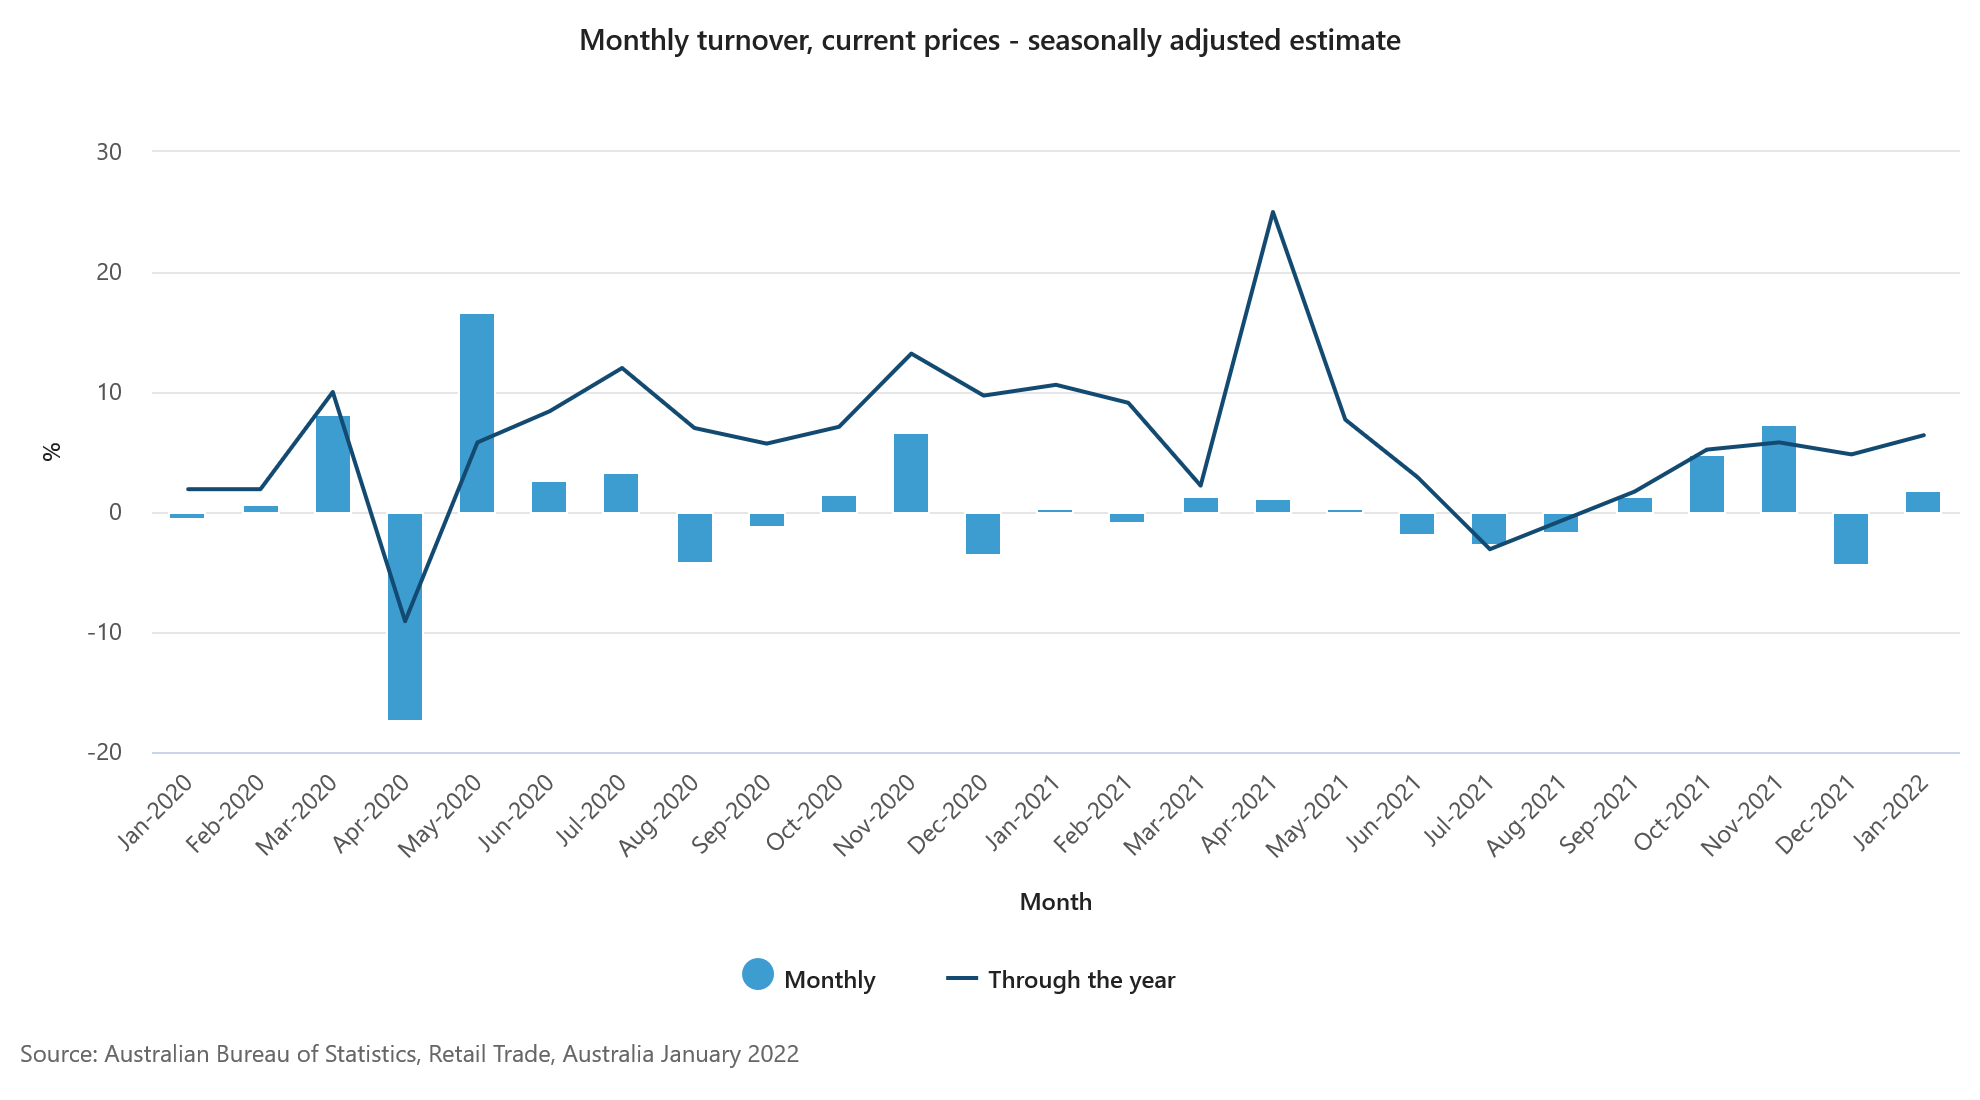
Australia retail sales rose 1.8% mom to AUD 32.49B in January. Comparing to the same month a year ago, sales rose 6.4% yoy.
"The emergence of the Omicron variant and rising COVID-19 case numbers, combined with an absence of mandated lockdowns has resulted in a range of different consumer behaviours. We have seen the type of spending previously associated with lockdowns occurring simultaneously with those associated with the easing of lockdown conditions," Director of Quarterly Economy Wide Statistics, Ben James said.
"This had led to variations across the industries with Food retailing recording a rise in sales consistent with previous COVID-19 outbreaks as consumers exercise caution amidst surging case numbers. However, the absence of lockdowns meant that other discretionary industries which would usually see a fall during the pandemic have recorded mixed results."
Looking ahead
Germany trade balance, France industrial output, UK PMI construction, and Eurozone retail sales will be released in European session. Later in the day, US will release non-farm payrolls. Canada will release building permits and Ivey PMI.
EUR/CHF Daily Outlook
Daily Pivots: (S1) 1.0125; (P) 1.0183; (R1) 1.0211; More....
EUR/CHF drops further to as low as 1.0115 so far and intraday bias remains on the downside. Current fall is part of the down trend from 1.1149, and should target 100% projection of 1.0936 to 1.0298 from 1.0610 at 0.9972. On the upside, break of 1.0251 minor resistance will turn intraday bias neutral and bring consolidations first, before staging another decline.
In the bigger picture, long term down trend from 1.2004 (2018 high) is still in progress. Next target is 100% projection of 1.2004 to 1.0505 to 1.1149 at 0.9650. In any case, break of 1.0610 resistance is needed to be the first sign of medium term bottoming. Otherwise, outlook will remain bearish.
Economic Indicators Update
| GMT | Ccy | Events | Actual | Forecast | Previous | Revised |
|---|---|---|---|---|---|---|
| 23:30 | JPY | Unemployment Rate Jan | 2.80% | 2.70% | 2.70% | |
| 07:00 | EUR | Germany Trade Balance (EUR) Jan | 7.5B | 6.8B | ||
| 07:45 | EUR | France Industrial Output M/M Jan | 0.40% | -0.20% | ||
| 09:30 | GBP | Construction PMI Feb | 57.4 | 56.3 | ||
| 10:00 | EUR | Eurozone Retail Sales M/M Jan | 1.50% | -3.00% | ||
| 13:30 | CAD | Labor Productivity Q/Q Q4 | -0.20% | -1.50% | ||
| 13:30 | USD | Nonfarm Payrolls Feb | 438K | 467K | ||
| 13:30 | USD | Unemployment Rate Feb | 3.90% | 4.00% | ||
| 13:30 | USD | Average Hourly Earnings M/M Feb | 0.60% | 0.70% | ||
| 13:30 | CAD | Building Permits M/M Jan | 0.10% | -1.90% | ||
| 15:00 | CAD | Ivey PMI Feb | 54.2 | 57.4 |
Technical Outlook and Review
DXY:
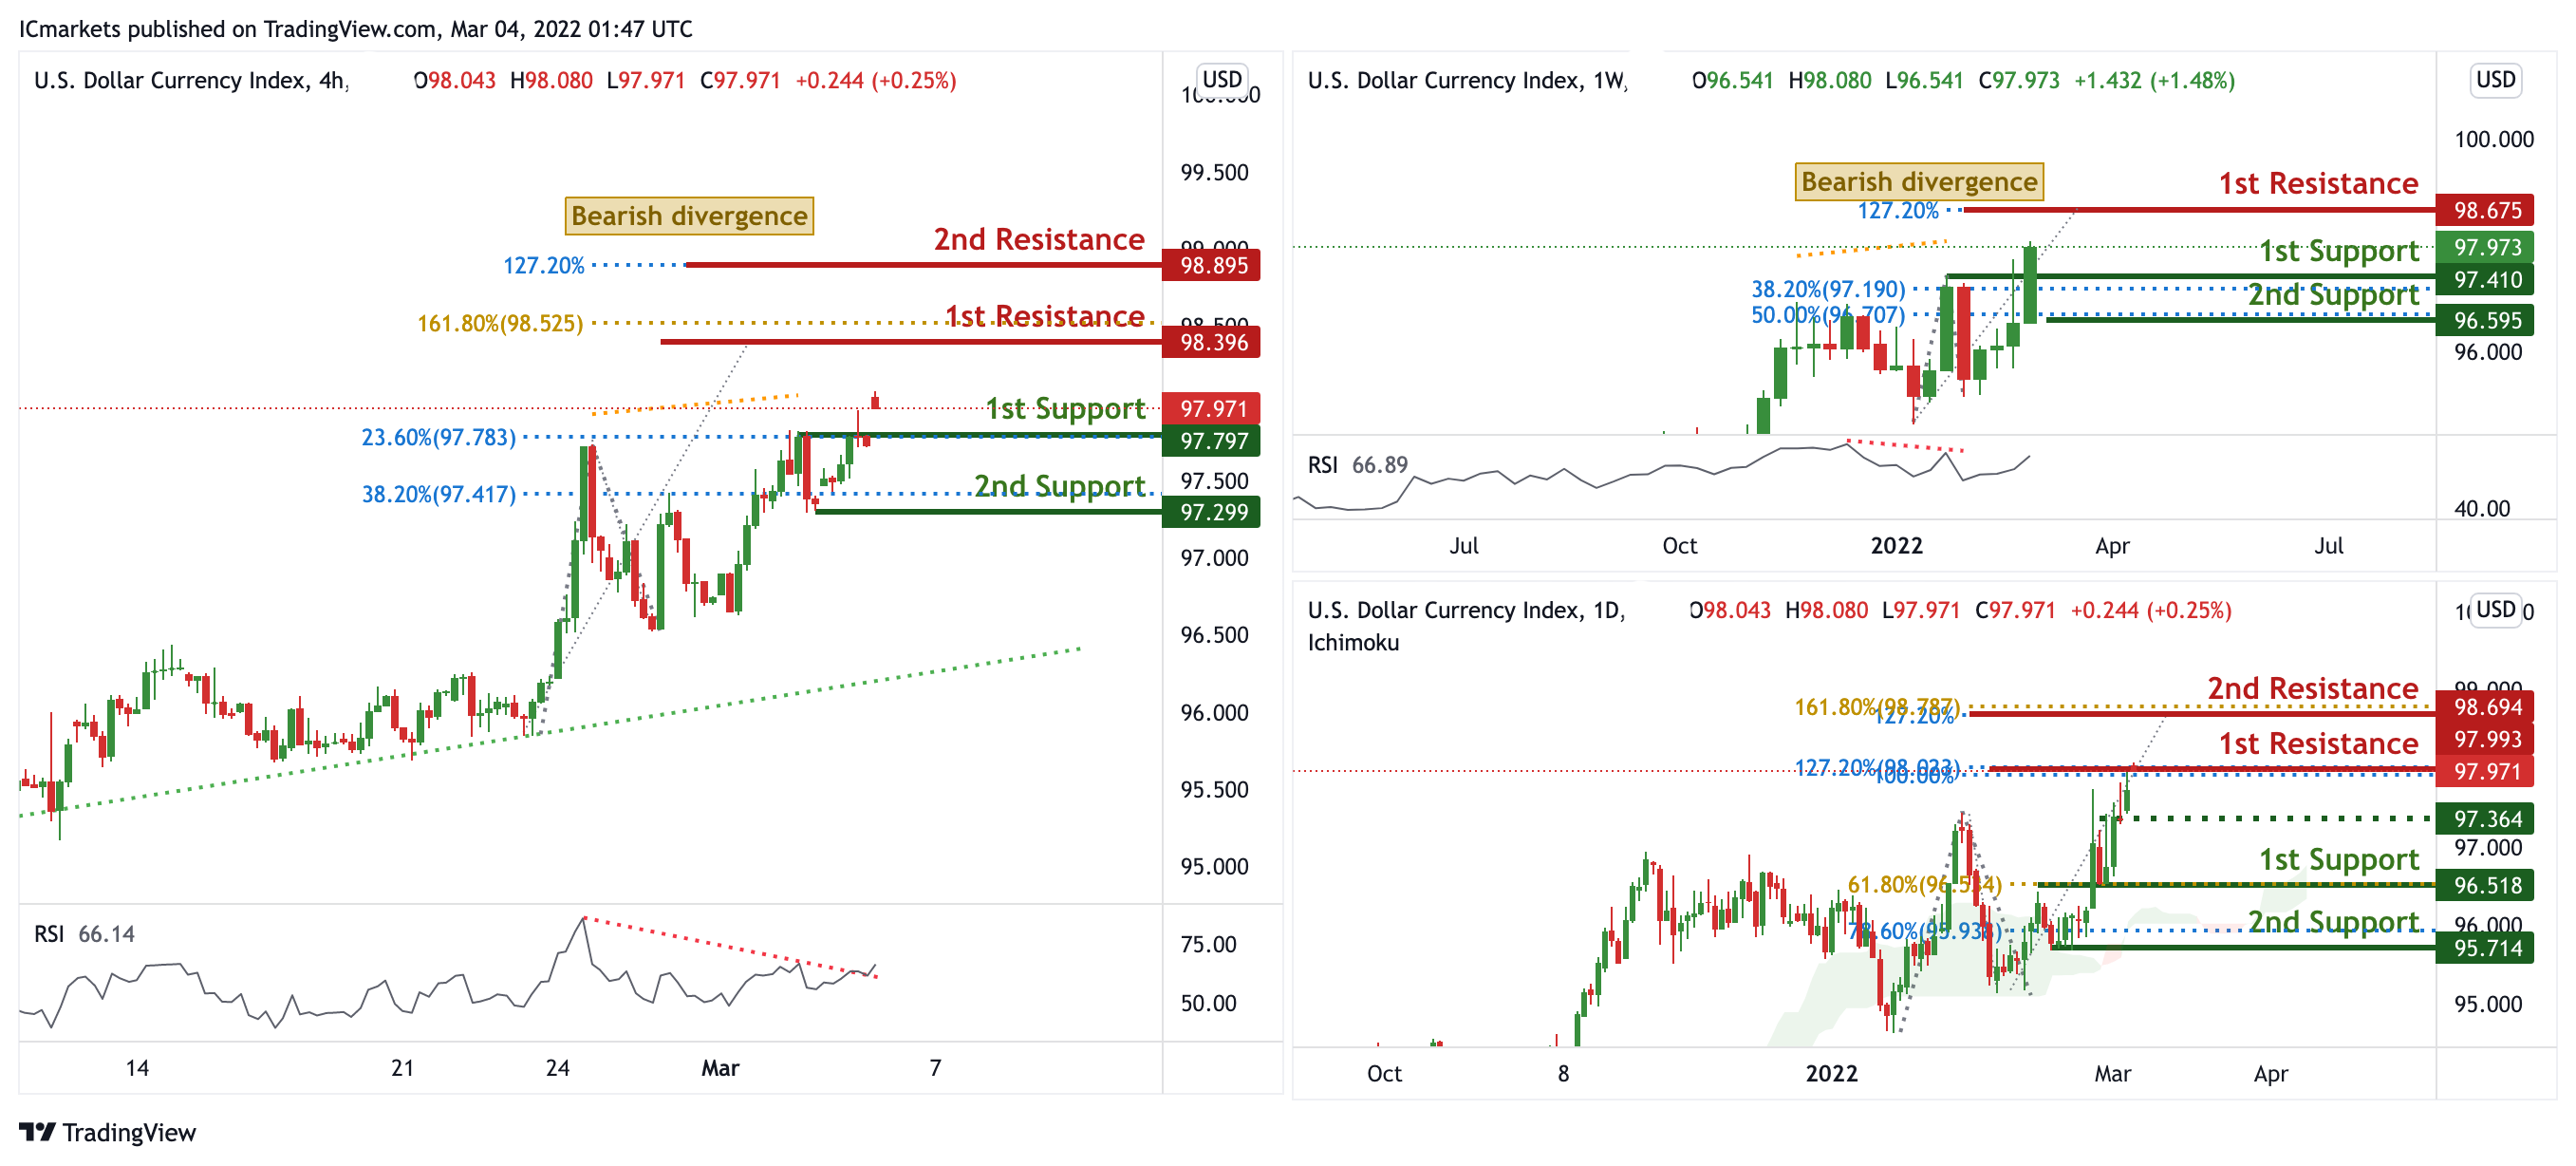
On the weekly, prices are on bullish momentum. We see potential for prices to dip from our 1st resistance at 98.675 in line with 127.2% Fibonacci extension towards our 1st support at 97.410 in line with 38.2% Fibonacci retracement. Divergence is spotted on RSI, further supporting our bearish bias.
On the daily, prices are at a strong resistance. We would watch for our intermediate support for a potential break. A break would result in prices dipping downwards to our 1st support structure at 96.518 in line with 61.8% Fibonacci retracement. Alternatively, prices may travel higher towards our 1st resistance at 97.971 in line with 100% and 127.2% Fibonacci extension.
On the H4 timeframe, prices are abiding to a daily ascending trendline and are at a pivot. We would expect a pullback from our 1st resistance at 98.396 in line with 161.8% Fibonacci projection towards our 1st support at 97.797 in line with 23.6% Fibonacci retracement. RSI is on bearish depicting bearish divergence, further supporting our bearish bias.
Areas of consideration:
- H4 time frame, 1st resistance at 98.396
- H4 time frame, 1st support at 97.797
XAU/USD (GOLD):
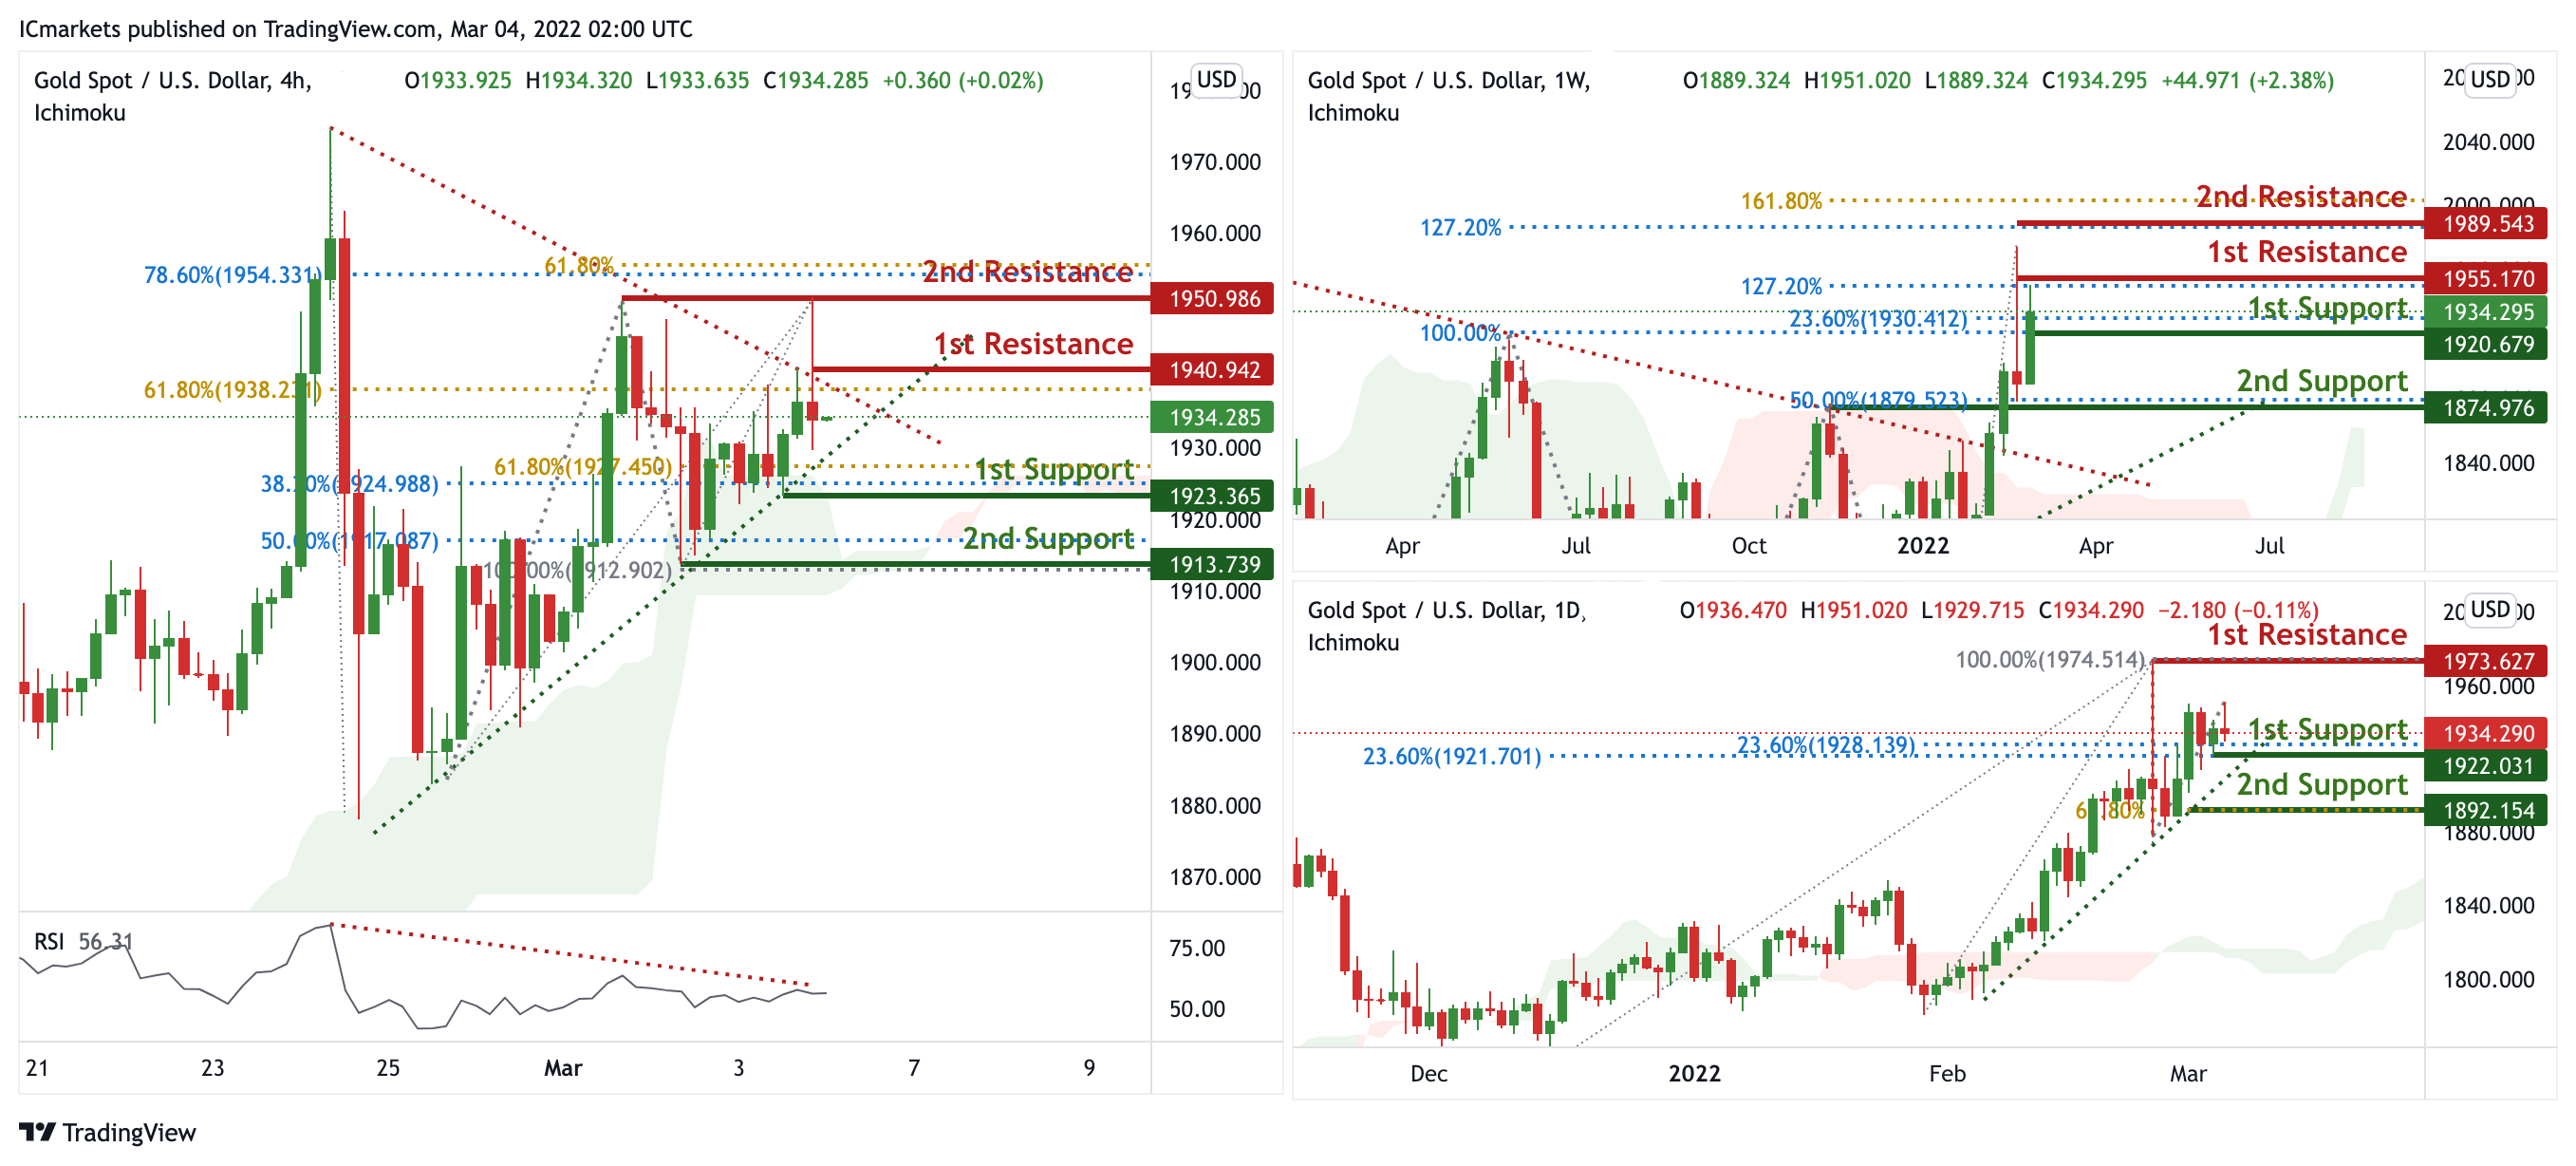
On the weekly, prices have broken out of our triangle and are on bullish momentum. We see the potential for prices to climb further from our 1st support at 1920.679 in line with 23.6% Fibonacci retracement and 100% FIbonacci extension towards our 1st resistance at 1955.170 in line with 127.2% Fibonacci extension. Prices are trading above our ichimoku cloud support, further supporting our bullish bias.
On the daily, prices are on bullish momentum and abiding to our ascending trendline support. We see potential for a bounce from our 1st support at 1922.031 in line with 23.6% Fibonacci retracement and 23.6% Fibonacci retracement towards our 1st resistance at 1973.627 in line with 100% Fibonacci retracement. Prices are trading above our Ichimoku clouds further supporting our bullish bias.
On the H4 chart, prices are consolidating in a triangle pattern. We see potential for prices to dip from our 1st resistance at 1940.942 in line with 61.8% Fibonacci extension towards our 1st support at 1923.365 in line with 38.2% Fibonacci retracement and 61.8% Fibonacci extension. RSI is portraying bearish momentum and ichimoku is forecasting bearish momentum, further supporting our bearish bias.
Areas of consideration:
- 4h 1st support at 1923.365
- 4h 1st resistance at 1913.739
GBP/USD:
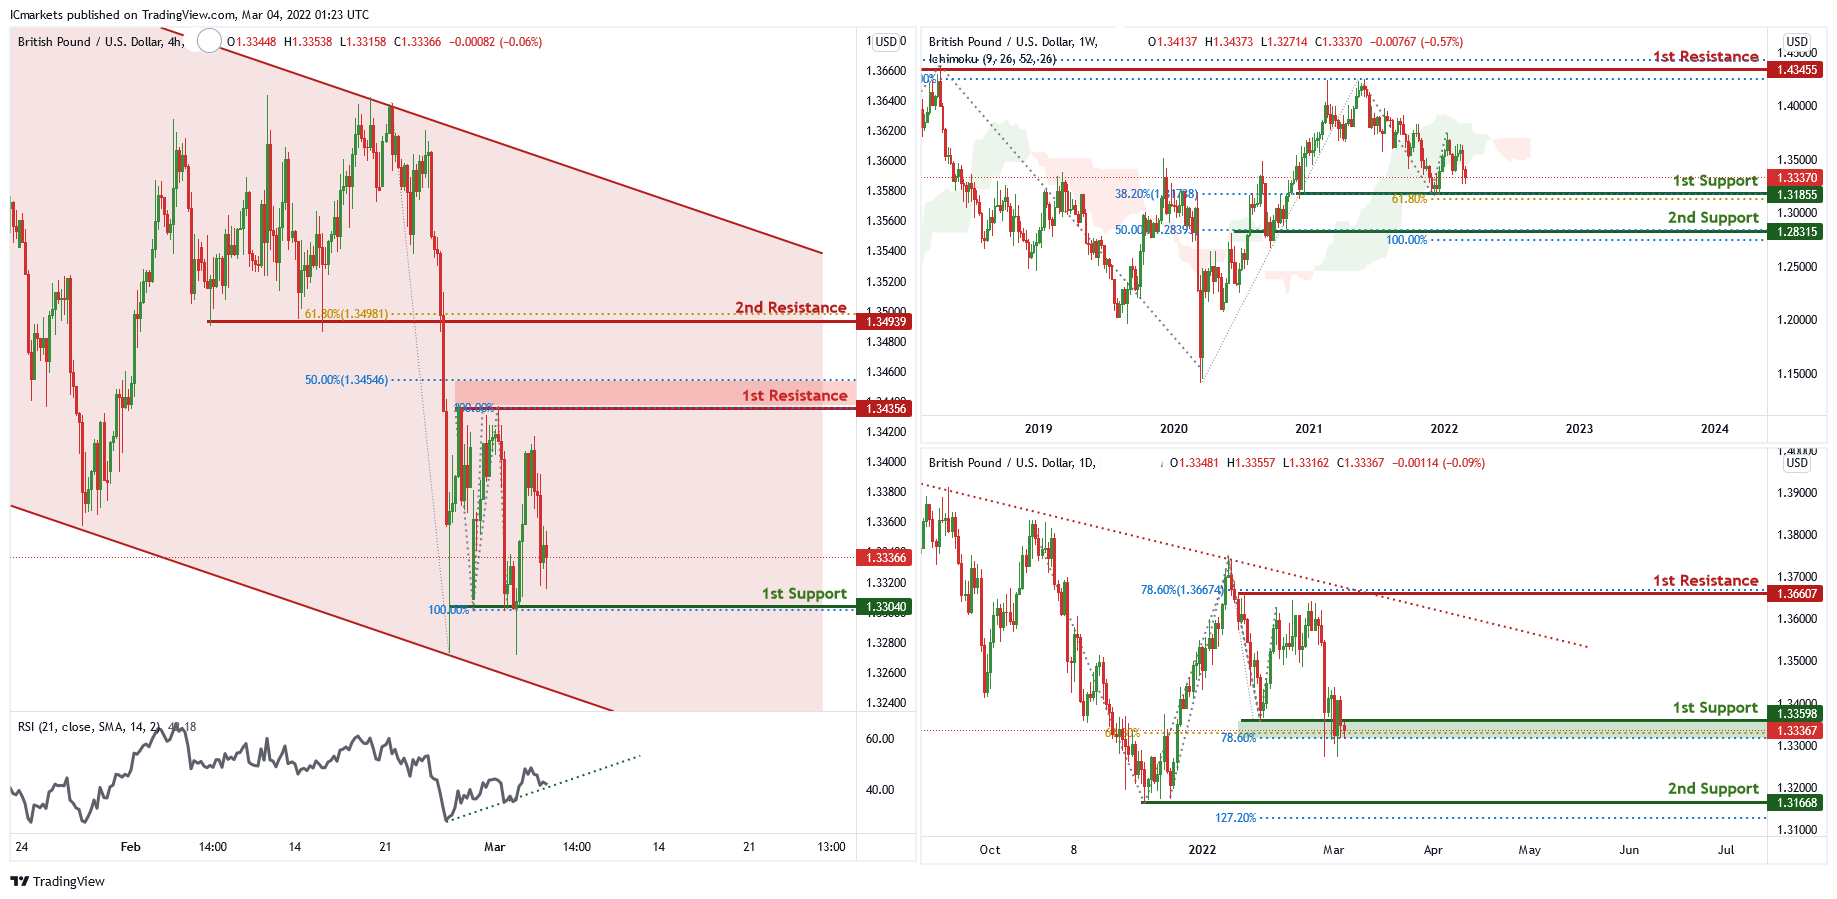
On the weekly chart , price has recently bounced off the 1st support level of 1.31885 which is also 38.2% Fibonacci retracement and 61.8% Fibonacci projection. Price can potentially go to the 1st resistance level of 1.42498 which is also 100% Fibonacci projection and 50% Fibonacci retracement. Our bullish bias is supported by the ichimoku cloud indicator.
On the daily chart , price is abiding by a descending trendline . Price can potentially bounce from the 1st support level of 1.33598 in line with 78.6% Fibonacci retracement and 61.8% Fibonacci projection to the 1st resistance level of 1.36607 in line with 78.6% Fibonacci retracement. Our bullish bias is supported by technical indicators
On the H4 chart, price is trading in a descending channel and near 1st support level of 1.33040 in line with 100% Fibonacci projection. Price can potentially bounce to 1st resistance level of 1.34356 in line with 50% Fibonacci retracement and 100% Fibonacci projection. Our bullish bias is supported by the RSI indicator as it is abiding by an ascending trendline.
Areas of consideration
- H4 1st resistance at 1.34356
- H4 1st support at 1.33040
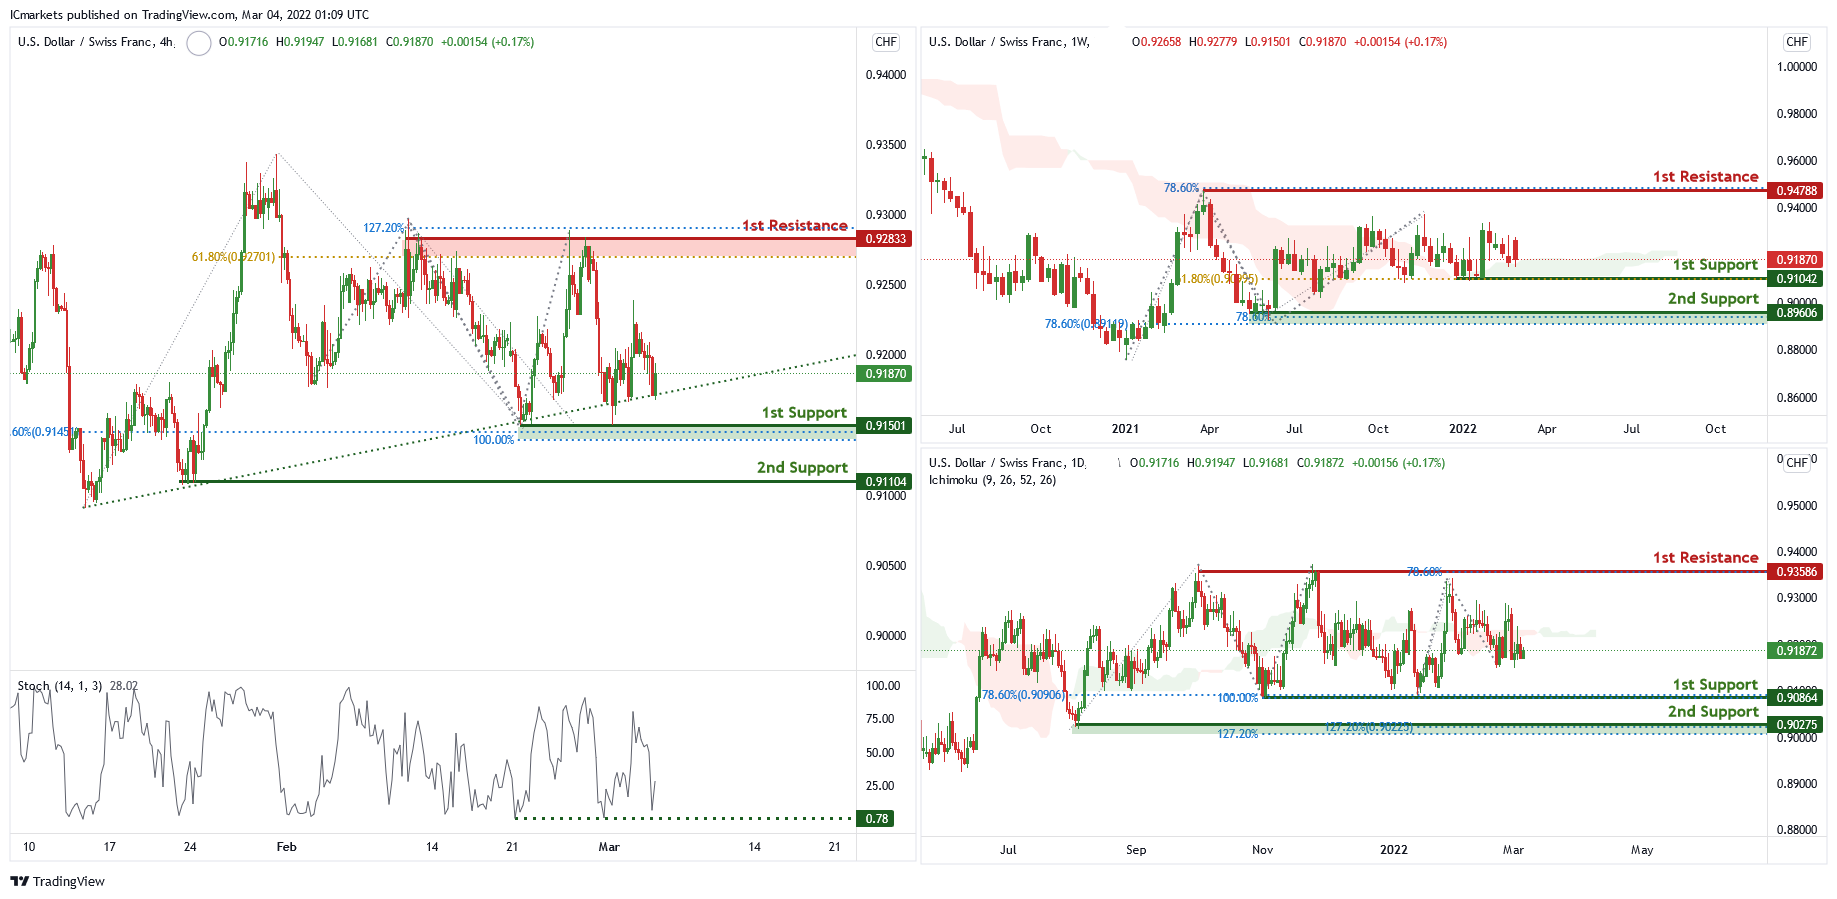
USD/CHF:
On the weekly chart, price is between 1st support level of 0.91042 in line with 61.8% Fibonacci retracement and 1st resistance level of 0.94788 in line with 78.6% Fibonacci projection. Price can potentially go to the 1st resistance level. Our bullish bias is supported by the ichimoku cloud indicator.
On the daily chart price is between 1st support of 0.90864 in line with 100% Fibonacci projection, 78.6% Fibonacci retracement and 1st resistance level of 0.93586 in line with 78.6% Fibonacci projection. Price can potentially go to the 1st resistance level which is also the graphical swing high level. Our bullish bias is supported by the ichimoku cloud indicator.
On the H4, price is abiding by an ascending trendline and near 1st support level of 0.91501 in line with 78.% Fibonacci retracement and 100% Fibonacci projection. Price can potentially bounce to the 1st resistance level of 0.92251 in line with 61.8% Fibonacci retracement and 127% Fibonacci projection. Our bullish bias is supported by the stochastic indicator as it is at support level.
Areas of consideration
- 1st support level at 0.91501
- 1st resistance level at 0.92833
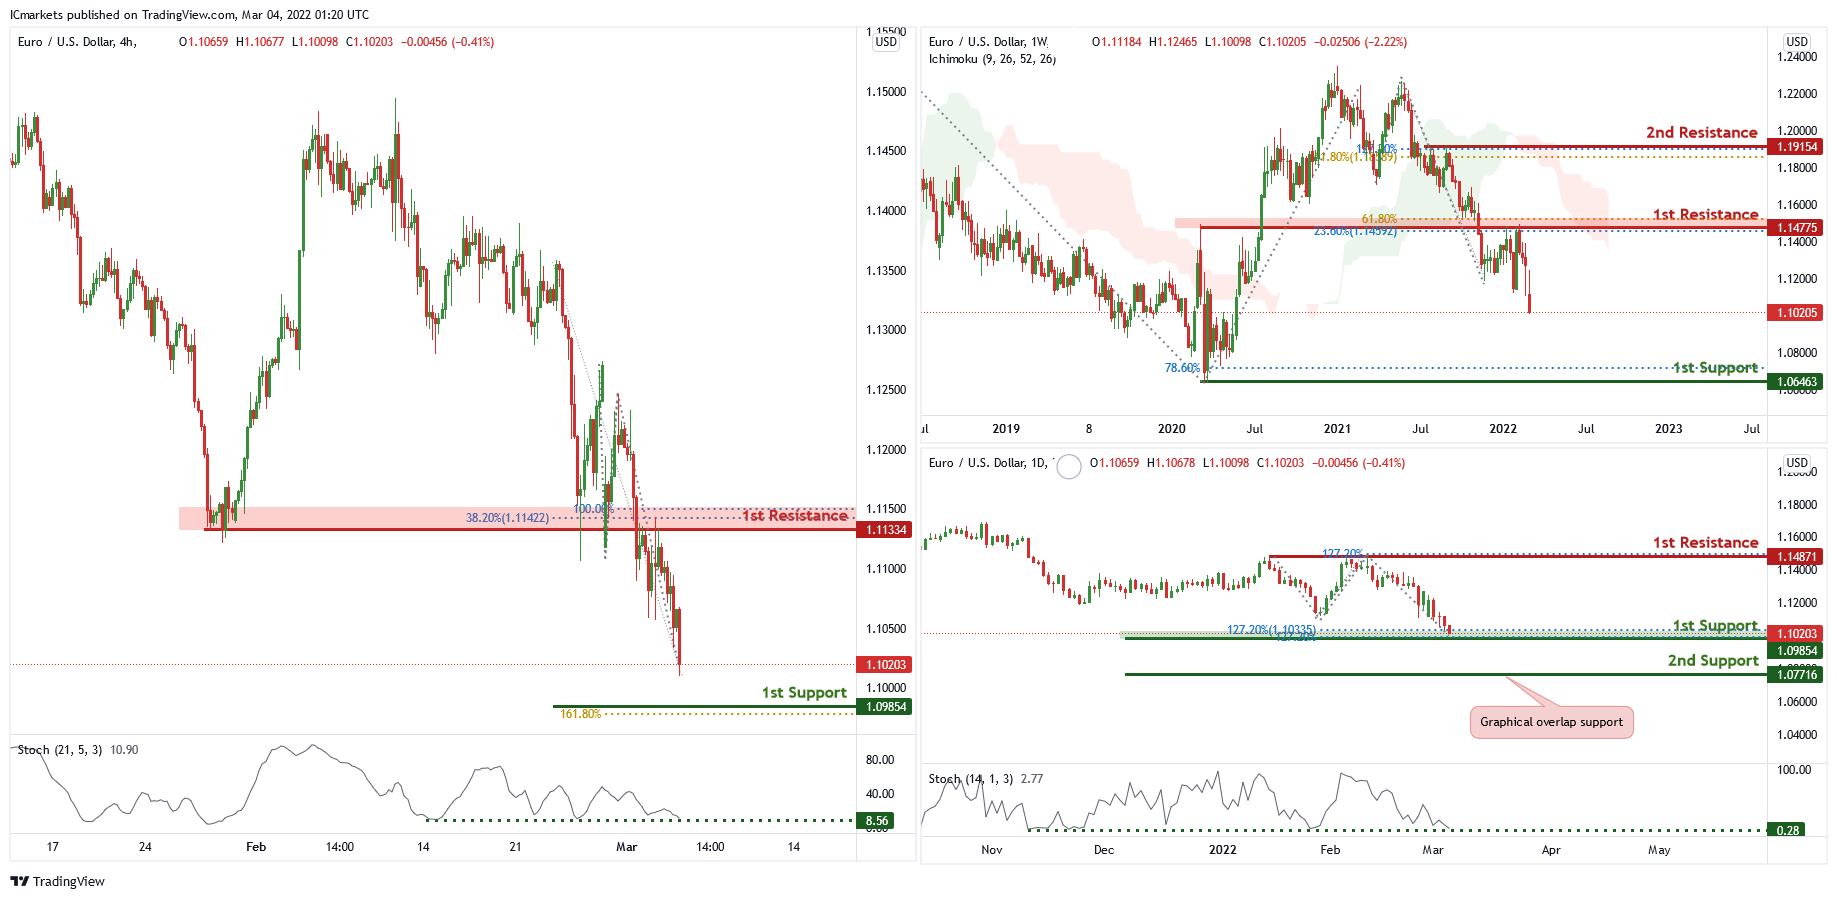
EUR/USD :
On the weekly chart , price is near 1st resistance level of 1.14775 in line with 23.6% Fibonacci retracement and 61.8% Fibonacci projection. Price can potentially dip to the 1st support level of 1.06463 in line with 78.6% Fibonacci projection. Our bearish bias is supported by the ichimoku cloud indicator as price is trading below it.
On the daily chart, price is at 1st support level of 1.09854 in line with 127.2% Fibonacci projection and 127.2% Fibonacci retracement. Price can bounce to the 1st resistance level of 1.14871 in line with 127.2% Fibonacci projection and graphical swing high . Our bullish bias is supported by the stochastic indicator as it is at support level.
On the H4 chart , price is near 1st support level of 1.09854 in line with 161.8% Fibonacci projection and daily graphical support. Price can potentially bounce from 1st support to 1st resistance level of 1.11334 in line with 100% Fibonacci projection and 38.2% Fibonacci retracement. Our bullish bias is supported by the stochastic indicator as it is at support level.
Areas of consideration :
- H4 1st resistance at 1.11334
- H4 1st support at 1.09854
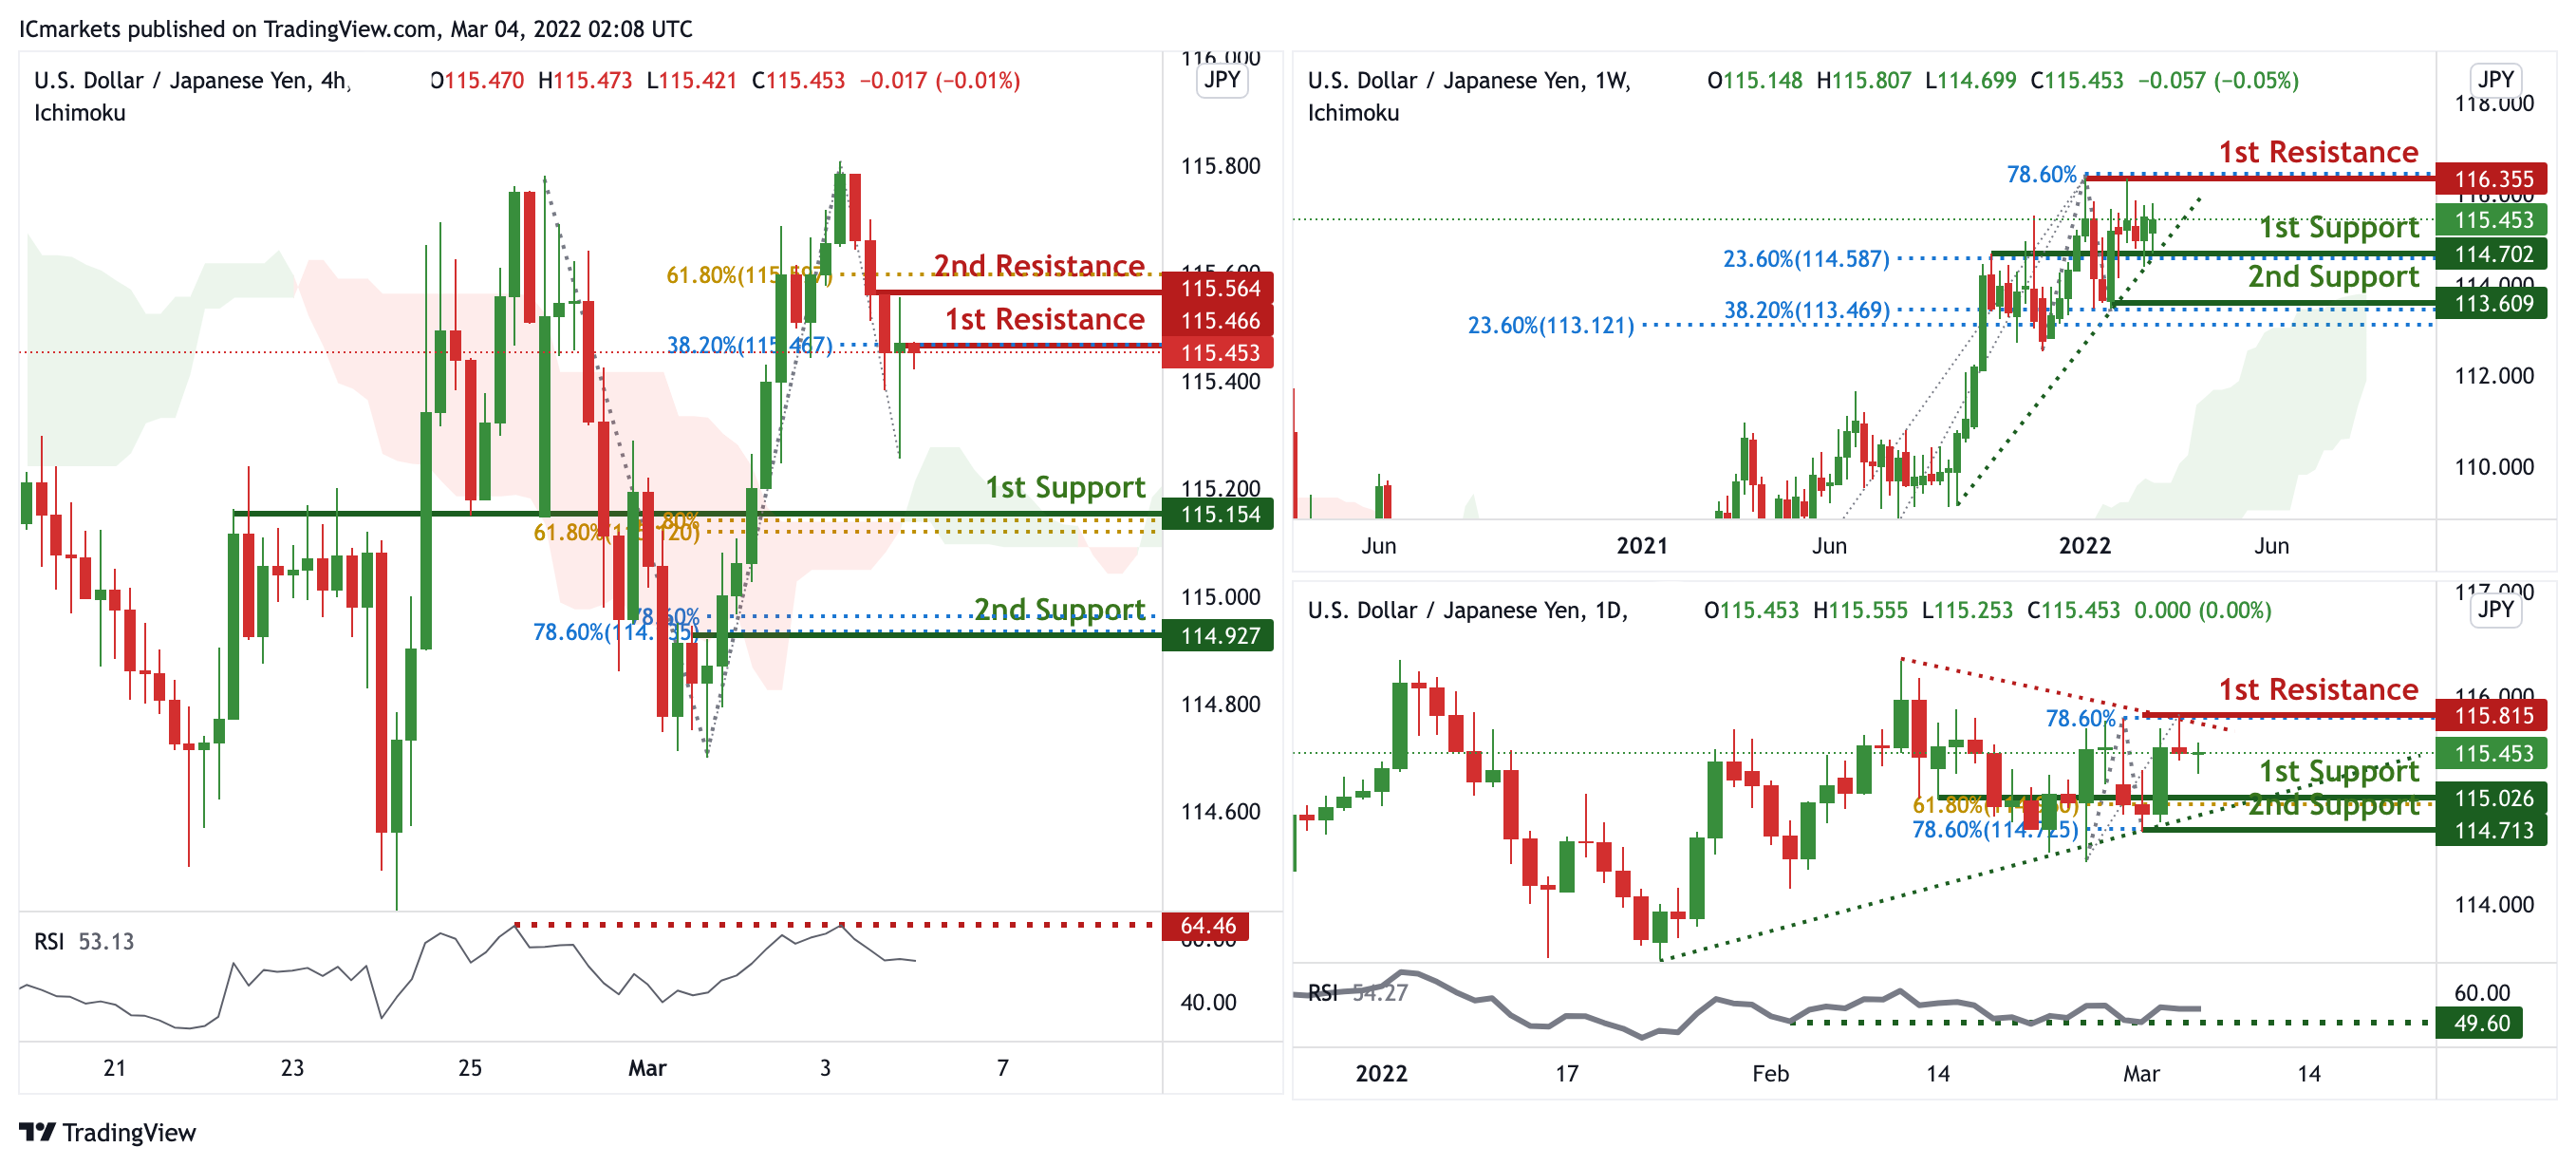
USD/JPY:
On the weekly, prices are on bullish momentum and abiding by an ascending trendline. We see the potential for further bullish continuation from our 1st support at 114.702 in line with 61.8% Fibonacci retracement towards our 1st resistance at 116.355 in line with 78.6% Fibonacci retracement. Prices are trading above our ichimoku cloudsm further supporting our bullish bias. On the daily, prices are consolidating in a triangle pattern. We see the potential for further bullish continuation from our 1st support at 115.026 in line with 61.8% Fibonacci retracement towards our 1st resistance at 115.815 in line with 78.6% Fibonacci extension. RSI is at levels where bounces previously occurred. On the H4 timeframe, prices are forming a potential double top. We see the potential for further bearish momentum from our 1st resistance at 115.466 in line with 38.2% Fibonacci retracement towards our 1st support at 115.154 which is in line with 61.8% Fibonacci retracement and 61.8% Fibonacci extension. Our bearish bias is RSI being at levels where dips occurred previously..
Areas of consideration:
- H4 time frame, 1st resistance at 115.605
- H4 time frame, 1st support at 115.157
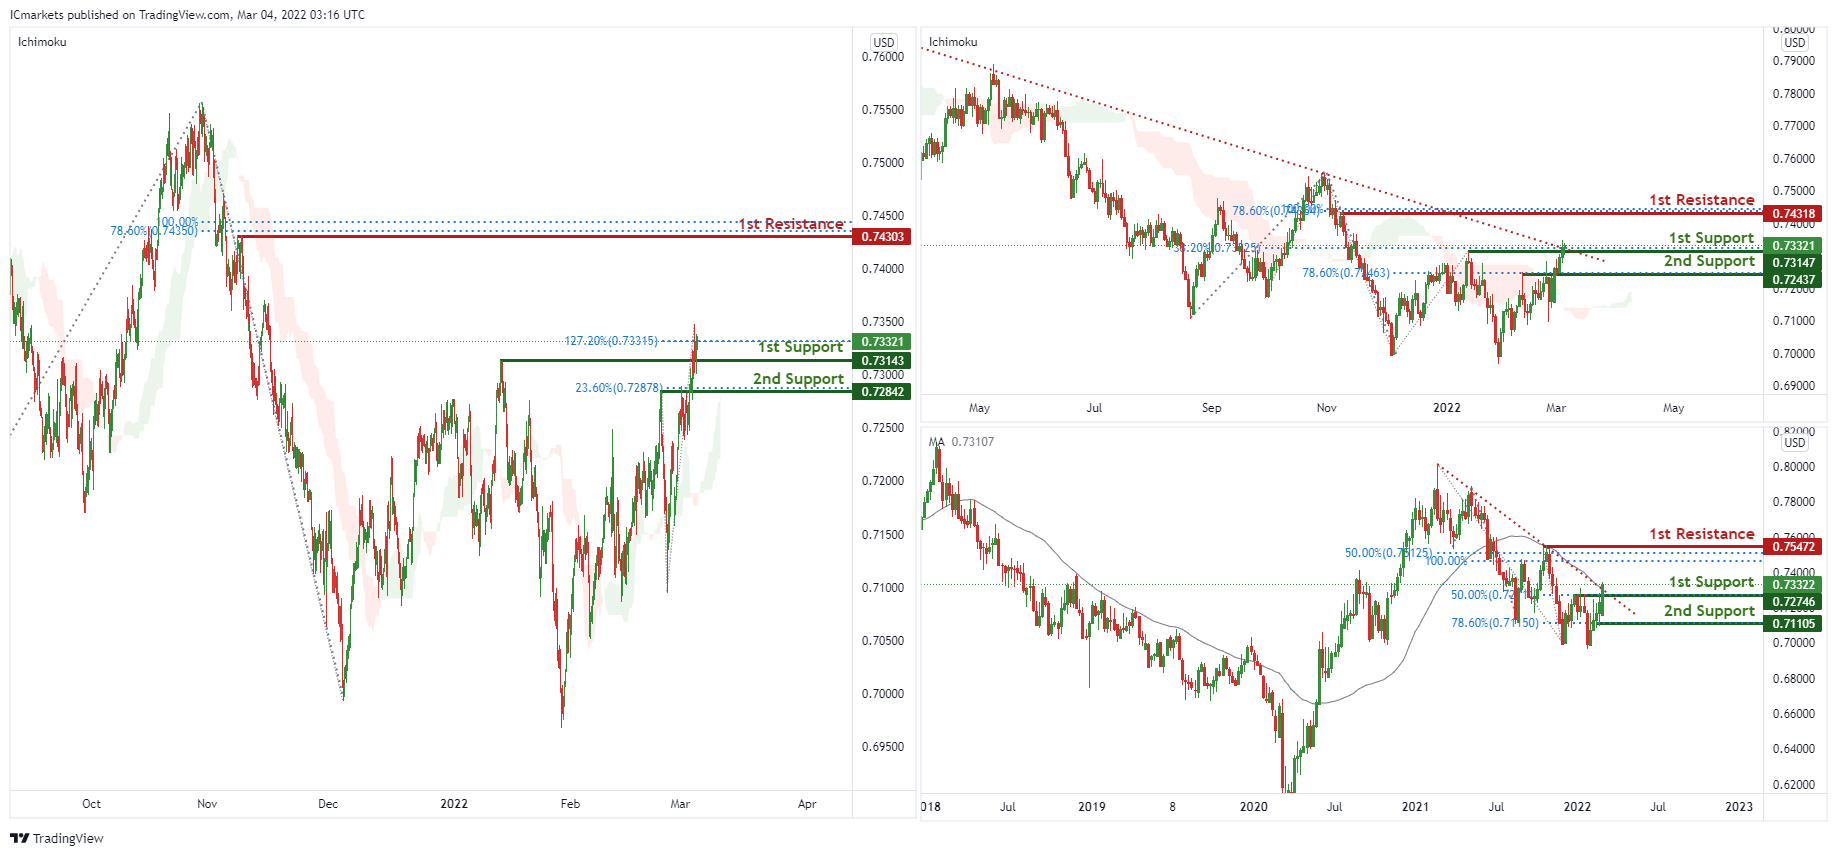
AUD/USD:
On the H4 chart, prices are consolidating in a parallel channel. We see potential for bearish dip from our 1st resistance at 0.73091 in line with 100% Fibonacci retracement and towards our 1st support at 0.73072 which is in line with 23.6% Fibonacci retracement and 38.2% Fibonacci retracement. Alternatively, price can potentially climb higher to the 2nd resistance level at 0.73496 in line with 127.2% Fibonacci projection. Our bearish bias is further supported by bearish divergence spotted on RSI.
On the weekly, prices are on bullish momentum as prices have already broken out of the descending trendline. We see the potential for further bullish continuation from our 1st support at 0.72746 in line with 50% Fibonacci retracement towards our 1st resistance at 0.75472 in line with 50% Fibonacci retracement. Our bullish bias is supported by prices trading above our moving average indicator.
On the daily, prices have broken out of the descending trendline. We see the potential for further bullish continuation from our 1st support at 0.73147 in line with 38.2% Fibonacci retracement towards our 1st resistance at 0.74318 in line with 78.6% Fibonacci retracement and 100% Fibonacci projection. Prices are trading above the Ichimoku cloud indicator which further support our bullish bias. On the H4 timeframe, we see the potential for further bullish momentum from our 1st support at 0.73143 in line with 127.2% Fibonacci extension towards our 1st resistance at 0.74303. which is in line with 78.6% Fibonacci retracement and 100% Fibonacci projection. Our bullish bias is further supported by prices trading above the Ichimoku cloud.
Areas of consideration :
- H4 1st support at 0.73143
- H4 1st resistance at 0.74303
NZD/USD:
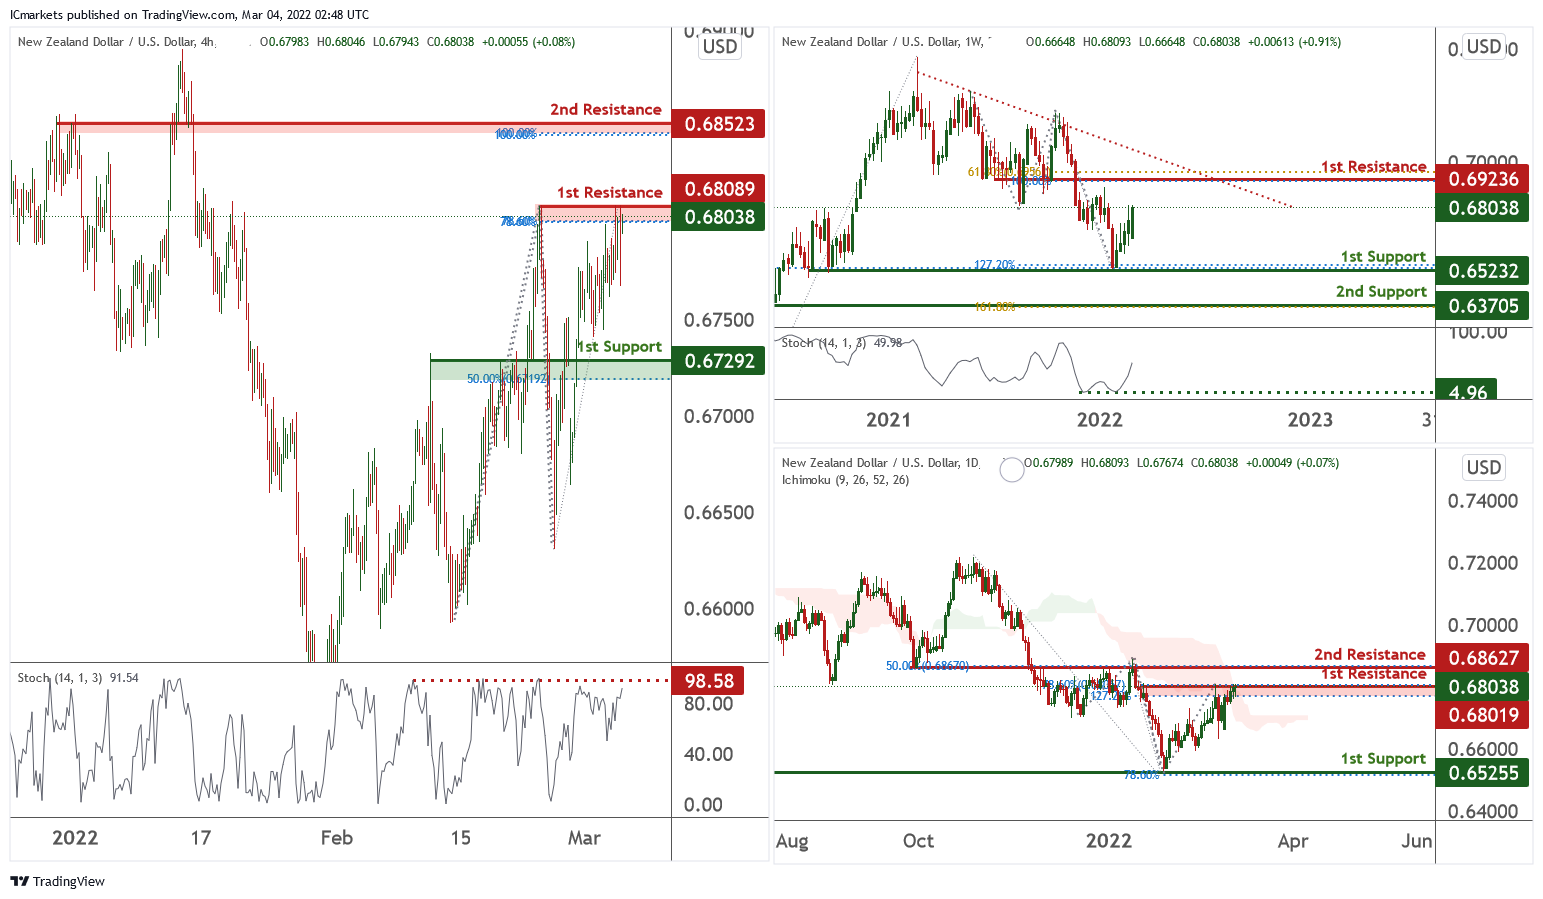
On the weekly time frame price is abiding by a descending trendline and near 1st support level of 0.65232 in line with 50% Fibonacci retracement and 127.2% Fibonacci projection. Price can go to the 1st resistance level of 0.69236 in line with 100% Fibonacci projection and 61.8% Fibonacci retracement. Our bullish bias is supported by stochastic indicator as it is near support level
On the daily chart, price is near 1st resistance level of 0.68019 in line with 78.6% Fibonacci retracement and 127.2% Fibonacci projection. Price can potentially dip to the 1st support level of 0.65255 in line with 78.6% Fibonacci projection. Our bearish bias is supported by the ichimoku cloud indicator as the price is trading below it.
On the H4 chart , price is near 1st resistance level of 0.68089 in line with 78.6% Fibonacci retracement and 78.6% Fibonacci projection. Price can potentially dip to the 1st support level of 0.67292 in line with 50% Fibonacci retracement. Our bearish bias is supported by stochastic as it is at resistance level.
Areas of consideration:
- H4 time frame, 1st resistance at 0.68089
- H4 time frame, 1st support at 0.67292
USD/CAD:
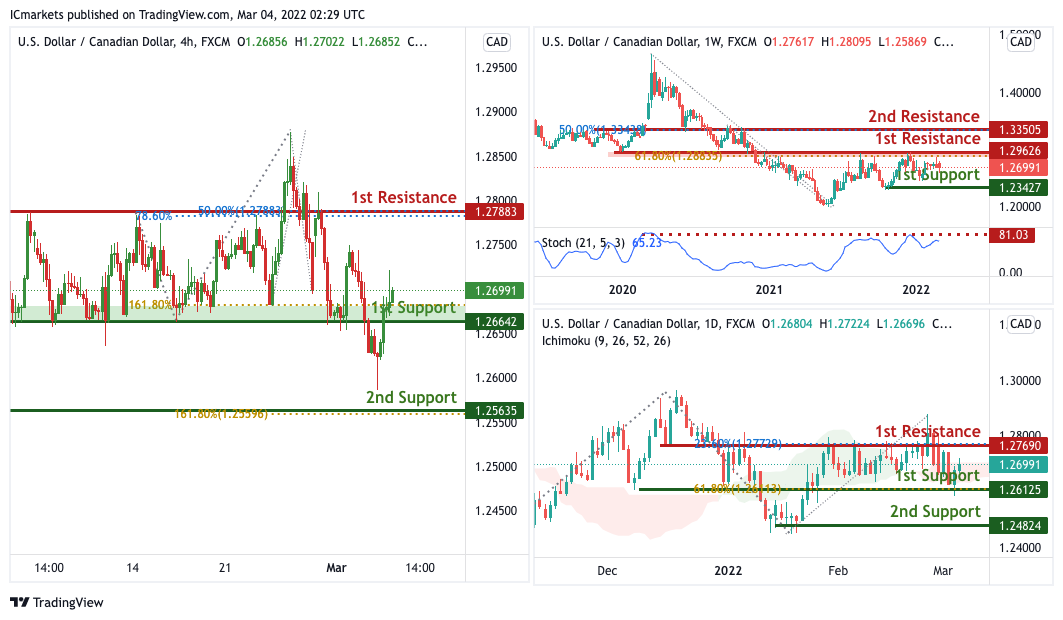
On the Weekly timeframe, We see the possibility of bearish continuation from our 1st resistance at 1.29626 in line with horizontal overlap resistance towards our 1st support at 1.23427 in line with the horizontal swing low support. Alternatively, price may break 1st resistance and head for 2nd resistance at 1.33505 in line with the 50% Fibonacci retracement level. Our bearish bias is further supported by how price is expected to reverse off the stochastics indicator. On the Daily chart, price is near 1st support level of 1.26125 in line with horizontal overlap support and 61.8% Fibonacci retracement. Price can potentially rise to the 1st resistance level of 1.26991 in line with the horizontal overlap resistance. Alternatively, price may break 1st support and head for 2nd support at 1.24824. Our bullsh bias is supported by how price is moving above the ichimoku cloud. On the H4, price is ranging in between our 1st support and 1st resistance. With no clear indication of where price is heading at this current juncture, We have a bias that price will continue to range within our support and resistance of 1.26642 and 1.27883 respectively.
Areas of consideration:
- H4 time frame, 1st support at 1.26642
- H4 time frame, 1st resistance at 1.27883
OIL:
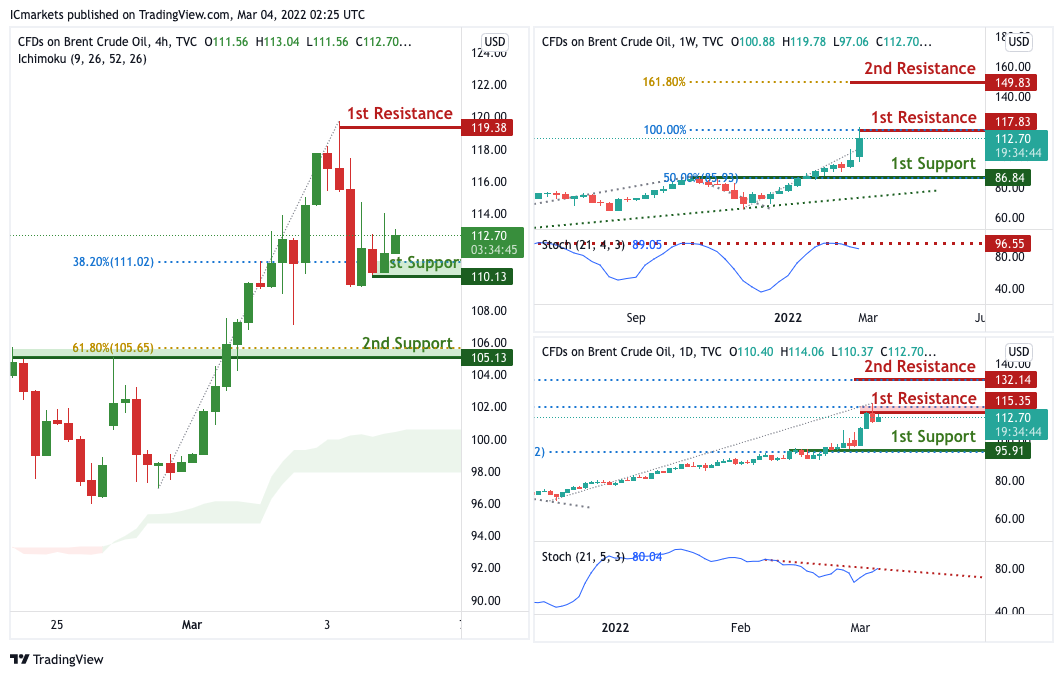
On the Weekly timeframe, We see the possibility of bearish continuation from our 1st resistance at 117.83 in line with horizontal overlap resistance towards our 1st support at 86.84 in line with the horizontal swing low support. Alternatively, price may break 1st resistance and head for 2nd resistance at 149.83 in line with the 161.8% Fibonacci extension level. Our bearish bias is further supported by how price is expected to reverse off the stochastics indicator. On the Daily timeframe, We see the possibility of bearish continuation from our 1st resistance at 115.35 in line with horizontal overlap resistance towards our 1st support at 95.91 in line with the horizontal overlap support. Alternatively, price may break 1st resistance and head for 2nd resistance at 132.14 in line with the 127.2% Fibonacci extension level. Our bearish bias is further supported by how price is expected to reverse off the stochastics indicator. On the H4 timeframe, price is near 1st support level of 110.13 in line with horizontal overlap support and 38.2% Fibonacci retracement. Price can potentially rise to the 1st resistance level of 119.38 in line with the horizontal overlap resistance. Alternatively, price may break 1st support and head for 2nd support at 105.13. Our bullsh bias is supported by how price is moving above the ichimoku cloud.
Areas of consideration:
- H4 time frame, 1st resistance of 113.91
- H4 time frame, 1st support of 106.99
Dow Jones Industrial Average:
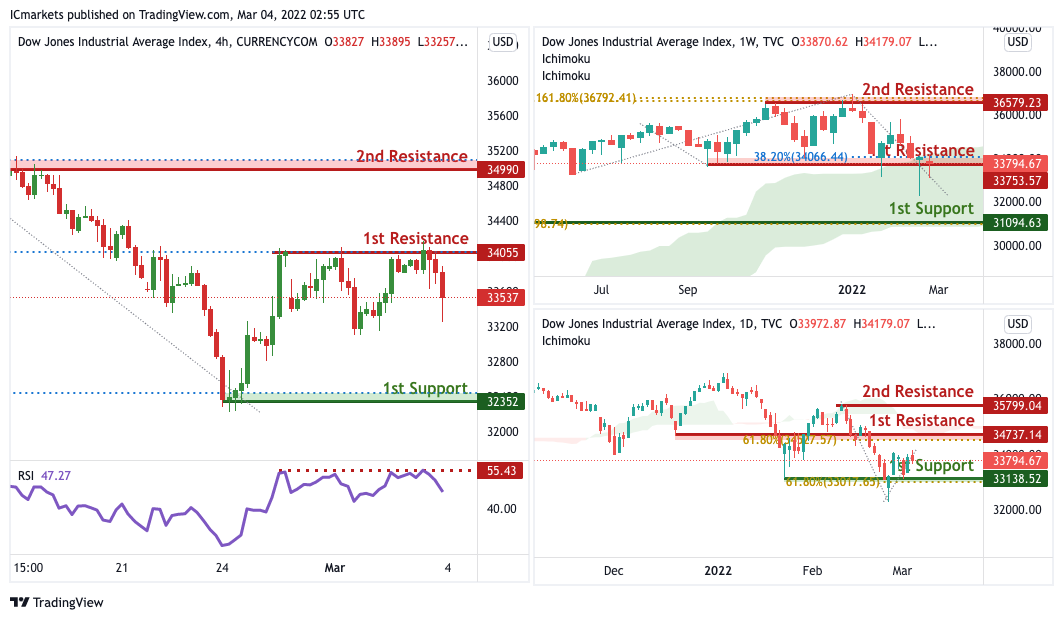
On the Weekly timeframe, We see the possibility of bearish continuation from our 1st resistance at 33753 in line with horizontal overlap resistance towards our 1st support at 31094 in line with the horizontal swing low support. Alternatively, price may break 1st resistance and head for 2nd resistance at 36479 in line with the 161.8% Fibonacci extension level. Our bearish bias is further supported by how price is moving below the ichimoku cloud indicator. On the Daily timeframe, We see the possibility of bearish continuation from our 1st resistance at 34737 in line with horizontal overlap resistance towards our 1st support at 33138 in line with the horizontal swing low support. Alternatively, price may break 1st resistance and head for 2nd resistance at 35800 in line with the horizontal swing high resistance. Our bearish bias is further supported by how price is moving below the ichimoku cloud indicator. On the H4 timeframe, We see the possibility of bearish continuation from our 1st resistance at 34055 in line with horizontal overlap resistance towards our 1st support at 32352 in line with the horizontal swing low support. Alternatively, price may break 1st resistance and head for 2nd resistance at 34990 in line with the 78.6% Fibonacci retracement level. Our bearish bias is further supported by how price is expected to reverse off the RSI indicator.
Areas of consideration :
- H4 1st support at 32352
- H4 1st resistance at 34055
Australia retail sales rose 1.8% mom in Jan
Australia retail sales rose 1.8% mom to AUD 32.49B in January. Comparing to the same month a year ago, sales rose 6.4% yoy.
"The emergence of the Omicron variant and rising COVID-19 case numbers, combined with an absence of mandated lockdowns has resulted in a range of different consumer behaviours. We have seen the type of spending previously associated with lockdowns occurring simultaneously with those associated with the easing of lockdown conditions," Director of Quarterly Economy Wide Statistics, Ben James said.
"This had led to variations across the industries with Food retailing recording a rise in sales consistent with previous COVID-19 outbreaks as consumers exercise caution amidst surging case numbers. However, the absence of lockdowns meant that other discretionary industries which would usually see a fall during the pandemic have recorded mixed results."
New Zealand ANZ consumer confidence dropped to record low
New Zealand ANZ-Roy Morgan consumer confidence dropped -16 pts to 81.7 in February, hitting a record low since data began in 2004. Inflation expectations were little changed at 5.6% while house price inflation expectations eased from 5.3% to 4.8%.
ANZ said: "This month's data looks grim, but there are undoubtedly some temporary impacts in there. Time will tell what the other side looks like, but we do know that Omicron is fast and furious, and will blow through relatively quickly.
Fed Williams: Higher oil prices not a stagflation issue
New York Fed President John Williams said the higher oil prices stemming from Russia invasion of Ukraine may act like a "tax" on American consumers. But, "the economy is coming into this with a lot of forward momentum. It's definitely not a stagflation issue."
Williams expect inflation to come down later this year but stays "well above" 2% target. He emphasized Fed has the "ability to adjust interest rates higher if inflation ends up being much more persistent or staying much higher than we expect or want".
BoC Macklem not fulling out a 50bps hike if needed
BoC Governor Tiff Macklem said in a speech yesterday, "tighter monetary policy is necessary to lower the parts of inflation that are driven by domestic demand. And that is critical to bringing price increases back in line with our 2% inflation target."
BoC will also be considering when to move to quantitative tightening, or QT. "The timing and pace of further increases in the policy rate, and the start of QT, will be guided by the Bank's ongoing assessment of the economy and its commitment to achieving the 2% inflation target," he added.
In the Q&A session, Macklem said, there is certainly considerable space to raise interest rates over the course of the year". "If we have to move more quickly, we are prepared to do that," he added. "I am not going to rule out a 50-basis-point move in the future."