Sample Category Title
USDCAD Stuck in 3-Week Range as Trend Vanishes
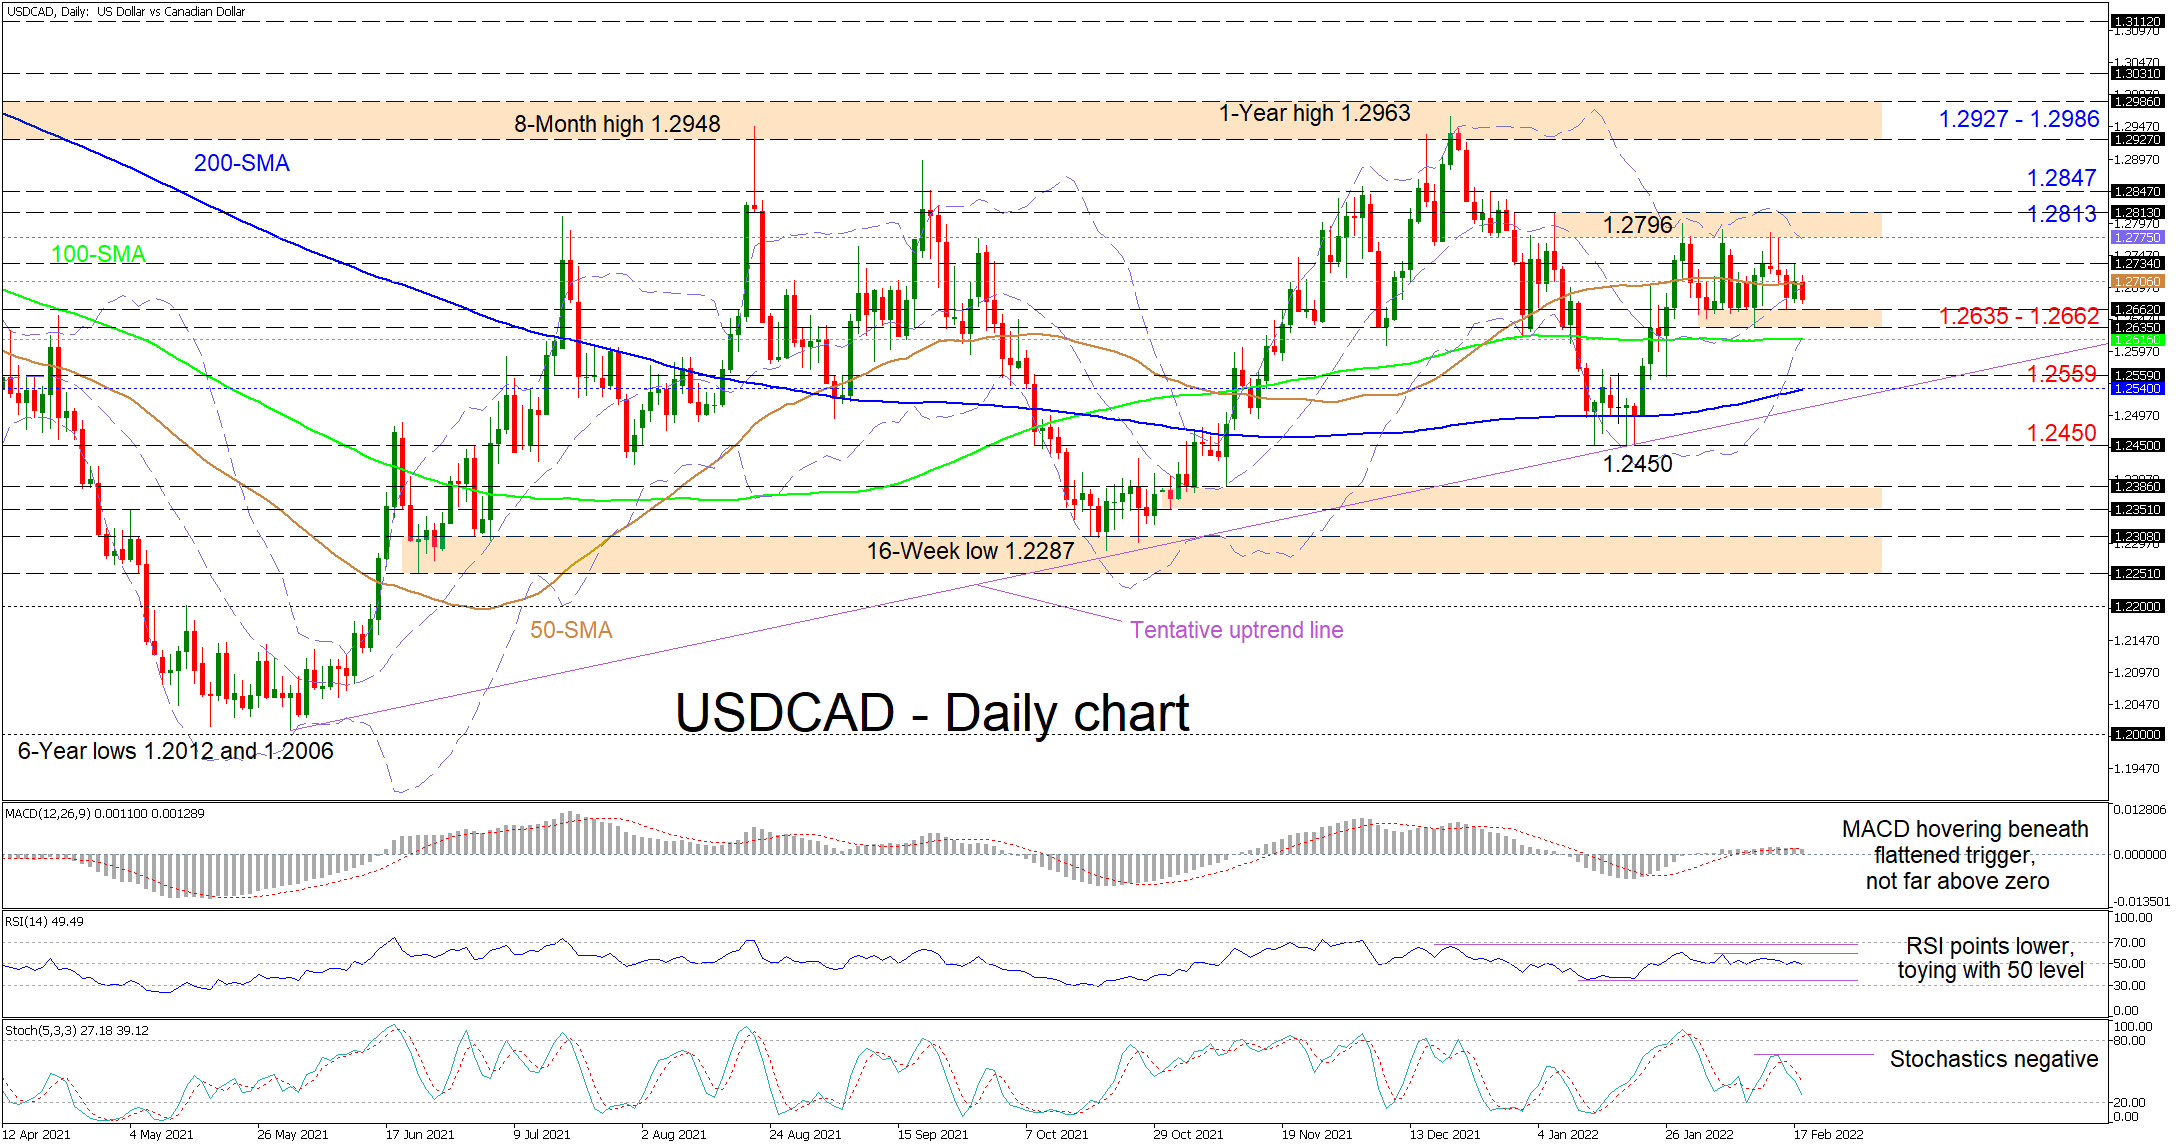
USDCAD is trading just beneath the horizontal 50-day simple moving average (SMA) around 1.2706 as a three-week consolidation period seems to have the pair chained between the 1.2635 and 1.2796 boundaries. The overall neutral trajectories of the SMAs suggest that the price trend has dissolved, hinting that the pair may continue to drift for a while longer.
The short-term oscillators are conveying conflicting messages in directional momentum. The MACD, slightly north of the zero threshold, is trailing marginally underneath its firming red signal line, while the RSI is flirting with the 50 level. That said, the negatively charged stochastic oscillator is promoting additional negative price moves on the lower side of the range.
In the negative scenario, preliminary downside constraints could occur at the 1.2635-1.2662 nearby base. If this floor of the sideways pattern gives way, prompt tough support may then come from the converged lower Bollinger band and 100-day SMA at 1.2616, before sellers target the region between the 1.2559 trough and the 200-day SMA at 1.2540. A further break of this key support band, which is overlapped by the tentative uptrend line pulled from the 6-year low of 1.2006, could be a tough blow towards the more than six-month gradual climb in the pair. Yet, the bears would need to slide beneath the January 19 trough of 1.2450 to spark worries about growing negative tendencies in the pair.
On the other hand, if buyers re-emerge and overstep the mid-Bollinger band at 1.2706 - coupled with the flattening 50-day SMA - the yesterday’s high of 1.2734 could delay the test of the 1.2775-1.2796 ceiling of the range. That said, to strengthen upside momentum, the bulls would need to surpass this resistance section, which extends slightly higher up until the January 6 high of 1.2813. From here, overstepping the neighbouring 1.2847 barrier too could then propel the price higher towards the 1.2927-1.2986 resistance barricade, which has capped advances in the broader picture since early November 2020.
Summarizing, USDCAD is exhibiting a neutral-to-bullish tone above the 1.2635-1.2662 base, the longer-term 100- and 200-day SMAs, and the ascending trend line. That said, a break either below 1.2635-1.2662 or above 1.2813 could reveal the next clear price direction.
Strong UK Retail Sales Pave the Way up for Pound
UK retail sales added 1.9% in January, following a dip of 4.0% a month earlier. By the same month a year earlier, the increase was 9.1%, as January 2021 saw a sharp tightening of the lockdown and the vaccination campaign had only just started.
The data came out slightly better than expected, supporting purchases of British currency against the dollar, but remains very volatile due to restrictions in previous months. Sales generally remained above multi-year trend levels, which is a good signal of the economy’s health.
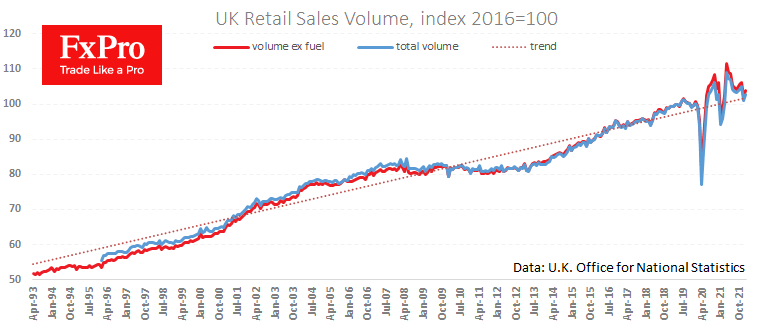
After the financial crisis from 2009 to 2016, there was a long period when sales were below the long-term trend line and were one of the obstacles why the Bank of England could not go ahead with a rate hike.
These days, the need to suppress inflation is combined with the ability to do so thanks to strong consumer demand and the labour market.
Sales were also boosted by pent-up demand for services and goods that were in restricted supply during the pandemic. This process may gain momentum in the coming months, painting a more colourful picture of consumer activity, but could lead to disappointment in the second half of the year.
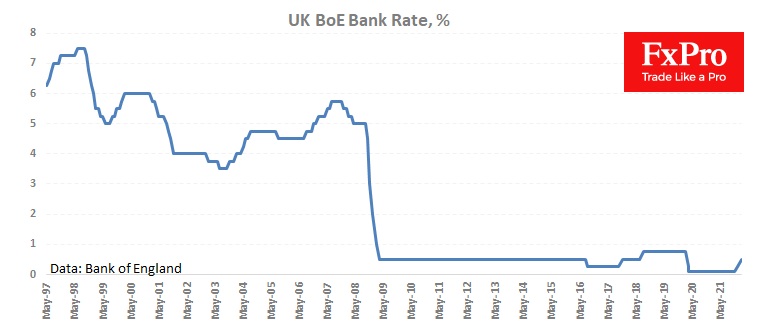
The Bank of England should keep a close eye on the coming economic releases to avoid repeating the mistakes of the ECB, which rushed through a rate hike in May 2009, undermining the economic recovery.
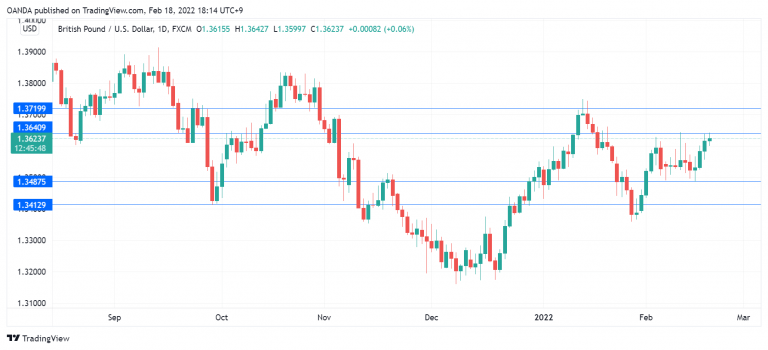
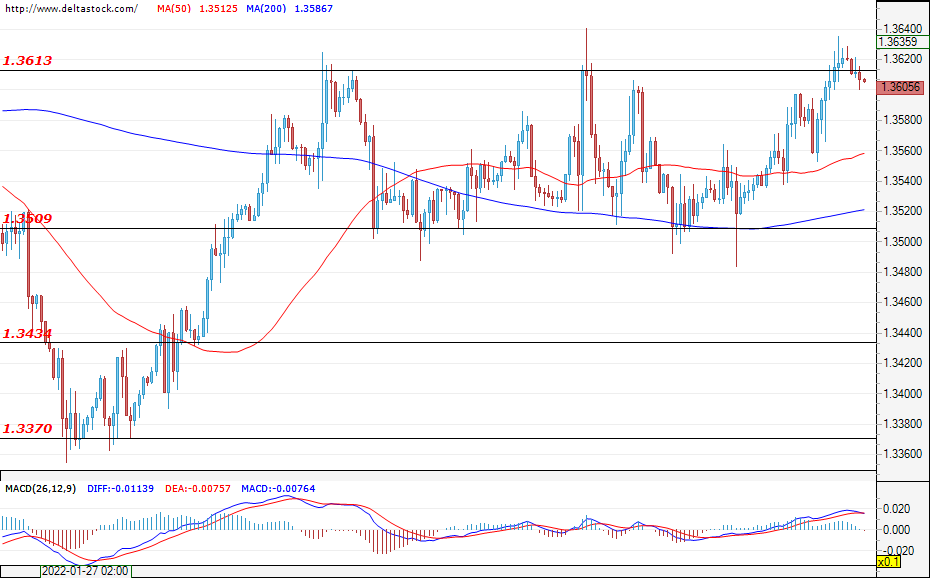
On Friday morning, the British pound is testing the highs of February, rising to 1.3630. A rise to 1.3680 may be a development in the current momentum. However, a jump even higher would reflect a break of the downtrend since last June, anchoring GBPUSD above the 200-day average and setting the pair up to test previous highs.
Pound Steady as Retail Sales Rebound
UK retail sales bounce back
UK retail sales rebounded in January, with a gain Uof 1.9% m/m, its highest monthly gain since April 2021. The increase followed a decline of 4.0% in December and beat the consensus of 1.0%. The Omicron variant of corona continues to have a significant impact on consumer spending. The December drop was a result of consumers doing their Christmas shopping in October and November, while the January rise reflected the easing of health restrictions. With Covid regulations set to expire due to falling infection rates, we should see consumer spending continue to accelerate.
The Bank of England remains under strong pressure to raise rates at its meeting in March. The markets have priced in a quarter-point hike in March at 100%, and the BoE will likely follow up with more hikes until inflation, which is at a 30-year high, is brought down. We can expect the BoE to deliver a more gradual pace of rate hikes than what has been priced by the markets.
The Russia/Ukraine border remains extremely tense, although a feared invasion on Wednesday did not materialize. Tensions heightened on Thursday after a skirmish in a border region which the West feared was a pretext for a full-scale invasion. This sent the financial markets tumbling as risk sentiment dissipated. The US has disputed Russia’s claim that it has reduced its forces on the border and says an invasion could occur at any time. Still, there is a ray of light for a diplomatic solution, as the US and Russian foreign ministers will meet next week, so an invasion appears to be on ice, at least for now. It’s a safe bet that market direction next week will be largely set by developments in the Ukraine crisis and market participants should be prepared for volatility.
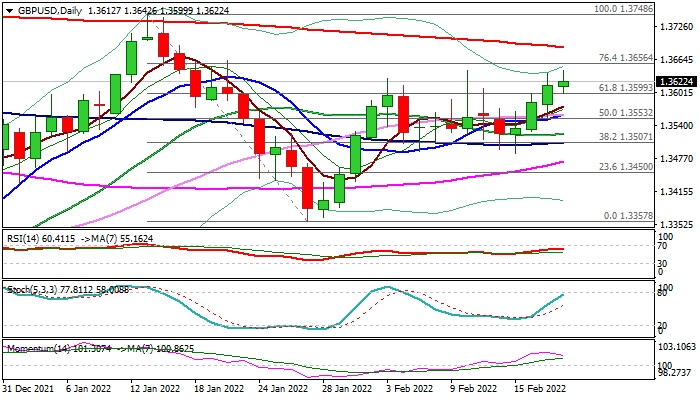
GBP/USD Outlook: Cable Establishes Above 1.36 Pivot, Additionally Supported by Upbeat UK Retail Sales
Cable maintains firm tone and stays above broken 1.3600 barrier in early Friday, extending advance into fourth straight day and on track for the third consecutive bullish weekly close.
Pound remains underpinned by expectations of BoE rate hike, while better than expected UK retail sales data showed strong recovery from the knock of latest wave of Omicron variant in December, when many shops were closed and provided fresh boost to sterling.
Thursday’s eventual close above pivotal 1.3600 resistance (Fibo 61.8% of 1.3748/1.3357 descend, where rallies were repeatedly capped in past one month) generated strong bullish signal which will be confirmed on a weekly close above this level.
Technical studies on daily chart remain in full bullish setup and support the action, however, fading bullish momentum and north-heading stochastic approaching the border of overbought zone, warn that bulls may pause for consolidation before resuming.
Broken 1.3600 level reverted to solid support, with extended dips to find ground above daily Tenkan-sen (1.3565) and keep bulls in play.
Res: 1.3656; 1.3687; 1.3700; 1.3748.
Sup: 1.3600; 1.3565; 1.3524; 1.3507.
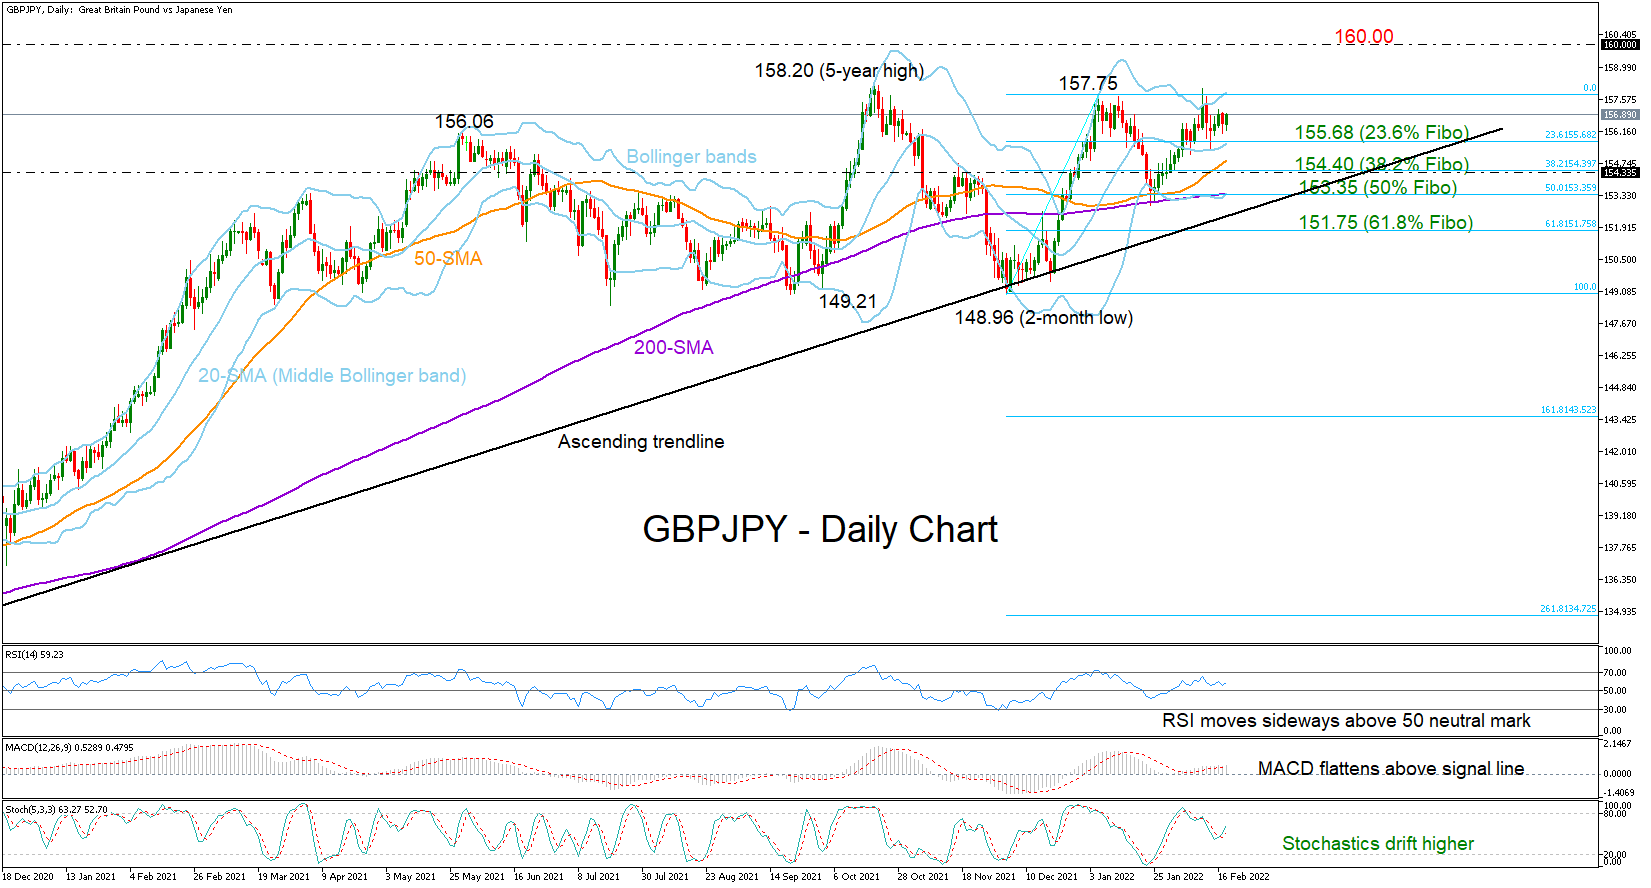
GBPJPY Could Still Reap Benefits Despite Sideways Move
GBPJPY has been quite neutral this week, tiptoeing sideways, below the 157 level, but the market action continues to take place above the 20-day simple moving average (SMA) and the upper bullish Bollinger area, suggesting buyers are still eager to move.
Although lacking direction, the RSI is fluctuating above its 50 neutral mark and the MACD is flattening above its red signal line, while the green %K Stochastic line has drifted back above the red %D line, all keeping the bias tilted to the upside.
A decisive close above the 157.75 – 158.20 ceiling is now required to attract new buyers into the market, and hence clear the way towards the 160 psychological level. Running higher, the price could hit a wall around the early 2016 limitations at 163.85.If that proves an easy obstacle, the ascent could stretch towards the next resistance of 166.00.
On the downside, a step below the nearby support of 155.68, which coincides with the 23.6% Fibonacci retracement of the 148.96 – 157.75 upleg, could send the price towards the 38.2% Fibonacci of 154.40 unless the 50-day SMA rejects the bears beforehand. Should downside pressures intensify, the 200-day SMA and the 50% Fibonacci of 153.35 may attempt to catch the fall ahead of the crucial ascending trendine drawn from the 2020 lows, currently sitting at 152.40. Otherwise, the spotlight will turn to the 61.8% Fibonacci of 151.74, where any violation may navigate the pair straight to the 148.96 low.
In brief, GBPJPY has the potential to revive its bullish momentum after a period of consolidation, though only a sustainable extension above the 157.75 – 158.20 boundary could add fresh bullish fuel to the market.
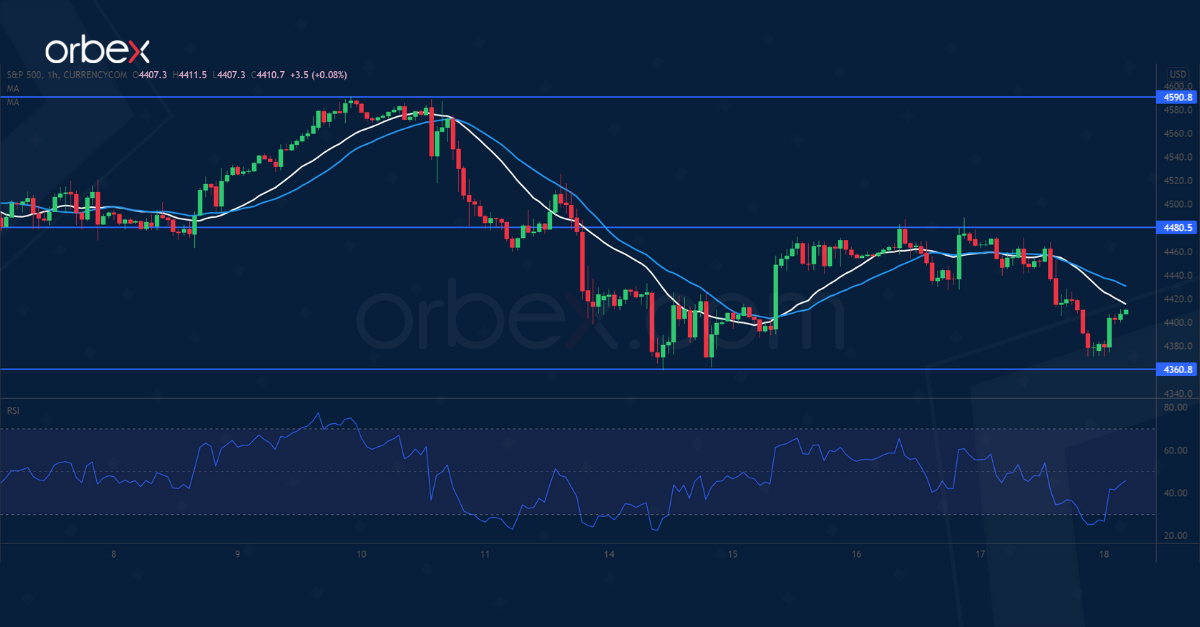
SPX 500 Consolidates
The S&P 500 struggles as the Russia-Ukraine crisis persists. The previous rebound has met stiff selling pressure over the 30-day moving average (4590).
A pullback has sent the RSI into the oversold territory, triggering some buyers’ interest in racking up the bargain. The rebound is still valid as long as the index stays above the critical area of 4280.
A break above 4480 may extend gains to the double top at 4590 which is an important resistance. 4360 is the immediate support if the sideways action lingers.
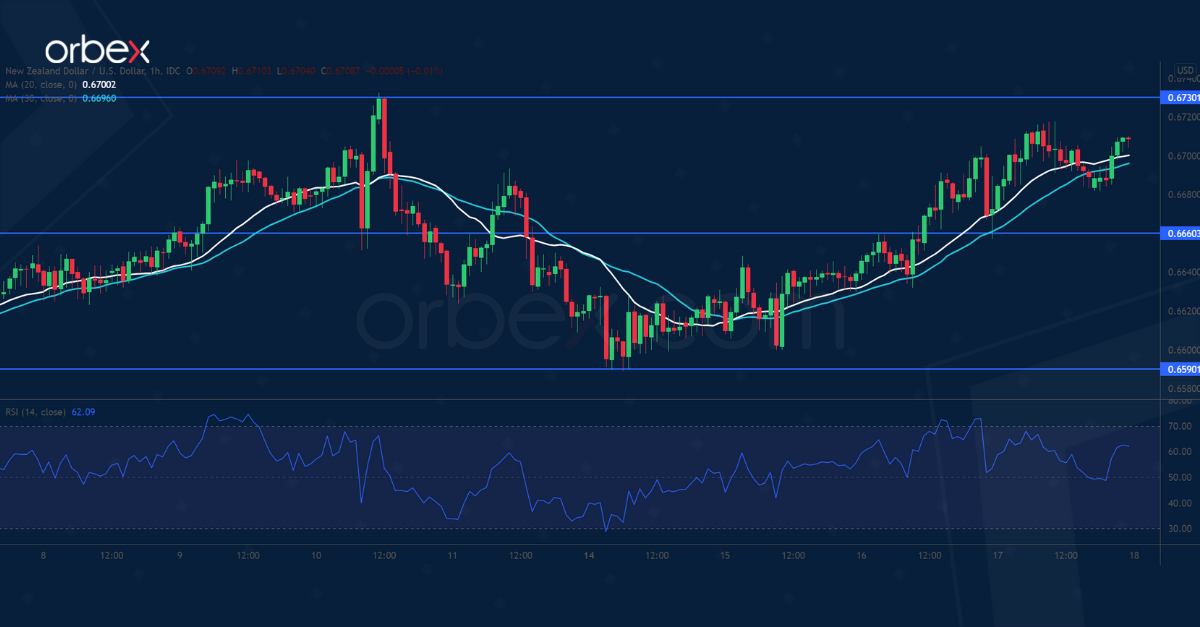
NZD/USD Tests Resistance
The New Zealand dollar climbed higher as the RBNZ can lift its cash rates next week.
Price action came under pressure on the 30-day moving average (0.6730). However, strong support at 0.6590 builds a case for a potential reversal.
A break above 0.6690 is an encouraging sign leaving 0.6730 as the last obstacle before a bullish extension. A broader rally would bring the kiwi back to January’s high at 0.6890.
In the meantime, an overbought RSI caused a brief pullback towards 0.6660.
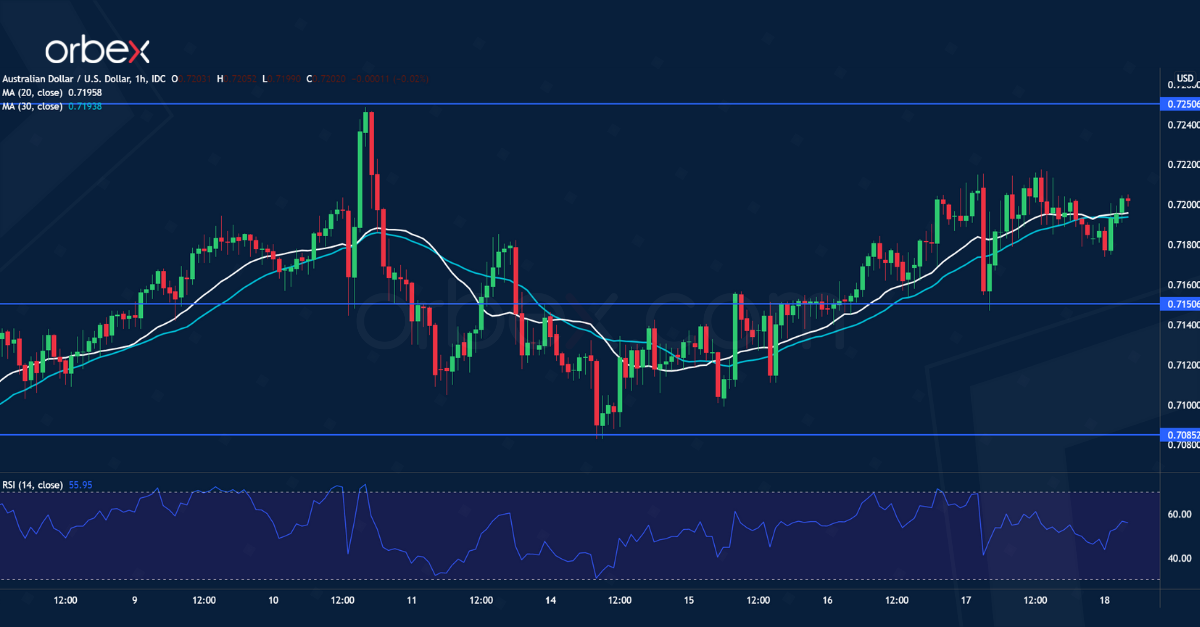
AUD/USD Attempts to Break Out
The Australian dollar finds support from a low jobless rate in January.
The pair has previously hit resistance in the supply zone around 0.7250. This is a daily resistance from the sell-off in late January. Then a recovery above 0.7180 suggests solid buying pressure before a bearish mood could take hold again.
A break above the key hurdle could initiate a bullish reversal above this year’s peak (0.7310). Otherwise, a prolonged consolidation may test the demand area between 0.7100 and 0.7150.
Daily Technical Analysis
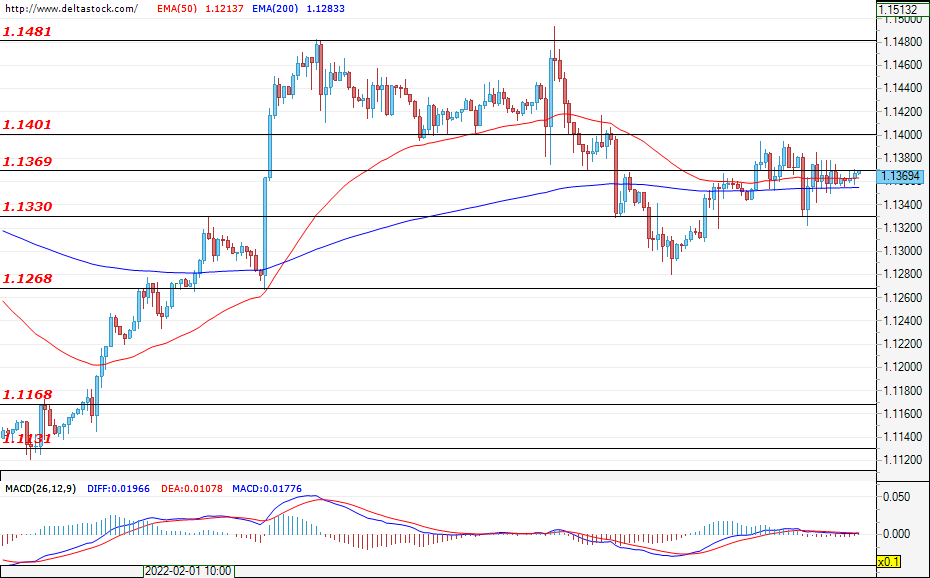
EUR/USD
During yesterday's trading session, the currency pair consolidated just below the resistance zone at 1.1370, and at the time of writing, it is headed towards a test of this resistance. A confirmed breach of 1.1370 would encourage the bulls to re-test the psychological level of 1.1400. In case the bears return to the market, then we could witness a test of the first support levels, found respectively at 1.1330 and at 1.1268. During today's trading session, the most important economic news that would be of interest to the market participants will be the U.S. existing home sales data (15:00 GMT).
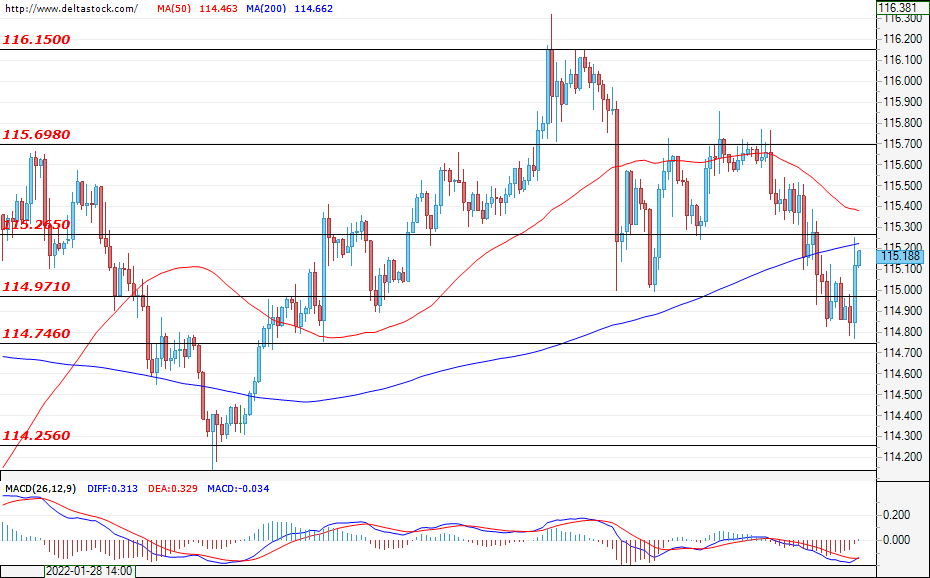
USD/JPY
During the second half of yesterday's trading session, the Ninja violated the support level of 114.75, but in the early hours of today, the dollar managed to partially regain its losses against the yen. At the time of writing, the pair is headed towards a test of the resistance at 115.26. In case the USD/JPY manages to breach this resistance, then it would re-enter the range of 115.26 – 115.70, in which it had been trading until yesterday. In the negative direction, the first support lies at 114.97.
GBP/USD
During the second half of yesterday's trading session, the Ninja violated the support level of 114.75, but in the early hours of today, the dollar managed to partially regain its losses against the yen. At the time of writing, the pair is headed towards a test of the resistance at 115.26. In case the USD/JPY manages to breach this resistance, then it would re-enter the range of 115.26 – 115.70, in which it had been trading until yesterday. In the negative direction, the first support lies at 114.97.
EUGERMANY40
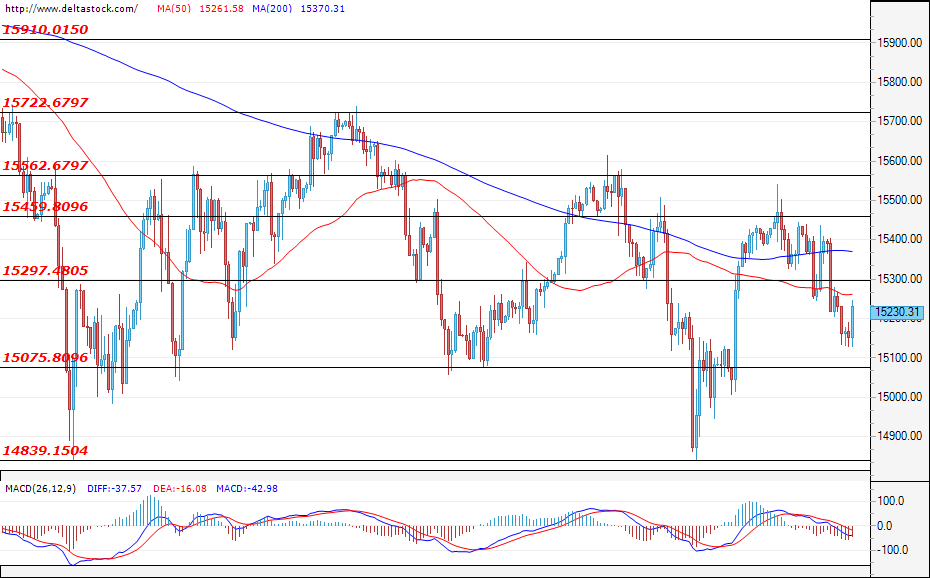
The German index plunged yesterday, but the sell-off was limited slightly above the support at 15075. In the early hours of today, the index gradually recovered its losses and, at the time of writing, is headed towards a test of the resistance level of 15300. The forecast is for the index to breach 15300 and re-test the next resistance of 15460. The uneasy situation in Ukraine continues to weigh on the market, and sharp moves in either direction can be expected today.
US30
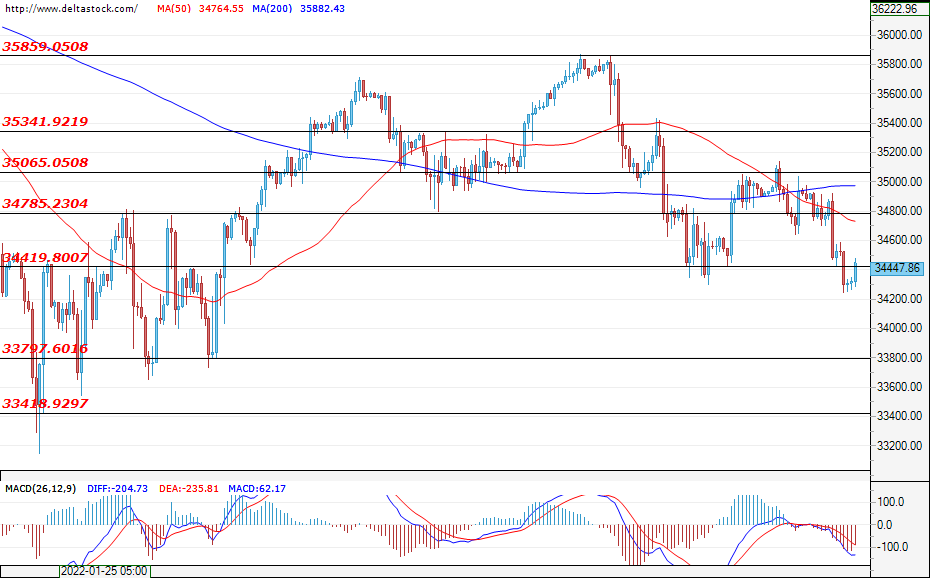
In the early hours of today's trading session, the U.S. blue-chip index breached the resistance level of 34420 and the forecast is for the index to rise and test the resistance levels of 34785 and 35065. In the negative direction, the mentioned level of 34420 is now acting as support for the index. During today's trading session, the most important economic news that would be of interest to the market participants will be the U.S. existing home sales data (15:00 GMT).
Gold and US Equities Diverge as Global Risks Rise
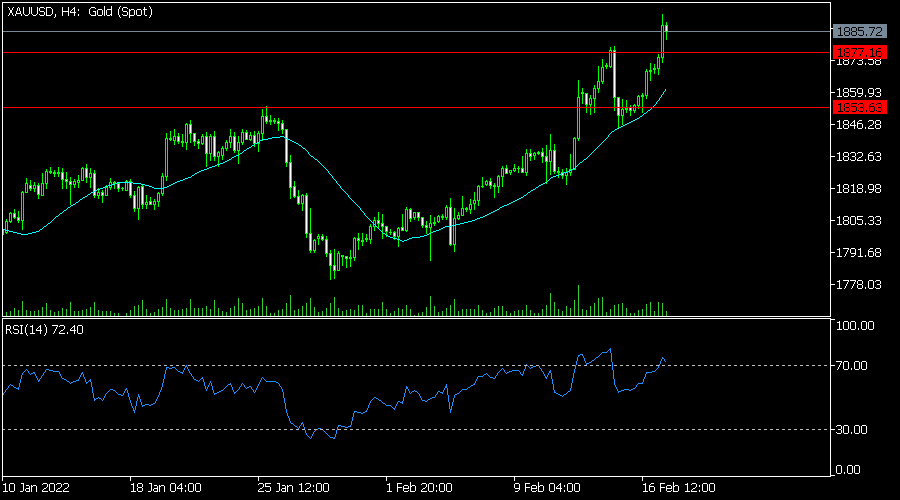
American stocks declined sharply after Joe Biden delivered a major warning about the crisis in Ukraine. In a press conference, he warned that Russia was on the brink of attacking Ukraine. He claims Russia is engaged in a false flag operation as an excuse to go in. The statement came as the two countries blamed each other for clashes that started on Thursday. The Dow Jones and Nasdaq 100 declined sharply while gold and the US dollar rose.
The US dollar rose after a slew of mixed economic data from the US. on Thursday, data by the Bureau of Labor Statistics (BLS) showed that the number of initial jobless claims rose to 248k last week. They have risen in the past few weeks. Further data showed that housing starts declined from 1.7 million to 1.63 million in January/ Building permits, which is important data, also declined from 1.61 million to1.63 million. These numbers came a few hours after the Fed published hawkish FOMC minutes.
The economic calendar will have some important economic data today. In the morning session, the UK will publish the latest retail sales data. Analysts expect the data to show that sales held steady in January, with the headline figure rising by 8.7%. Core sales are expected to have risen by 7.9% in January. Sweden will publish the latest inflation data while the Fed will publish its monetary policy report. Canada will also deliver its retail sales data.
XAUUSD
The XAUUSD pair jumped sharply as investors rushed to safe assets. It rose to a high of 1895, which is significantly higher than this month's low of 1,820. It moved above the 25 and 50-day moving averages while oscillators like the Relative Strength Index and MACD also kept rising. Therefore, the pair will likely continue rising as the crisis escalates.
EURUSD
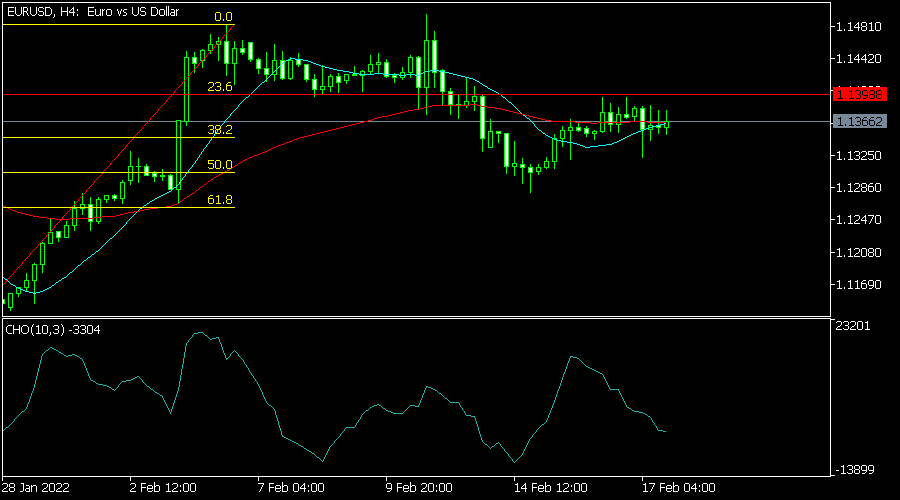
The EURUSD pair moved sideways in the overnight session after mixed economic data from the United States. It is trading at 1.1367, where it has been in the past few days. On the four-hour chart, the pair is trading at the same level as the 25-day and 50-day moving averages. It is also trading between the 38.2% and 23.6% retracement levels. Therefore, the pair will likely remain in this range today.
USDCAD
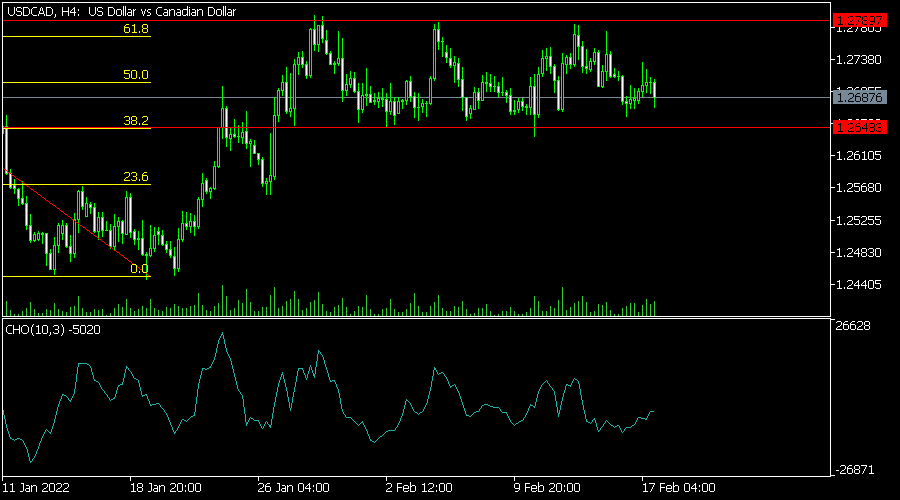
The USDCAD was in a tight range ahead of the upcoming Canada retail sales numbers. The pair is trading at 1.2692, which is between the support and resistance levels shown in red. It is also slightly below the 50% Fibonacci retracement level. The Chaikin oscillator has pointed upwards. Therefore, the pair will likely remain in this range later today.