Sample Category Title
Higher Yields Start to Bite but Stocks Fight Back, Dollar Edges Up
- Bond yields climb to fresh highs as inflation and tighter policy fears grip markets
- Equities nevertheless perk up globally but Wall Street on shaky ground
- Dollar regains front foot, oil prices pressured by optimism around US-Iran talks
Sentiment improves despite surging yields
Long-term borrowing costs continued to head north on Tuesday, rising in just about every territory on growing expectations that no country will be spared from the greatest inflation shock the world has faced in decades. As central banks abandon the transitory inflation narrative one by one, markets are grappling with the prospect of an end to the era of easy money and the steepest hike in interest rates since before the financial crisis.
Although the inflation story has been running for some time now, what’s rattled the markets this time is the relentless rally in government bond yields since the start of the year. In the US, the benchmark 10-year Treasury yield briefly spiked to 1.96% earlier today and it’s only a matter of time before it hits 2.0% - a level that is seen as a key test for Wall Street bulls.
In Europe, the German 10-year bund yield has reached 0.25%, while Italian yields are flirting with the danger zone as their spread with German bunds is widening again. Australian and New Zealand yields just shot up to around two-year highs and Japan’s 10-year yield is approaching the Bank of Japan’s upper 0.25% threshold of its yield curve target.
Nevertheless, although there’s plenty of jitters to go around, there’s no big panic just yet among investors. With consumption holding up for now, wages on the rise, corporate earnings still healthy and economically punitive Covid restrictions being lifted in most places, it might be too soon for the doom and gloom to set in as the major central banks start raising interest rates.
Equities stay upbeat for now
Stocks in Europe got off to a solid start on Tuesday, extending their gains into a second day, led by London’s FTSE 100, which hit its highest since January 2020. Strong earnings and higher commodity prices are lifting stocks in Europe and Asia.
Even China’s CSI 300 managed to sharply pare its losses, having earlier dipped on news that Washington has added 33 new Chinese entities to its “unverified” list that require tighter export controls for US firms wishing to trade with those companies.
However, the mood on Wall Street remained muted and tech stocks came under pressure again. The latest jump in yields has really started to cap gains while exacerbating any selloff, particularly in the tech sector. But there were a few bright spots on Monday such as airlines and financials, and the Dow Jones bucked the negative trend of the S&P 500 and Nasdaq to finish the session flat.
US futures were higher today but lacked clear direction, something which is likely to only come from Thursday’s latest consumer price index.
Dollar recovers some positive traction, euro slips
Meanwhile, the US dollar was advancing on Tuesday, helped by higher Treasury yields and a pullback in the euro and yen. The dollar index was last up about 0.25%.
Having only just reclaimed the $1.14 handle, the euro is struggling to hold on to it as ECB President Christine Lagarde tried to play down the prospect of aggressive monetary tightening. Speaking in the European Parliament on Monday, Lagarde said it’s likely “current price pressures will subside before becoming entrenched".
Oil takes a hit from progress in Iran nuclear talks
In commodities, oil prices slid for a second day, with WTI futures dropping below $90 a barrel during European trading. Brent crude was down too, plunging about 2%.
Whilst there’s no immediate danger to oil’s bullish structure, the unexpected developments in the Iran nuclear saga have taken markets a bit by surprise. The US has restored a sanctions waiver to Iran that would permit cooperation with other countries on civilian nuclear projects following indirect talks between the two sides. Direct talks will resume today, and further progress could prove to be an even more notable drag on the commodity.
Gold prices were down too, though only marginally, as the increased diplomatic effort in recent days to de-escalate tensions on the Ukrainian border has brought geopolitical risks back to the fore, making some investors nervous, boosting the yellow metal’s safe haven appeal.
Euro Dips to 1.14, Lagarde Shifts Gears
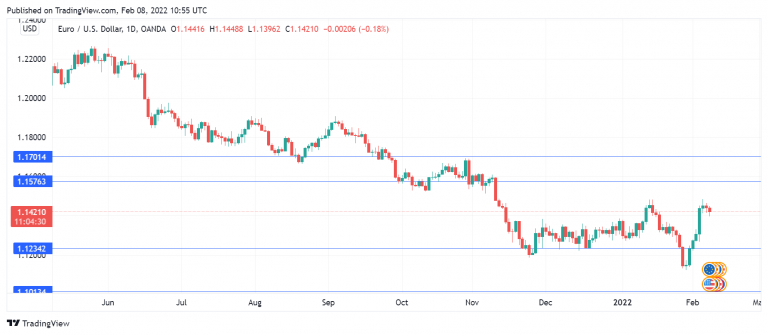
The euro is slightly lower on Tuesday, after little movement on Monday. In the European session, EUR/USD is trading at 1.1409, down 0.28% on the day. It’s a light day on the economic calendar, with no tier-1 releases out of the US or the eurozone.
ECB President Christine Lagarde sounded dovish when she testified before a EU parliamentary hearing on Monday. This was in contrast to her remarks after last week’s ECB meeting which sent the euro soaring. Was this a case of damage control, or is the dovish Lagarde back in the saddle? Lagarde told lawmakers that inflation is expected to ease lower and stabilize around 2%, which is the bank’s target. She acknowledged that inflation risks were tilted to the upside, but clearly she hasn’t abandoned the view that high inflation is transitory.
Lagarde reiterated that a rate hike would only come after QE had ended, and her message was that there is no need for any substantial tightening, since inflation will fall. The markets don’t appear to be buying it, as investors have priced in about 50 basis points of rate hikes in 2022.
Another Lagarde sceptic is Klaas Knot, governor of the Dutch central bank and member of the ECB governing council. Knot has stated publicly that inflation will hover at 4 per cent for most of this year, and has urged the ECB to quickly wrap up QE and raise rates in the fourth quarter. On Monday, the Societe Generale bank stated in a note today that it expected the ECB to wrap up QE in mid-year and projected a rate hike in the second half.
With eurozone CPI hitting 5.1% in January, Lagarde will come under increasing fire to accelerate QE if inflation does not show signs of easing in the coming months.
- 1.1437, a monthly resistance line, is under pressure. Above, there is resistance at 1.1577
- There is support at 1.1233 and 1.1014
EURGBP Bears Take the Upper Hand Again
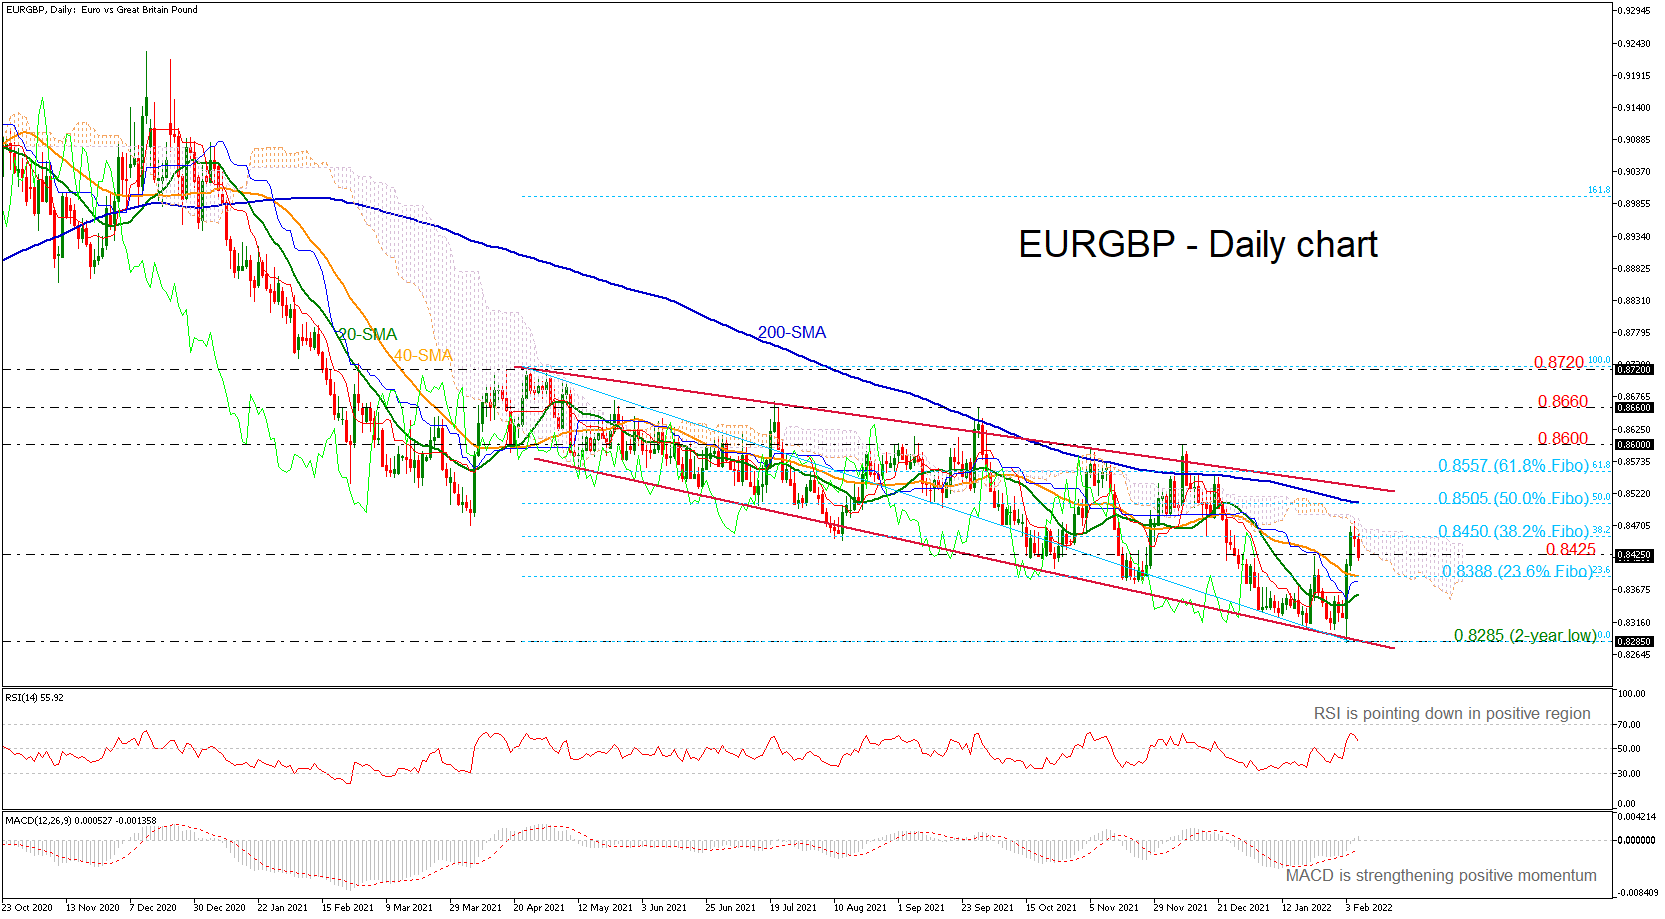
EURGBP opened the week on a negative note, keeping its footing around the Ichimoku cloud and the 0.8400 handle. Trend signals remain daunting as the price continues to trade comfortably below its 200-day simple moving average (SMA), which proved to be a tough resistance area.
As regards the market momentum, some pessimism seems to be building and a downside correction may be looming as the RSI is sloping down in the positive territory, while the MACD is moving with weak momentum around its zero area.
Should the bears dominate, driving the price below the 0.8425 level, the spotlight will shift to the crucial 23.6% Fibonacci retracement level of the down leg from 0.8720 to 0.8285 at 0.8388, where any step lower will put the pair in a bearish move in the medium-term picture. The long-term outlook will also face a deterioration if the decline extends below the 0.8285 mark.
In the event the bulls take control, the 38.2% Fibonacci of 0.8450 where the restrictive Ichimoku cloud is currently hovering, will come first into view. A violation at this point may see another challenging battle around the 200-day SMA, which coincides with the 50.0% Fibonacci of 0.8505. If buyers claim that zone this time, the descending line near 0.8530 could immediately add some downside pressure, deterring a continuation towards the 61.8% Fibonacci of 0.8557.
In brief, EURGBP continues to face negative trend signals, and only a confirmation above the downtrend line may change this view in the long- and short-term timeframes.
GBPAUD Bullish Sequence Favors More Upside
GBPAUD has found bid due to the divergence in the monetary policy between RBA and BOE. Bank of England (BOE) this year has hiked interest rate twice to fight against inflation. However, BOE indicates that it may still need to hike a few more times this year before it stops. This should take interest rates closer to 1% or even higher. Meanwhile, Reserve Bank of Australia (RBA) does not sound as hawkish as the other central banks. In the last monetary policy statement, the RBA has emphasized that the growth in workers’ wage is significant in the UK and US. RBA has judged that wage growth of three percent or more will be necessary to deliver the bank’s inflation target of 2.5%. In other words, RBA is not in a rush to raise the rate despite the current underlying inflation at the top of their target.
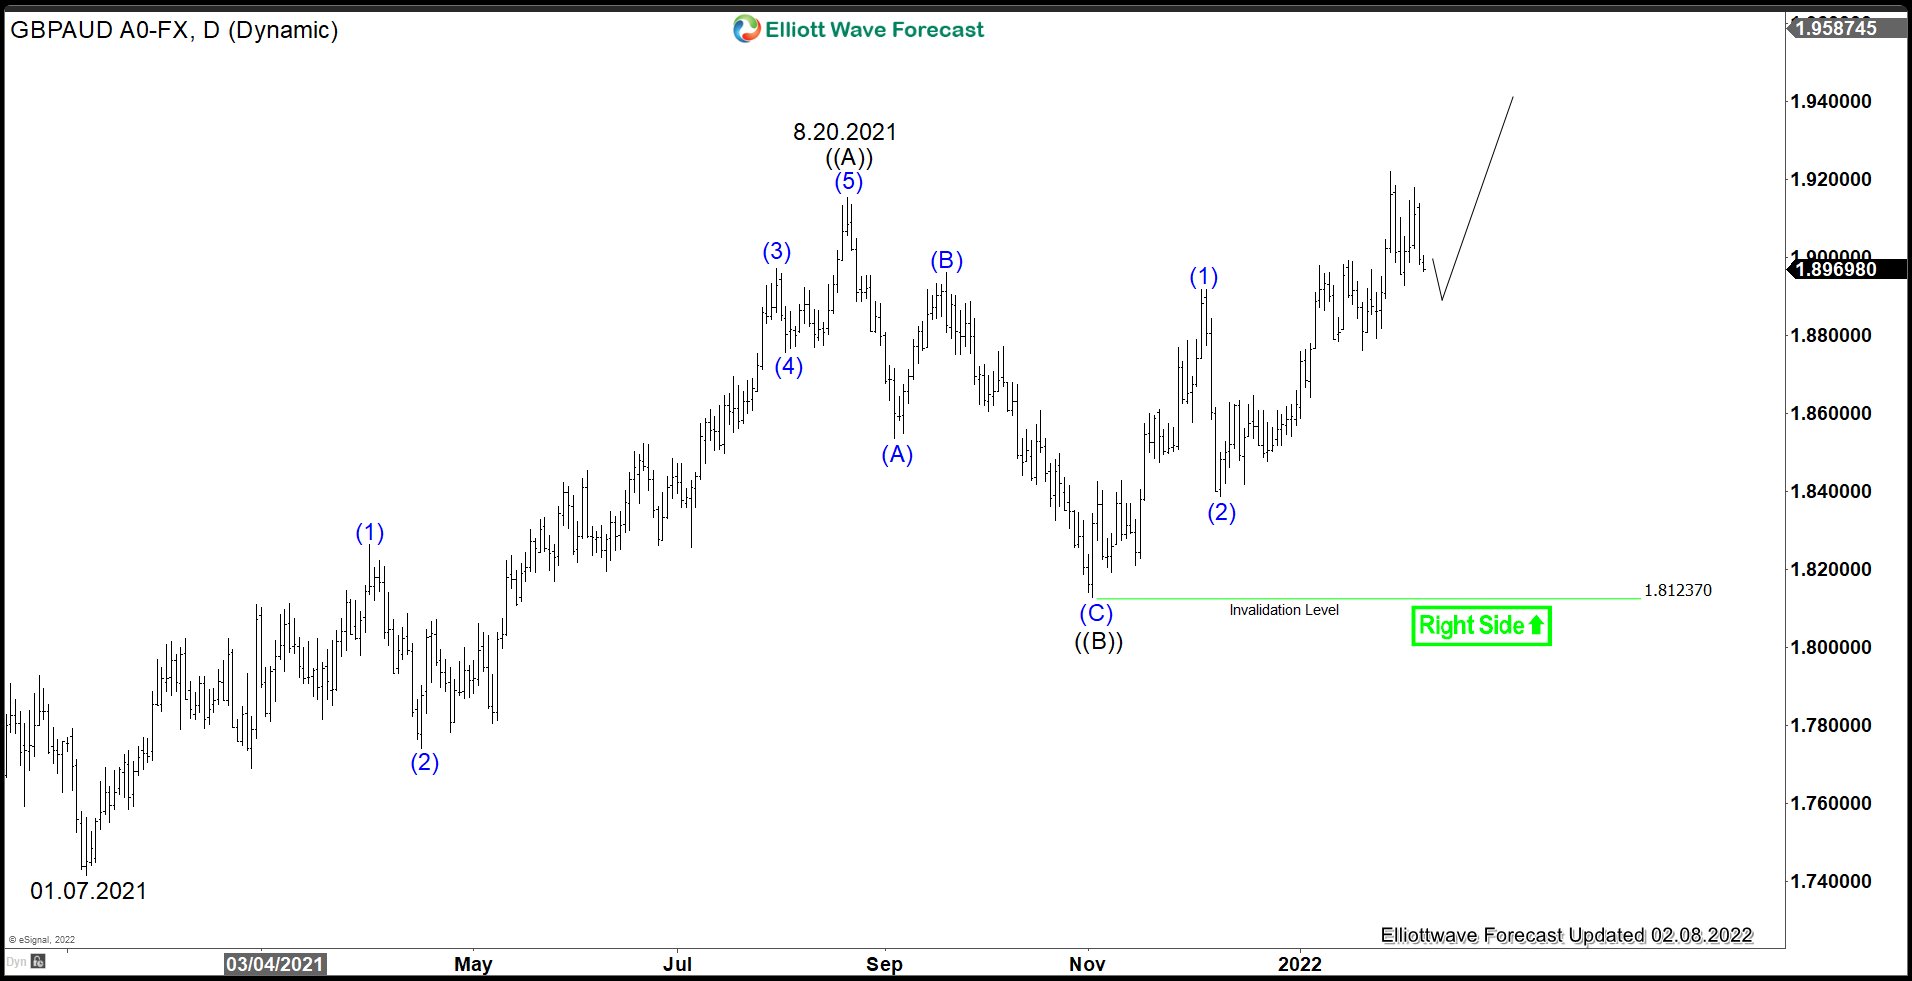
GBPAUD Daily Elliott Wave Chart
GBPAUD has broken above 08.20.2021 high (1.9154) and now the pair shows a higher high bullish sequence from December 11, 2020 low. The pair has potential target higher which can be calculated as 100% – 161.8% Fibonacci Extension from December 2020 low at 1.987 – 2.095. Near term pullback should find support in the sequence of 3, 7, or 11 swing for further upside as far as pivot at 1.8123 low stays intact.
ECB de Cos: Uncertainty around inflation very high due to geopolitical risks
ECB Governing Council member Pablo Hernandez de Cos said "risks to inflation are tilted to the upside in the short term." Recent data on Recent data on inflation has shown surprising upwards trends both in headline inflation and core inflation. He added, that the level of uncertainty around inflation is very high also due to geopolitical risks.
De Cos emphasized that more than ever it is necessary to keep all options open on monetary policy. But for now, ECB policymakers are sticking to the sequencing, starting first with tapering, before raising interest rate.
He added, that the next move on monetary policy is clear but will be gradual and depend on data.
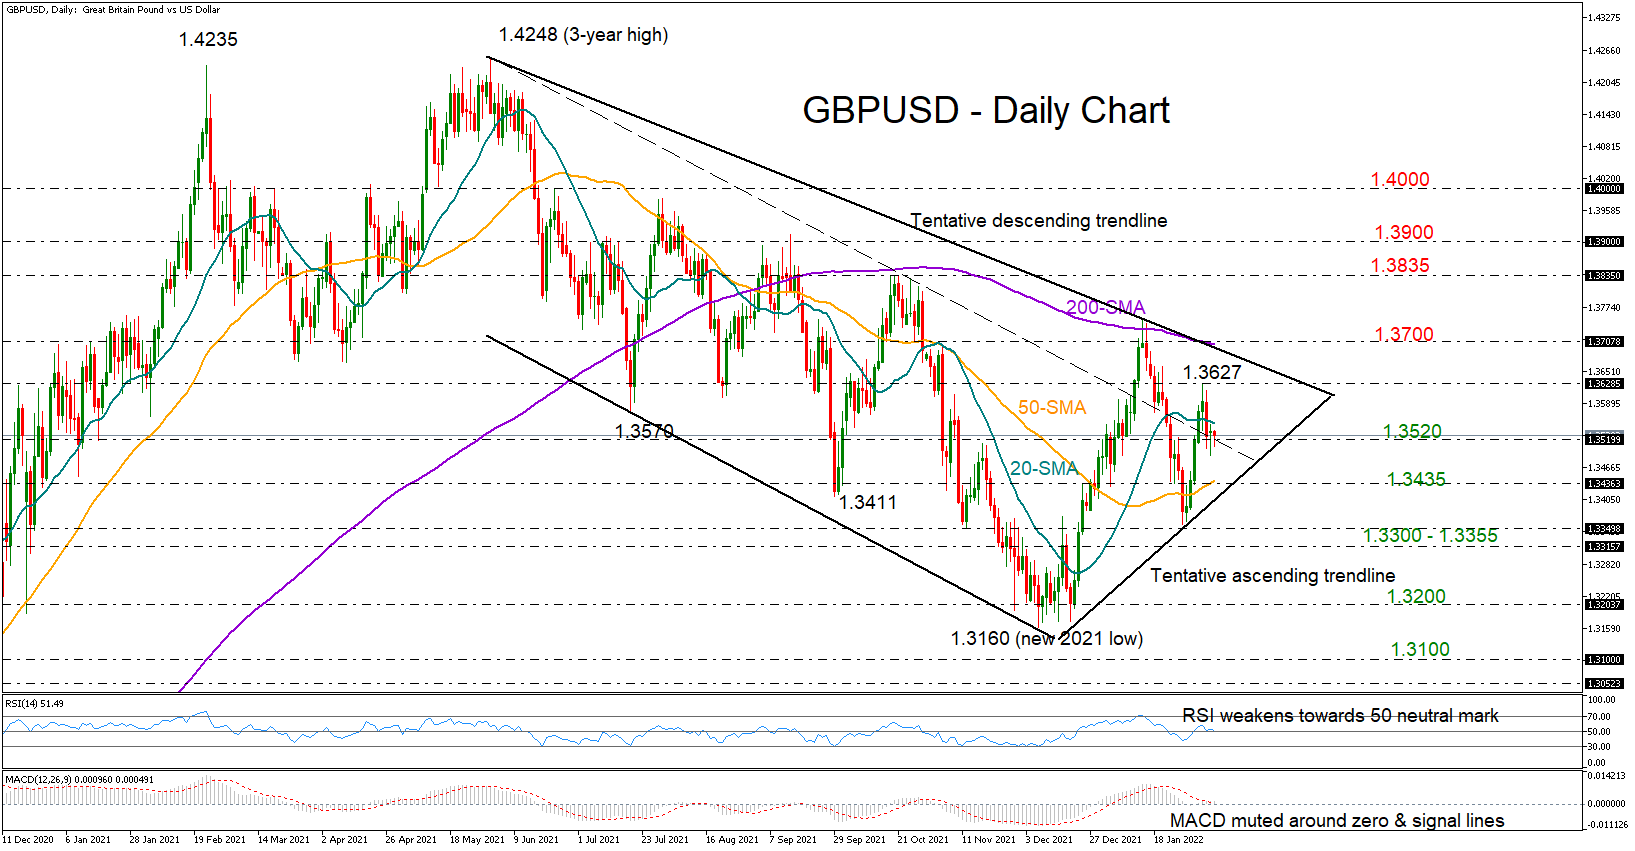
GBPUSD Sends Bearish Vibes Below 20-SMA
GBPUSD saw its bullish efforts evaporate near its 20-day simple moving average (SMA) on Monday, with the pair finishing the day muted and beneath last week’s peak of 1.3627 once again.
The above suggests the bears are still in charge and a downside correction below the nearby support of 1.3520 and towards the tentative ascending trendline and the 50-day SMA both at 1.3436 is still very likely. The negative slope in the RSI and the MACD, which are currently near their neutral levels, is also reflecting a weakening bias.
Should the upward-sloping trendline give way, the support region of 1.3300 – 1.3355 could immediately attempt to defend the short-term upleg off 1.3160. Failure to bounce here could trigger a sharper decline towards the 1.3200 number, while a close below the 2021 trough of 1.3160 may log a new lower low around the 1.3100 psychological mark.
In the event the bulls retake control above the 20-day SMA currently at 1.3549, driving the price above the latest peak of 1.3627 as well, a tougher battle could commence around the tentative resistance trendline and the 200-day SMA at 1.3700. A successful violation at this point would ruin the bearish trajectory in the medium-term picture, bolstering buying orders likely straight up to the 1.3835 and 1.3900 constraints.
In brief, GBPUSD is looking to be at a disadvantageous position in the short-term picture despite last week’s rebound, remaining exposed to additional declines towards 1.3435.
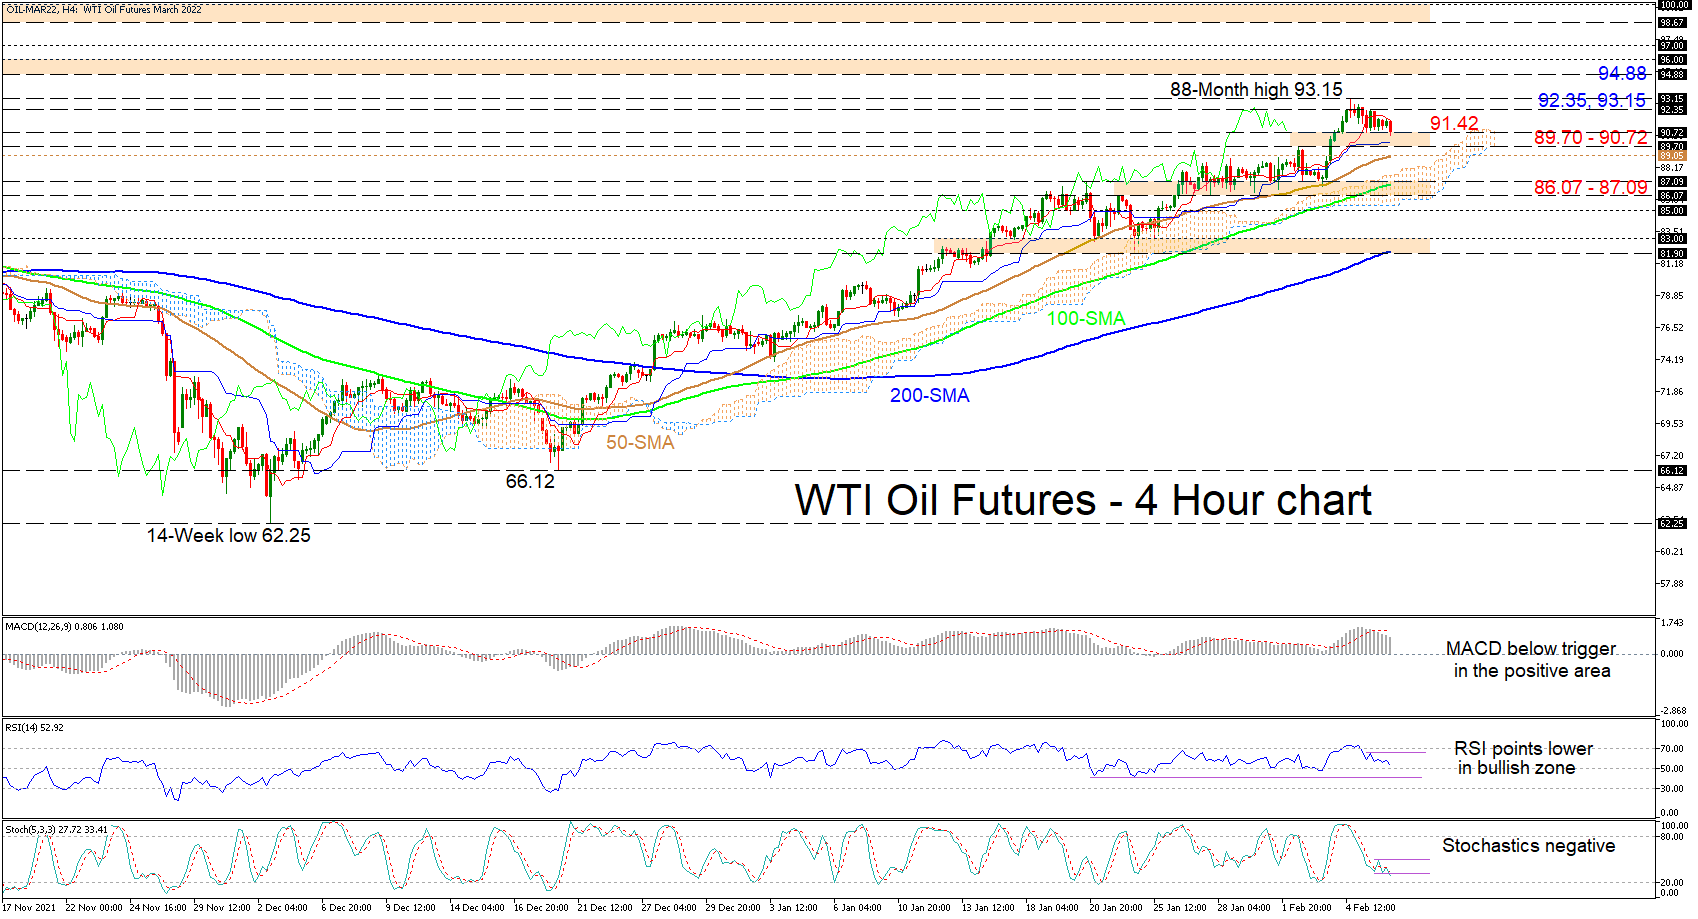
WTI Futures Bullish But Directional Forces Evaporate
WTI oil futures have stabilized, tiptoeing across the 89.70-90.72 support barrier after a pullback from the near 7½-year high of 93.15. The soaring simple moving averages (SMAs) are safeguarding the broader positive structure despite the minor retreat in the price of the black liquid.
The Ichimoku lines suggest guiding forces have fairly dried up, while the short-term oscillators are reflecting a slight weakening in the positive momentum. The MACD, some distance above zero, is fading below its red trigger line, while the falling RSI is nearing the 50 neutral threshold. The revived negative charge of the stochastic oscillator is promoting downside moves in the commodity.
In the negative scenario, downside limitations could come from the immediate 89.70-90.72 barrier, encompassing the flattening blue Kijun-sen line. Approaching from beneath this obstacle is the 50-period SMA at 89.05, which may try to provide footing for buyers to capitalize on. However, if a deeper price retracement unfolds, the Ichimoku cloud could operate as a tough support zone as it surrounds the 86.07-87.09 border, which is fortified by the 100-period SMA. Successfully driving the price lower, sellers may then attempt to accelerate negative moves with a break of the 85.00 handle.
Alternatively, if buyers find some traction from the 89.70-90.72 instant support, they could meet preliminary upside friction from the red Tenkan-sen line at 91.42 ahead of the 92.35 and 93.15 nearby highs, the latter being the more than 7-year high. Reviving the one-and-a-half-month rally from the 66.12 level, the bulls may then target the 94.88-96.00 resistance band formed by the September and August 2014 highs. Overstepping this, the 97.00 hurdle could then impede advances from gaining pace.
Summarizing, WTI oil futures are exhibiting a bullish bias above the 89.70-90.72 support and the climbing SMAs. That said, for negative tendencies to significantly gain strength, the price would need to glide below the cloud, which encapsulates the 86.07-87.09 upside defence.
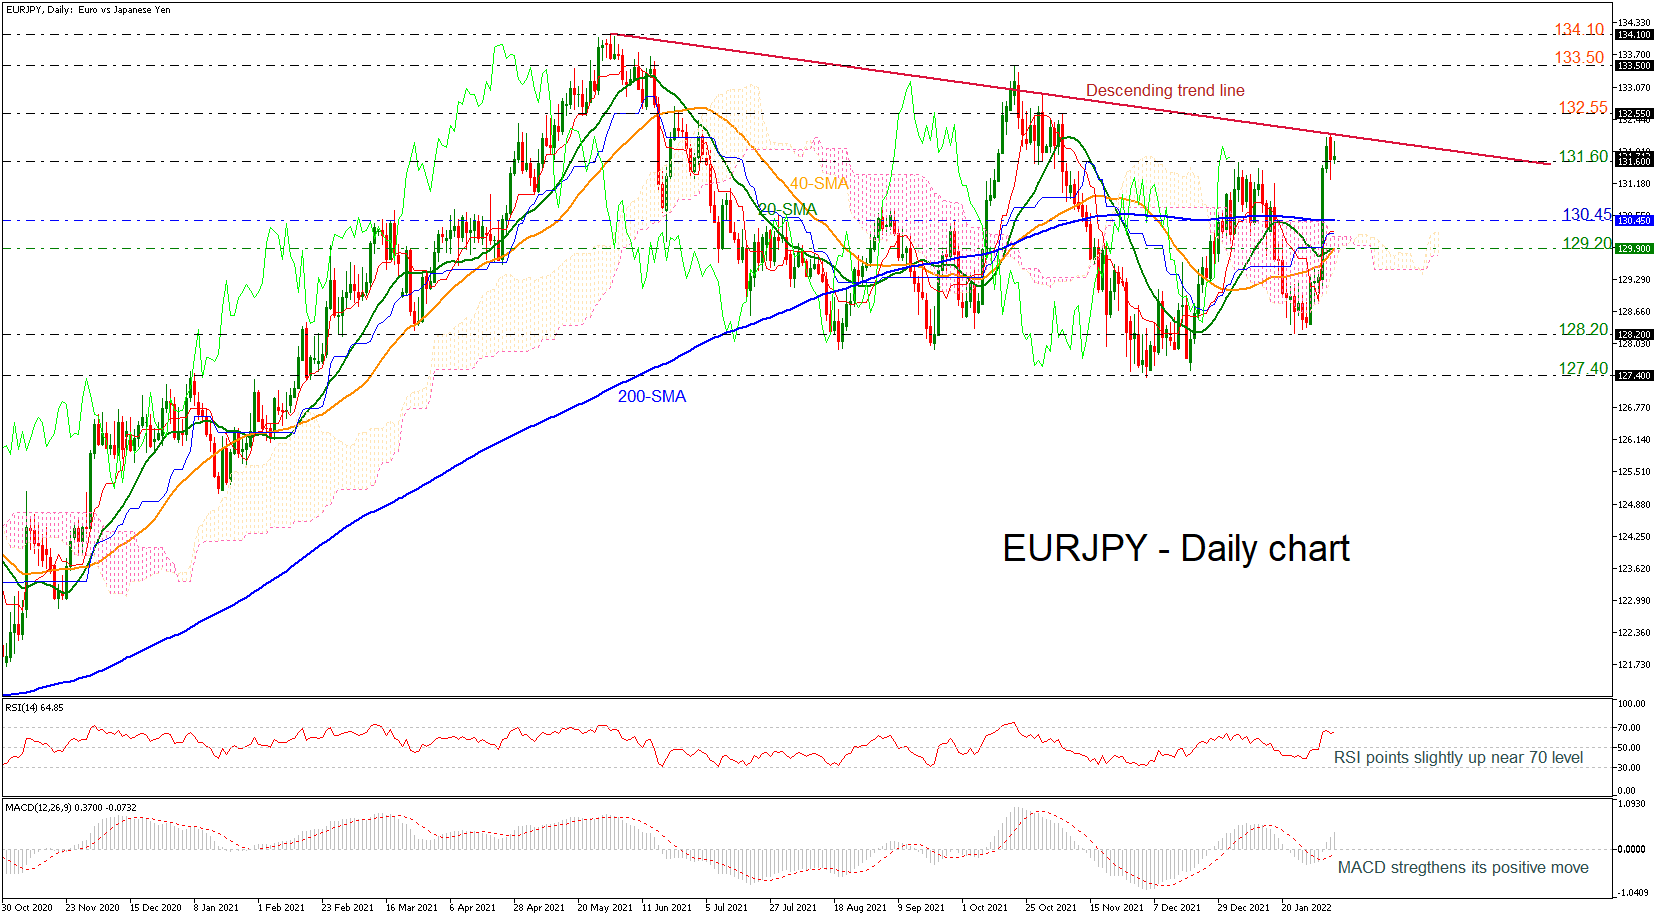
EURJPY Battles with 131.60, Below Falling Trend Line
EURJPY has been in a battle with the 131.60 support level over the last couple of sessions, holding below the long-term descending trend line. It is worth to mention that the price remains well above the 200-day simple moving average (SMA) as well as above the short-term SMAs, which are ready for a bullish crossover.
From a technical perspective, the RSI indicator is standing slightly below the overbought region with weak momentum, while the MACD is stretching the bullish movement above its trigger and zero lines.
Should the trendline at 132.10 crack, the price could initially test the 132.55 barrier before heading towards the 133.50 and 134.10 resistance levels.
In the negative scenario where the price snaps the 131.60 barrier and closes below it the next target would be the flat 200-day SMA at 130.45. Falling lower, the bears bulls will need to drive lower to the 20- and 40-day SMAs at 129.20 ahead the low of 128.20 and 127.40.
In brief, despite its resilience above 131.60, EURJPY needs to show clear bullish signals above the falling trend to shift the outlook to positive. If the diagonal line approves a pullback lower, then the broader picture will remain negative.
Daily Technical Analysis
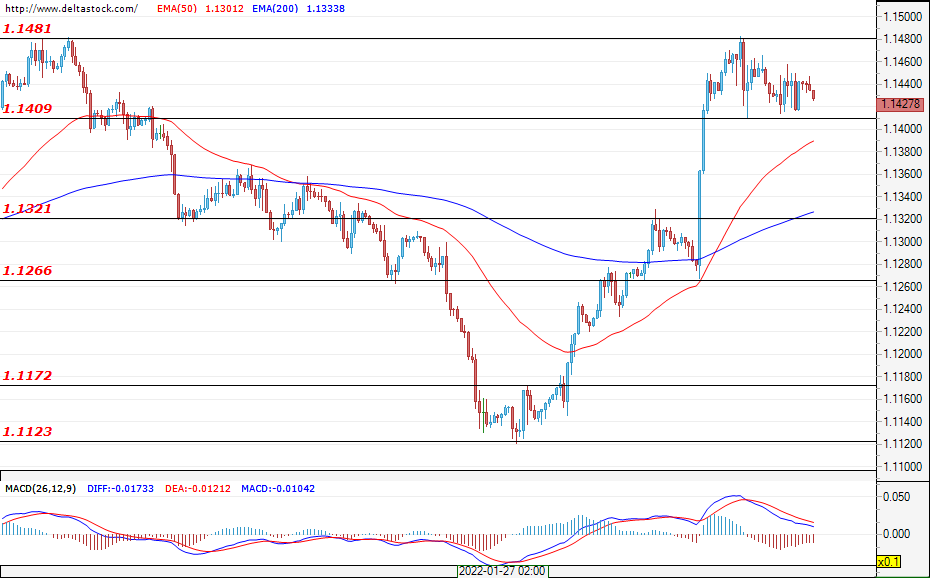
EUR/USD
The first trading day of the week passed calmly and the pair entered a corrective phase after reaching the resistance at 1.1480. The onset of the bears around this level seems hesitant and is currently limited by the local support at around 1.1410. Such a shallow pullback suggests that the bulls are still in position and that a new strong rally can be expected. If prices remain above 1.1410, then a breach of the resistance at 1.1480 can be expected, and a possible next target for the movement may be the zone of 1.1580 – 1.1600. In case the local support is breached, the next zone that would support the bulls is 1.1320, followed by the impulse’s starting point at 1.1266.
USD/JPY
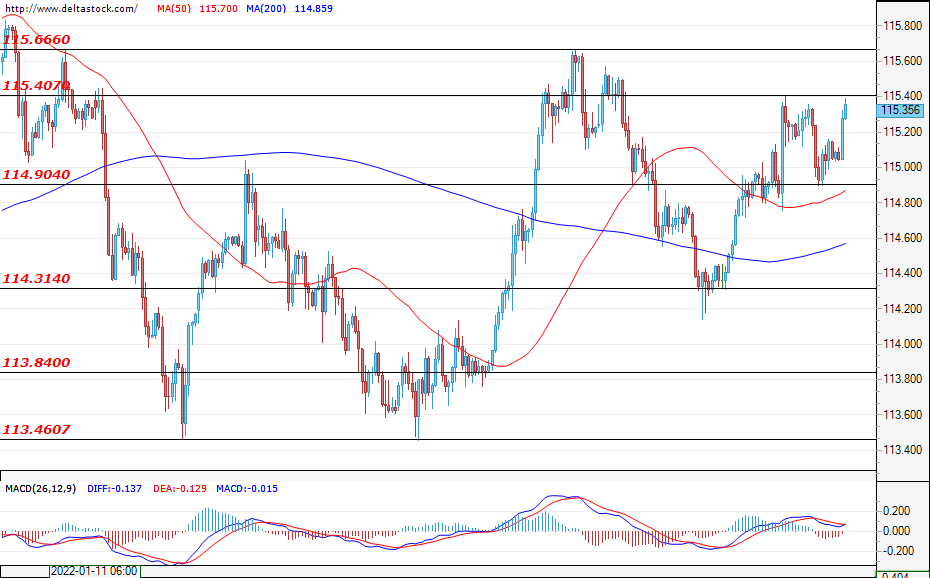
The dollar fell slightly against the yen on Monday, but in the early hours of today, all losses have been recovered. The bulls found support at around 114.90, and at the time of writing, prices are testing the resistance at 115.40. This zone is expected to be overtaken and the rally is to continue towards 115.66 and 116.00. On the higher time frames, the sentiment seems mixed and it is likely that, in the next few days, the pair will be trading in a range between 114.30 and 116.00. The first daily support remains at 114.90.
GBP/USD
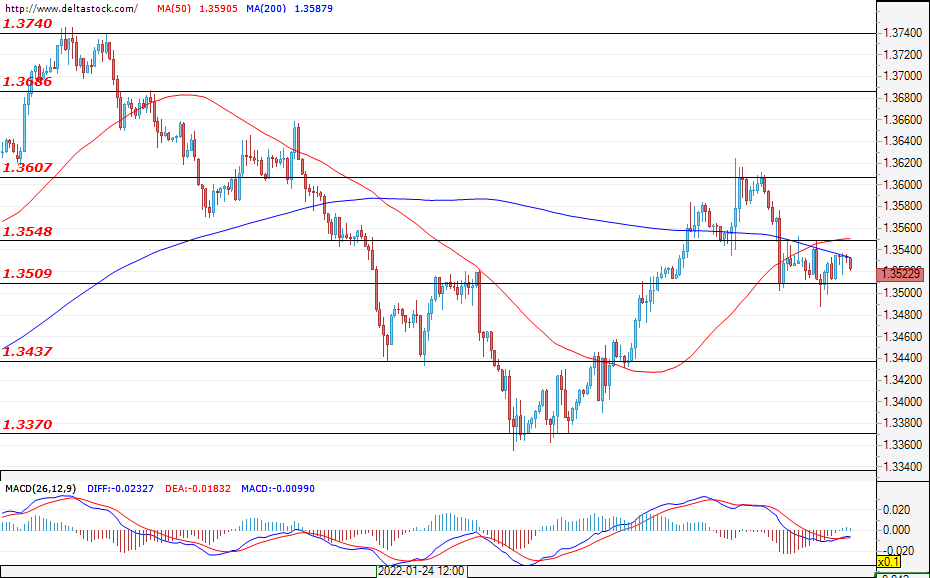
The Cable ended the day without significant change and prices remained above the support at around 1.3510. This area remains the first daily support. The first resistance for the bulls is 1.3548, followed by 1.3607. Volatility is expected to shrink and the market is likely to consolidate between the 1.3510 support and the 1.3607 resistance. Expectations remain mixed and a breach of either zone would signal for the market’s future intentions.
EUGERMANY40
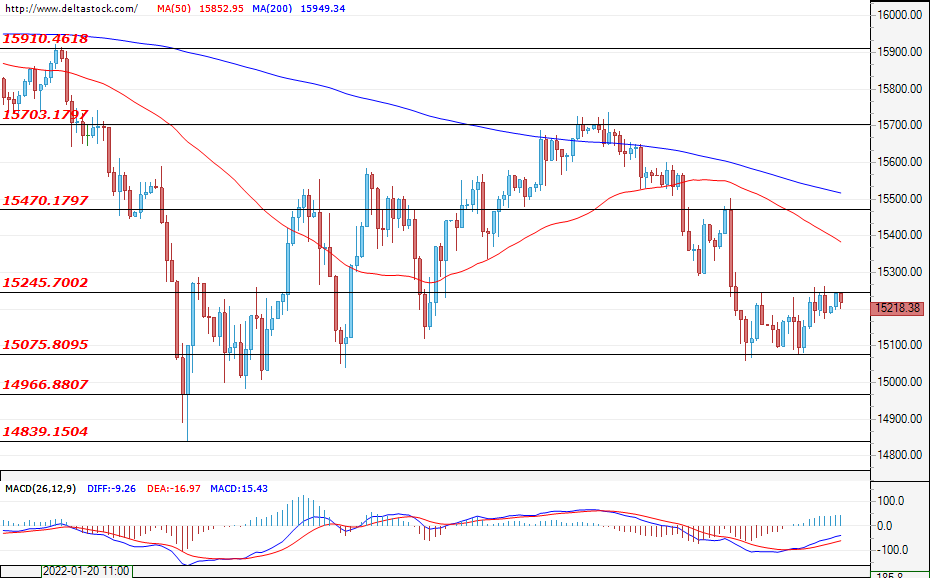
The German index is struggling around the resistance at 15245, and in the last two sessions, prices have been jumping back and forth between this zone and the support at 15075. The expectations are positive – for a breach of 15245, with the market also possibly forming a new resistance at around 15340. The possibility for a new test of the lows at around 14960 or at 14840 is still on the table. Even in such a scenario, however, the expectations for a rally are still intact. The main weekly support for the index is found at around 14807 and this area could prove to be of great interest for the bulls. When the bulls return to the market, their targets could be 15470 and 15700. Serious bearish scenarios at the moment can be expected only if 14807 is breached.
US30
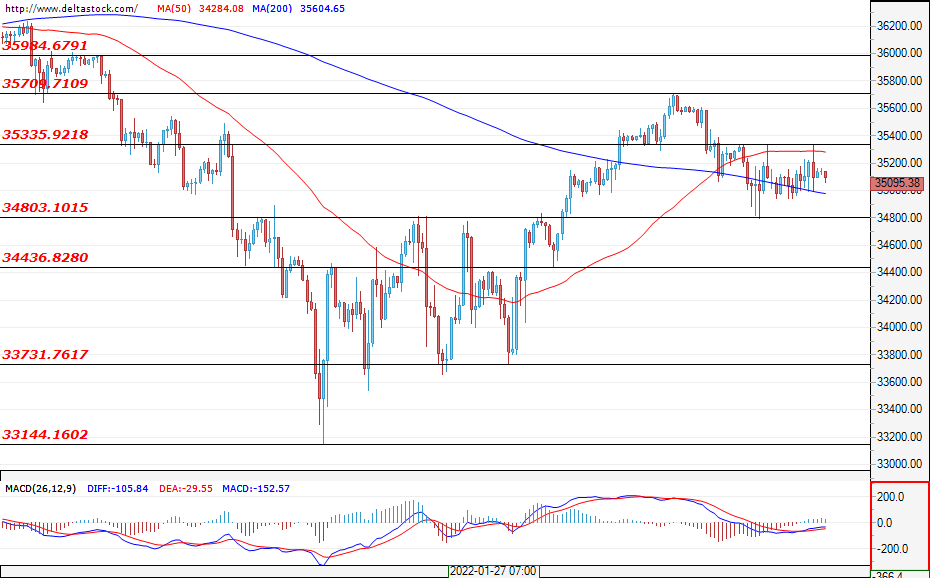
The U.S. blue chips are performing better than their European counterparts and prices are currently hovering over the breach of the structure above 34800. This is also the main daily support level. Yesterday, the US30 failed to find a clear direction and the price action confirmed the resistance at 35335. Expectations remain positive, at least until the support at 34800 is breached. This would worsen the overall market sentiment, with further supports for the index being the levels at 34436 and at 33730. A breach of the resistance at 35335 would allow for a new test of the high at 35709. Although the markets have stabilised, profits are still fragile and any negative events could easily lead to a new test of the lows at around 33730.
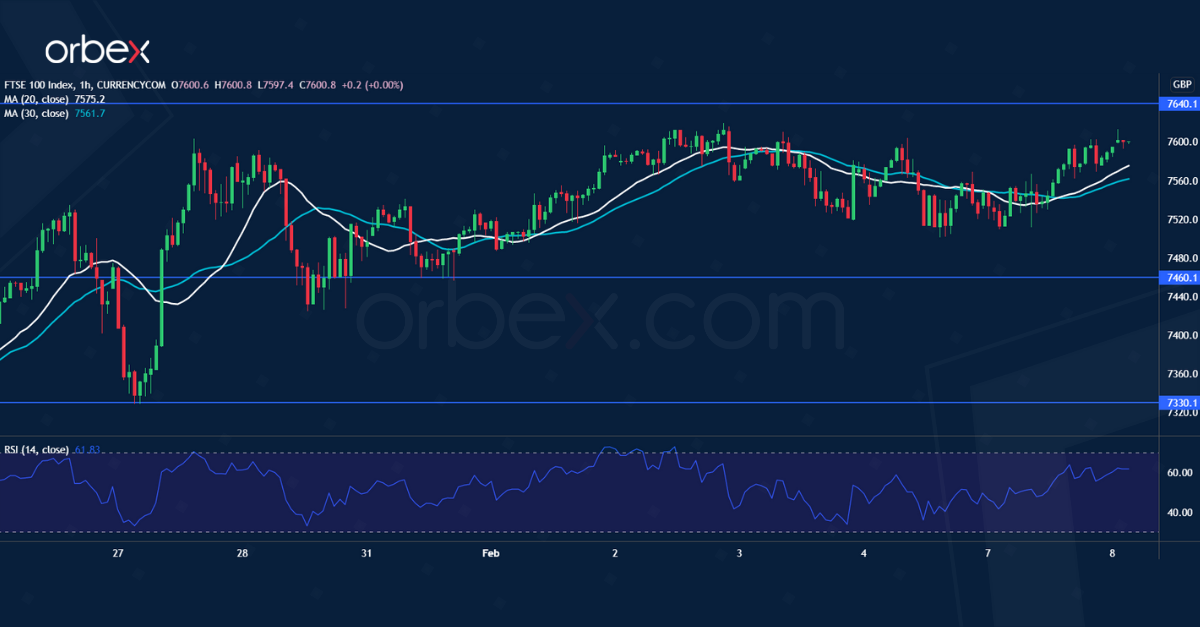
FTSE 100 Awaits Breakout
The FTSE 100 rallies supported by solid performance in the commodity sector.
The recent rebound hit resistance near the January peak at 7640. Narrowing consolidation and higher highs suggest increased buying pressure.
A bullish breakout would flush sellers out and attract momentum traders, firing up volatility in the process. This would be a strong bullish continuation signal.
7460 is fresh support if the market remains indecisive. Its breach could extend the correction back to 7250.