Sample Category Title
Eco Data 1/31/22
[php_everywhere instance="1"]
Forex and Cryptocurrency Forecast
EUR/USD: Surprises from the US Federal Reserve
The meeting of the US Federal Reserve FOMC (Federal Open Market Committee) and the subsequent press conference of its management was certainly the main event of the last week. JP Morgan analysts called the speech of Jerome Powell, the head of the US central bank, the most "hawkish" of all during his tenure.
As for the first increase in the federal funds rate this year, there were no surprises: it is likely to take place in March, as planned. True, Jerome Powell did not answer the question of how much it will be increased, 25 or 50 basis points (bp). But at the same time, he made it clear that the Fed will be quite "agile" and "intractable" from now on. Apparently, the regulator will no longer pay attention to either the coronavirus omicron strain or the stock indices collapse and will focus on controlling inflation.
The number of possible increases in the refinancing rate in 2022 was a real surprise for the markets. Powell's speech led to the market upgrading the probability of three increases by June from 45% to 60%. In total, there can be five or six of them this year. For example, Deutsche Bank experts forecast a 25 bp rate hike in March, May, and June, and two more acts of monetary restriction before the end of the year. And their colleagues from BNP Paribas have set their sights on six raises. There may even be seven of them If inflation continues to be at a high level in the second half of the year. After all, the head of the Fed has made it clear that the main tool to fight inflation will be the federal funds rate.
In addition, the US Central bank has decided to double the pace of rolling back its quantitative easing (QE) program. The volume of government bonds repurchases will decrease by $20 billion per month from next month (now $10 billion), and of mortgages by $10 billion (now $5 billion).
All of these hawkish signals have shown that the regulator's stance has become much tighter and have made a huge impression on the derivatives market. The direct correlation between government bond yields and the DXY dollar index was restored, and the index jumped above 97.35.
Recall that the euro is the basis of the basket of 6 world currencies that form the DXY, with a share of 57.6%. Therefore, the European currency played a leading role in the growth of the index and the strengthening of the dollar in the current situation. The difference between the Fed's hawkish stance and the ECB's dovish stance has been repeatedly spoken about. The European Central Bank intends to only start raising the rate in 2023, while its counterpart overseas will already be completing this program. And such a divergence does not bode well for the Old World currency.
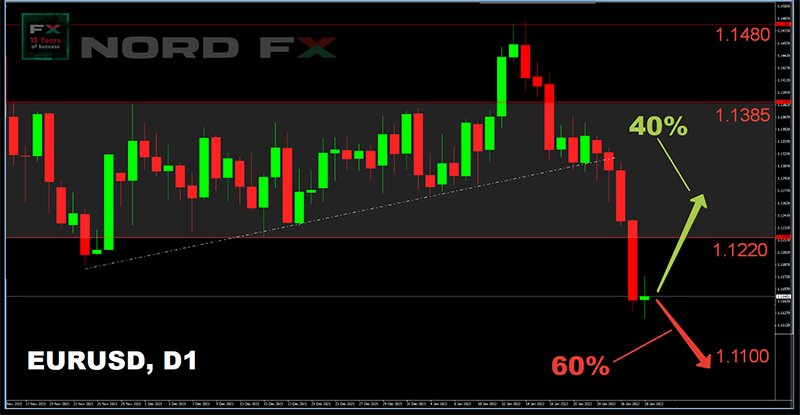
The EUR/USD pair lost more than 220 points at its high in the past week alone, which was a record for the last seven months. The local bottom was found on Friday, January 28 at the level of 1.1121, followed by a slight correction and a finish at 1.1148.
Of course, if the US Federal Reserve conducts an ultra-aggressive tightening of its monetary policy, it can lead to a sharp reduction in consumer demand, with all the ensuing problems. But this is not happening so far. And it will always be possible to soften the position even if it ever happens. Therefore, the probability of the pair falling towards 1.1000 is very high. This is the figure that sounds both in the forecasts of strategists and the Internationale Nederlanden Groep, as well as the Canadian Imperial Bank of Commerce.
At the time of writing, 100% of trend indicators and 100% of oscillators on D1 are red, though 30% of the latter are in the oversold zone. Among experts, the majority (60%) are in favor of further strengthening of the dollar, 40% believe that everything is not lost for the euro yet, and the pair will be able to temporarily return to the boundaries of the medium-term side channel 1.1220-1.1385. The nearest resistance zone is located at 1.1185, followed by 1.1220, 1.1275, 1.1355-1.1385 and 1.1485. The nearest support zone is 1.1075-1.1100 and then 1.0980-1.1025.
As for the calendar of the upcoming week, the attention of the market will be mainly focused on the ECB meeting on Thursday, February 03. It is not likely to present any special surprises, and the interest rate will remain the same, at the level of 0%. However, certain changes in the monetary policy of the European regulator are still possible. And investors expect to learn about them at the final press conference.
In general, the week will be full of macro-economic statistics. There will be data on the GDP of the Eurozone and the consumer market in Germany on Monday, January 31. The volumes of retail sales in Germany, the ISM business activity index in the US manufacturing sector, as well as the results of a study of the European banking sector will be announced on Tuesday. There will be statistics on the Eurozone consumer market and the level of employment in the private sector in the US on Wednesday. The value of the ISM business activity index in the US services sector will become known on Thursday. And in addition to data on retail sales in the Eurozone, we are traditionally waiting for a portion of statistics from the US labor market, including the number of new jobs created outside the agricultural sector (NFP) on the first Friday of the month, February 04.
GBP/USD: How Will the Bank of England Respond?
The Markit Services PMI for the UK released on January 24 came in below the forecast at 53.3 versus the expected 55.0. Further, the expected active increase in rates by the Fed, and then preliminary data on US GDP for the fourth quarter of 2021, played on the side of the dollar. They showed an increase that no one expected: 6.9% against the forecast of 5.5% and the previous value of 2.3%. Apparently, the US economy has not only recovered from the COVID-19 attack but has recovered so much that economic growth has even surpassed the 2019 figures.
All this has not benefited the British currency of course. And then there are the demands for the resignation of British Prime Minister Boris Johnson, which the market regarded as another bearish factor. As a result, the GBP/USD pair fixed a low at 1.3357, falling by almost 400 points in two weeks.
Can the pound return to growth even despite the US Fed's hawkish stance? We are likely to get an answer to this question soon enough. After all, in addition to the ECB meeting, there will also be a meeting of the Bank of England on Thursday, February 03. How can it respond to the Americans? Of course, by a faster rate increase: according to a number of forecasts, the pound rate may be increased by another 0.25 bp, up to 0.50%.
For how long will the British currency have such support? Many analysts doubt that the actions of the Bank of England will meet market expectations, and that the regulator will act as aggressively as the Fed this year. Based on this, economists at Rabobank, the second largest bank in the Netherlands, do not exclude that the GBP/USD pair may fall below 1.3000 by the middle of the year.
As for the current situation, the level 1.3400 (range 1.3360-1.3415 to be exact) is a very strong support/resistance zone and can serve as a springboard for the pair to bounce up. This development is supported by 30% of experts. The next resistances are waiting for the pair at levels 1.3440, 1.3500-1.3525, 1.3575, 1.3650, 1.3700 and 1.3750.
70% of analysts vote for the further fall of the pair. Supports are located at 1.3360, then 1.3275, 1.3200, followed by a strong December trend reversal zone 1.3160-1.3185.
The indicators on D1 look like this: only 10% of the oscillators point to the north, the remaining 90% point to the south, of which 20% give signals that the pair is oversold. Among trend indicators, all 100% look down.
In addition to the Bank of England meeting, we should pay attention to data on business activity (PMI) next week: in the manufacturing sector on Feb. 01, in the services sector on Feb. 03 and in the UK construction sector on Feb. 04.
USD/JPY: Yen Has Nothing to Answer
If the Bank of England has something to respond to the US Federal Reserve, nothing like this can be expected from the Bank of Japan with its forever negative (minus 0.1%) rate. The yen, as a safe-haven currency, is usually supported by investors running away from risky assets. But now the rising dollar and US Treasury bonds are a powerful obstacle in their way. And the Bank of Japan does not really need a strong national currency.
As a result, as most experts (60%) expected, the USD/JPY pair rushed north again. True, it failed to reach the high on January 04 at 116.35, but the rise still looks very impressive. If the pair was at the level of 113.46 on Monday, January 24, it reached the height of 115.68 by the end of the working week. The last chord of the five-day period was set at the level of 115.22.
At the time of writing, most indicators on D1 point north. Among the oscillators, there are 90% of them (10% of them give signals that the pair is overbought), the remaining 10% are colored red. Among the trend indicators, 100% recommend buying. Experts agree with the indicators: 70% of them side with the bulls, 20% with the bears, 10% are neutral. Support levels are 115.00, 114.45, 114.00, 113.75, 113.45, 113.20, 112.55 and 112.70. The nearest resistance zone is 115.50-115.70, the nearest serious target of the bulls is a new five-year high at 116.35.
Any serious macroeconomic statistics from Japan is not expected this week.
CRYPTOCURRENCIES: The Calm After the Storm
If we talk about cryptocurrencies, nothing terrible happened for them at the January meeting of the Fed. It had long been known that the regulator would tighten monetary policy and reduce monetary injections into the economy. As well as the fact that it will raise interest rates. Yes, this will hit risky assets, but it will draw money from the stock market in the first place. It is possible that things will not reach cryptocurrencies, as a super-speculative asset at all: the volumes are too small.
The crypto market grew by leaps and bounds as the Fed flooded the fires of the pandemic with trillions of brand new freshly minted dollars. There will be no more inflow of this money, and it is probably not worth counting on a new crypto boom. Institutional investors will behave much more calmly, but they will not be in a hurry to part with their bitcoins and ethereums either. Everyone who wanted to sell them has already sold. Those who wanted to keep them, kept them as a long-term investment.
Of course, any surprises are possible in this industry: both pleasant and not so much so. In the meantime, the crypto market is recovering from the panic that arose before the Fed meeting. Having fallen on Monday, January 24 to $32.945, the BTC/USD pair grew a little and it is trading in the $37,000 zone on the evening of Friday, January 28 at the moment of writing this. The total market capitalization has risen from $1.51 trillion to $1.70 trillion, and the Crypto Fear & Greed Index has grown to only 24 points (11 points at the low of January 23), being stuck firmly in the Extreme Fear zone. So it is clearly premature to talk confidently even about the beginning of a recovery and a trend reversal. Moreover, the BTC/USD chart shows that the strong support that the pair relied on both in 2020 and 2021 is located in the $29,000-30,000 zone. So there is room to fall.
Goldbug and bitcoin skeptic Peter Schiff allowed the collapse of bitcoin below $10,000. But Mike Novogratz, the founder of the Galaxy Digital crypto bank, stood up for the flagship currency immediately, offering Schiff a $1 million bet. The banker promised to send these funds to charity or another purpose of the opponent's choice if BTC trades below $35,000 in a year.
At the same time, Novogratz believes that the bear market will be long enough, and therefore does not advise buying on drawdowns now. "It will be difficult for cryptocurrencies to start a rally until the stock market bottoms out. Nevertheless, digital assets have already experienced a significant sell-off and are beginning to receive support from buyers," he explained.
Robert Kiyosaki, author of the best-selling book "Rich Dad Poor Dad", also recommends waiting with purchases, saying that he will buy more digital gold only if its price drops to $20,000. "Profits are made when you buy, not when you sell. Bitcoin is crashing. Great news. I bought BTC for $6,000 and $9,000. I will buy more if the price tests $20,000. The time to get rich is approaching," he wrote.
Recall that Kiyosaki predicted a "giant stock market crash" last October and warned that the same fate awaits gold, silver, and bitcoin. This is exactly what we are seeing now.
Ton Weiss, a well-known trader, analyst and former vice president of JP Morgan Chase, does not rule out the completion of the bitcoin correction in the near future. According to him, the cryptocurrency has reached the 20-month moving average (MA), which is at the level of $34,000. Weiss claims that this is a "perfect opportunity" for a trend reversal and the asset's return to growth. According to the specialist, in the event of a rebound, the price of bitcoin will quickly return to the $40,000 level and consolidate above it.
Another cryptocurrency analyst, Nicholas Merten predicts that despite the current market conditions, bitcoin could rise almost 7 times to $200,000 by the end of the year. Merten stated on his DataDash YouTube channel (502,000 subscribers) that if bitcoin's capitalization stays above $600 billion, it will set the stage for the coin's bull run in the coming months.
The expert recalled that all rallies occur after corrections and are often spurred on by BTC purchases at heavily discounted prices. Understanding how big players buy is the key to navigating the highly volatile cryptocurrency markets, Merten says.
According to other market participants, bitcoin can visit the $30,000 area, and then it is likely to turn around. Charles Edwards, the founder of the crypto investment company Capriole, wrote that the signal of the NVT (Network Value to Transaction ratio) indicator shows that BTC is oversold: this situation is rare in the market. "We have entered an open buying zone," Edwards commented on the current situation.
Recall that this indicator was proposed and is actively used by the well-known analyst Willy Woo. NVT is calculated by dividing bitcoin's market capitalization by its transaction volume (in USD) and is a popular metric to assess whether the coin is overbought or oversold.
Michael Saylor, founder of MicroStrategy, named two reasons for the current correction in the cryptocurrency market. The first of these is the non-transparent regulation and regulatory uncertainty of the crypto industry. The second is the imperfection and immaturity of the crypto industry. At the same time, the businessman believes that the current market conditions provide "an excellent entry point for institutional investors interested in cryptocurrencies, who have been on the sidelines so far."
According to Saylor, a lot of institutional investors are now watching bitcoin and see that it is 40% below the all-time high and that it is consolidating. At the same time, they understand that bitcoin is supported by such serious investors as Bill Miller, regulators, senators and congressmen, as well as large public companies.
As for MicroStrategy itself, this software developer owns 124,391 BTC. The company has spent about $3.7 billion on the acquisition of cryptocurrency. Thus, the average purchase price is $30,100 per 1 coin. And if it falls below this level, it will result in multi-million or even billions in losses for the owners of MicroStrategy.
And now, a couple of soothing statements to conclude the review. The first is from Scott Melker, a trader, analyst and podcast host, who reminded his subscribers that there is nothing unusual about what is happening in the market now. "People have short memories. Bitcoin fell from $60,000 to $30,000 in 10 days in May. 10 DAYS!!! All this has already happened. And that was only 8 months ago. So why be so scared?" he wrote.
The second is from McDonald's fast-food chain, which offered owners of digital assets to get a job in the catering industry during the bearish trend. This is a joke of course. But, as they say, there is some truth in every joke. The McDonald's tweet was liked by the community and quickly gained almost 100,000 likes.
EUR/USD Weekly Outlook
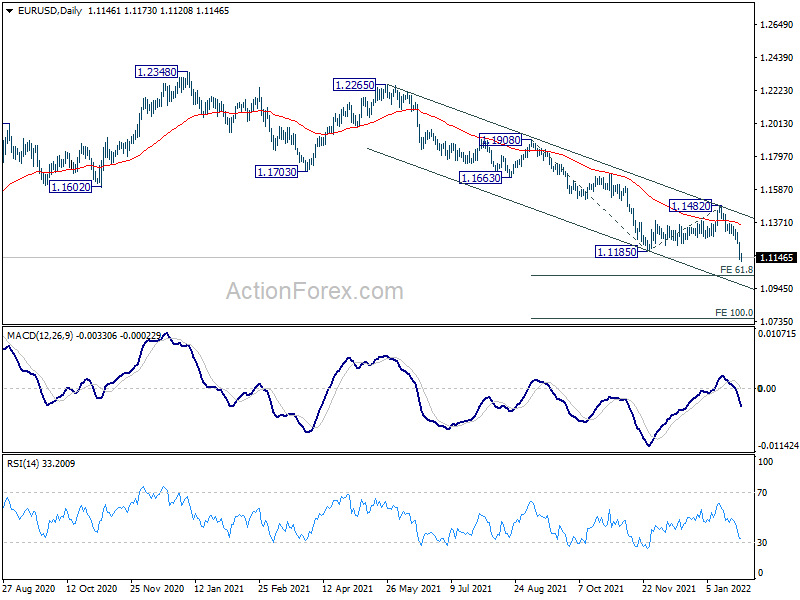
EUR/USD's down trend from 1.2348 finally resumed last week by breaking through 1.1185 and hit as low as 1.1120. Initial bias stays on the downside this week. Next target is 61.8% projection of 1.1908 to 1.1185 from 1.1482 at 1.1035. Break will target 100% projection at 1.0759. On the upside, above 1.1243 minor resistance will turn intraday bias neutral first. But recovery should be limited well below 1.1482 resistance to bring down trend resumption.
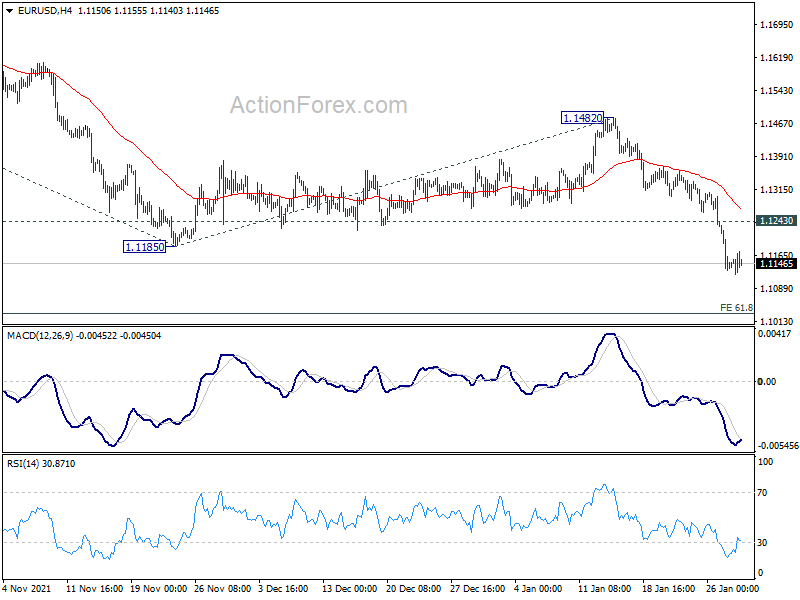
In the bigger picture, the strength of the the decline from 1.2348 (2021 high) suggests that it's not a corrective move. But still, it could be the fourth leg of a sideway pattern from 1.0339 (2017 low), or resuming long term down trend. In any case, outlook will now stay bearish as long as 1.1482 resistance holds. Next target would be 1.0635 low.
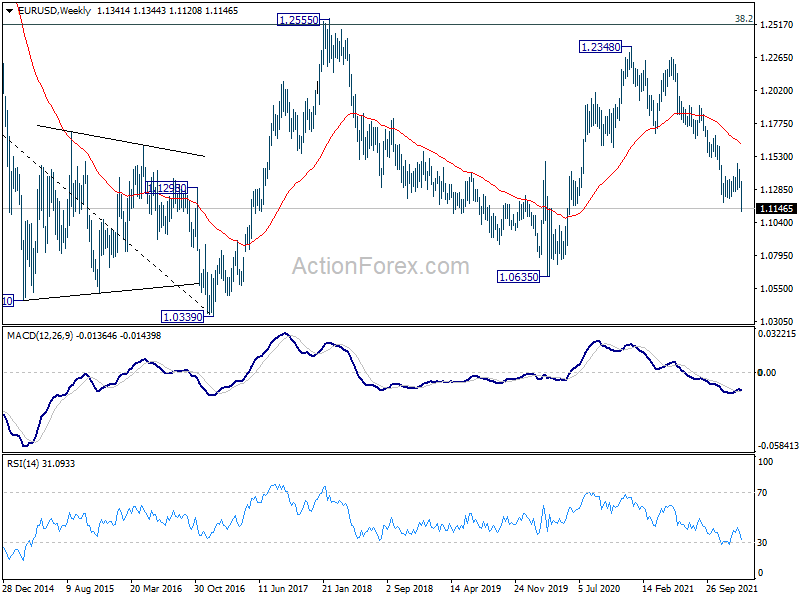
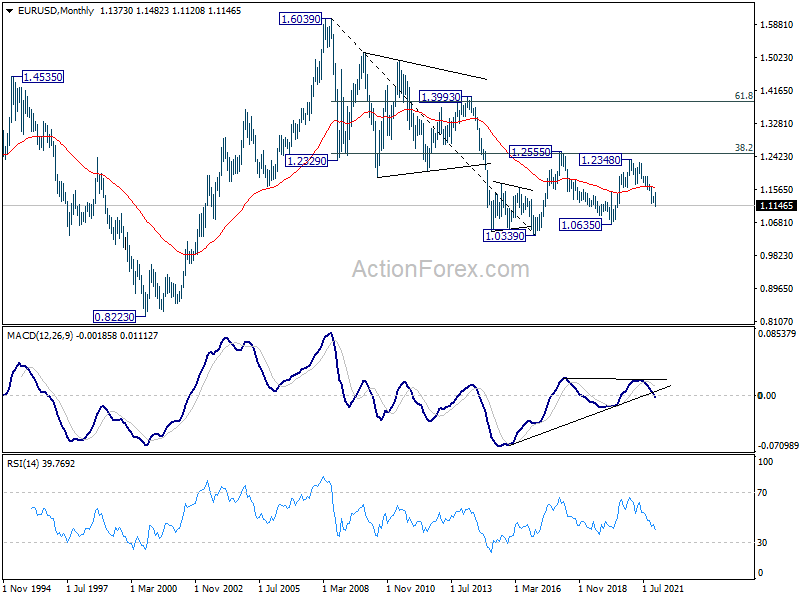
In the long term picture, EUR/USD should have failed 1.2555 cluster resistance (38.2% retracement of 1.6039 to 1.0339 at 1.2516) again. The break below a flat 55 month EMA is keeping long term outlook bearish. That is, the down trend from 1.6039 (2008 high) is still in progress. Break of 1.0339 will open up further decline towards 0.8223 (2000 low).
USD/JPY Weekly Outlook
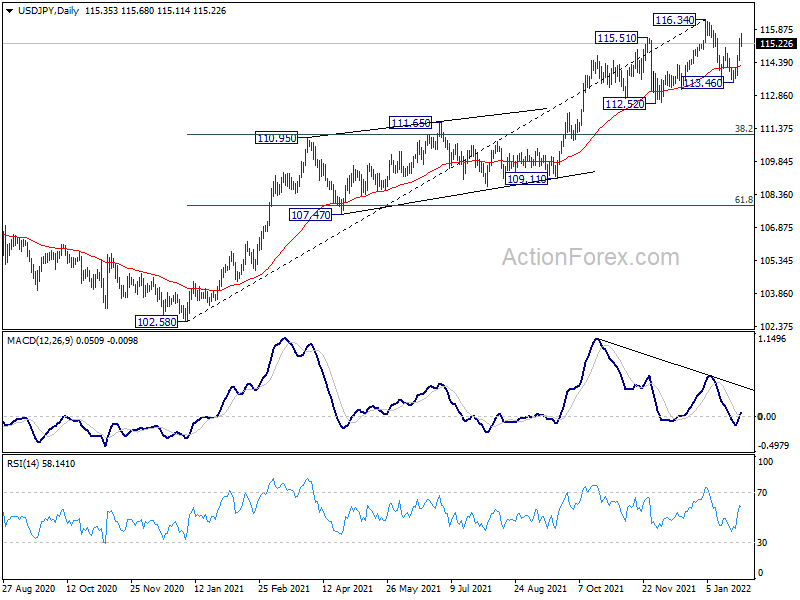
USD/JPY's break of 115.05 resistance last week suggests that pull back from 116.34 has completed at 113.46 already. Strong support from 55 day also retain near term bullishness. Initial bias stays on the upside this week for 116.34 first. Decisive break there will resume larger up trend for 118.65 long term resistance next. On the downside, below 114.46 minor support will mix up the near term outlook and turn intraday bias neutral again.
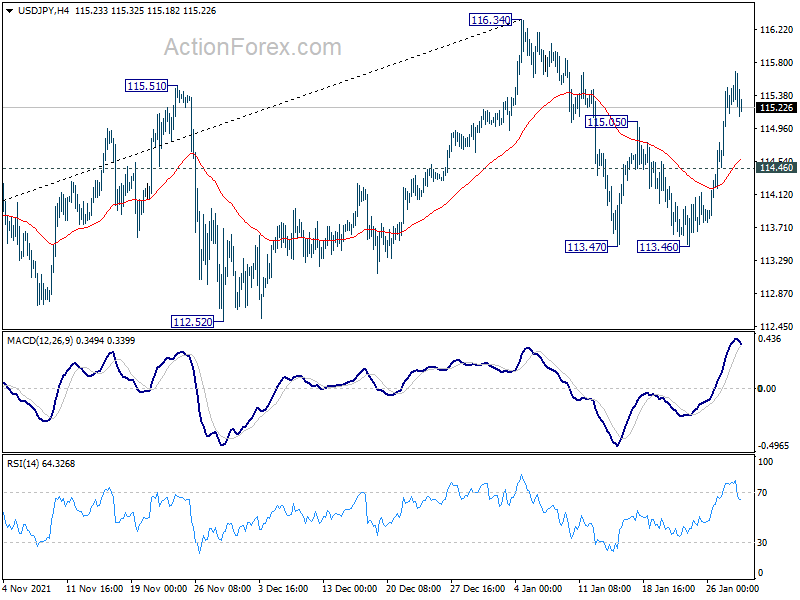
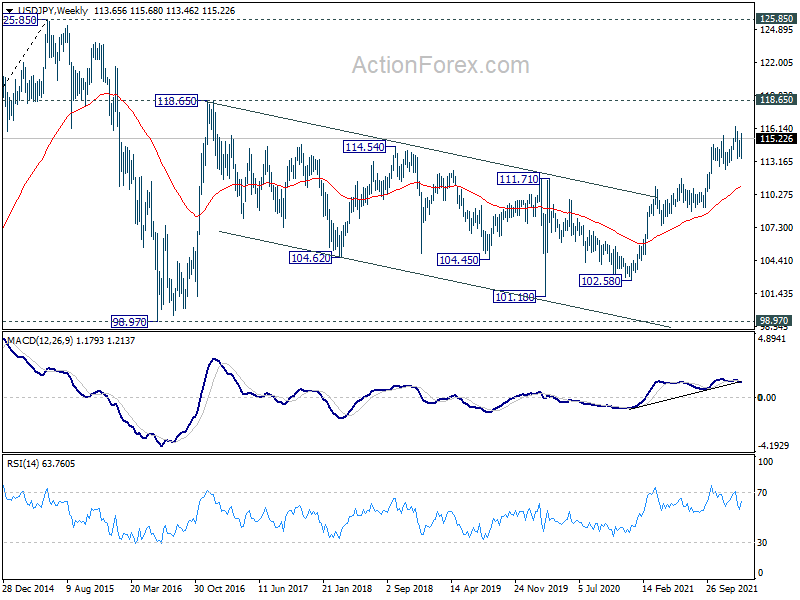
In the bigger picture, no change in the view that rise from 102.58 is the third leg of the up trend from 101.18 (2020 low). Such rally should target a test on 118.65 (2016 high). Sustained break there will pave the way to 120.85 (2015 high) and raise the chance of long term up trend resumption. This will remain the favored case as long as 55 week EMA (now at 111.07) holds.
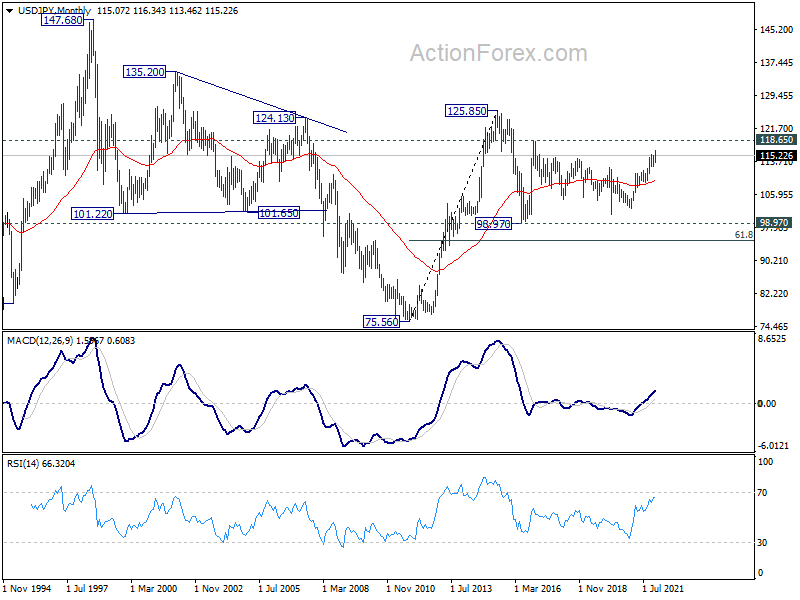
In the long term picture, the rise from 75.56 (2011 low) long term bottom to 125.85 (2015 high) is viewed as an impulsive move, no change in this view. Price actions from 125.85 are seen as a corrective pattern which could still extend. In case of deeper fall, downside should be contained by 61.8% retracement of 75.56 to 125.85 at 94.77. Up trend from 75.56 is expected to resume at a later stage for above 135.20/147.68 resistance zone.
GBP/USD Weekly Outlook
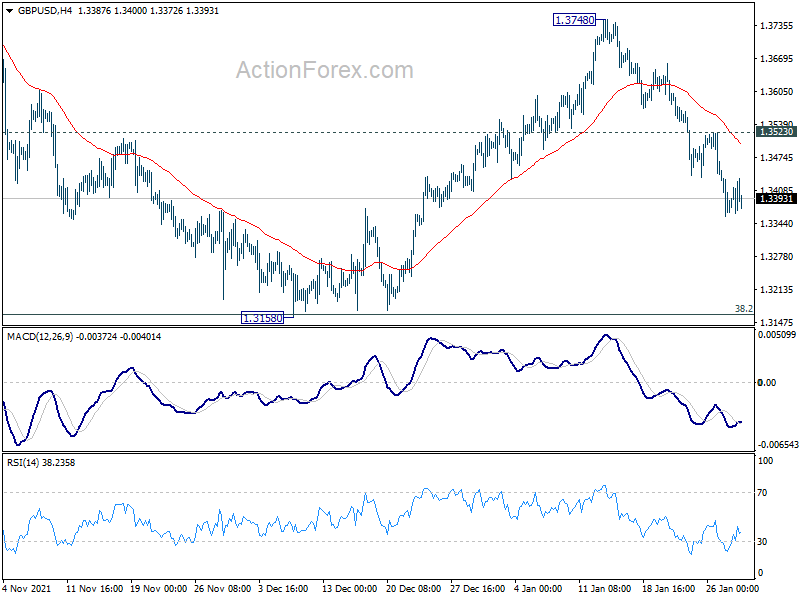
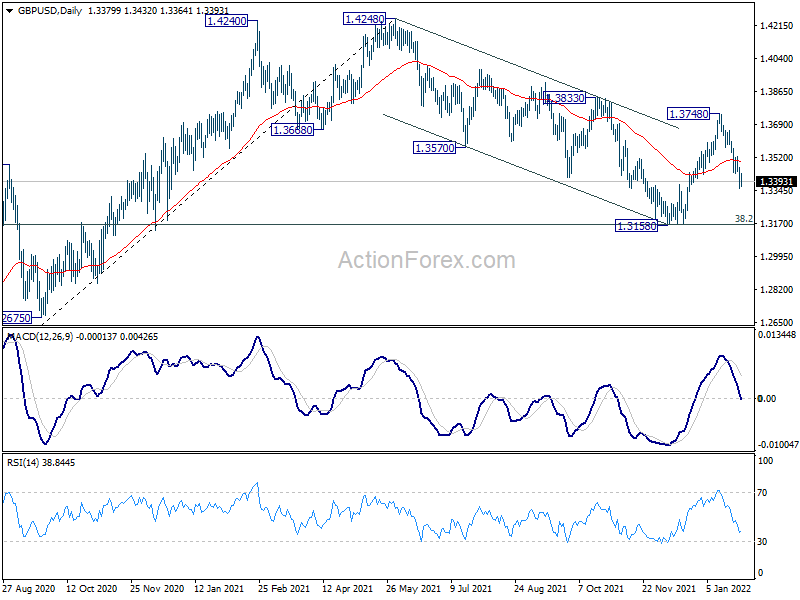
GBP/USD's deeper than expected fall last week suggests that rebound from 1.3158 has completed at 1.3748 already. More importantly, down trend from 1.4248 is not over yet. Initial bias stays on the downside this week for retesting 1.3158 low. On the upside, though, above 1.3523 minor resistance will turn bias back to the upside for retesting 1.3748.
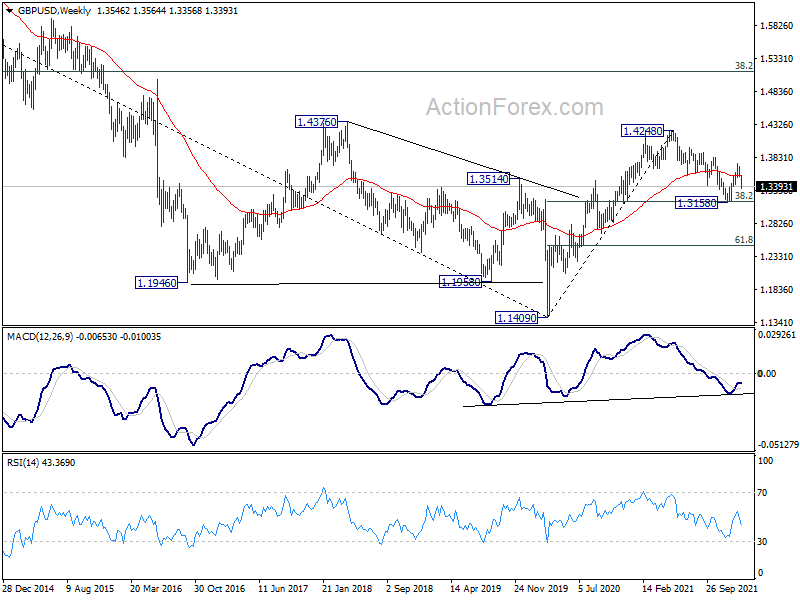
In the bigger picture, as long as 38.2% retracement of 1.1409 to 1.4248 at 1.3164 holds, up trend from 1.1409 (2020 low) is still in progress. On resumption, next target will be 38.2% retracement of 2.1161 to 1.1409 at 1.5134. Nevertheless sustained break of 1.3164 will argue that whole rise from 1.1409 has completed and bring deeper fall to 61.8% retracement at 1.2493.
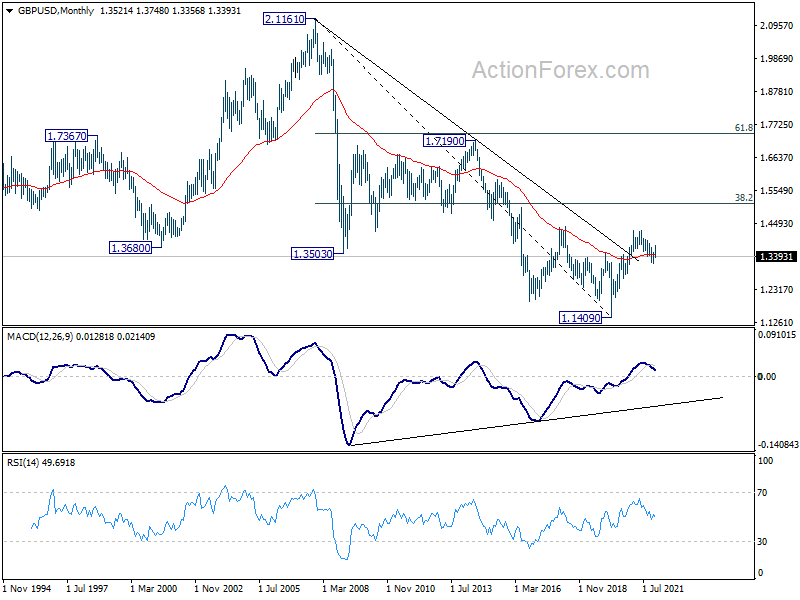
In the longer term picture, a long term bottom should be in place at 1.1409, on bullish convergence condition in monthly MACD. Rise from there would target 38.2% retracement of 2.1161 to 1.1409 at 1.5134. Reaction from there would reveal whether rise from 1.1409 is just a correction, or developing into a long term up trend.
USD/CHF Weekly Outlook
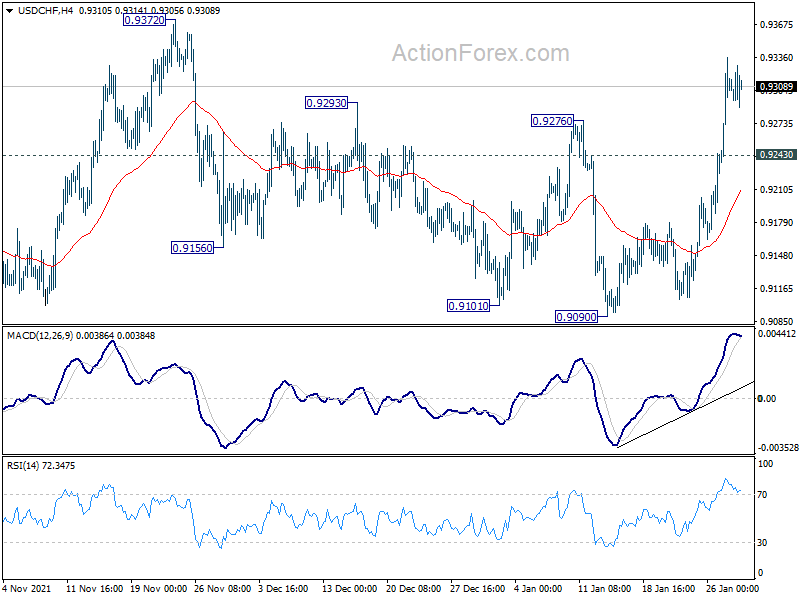
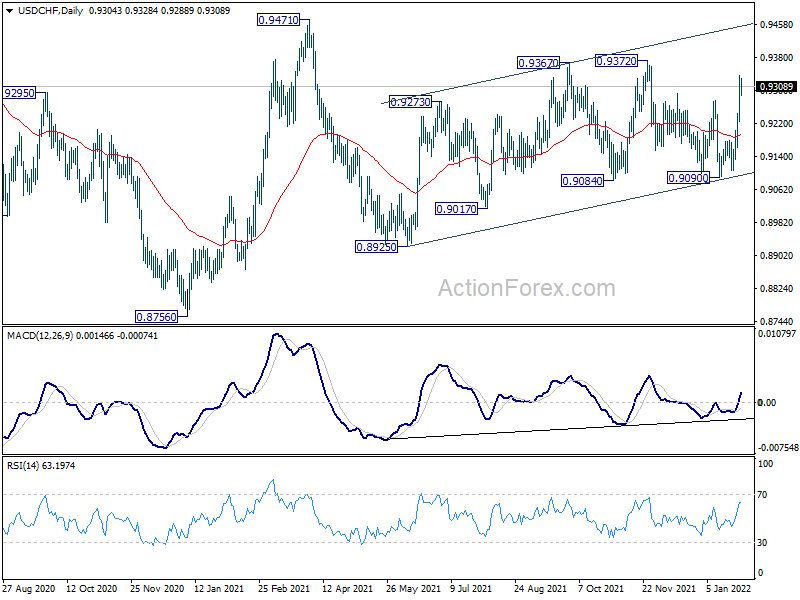
USD/CHF's break of 0.9276 resistance last week suggests that corrective fall from 0.9372 has completed at 0.9090. Initial bias remains on the upside this week for 0.9372 first. Break will resume the choppy rise from 0.8925 to 0.9471. On the downside, below 0.9243 minor support will turn intraday bias neutral first. Overall, choppy rise from 0.8925 would still extend higher as long as 0.9090 support holds, even in case of deep retreat.
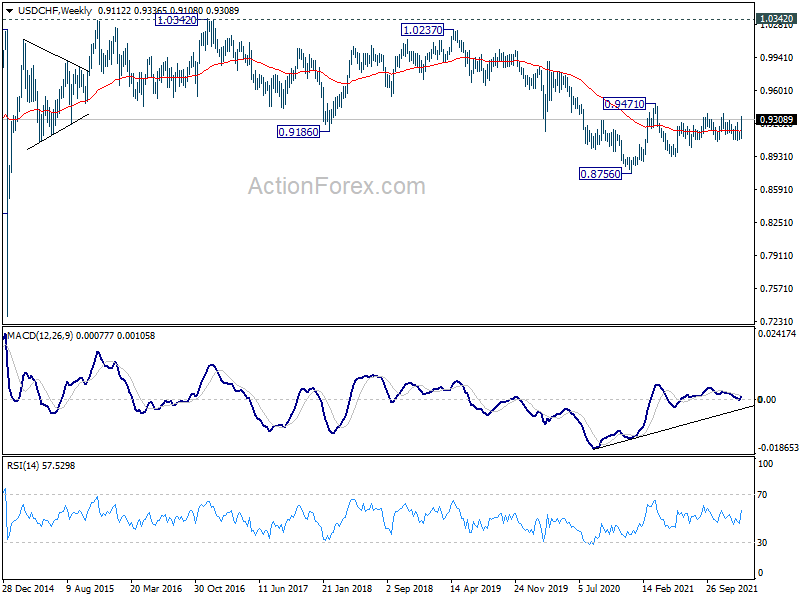
In the bigger picture, medium term outlook will be neutral at best as long as 0.9471 resistance holds. Larger down trend could still extend through 0.8756 (2021 low). However, firm break of 0.9471 will argue that the trend has already reversed and rebound the rally from 0.8756 with another impulsive move.
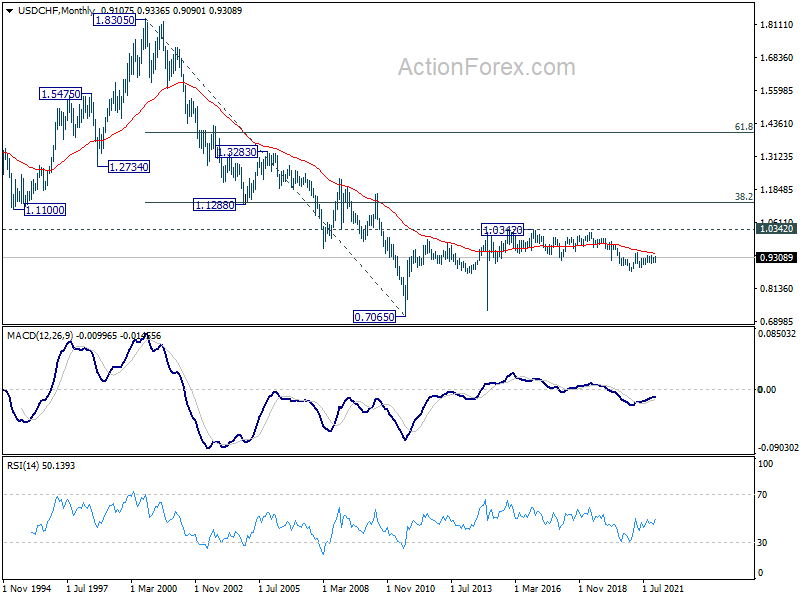
In the long term picture, price actions from 0.7065 (2011 low) are currently seen as developing into a long term corrective pattern, at least until a firm break of 1.0342 resistance.
AUD/USD Weekly Outlook
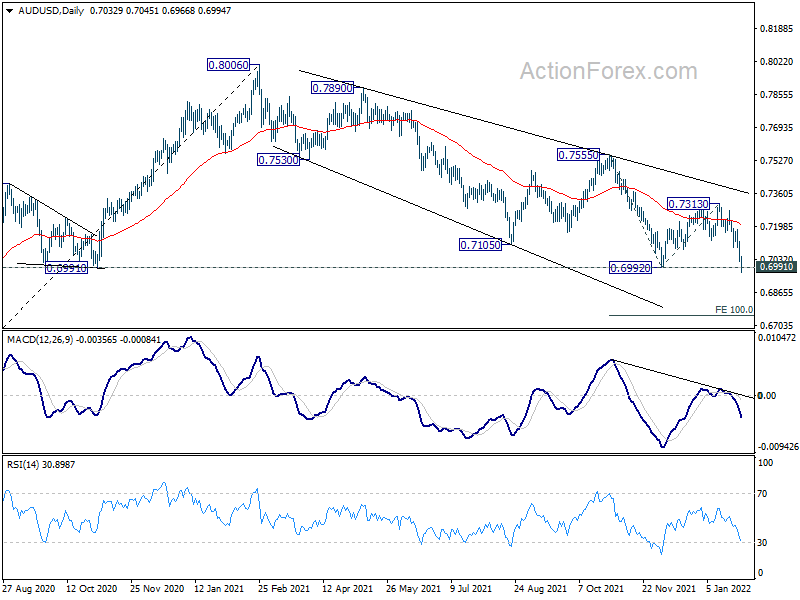
AUD/USD's break of 0.6992 support indicate resumptions of whole down trend from 0.8006. Initial bias stays on the downside this week. Next target is 100% projection of 0.7555 to 0.6992 from 0.7313 at 0.6750. On the upside, break of 0.7089 minor resistance will mix up the near term outlook and turn intraday bias neutral first.
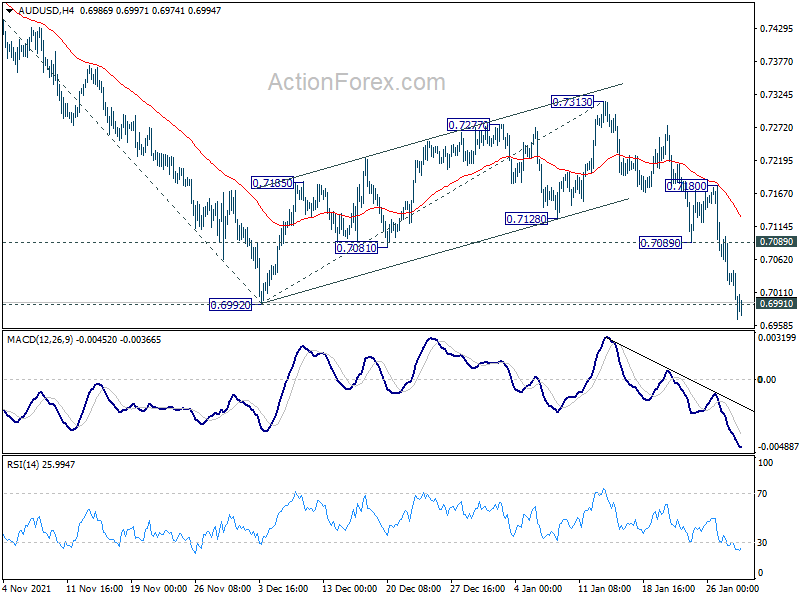
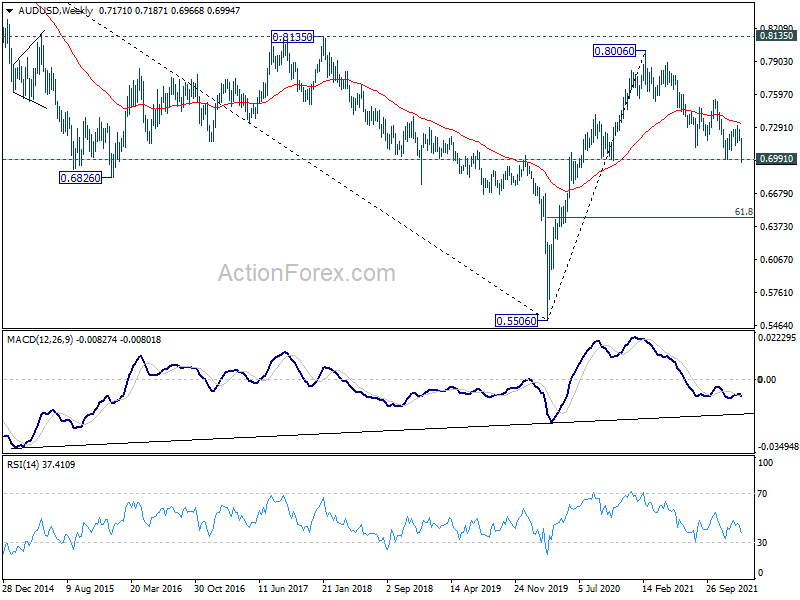
In the bigger picture, focus remains on 0.6991 key structural support. Sustained break there will argue that the whole up trend from 0.5506 might be finished at 0.8006, after rejection by 0.8135 long term resistance. Deeper decline would then be seen back to 61.8% retracement of 0.5506 to 0.8006 at 0.6461. Meanwhile, strong rebound from 0.6991 will retain medium term bullishness. That is, whole up trend from 0.5506 is still in progress.
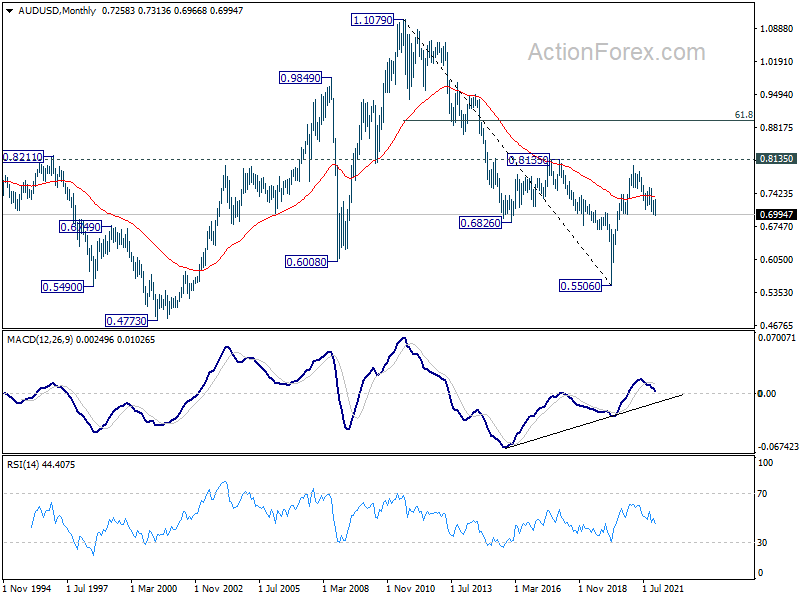
In the longer term picture, focus remains on 0.8135 structural resistance. Decisive break there will argue that rise from 0.5506 is developing into a long term up trend that reverses whole down trend from 1.1079 (2011 high). However, rejection by 0.8135 will keep long term outlook neutral at best.
USD/CAD Weekly Outlook
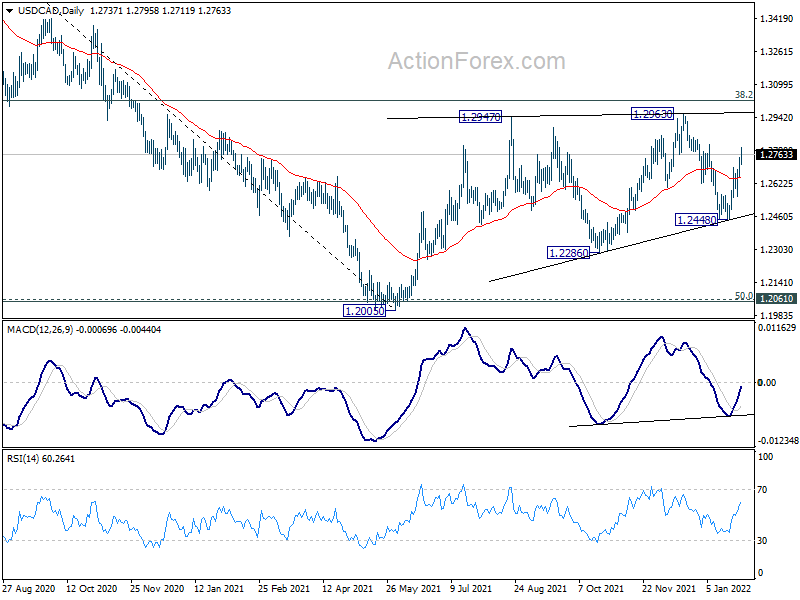
USD/CAD's rebound from 1.2448 extends higher last week. Initial bias stays on the upside this week. Break of 1.2812 will target 1.2963 resistance next. On the downside, below 1.2558 minor support will turn bias back to the downside for 1.2448 instead.
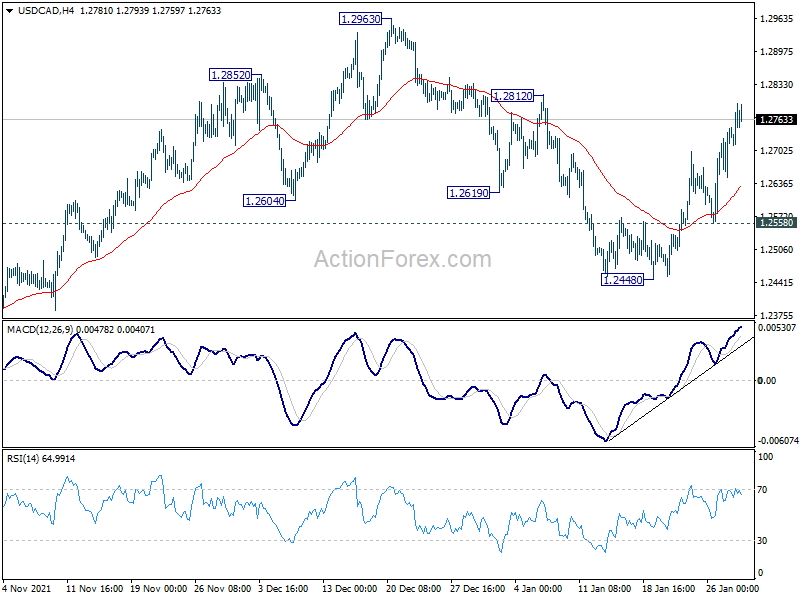
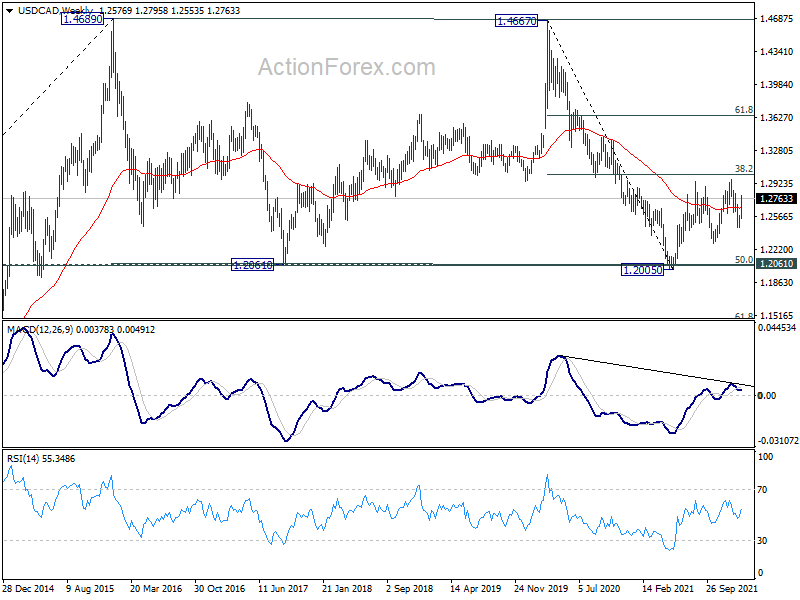
In the bigger picture, focus stays on 38.2% retracement of 1.4667 (2020 high) to 1.2005 (2021 low) at 1.3022. Sustained break there should confirm that the down trend from 1.4667 has completed after defending 1.2061 long term cluster support. Further rise would then be seen towards 61.8% retracement at 1.3650. However, rejection by 1.3022 will maintain medium term bearishness. Break of 1.2005 will resume the down trend from 1.4667 and that carries larger bearish implications too.
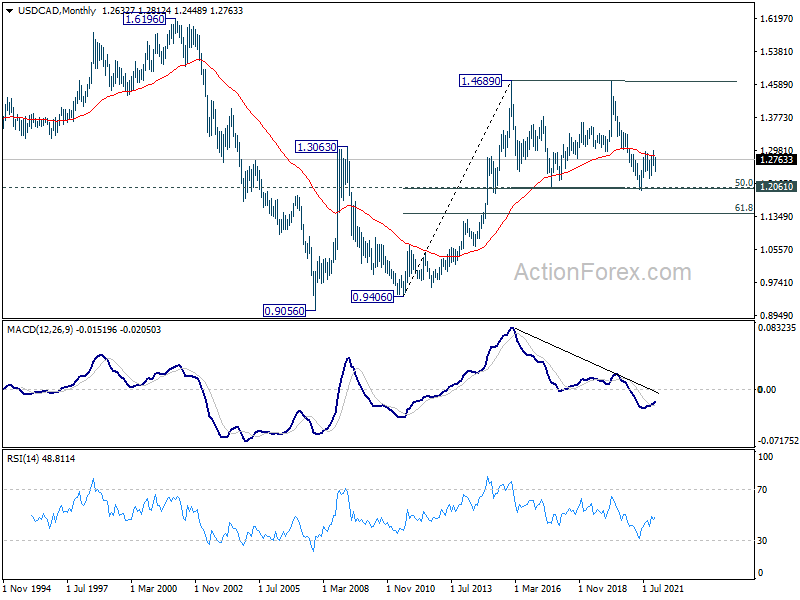
In the longer term picture, we're viewing price actions from 1.4689 as a consolidation pattern. Thus, up trend from 0.9506 (2007 low) is still expected to resume at a later stage. This will remain the favored case as long as 1.2061 support holds, which is close to 50% retracement of 0.9406 to 1.4689 at 1.2048. However, firm break of 1.2061 support will argue that USD/CAD has already started a long term down trend. Next target is 61.8% retracement of 0.9406 to 1.4689 at 1.1424.
GBP/JPY Weekly Outlook
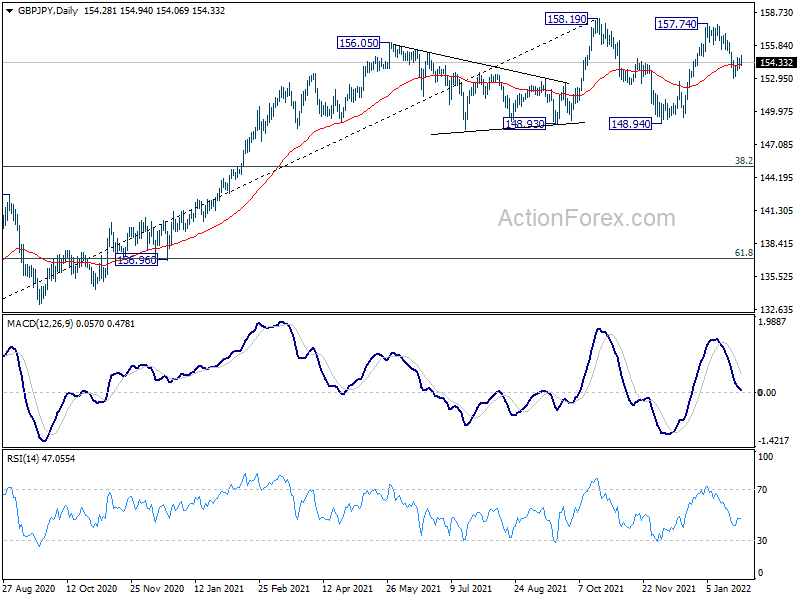
GBP/JPY recovered after dipping to 152.88 last week. Initial bias remains neutral this week first. Outlook is unchanged that fall from 157.74 should be the third leg of the corrective pattern from 158.19. Deeper decline is expected as long as 155.38 minor resistance holds. Below 152.88 will target 148.94 support next. On the upside, above 155.38 minor resistance will flip bias back to the upside for 157.74/158.19 resistance zone instead.
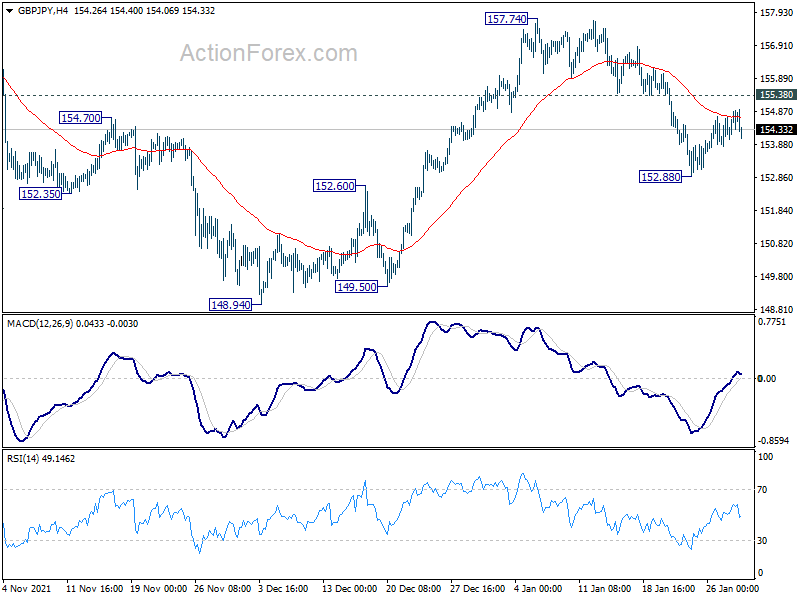
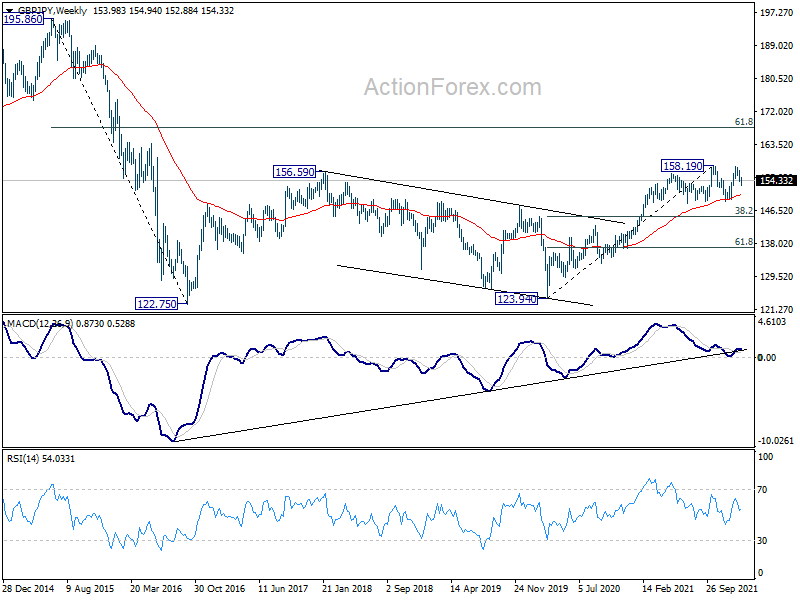
In the bigger picture, price actions from 158.19 are currently seen as developing into a consolidation pattern to up trend from 123.94 (2020 low). Downside should be contained by 123.94 to 158.19 at 145.10 to bring rebound. Firm break of 158.19 will resume the up trend to long term fibonacci level at 167.93. However, sustained break of 145.10 will raise the chance of trend reversal and target 61.8% retracement at 137.02.
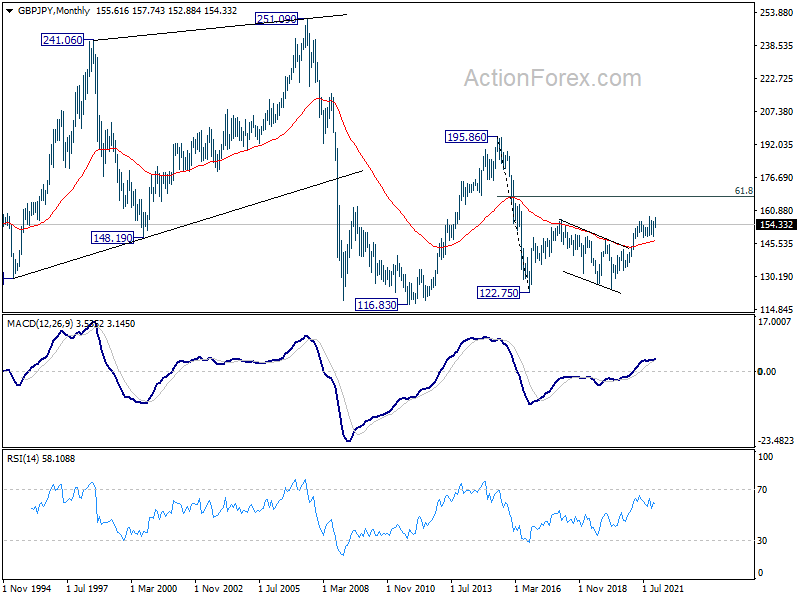
In the longer term picture, as long as 55 month EMA (now at 147.03) holds, we'd still favor more rally to 61.8% retracement of 195.86 to 122.75 at 167.93. But sustained trading below 55 month EMA will at least neutralize medium term bullishness and re-open the chance of revisiting 122.75 low (2016 low).
EUR/JPY Weekly Outlook
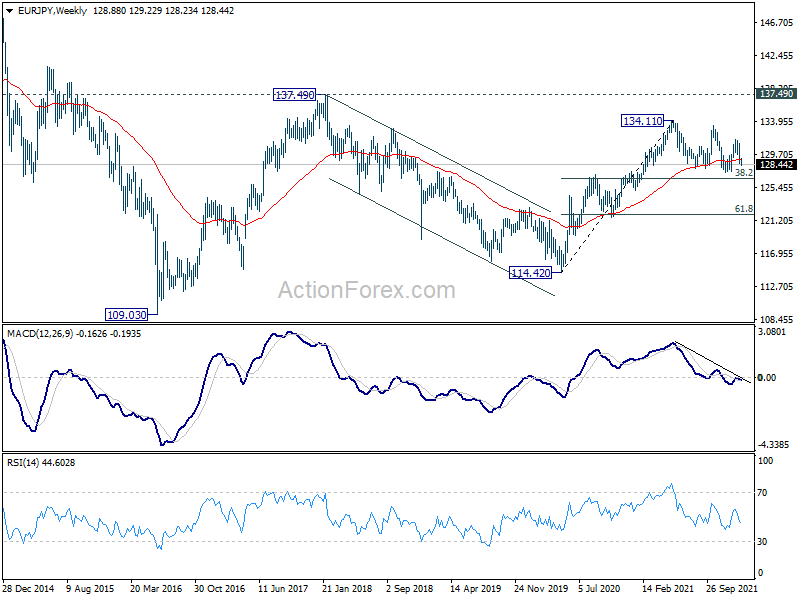
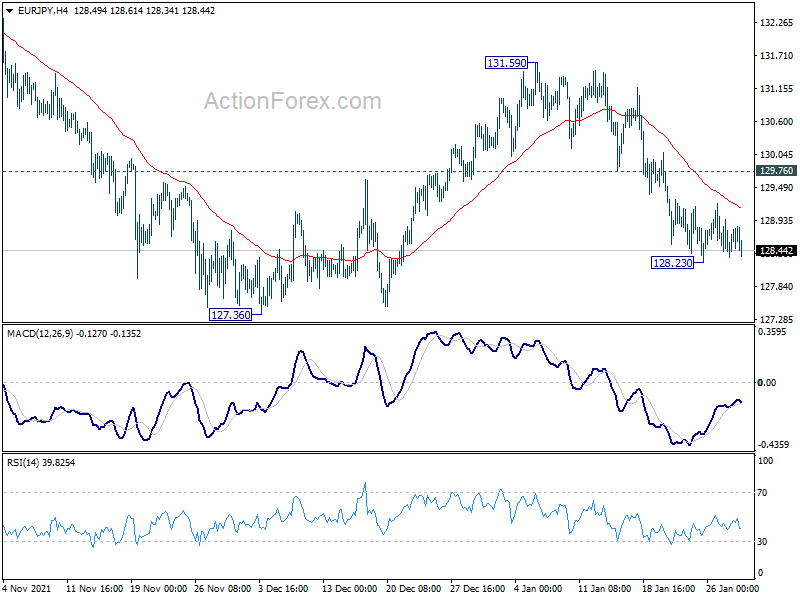
EUR/JPY turned sideway after dipping to 128.23 last week. Initial bias stays neutral this week first. But outlook is unchanged that corrective pattern from 134.11 is extending with another falling leg. Further decline is expected as long as 129.76 resistance holds. Below 128.23 will target 127.36, and possibly further to 126.58 fibonacci level. On the upside, above 129.76 minor resistance will turn bias back to the upside to 131.59 resistance instead.
In the bigger picture, price actions from 134.11 are currently seen as a consolidation pattern only. As long as 38.2% retracement of 114.42 (2020 low) to 134.11 at 126.58 holds, up trend from 114.42 is still in favor to continue. Break of 134.11 will target long term resistance at 137.49 (2018 high). However, sustained break of 126.58 will raise the chance of bearish reversal. In this case, deeper decline would be seen to 61.8% retracement at 121.94, and possibly below.
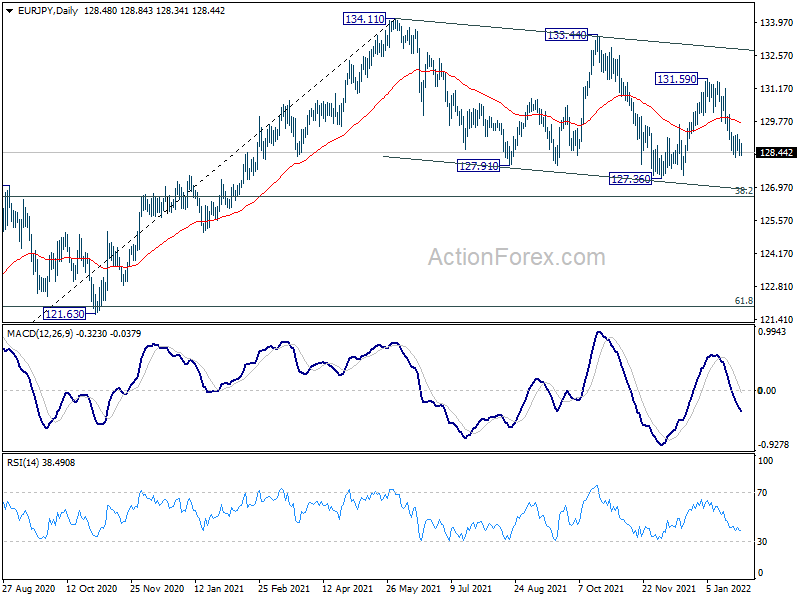
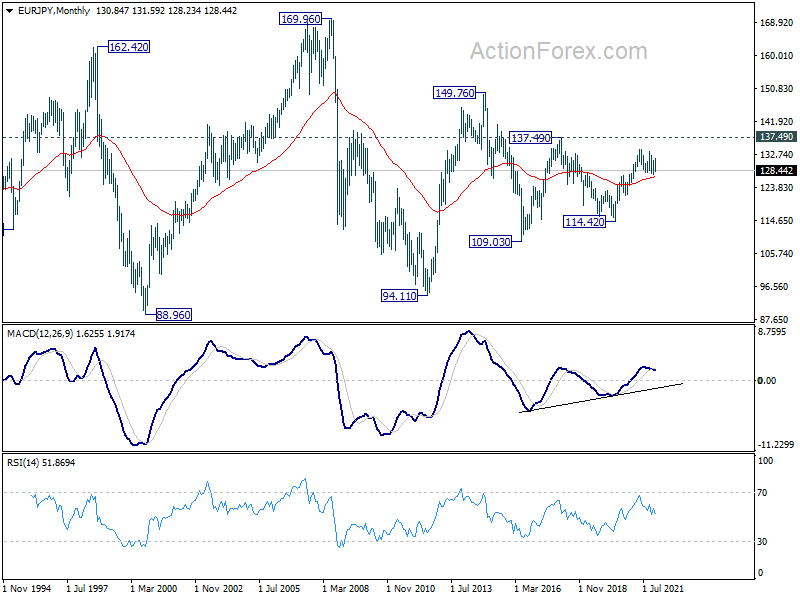
In the long term picture, EUR/JPY is staying in long term sideway pattern, established since 2000. Long term outlook will remain neutral until breakout from the range of 109.03/137.49.