

Sample Category Title
EUR/CHF Daily Outlook
Daily Pivots: (S1) 1.0363; (P) 1.0377; (R1) 1.0395; More....
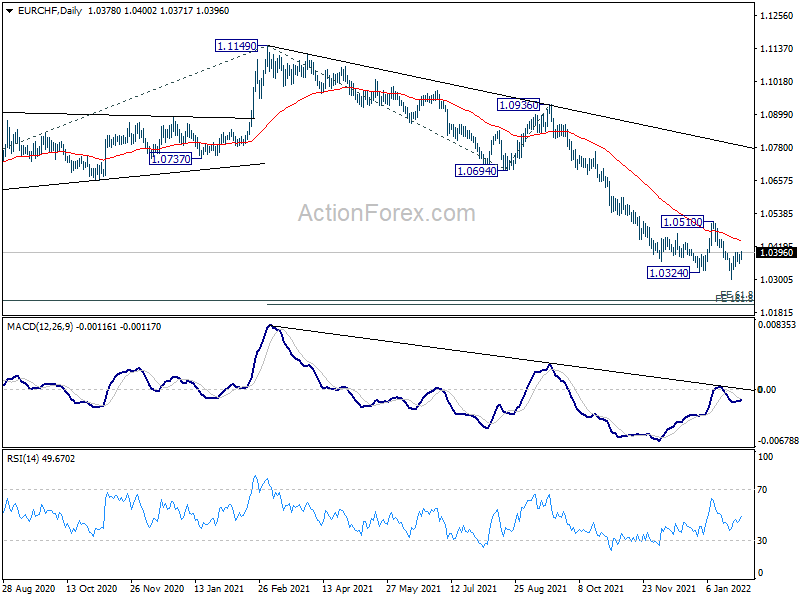
Intraday bias in EUR/CHF remains neutral as consolidation from 1.0298 is extending. While stronger recovery cannot be ruled out, upside should be limited well below 1.0510 resistance. On the downside, break of 1.0298 will extend the down trend from 1.1149 to 161.8% projection of 1.1149 to 1.0694 from 1.0936 at 1.0200 next.
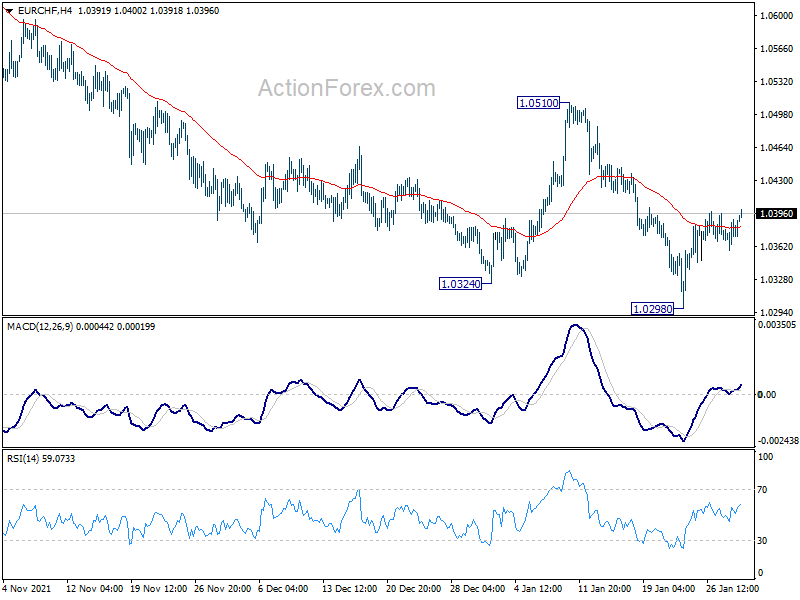
In the bigger picture, long term down trend from 1.2004 (2018 high) is still in progress. Next target is 61.8% projection of 1.2004 to 1.0505 to 1.1149 at 1.0223. On the upside, firm break of 1.0505 support turned resistance is needed to be the first sign of medium term bottoming. Otherwise, outlook will remain bearish even in case of rebound.
EUR/AUD Daily Outlook
Daily Pivots: (S1) 1.5848; (P) 1.5914; (R1) 1.6000; More...
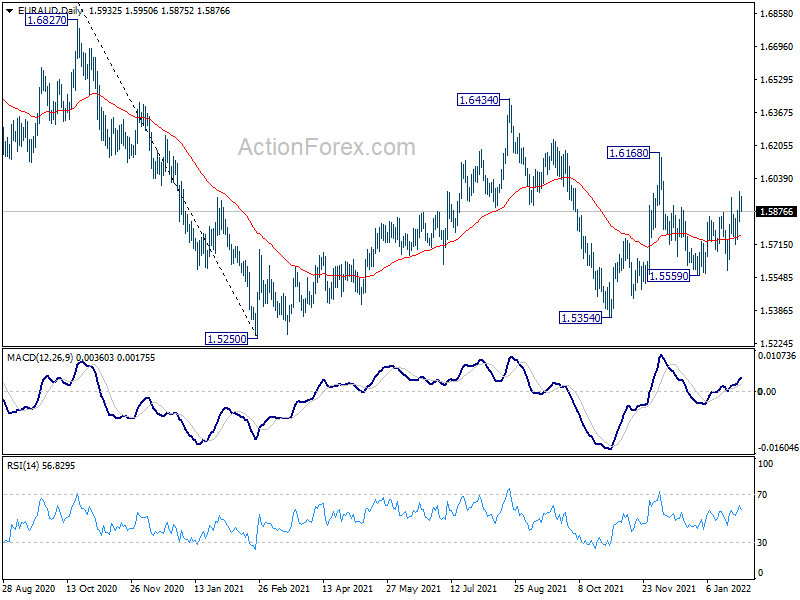
Further rise is mildly in favor in EUR/AUD as rebound from 1.5559 is in progress for 1.6168 resistance. Break there will resume the rise from 1.5354 to 1.6434 resistance. On the downside, though, break of 1.5712 support will turn bias back to the downside for 1.5559 support instead.
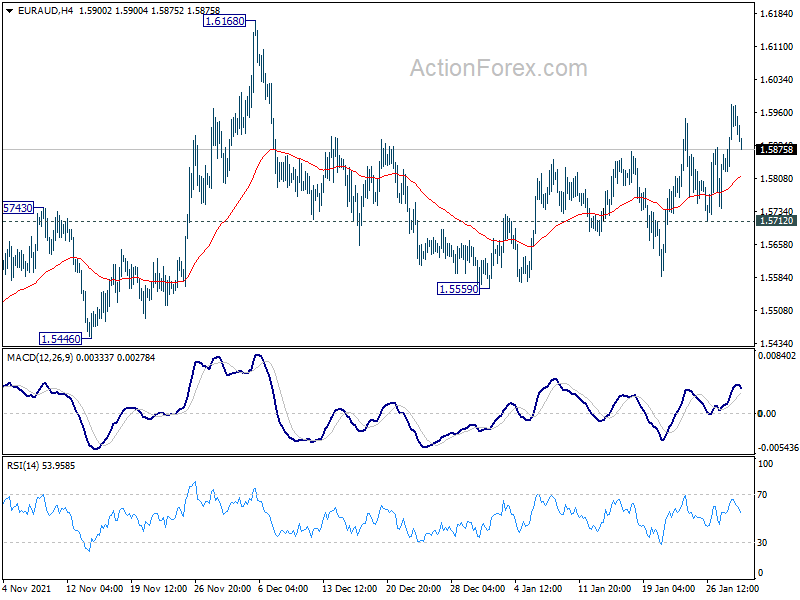
In the bigger picture, rise from 1.5354 is seen as the third leg of the corrective pattern from 1.5250 low. Further rise cannot be ruled out, but even in that case, strong resistance should be seen at 38.2% retracement of 1.9799 to 1.5250 at 1.6988. Larger down trend from 1.9799 is in favor to extend through 1.5250 at a later stage.
Research Euro Area – French Presidential Election: Macron Encore?
On 10 April 2022, the first round of the French presidential election will be held, with the potential final run-off scheduled for 24 April. The election is expected to be a tight race between incumbent President Emmanuel Macron and either Valérie Pécresse from Les Républicains or Marine Le Pen from Rassemblement National, who are currently leading the polls for the first round.
In contrast to 2017, EU-exit discussions are absent in the election campaign, although the political landscape remains skewed to the right. Our base case (60% probability) is for Macron to secure another term as President, but with the risk of a slimmer parliamentary majority to implement his policies. In case of a Pécresse presidency (35% probability) economic policies would probably not change dramatically in our view, while fiscal consolidation efforts could become more prominent. A Le Pen presidency (5% probability) would likely entail a more domestically focused France, with heightened uncertainty on economic and fiscal policies.
The election outcome will also have important implications for Europe. With the departure of Angela Merkel form the political scene and Italy's government on shaky foundations, a new European leadership vacuum could open up if President Macron fails in his re-election bid. While France has weathered the economic fallout from the COVID-19 pandemic better than other euro area peers, fiscal fragilities could also come back to haunt.
As the surprise potential at French elections remains high, we see scope for higher election risk premium to be priced in fixed income markets. The election impact on EUR/USD should be muted in our view, but EU fiscal rules reform will be key to follow.
EUR/GBP Daily Outlook
Daily Pivots: (S1) 0.8307; (P) 0.8321; (R1) 0.8335; More...
Intraday bias sin EUR/GBP remains mildly on the downside at this point. Break of 0.8304 will resume larger down trend to 0.8276 key long term support. On the upside, above 0.8366 minor resistance will turn bias back to the upside for 0.8421 resistance first. Break there will bring stronger rally back to 0.8598 resistance.
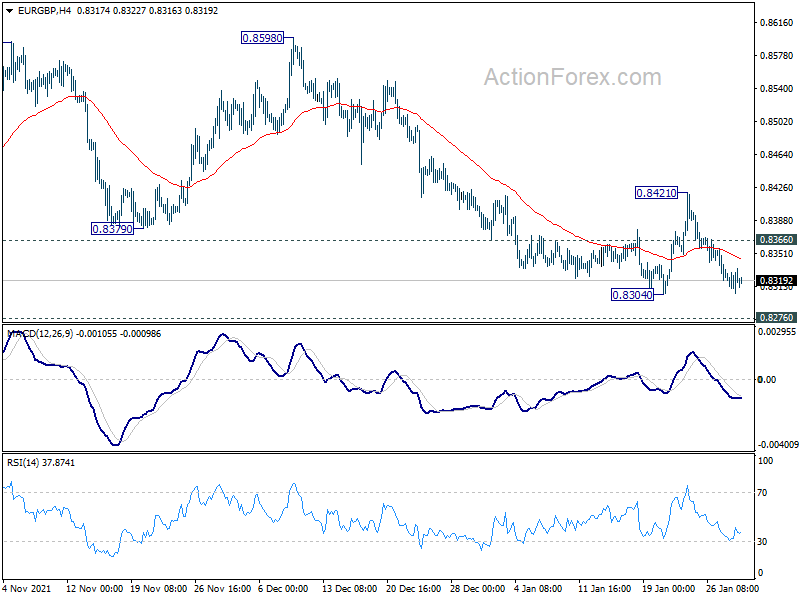
In the bigger picture, price actions from 0.9499 (2020 high) are still seen as developing into a corrective pattern. Deeper fall could be seen as long as 0.8598 resistance holds, towards long term support at 0.8276. We'd look for bottoming signal around there to bring reversal. Meanwhile, firm break of 0.8598 will now be an early sign of medium term bottoming and bring stronger rebound. However, sustained break of 0.8276 will argue that the long term trend has reversed.
RBA, BoE and ECB to Meet; US ISMs and NFP Featured This Week
The markets are generally steady in Asian session. Dollar is paring some recent gains while Yen and Swiss Franc soften. Trading in Asia would likely be subdue for the next few days on Lunar New Year holidays. But volatility is anticipated in the week as a whole considering the massive amount of key events featured, including three central bank meetings as well ass heavy weight data like non-farm payrolls.
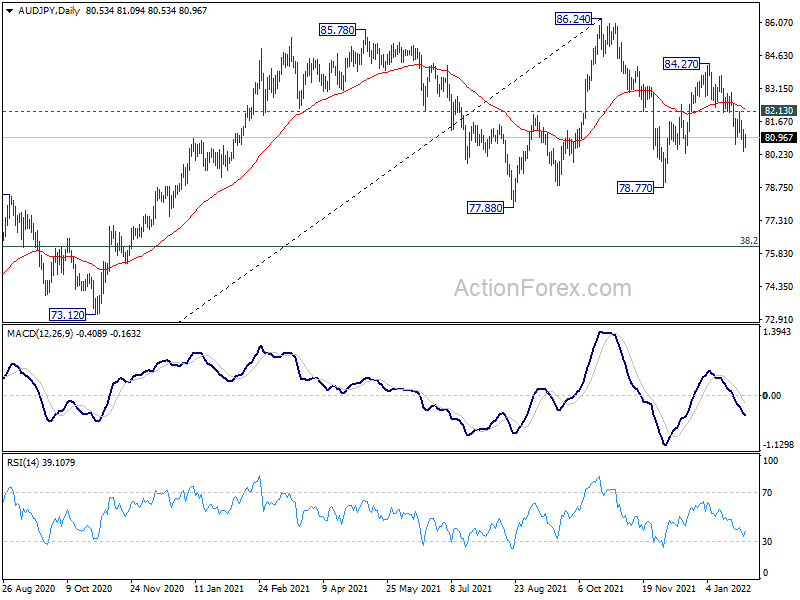
Technically, AUD/USD is now trying to defend 0.7 handle, with 0.6991 key structural support. Sustained break there will argue that recent fall from 0.8006 is more of a medium term impulsive down trend then a corrective move. Selloff in AUD/USD could also be accompanied by a corresponding move in AUD/JPY. Break of 78.77 support will complete a head and shoulder top pattern (ls: 85.78, h: 86.24, rs: 84.27) which is also medium term bearish. The development will very much depend on what RBA is going to deliver tomorrow.
In Asia, at the time of writing, Nikkei is up 1.27%. Hong Kong HSI is up 1.07%. China Shanghai SSE is down -0.97%. Singapore Strait Times is up 0.10%. Japan 10-year JGB yield is up 0.0106 at 0.179.
Fed Bostic comfortable with 50bps or if data support
Atlanta Fed President Raphael Bostic said in an FT interview that "every option is on the table" for every FOMC meeting. "If the data say that things have evolved in a way that a 50 basis point move is required or [would] be appropriate, then I'm going to lean into that . . . If moving in successive meetings makes sense, I'll be comfortable with that," he said.
"The reduction of accommodation should translate into tighter financial markets," Bostic said. "The developments that we've seen on that front are comforting in the sense that markets are still functioning the way they're supposed to, and they are responding to conditions in ways that are rational and appropriate." He also supports starting the runoff of the USD 9T balance sheet "as quickly as" possible without impairing market functioning.
"Our policy path is not a constriction path. It's a less accommodative path," he said. "If we do the three [rate hikes] that I have in mind, that'll still leave our policy in a very accommodative space. "I don't think there's going to be a lot of constraint on growth as we remove these emergency actions."
Japan industrial production dropped -1.0% mom in Dec, expected to rebound in Jan and Feb
Japan industrial production dropped -1.0% mom in December, worse than expectation of -0.8% mom. Manufacturers surveyed by the Ministry of Economy, Trade and Industry (METI) expected output to grow 5.2% in January and 2.2% in February.
Retail sales grew 1.4% yoy in December, below expectation of 2.7% yoy. That's nonetheless the third straight month of increase for sales, lifted by demand for general merchandise and food and beverages. Housing starts rose 4.2% yoy in December, versus expectation of 7.1% yoy. Consumer confidence dropped from 39.1 to 36.7, below expectation of 37.3.
China Caixin PMI manufacturing dropped to 49.1, straining under the triple pressures
China Caixin PMI Manufacturing dropped from 50.9 to 49.1 in January. That's the worst reading in 23 months. Also, the index slumped into negative territory for the fourth time since February 2020.
Wang Zhe, Senior Economist at Caixin Insight Group said: "From December to January, the resurgence of Covid-19 in several regions including Xi'an and Beijing forced local governments to tighten epidemic control measures, which restricted production, transportation and sales of manufactured goods. It became more evident that China's economy is straining under the triple pressures of contracting demand, supply shocks and weakening expectations."
RBA, BoE and ECB; US ISMs and NFP
Three central banks will meet this week. Given the surprise drop in unemployment and strong inflation data, RBA is likely to just wrap up the QE program, rather than winding it down to end in May. That would also give the central bank some flexibility to raise interest rate to combat inflation. The question is how RBA would shape market expectation on the timing of the rate hike, or leave it to the Statement on Monetary Policy to be released later in the week.
BoE is expected to deliver another hike to bring the Bank Rate to 0.50%. Back in August, the central bank indicated in will start reducing its balance sheet once the policy rate hits 0.50%. So, so sort of announcement on this topic is expected. Additionally, the Monetary Policy Report would provide guidance on the path of rate hikes ahead too.
ECB's meeting would likely be a lackluster one. No change in policy is expected. It will also reiterate that inflation is going to ease along the course of the year. President Christine Lagarde could also try to talk down the prospect of a rate hike this year.
Here are some suggested readings:
- New Forecasts in RBA SOMP to Be Consistent with Rate Hike in 2022
- RBA to End QE and Bring Forward Rate Hike Guidance: AUDUSD
- RBA Meeting: Managing Rate Hike Expectations
- U.K.: Slower Growth, Faster Inflation, Gradual Tightening
- ECB Preview – Inflation Uncertainty and Data Dependency
The data calendar is also extremely busy, with US ISMs and NFP, Eurozone GDP and unemployment rate, Canada GDP and employment, Australia retail sales, New Zealand employment featured. Here are some highlights for the week:
- Monday: Japan industrial production, retail sales, consumer confidence, housing starts; Eurozone GDP; Canada IPPI and RMPI; US Chicago PMI.
- Tuesday: Australia AiG manufacturing, retail sales, RBA rate decision; New Zealand trade balance; Japan unemployment rate, PMI manufacturing final; Germany retail sales, unemployment; Swiss retail sales, SECO consumer climate, PMI manufacturing; Eurozone PMI manufacturing final, unemployment rate; UK PMI manufacturing final; Canada GDP, PMI manufacturing; US ISM manufacturing, construction spending.
- Wednesday: New Zealand employment change, labor cost index; Japan monetary base; Eurozone CPI flash; US ADP employment; Canada building permit.
- Thursday: Australia AiG construction; Australia building approvals, NAB business confidence, trade balance; Eurozone PMI services final, ECB rate decision; UK PMI manufacturing final, BoE rate decision; US jobless claims, non-farm productivity, ISM services, factory orders.
- Friday: RBA monetary policy statement; Germany factory orders; France industrial production; UK PMI construction; Eurozone retail sales; Canada employment, Ivey PMI; US non-farm payroll employment.
EUR/GBP Daily Outlook
Daily Pivots: (S1) 0.8307; (P) 0.8321; (R1) 0.8335; More...
Intraday bias sin EUR/GBP remains mildly on the downside at this point. Break of 0.8304 will resume larger down trend to 0.8276 key long term support. On the upside, above 0.8366 minor resistance will turn bias back to the upside for 0.8421 resistance first. Break there will bring stronger rally back to 0.8598 resistance.
In the bigger picture, price actions from 0.9499 (2020 high) are still seen as developing into a corrective pattern. Deeper fall could be seen as long as 0.8598 resistance holds, towards long term support at 0.8276. We'd look for bottoming signal around there to bring reversal. Meanwhile, firm break of 0.8598 will now be an early sign of medium term bottoming and bring stronger rebound. However, sustained break of 0.8276 will argue that the long term trend has reversed.
Economic Indicators Update
| GMT | Ccy | Events | Actual | Forecast | Previous | Revised |
|---|---|---|---|---|---|---|
| 23:50 | JPY | Industrial Production M/M Dec P | -1.00% | -0.80% | 7.00% | |
| 23:50 | JPY | Retail Trade Y/Y Dec | 1.40% | 2.70% | 1.90% | |
| 00:30 | AUD | Private Sector Credit M/M Dec | 0.80% | 0.70% | 0.90% | 1.00% |
| 05:00 | JPY | Housing Starts Y/Y Dec | 4.20% | 7.10% | 3.70% | |
| 05:00 | JPY | Consumer Confidence Index Jan | 36.7 | 37.3 | 39.1 | |
| 09:00 | EUR | Italy GDP Q/Q Q4 P | 0.50% | 2.60% | ||
| 10:00 | EUR | Eurozone GDP Q/Q Q4 P | 0.40% | 2.20% | ||
| 13:00 | EUR | Germany CPI M/M Jan P | -0.30% | 0.50% | ||
| 13:00 | EUR | Germany CPI Y/Y Jan P | 4.30% | 5.30% | ||
| 13:30 | CAD | Industrial Product Price M/M Dec | 0.80% | 0.80% | ||
| 13:30 | CAD | Raw Material Price Index Dec | 0.60% | -1.00% | ||
| 14:45 | USD | Chicago PMI Jan | 62.5 | 63.1 |
Technical Outlook and Review
DXY:
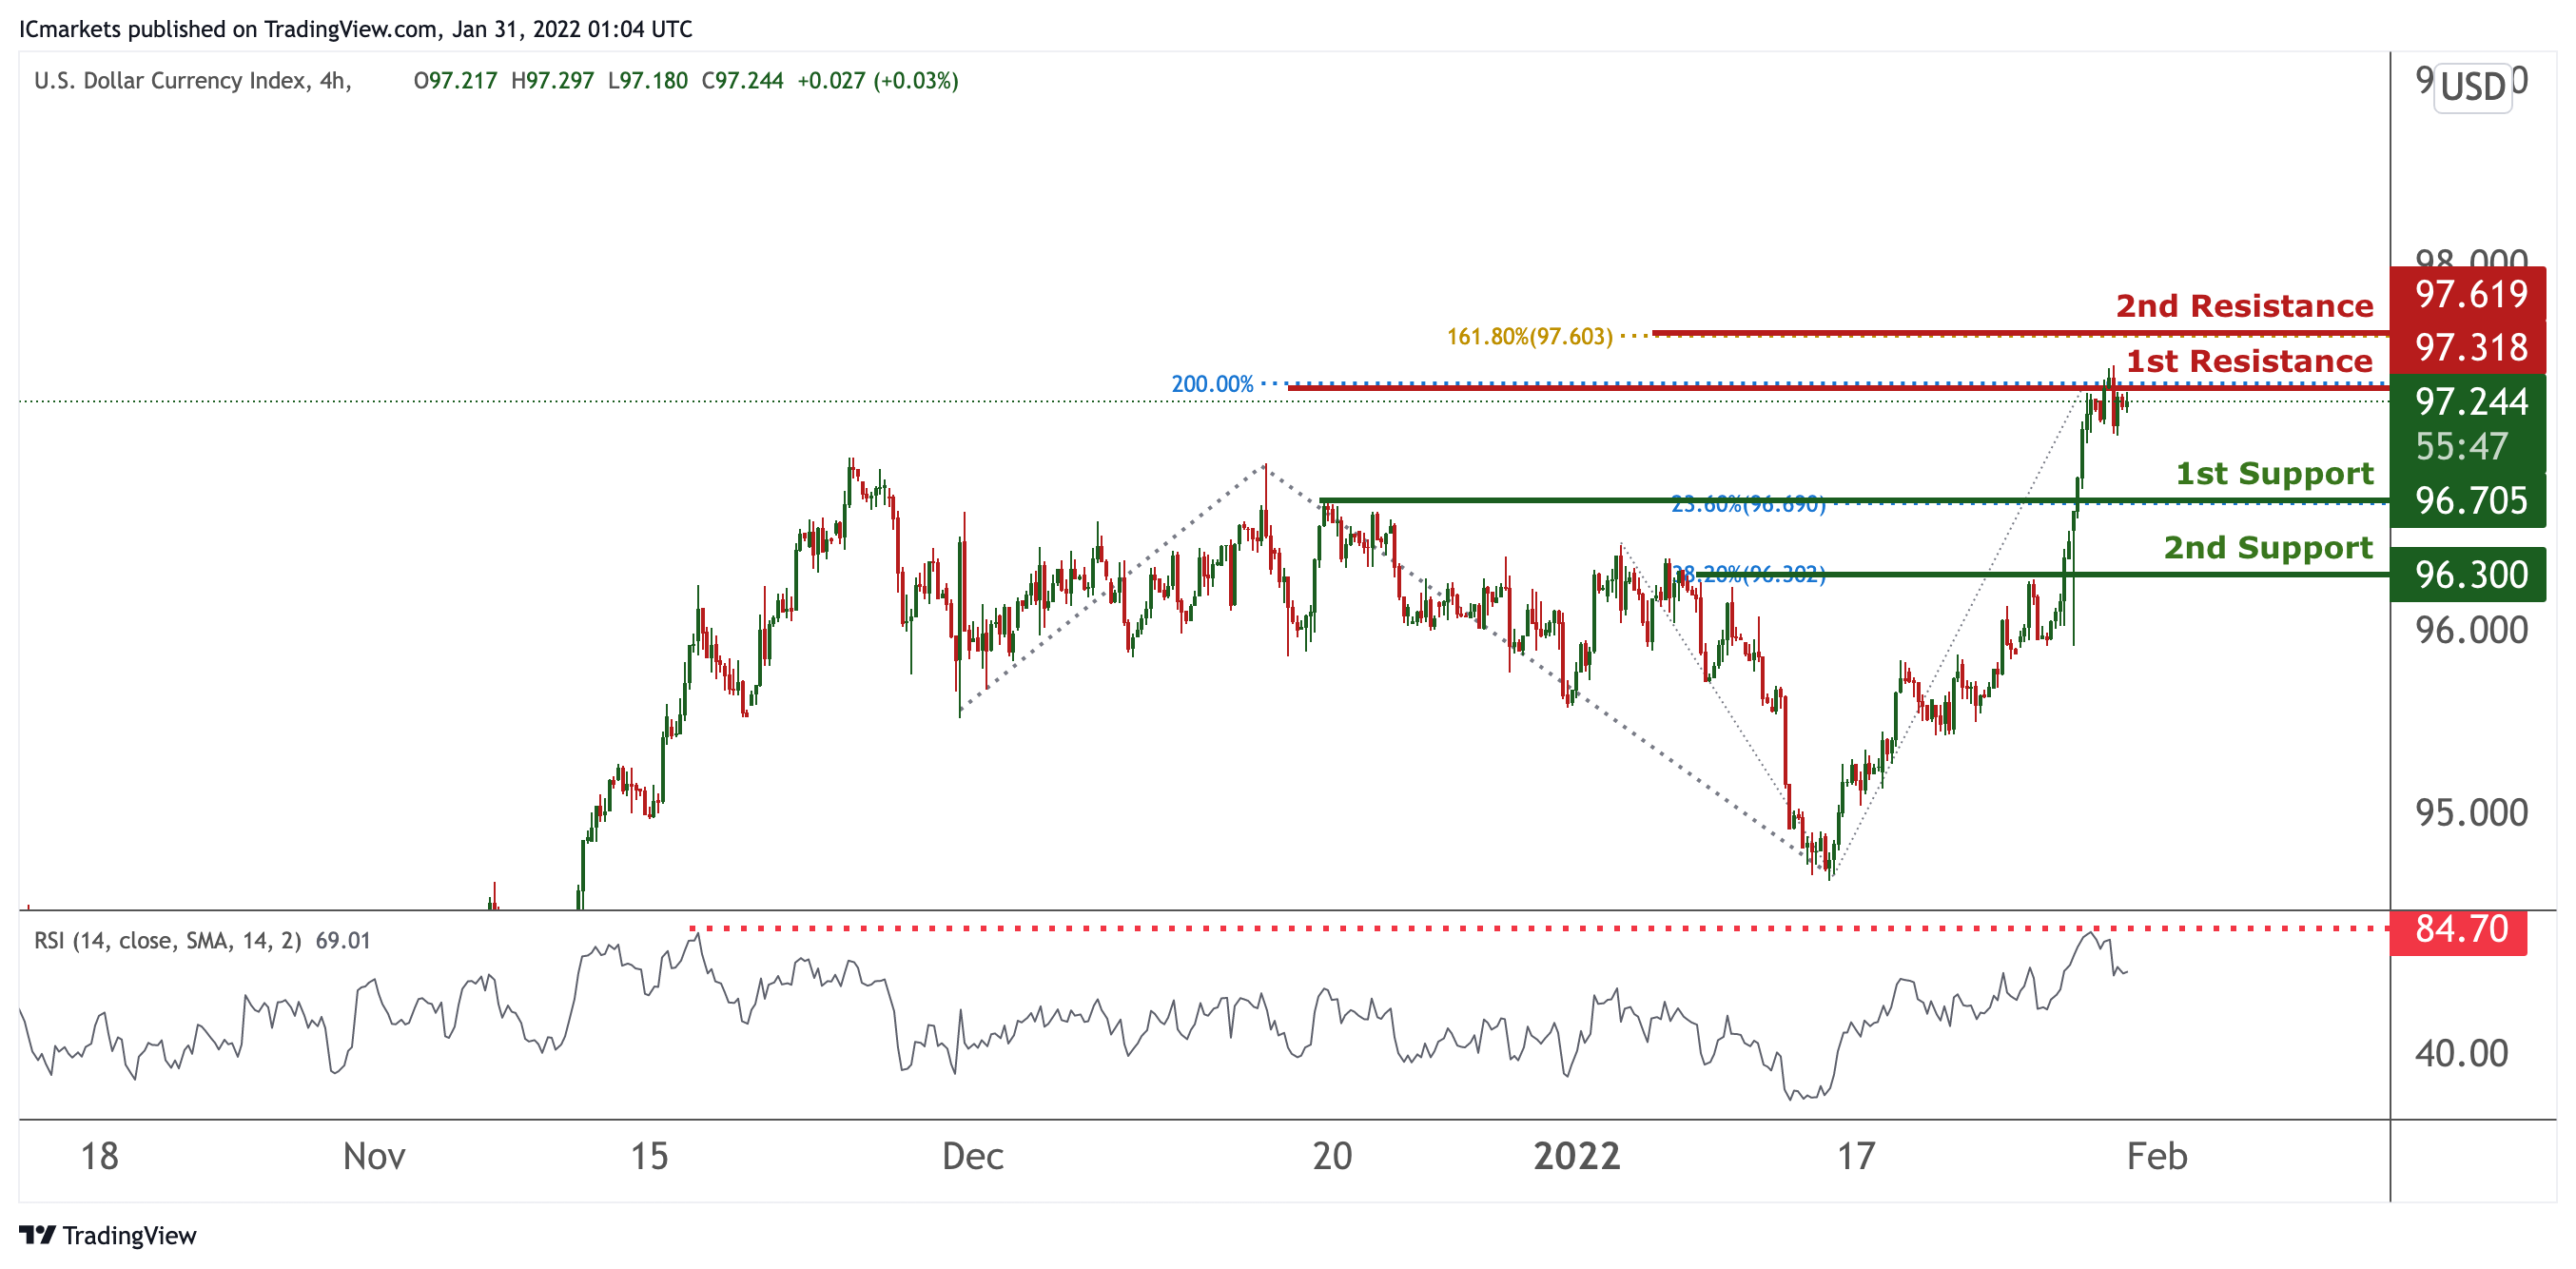
On the H4 timeframe, prices are on bullish momentum and have reached an all time high. We would expect potentially a dip from our 1st resistance at 97.319 in line with 200% Fibonacci projection towards our 1st support at 96.705 in line with 23.6% Fibonacci retracement. RSI are at oversold extremes, further supporting our bearish bias.
Areas of consideration:
- H4 time frame, 1st resistance at 97.318
- H4 time frame, 1st support at 96.705
XAU/USD (GOLD):
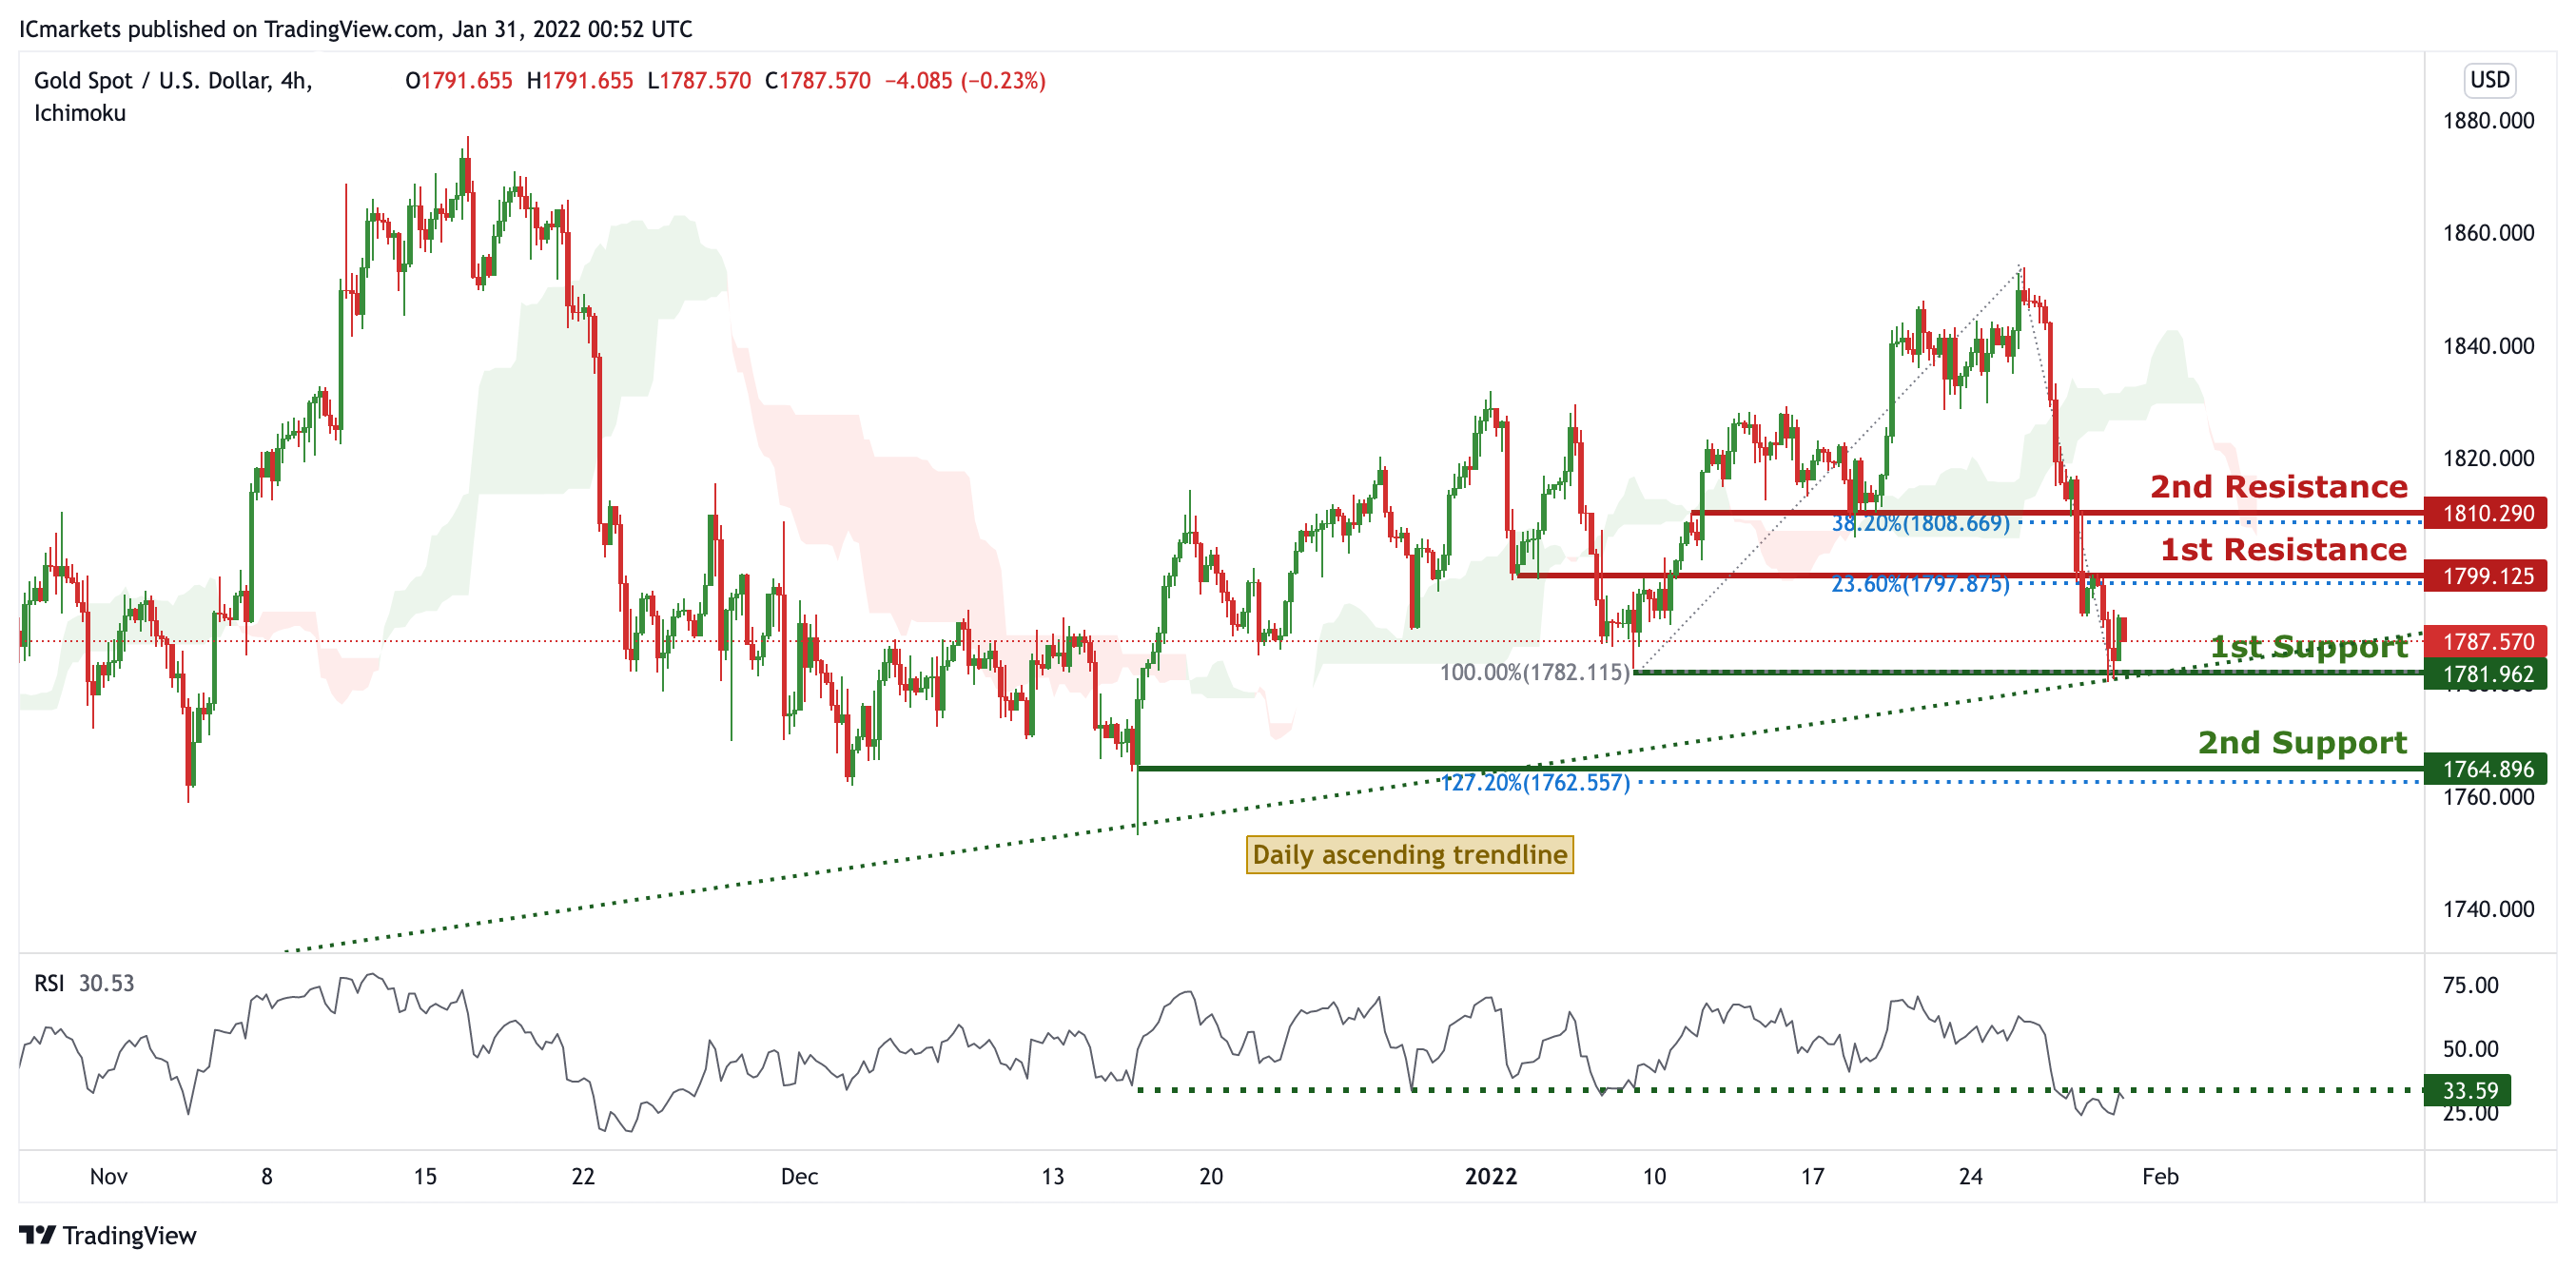
On the H4 chart, prices are on bullish momentum and are testing our daily ascending trendline. We see a potential for a bounce from our 1st support at 1781.962 in line with 100% Fibonacci retracement towards our 1st resistance at 1799.125 which is a graphical overlap. RSI are at overbought extremes, further supporting our bullish bias.
Areas of consideration:
- 4h 1st support at 1781.962
- 4h 1st resistance at 1799.125
GBP/USD
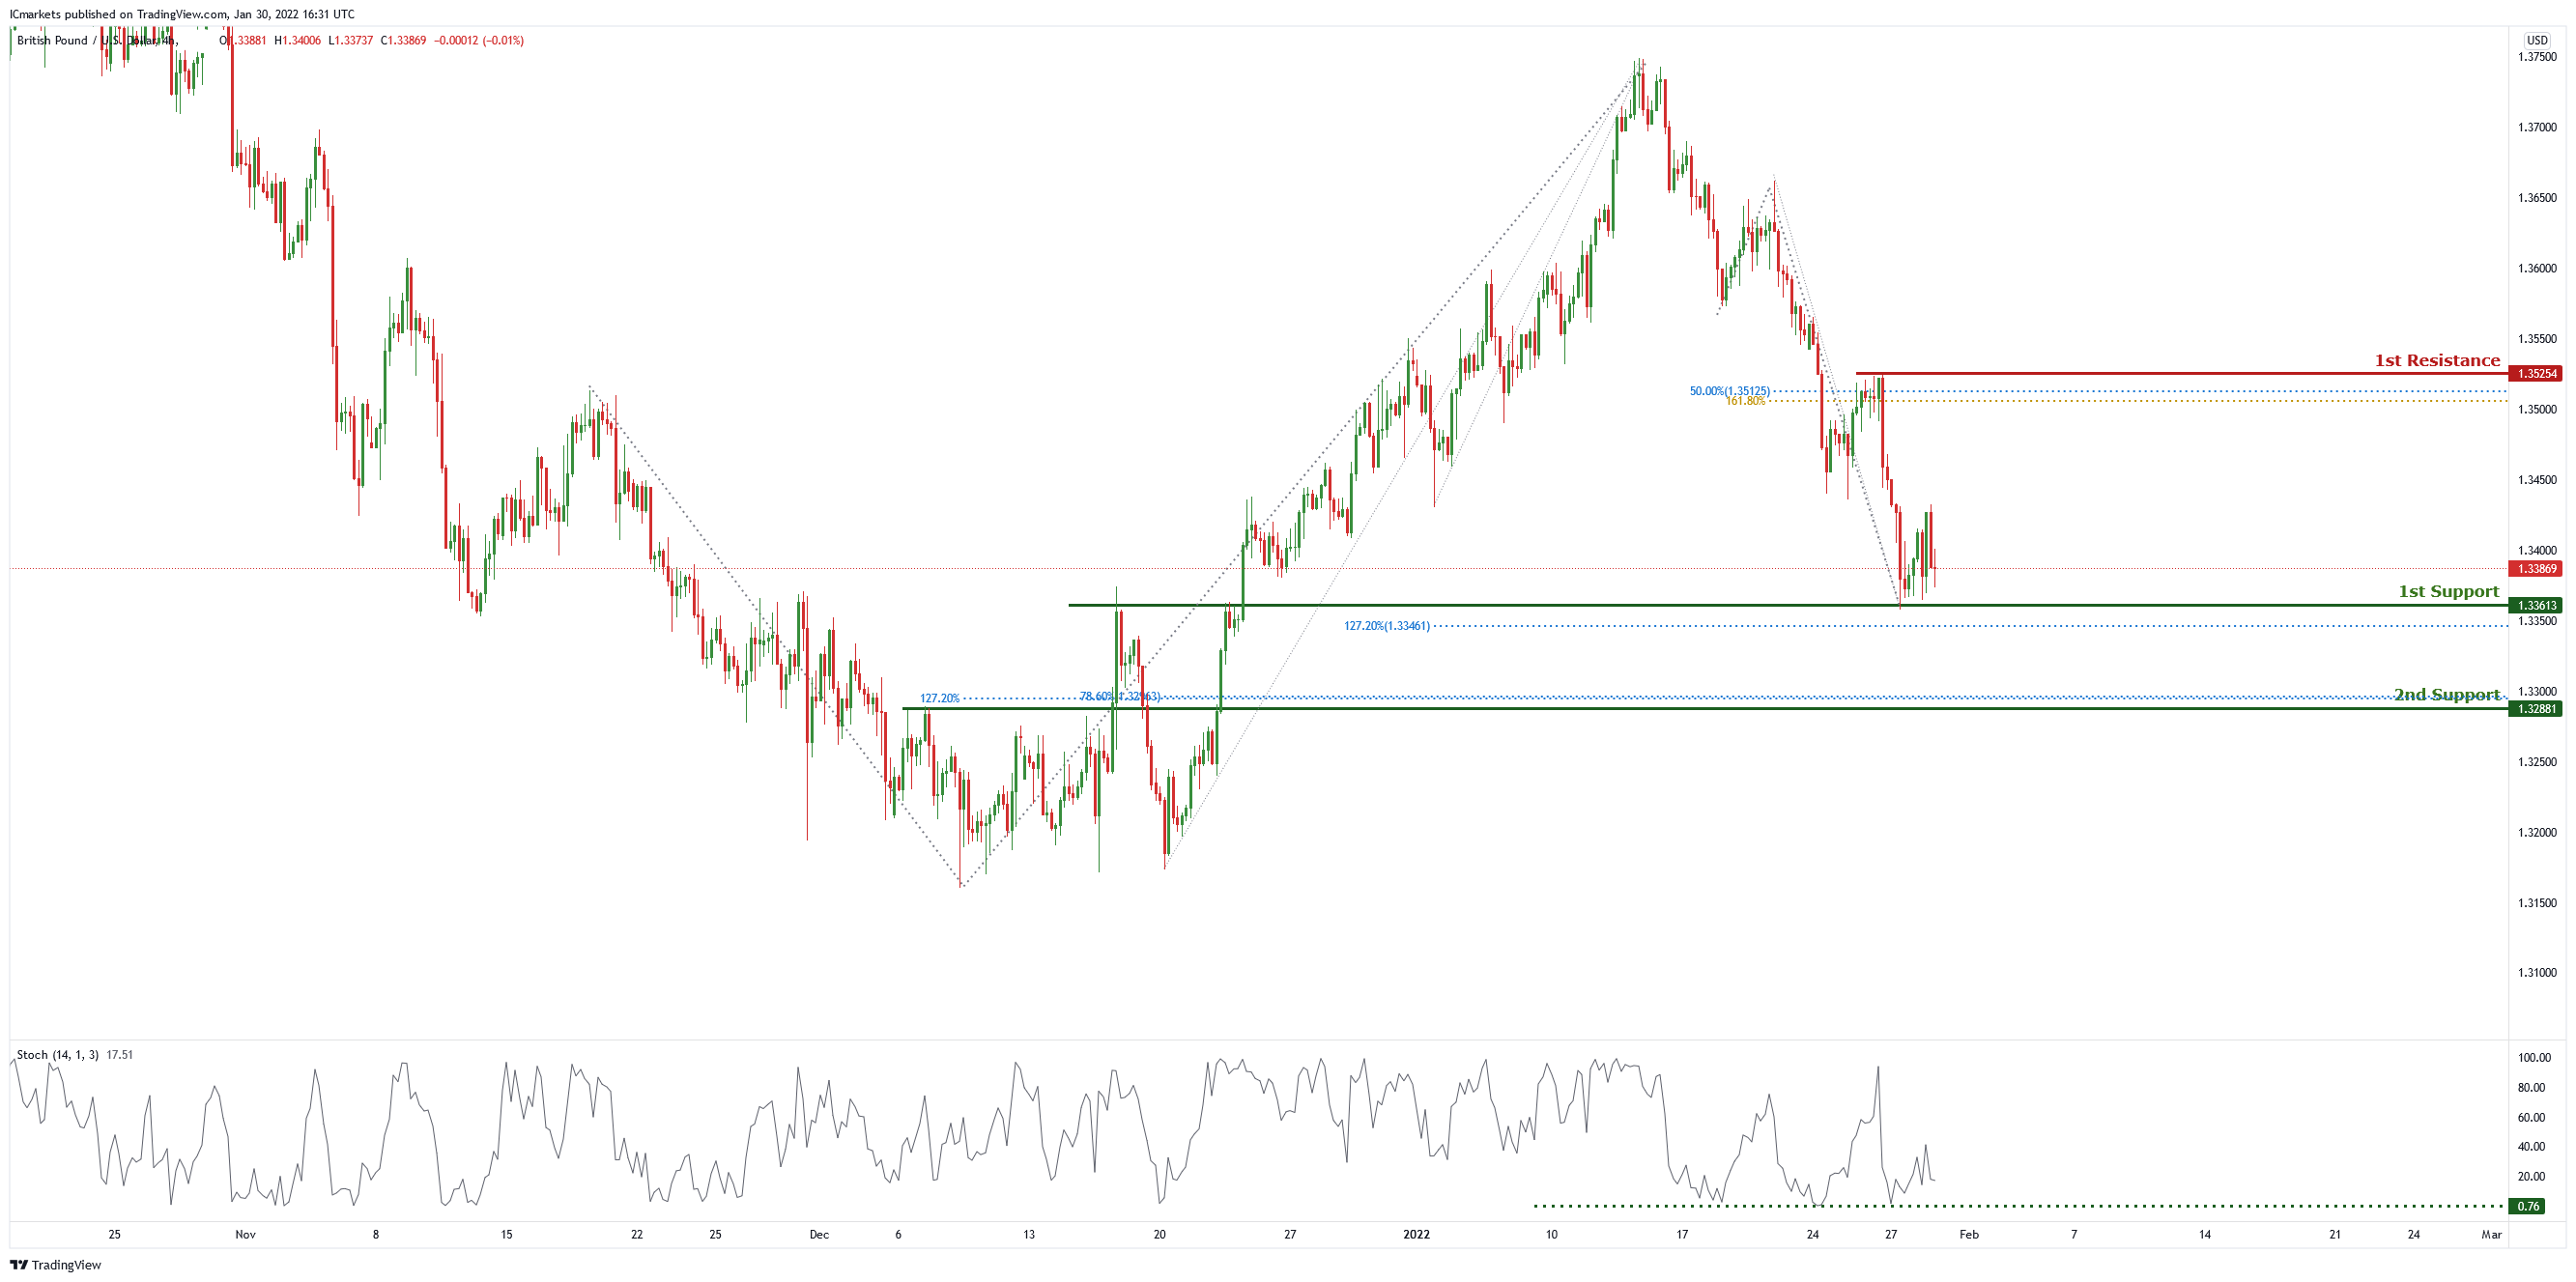
On the H4 chart price is near 1st support level of 1.33613 which is also 127.2% Fibonacci retracement. Price can potentially bounce to the 1st resistance level of 1.35254 which is also 50% Fibonacci retracement and 161.8% Fibonacci projection. Our bullish bias is supported by the stochastic indicator as it is at support level.
Areas of consideration:
- H4 1st resistance 1.35254
- H4 1st support 1.33613
USD/CHF:
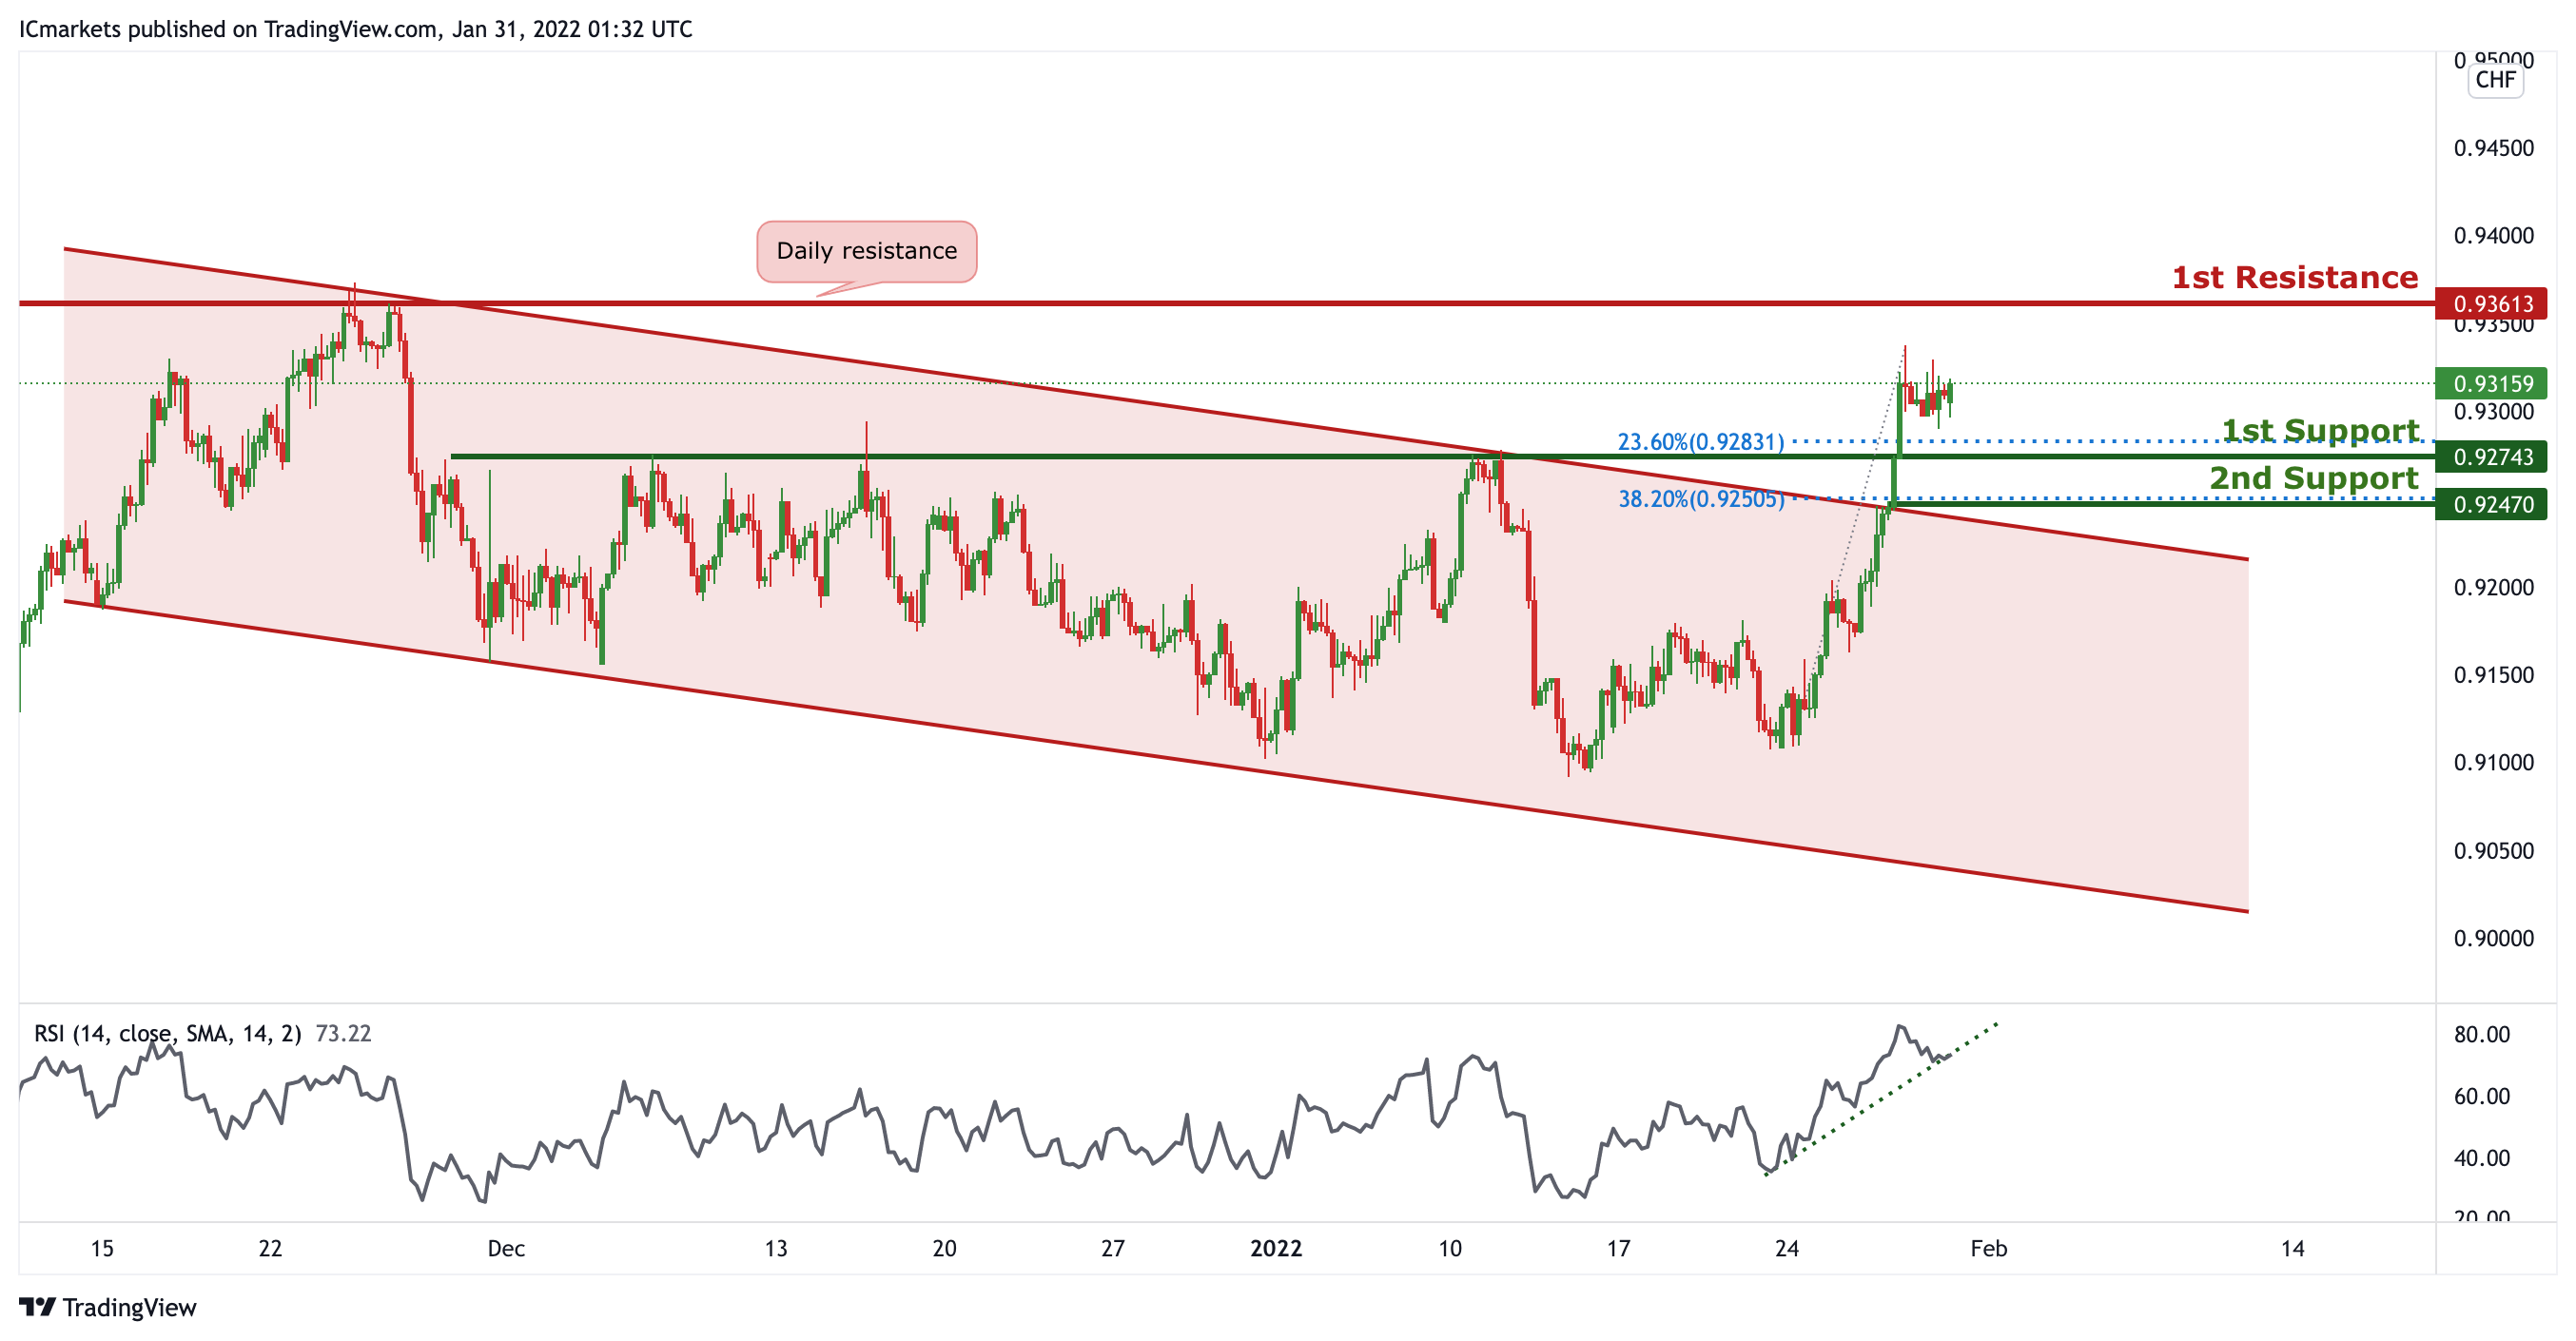
On the H4 timeframe, prices broke out of the descending channel resistance, signifying an overall bearish momentum. We can expect price to bounce at 1st Support in line with 23.6 % Fibonacci retracement towards 1st Resistance in line with daily resistance and previous swing high. Our bullish bias is further supported by the RSI indicator where it is abiding to the ascending trendline support.
Areas of consideration:
- Watch 1st Support at 0.92743
- Watch 1st Resistance at 0.93613
EUR/USD:
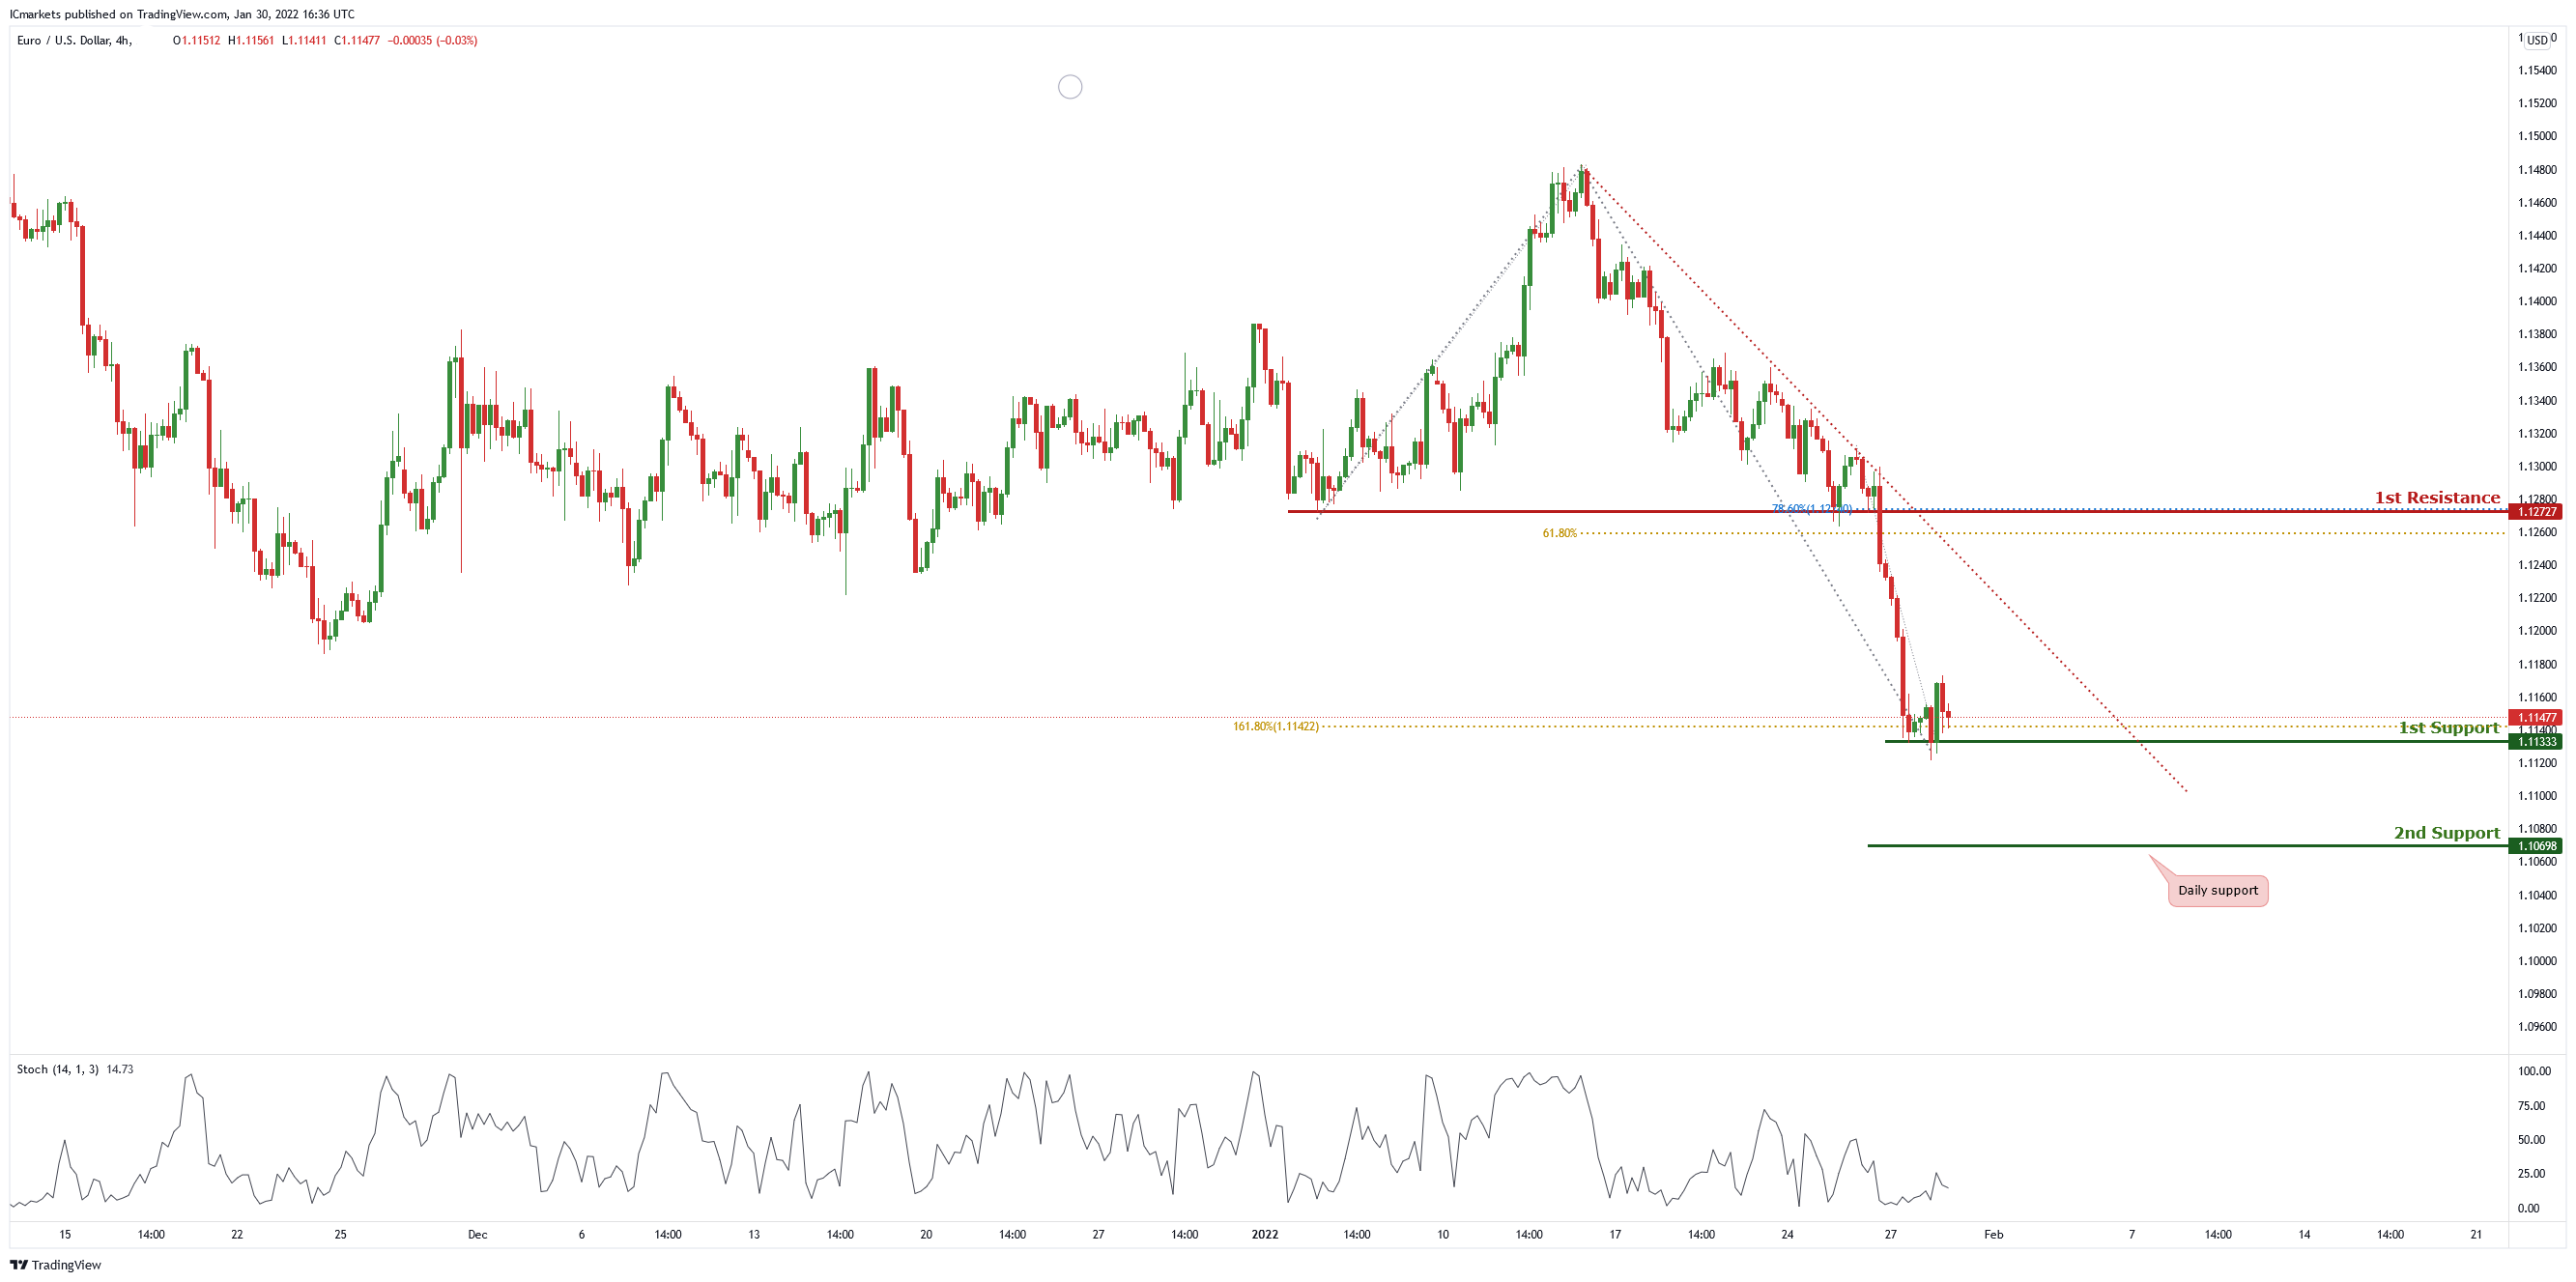
On the H4 chart, price is abiding by a descending trendline and near 1st support level of 1.11333 which is also 161.8% Fibonacci retracement. Price can potentially bounce to the 1st resistance of 1.12727 which is also 61.8% Fibonacci projection and 78.6% Fibonacci retracement. Our bullish bias is supported by the stochastic indicator as it is at support level.
Areas of consideration
- H4 1st support at 1.11333
- H4 1st resistance 1.12727
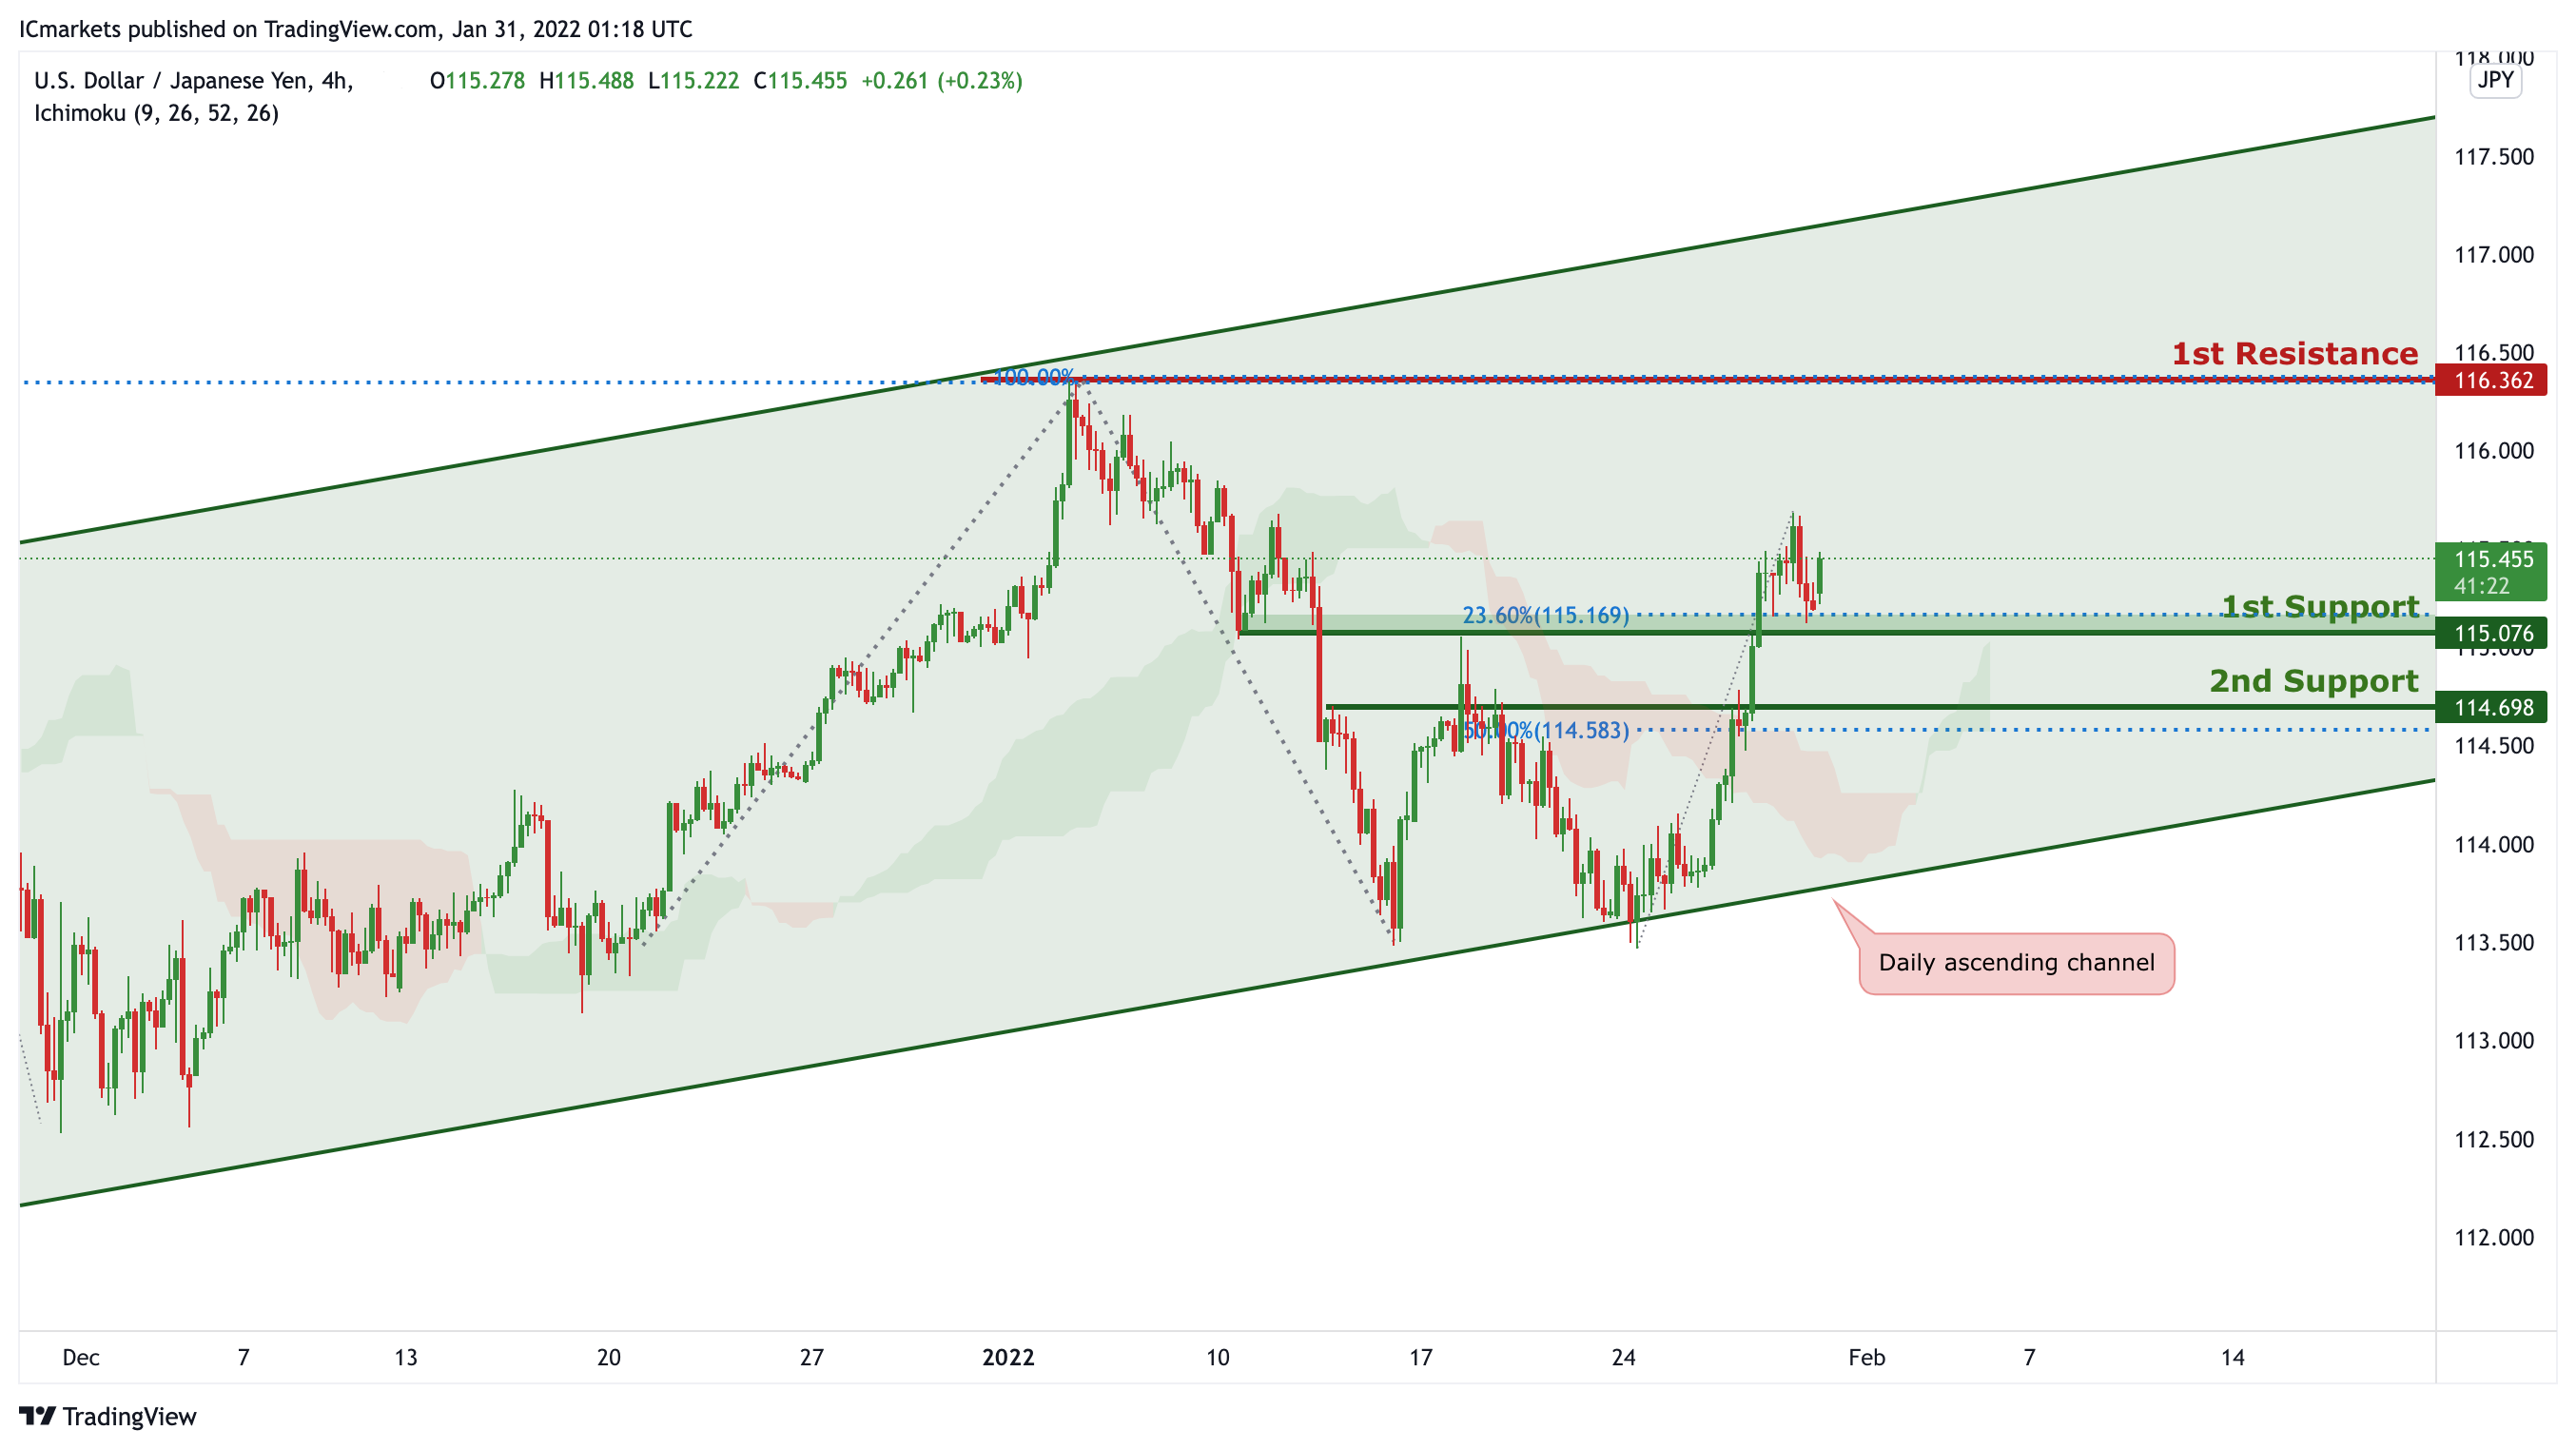
USD/JPY:
On the H4 chart, price is trading in an ascending channel and is near 1st support level of 115.058 which is also 23.6% Fibonacci retracement. Price can potentially go to the 1st resistance level of 116.362 which is also 100% Fibonacci projection and 127.2% Fibonacci retracement. Our bullish bias is supported by the ichimoku cloud indicator as price is trading above it.
Areas of consideration:
- H4 1st support at 115.058
- H4 1st resistance at 116.362
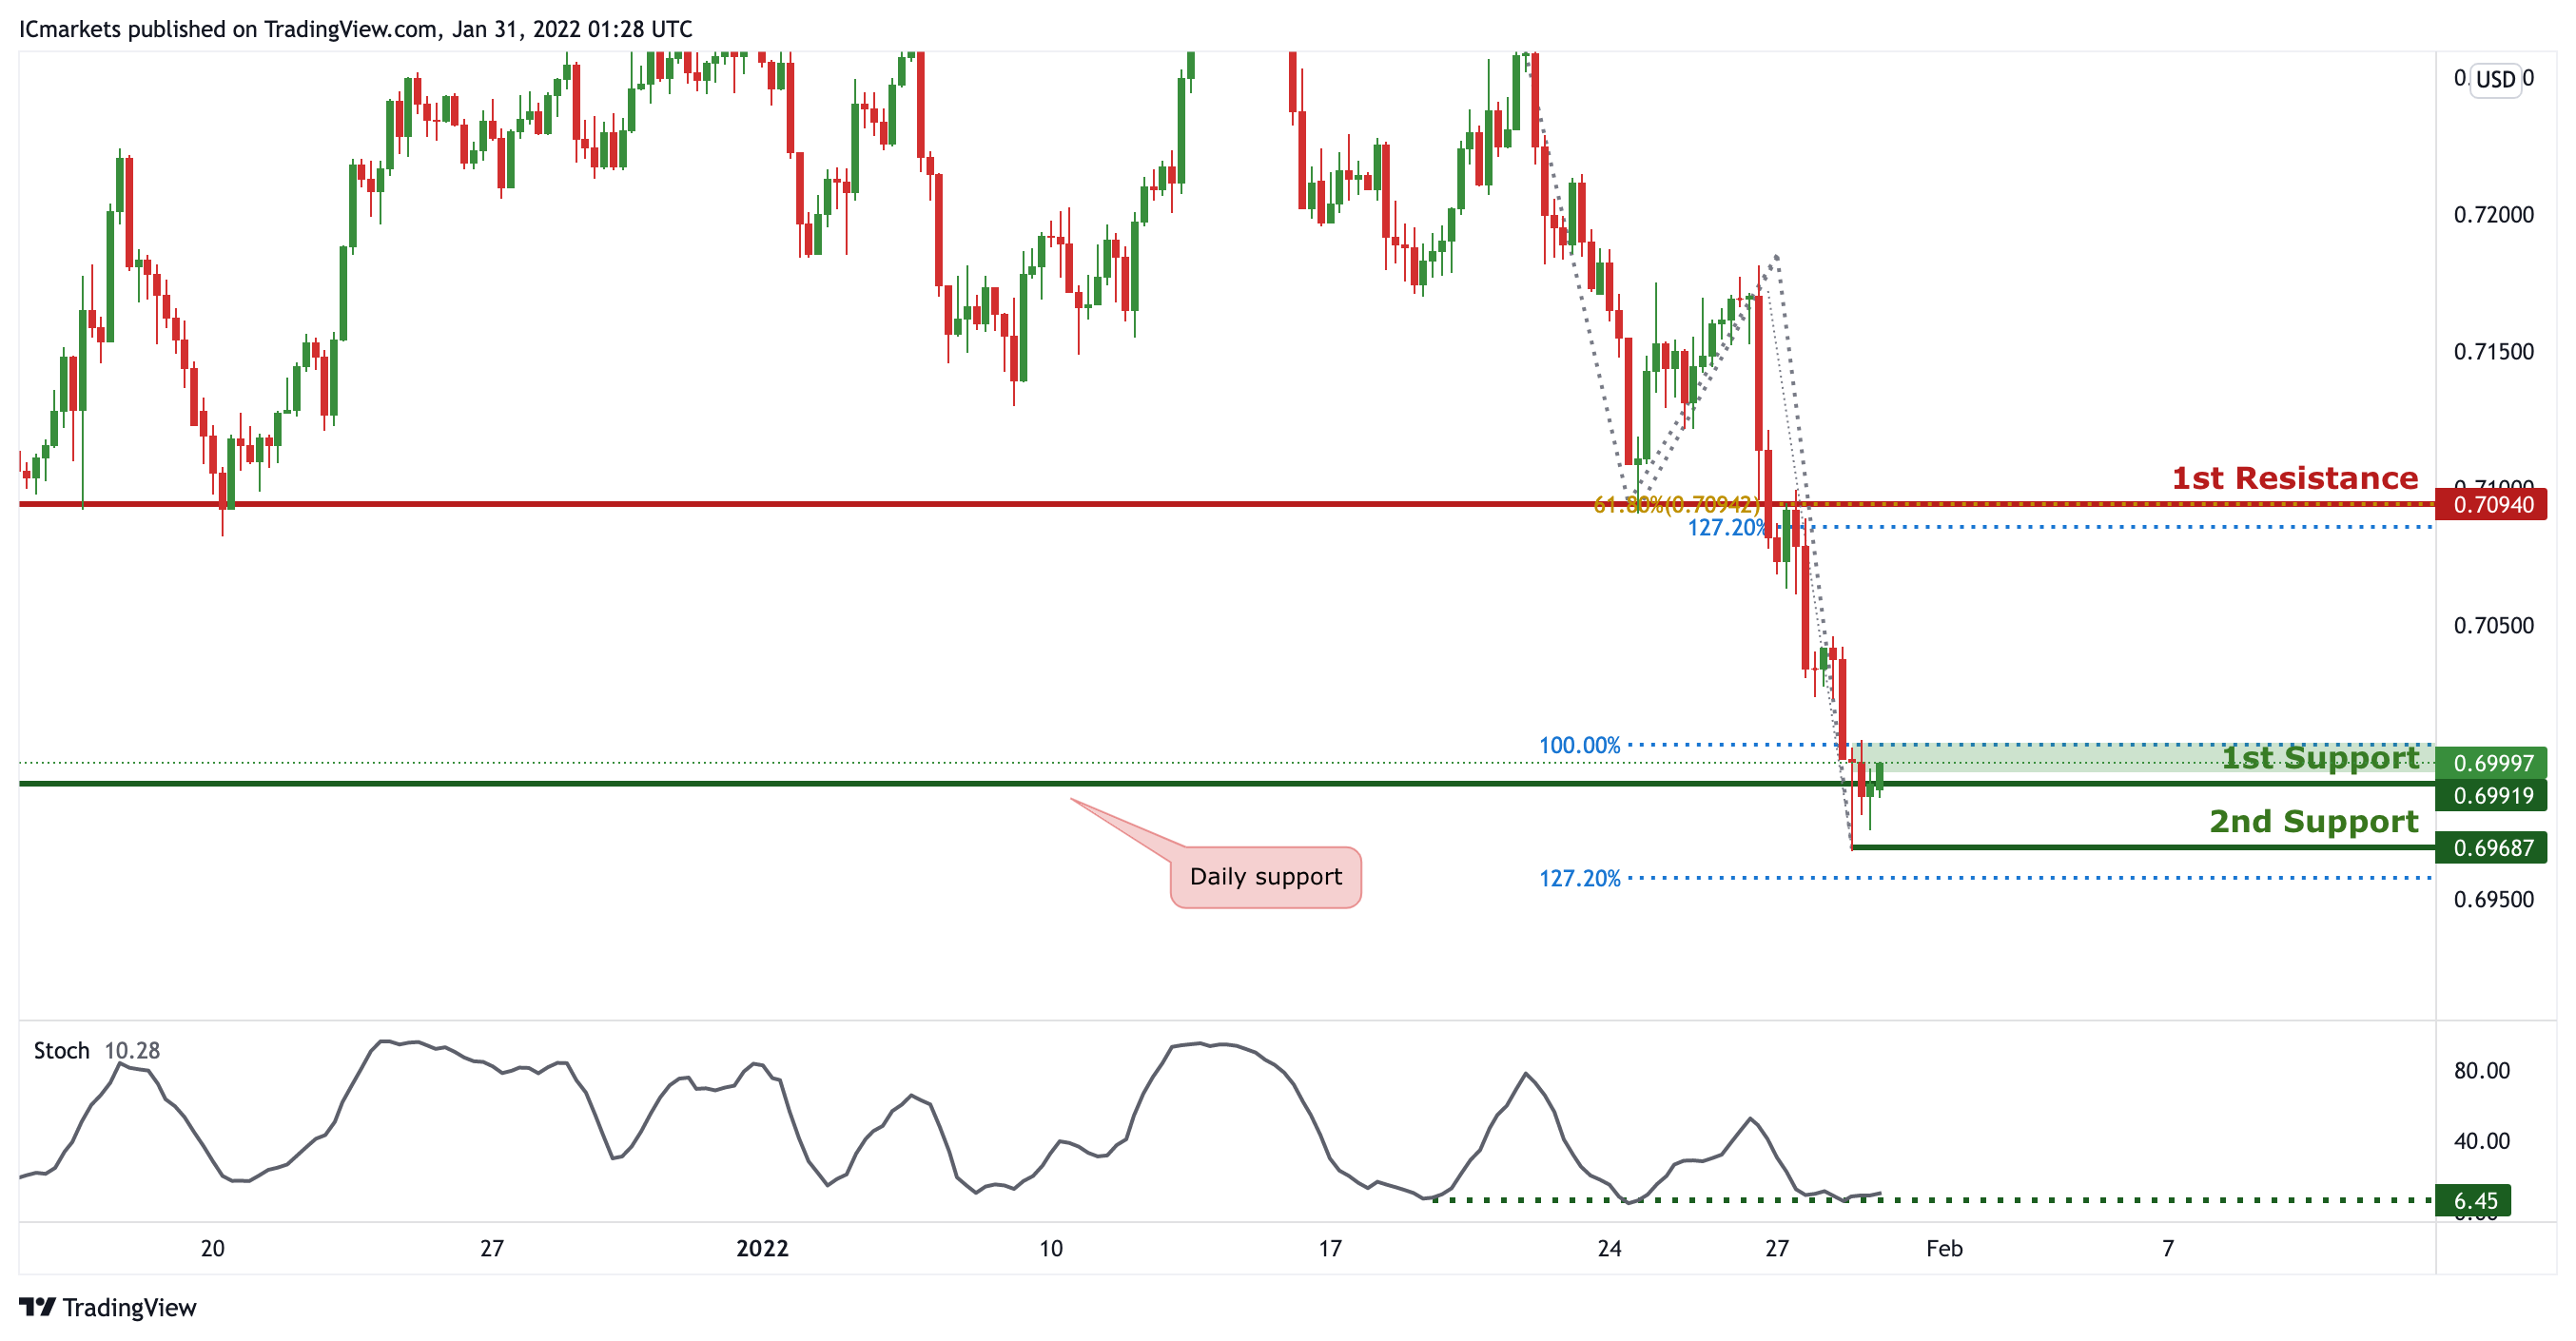
AUD/USD:
On the H4 timeframe, we can see that price is reacting at the daily support level. We can expect price to make a bounce from the 1st Support level in line with 100% Fibonacci projection towards 1st resistance in line with 61.8% Fibonacci retracement and 127.2% Fibonacci projection. Our bullish bias is further supported by the stochastic indicator where the %K line is at the support level.
Areas of consideration:
- H4 1st Support level 0.69919
- H4 1st resistance level 0.69687
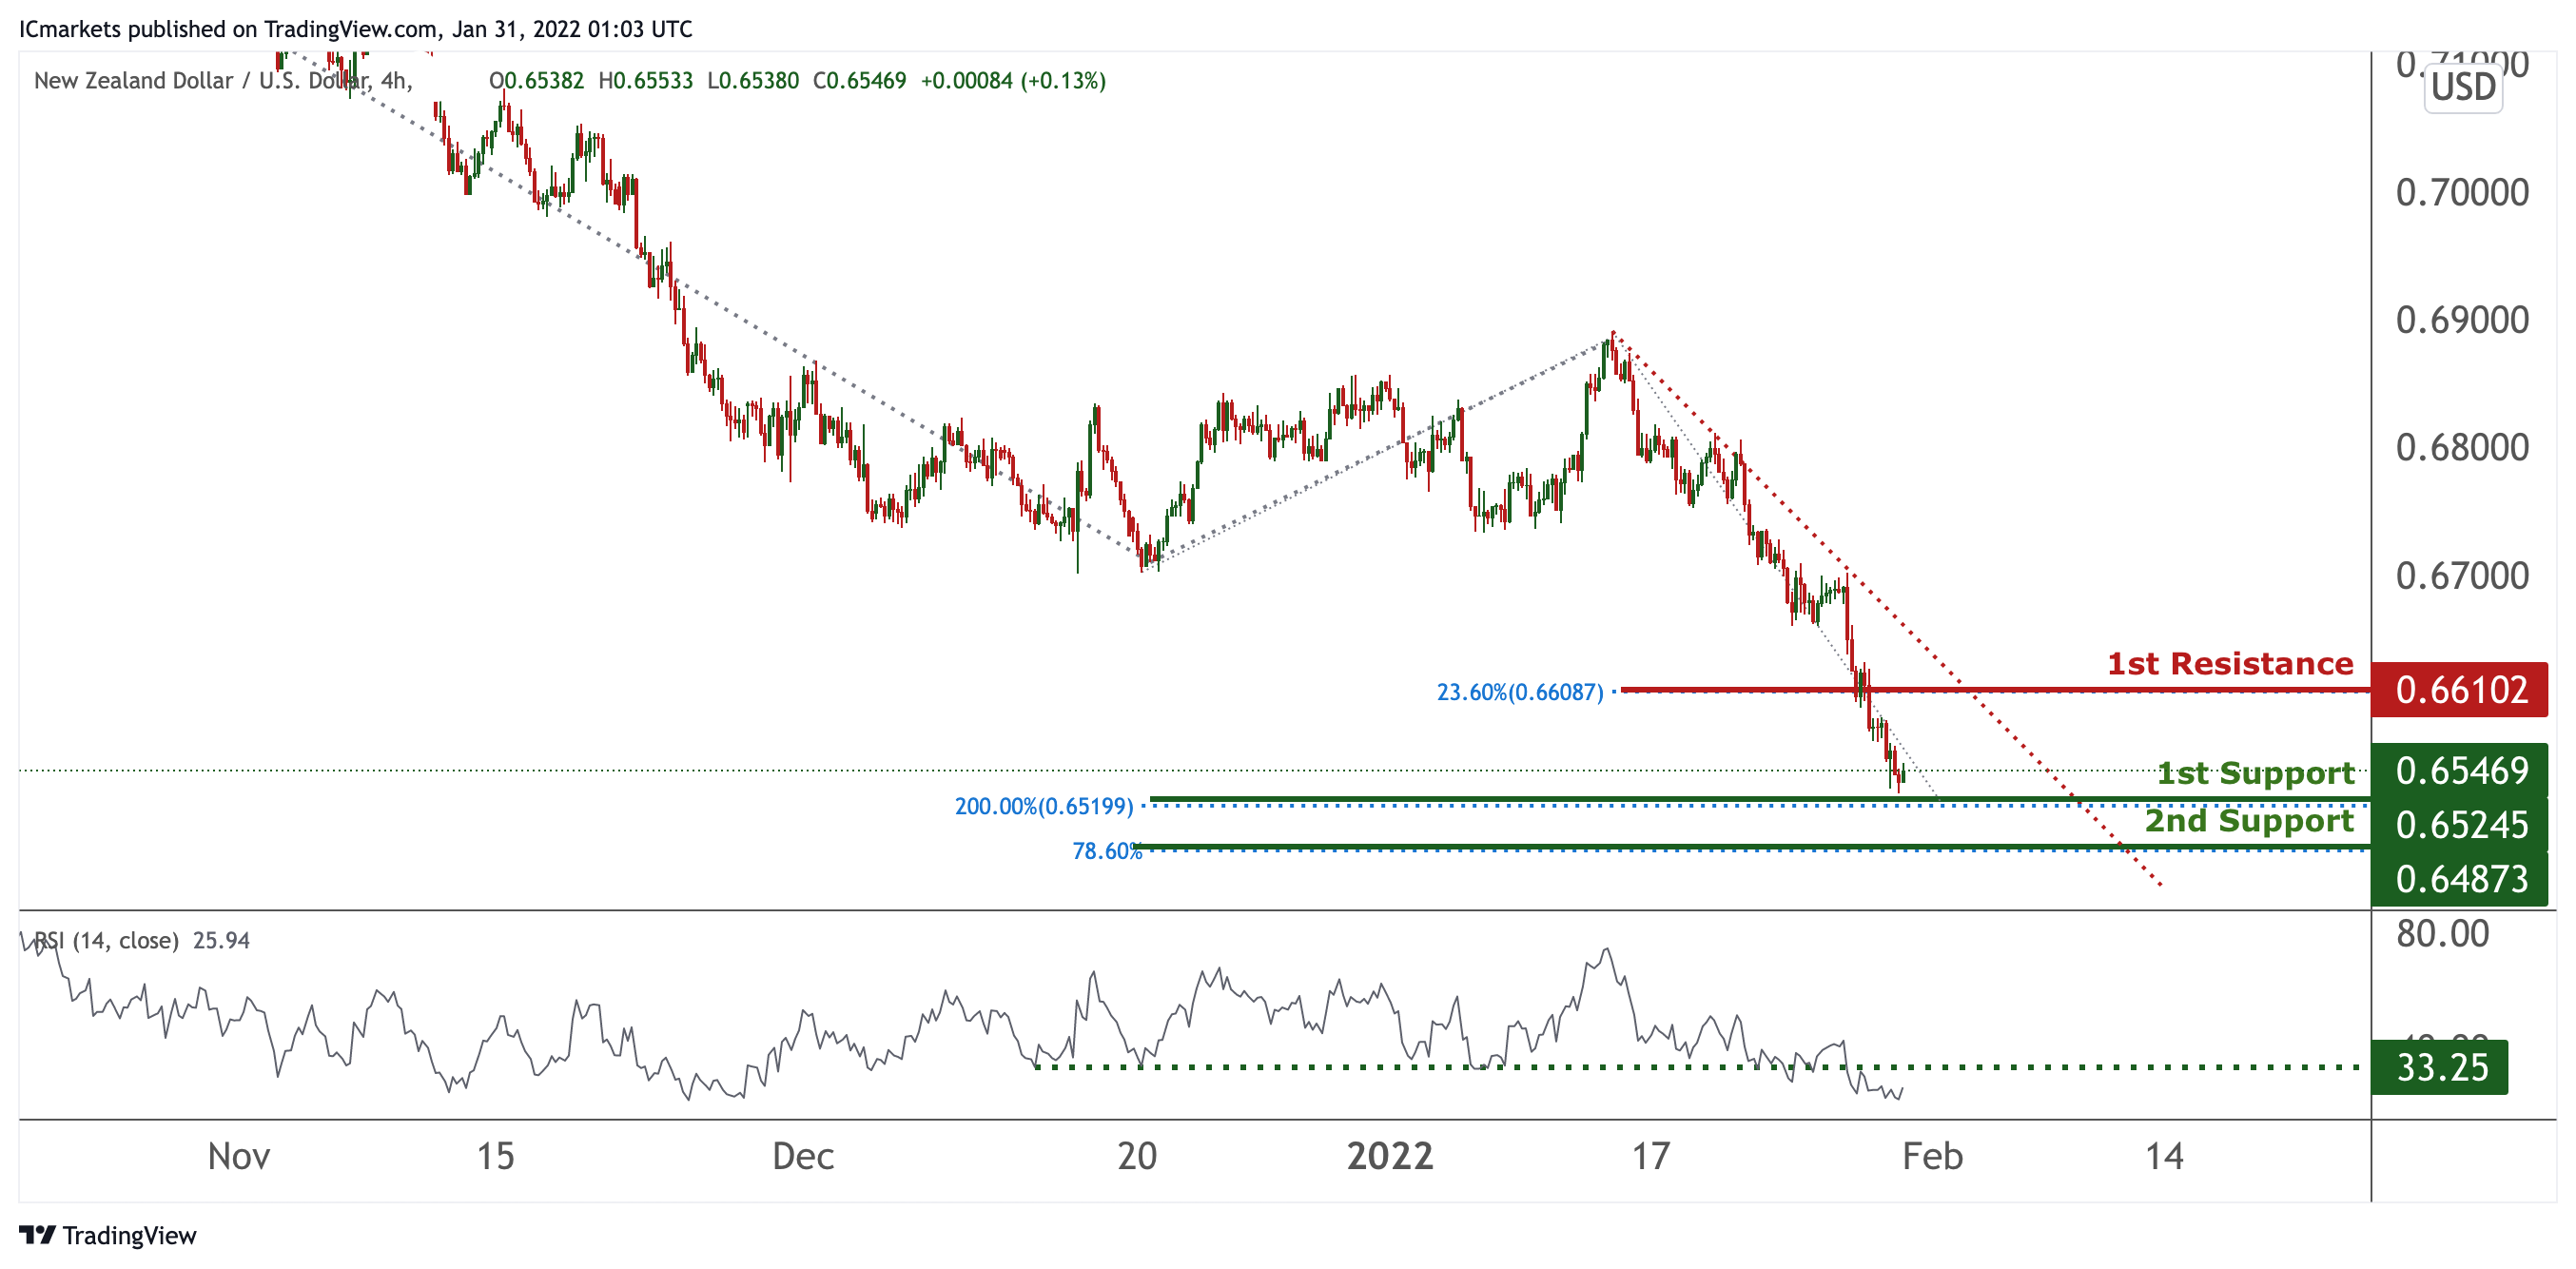
NZD/USD:
On the H4, prices are on bearish momentum and abiding to our bearish trendline. We see the potential for a short bounce from our 1st support at 0.65245 in line with 200% Fibonacci projection towards our 1st resistance at 0.66102 in line with 23.6% Fibonacci retracement. RSI is at a level where bounces occurred previously.
Areas of consideration:
- H4 time frame, 1st resistance at 0.66102
- H4 time frame, 1st support at 0.65245
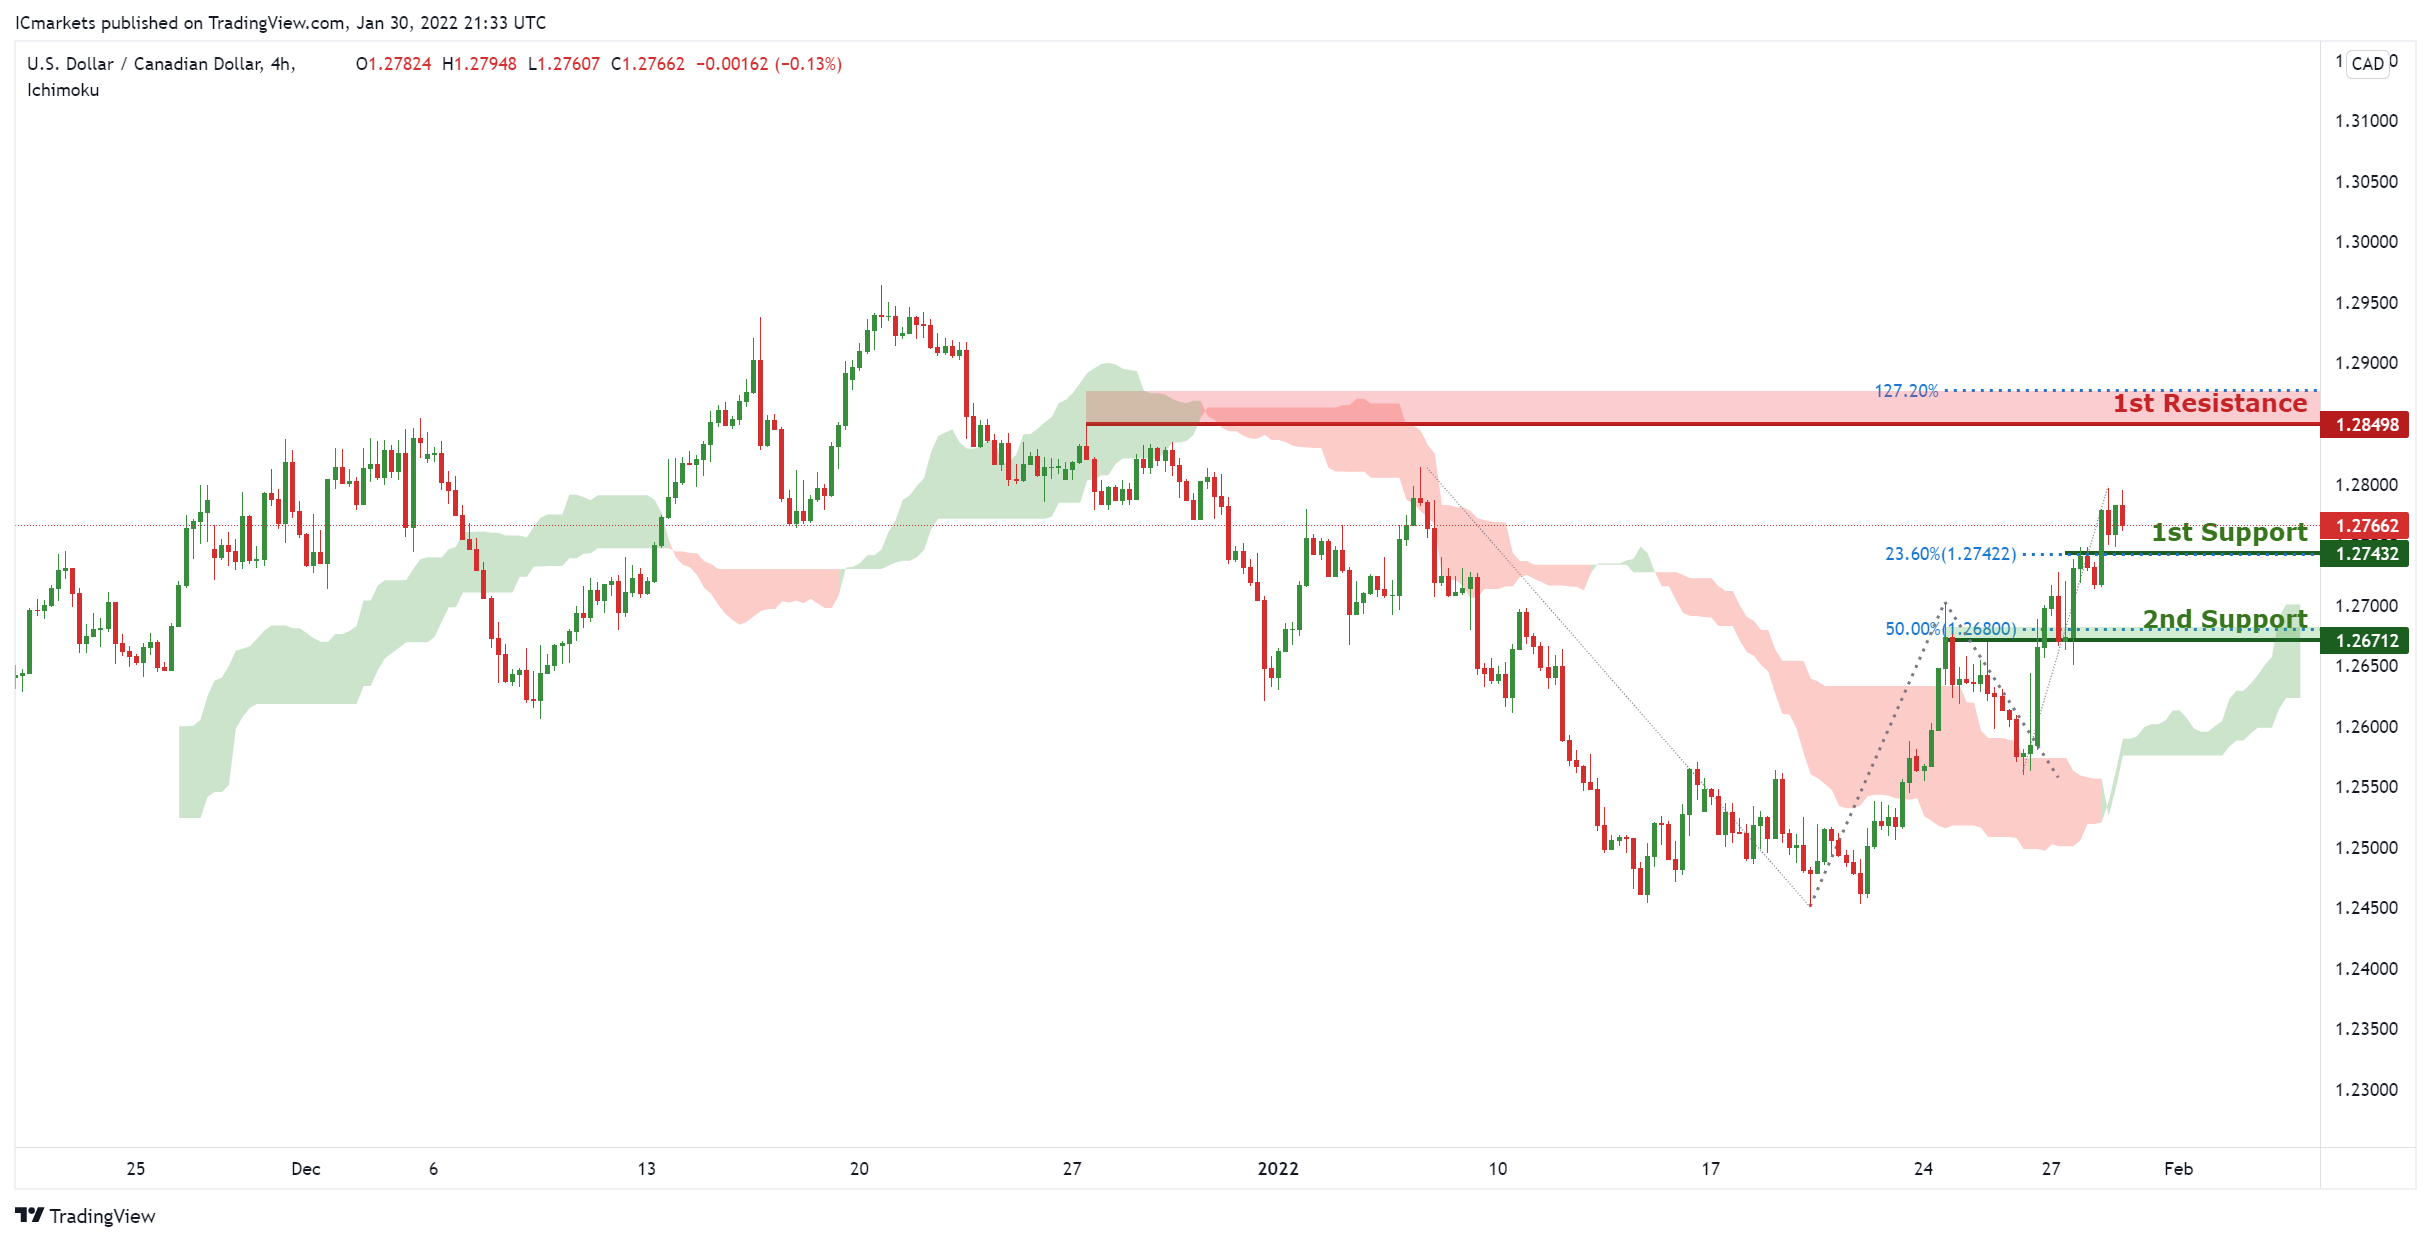
USD/CAD:
On the H4, with prices moving above the ichimoku cloud, we see the potential for a bounce from our 1st support at 1.27432 in line with Horizontal overlap support and 23.6% Fibonacci retracement towards our 1st resistance at 1.28498 in line with horizontal swing high resistance and 127.2% Fibonacci extension. Alternatively, price may break 1st support structure and head for 2nd support at 1.26712, in line with 50% Fibonacci retracement and horizontal overlap support.
Areas of consideration:
- H4 time frame, 1st support at 1.27432
- H4 time frame, 1st resistance at 1.28498
OIL:
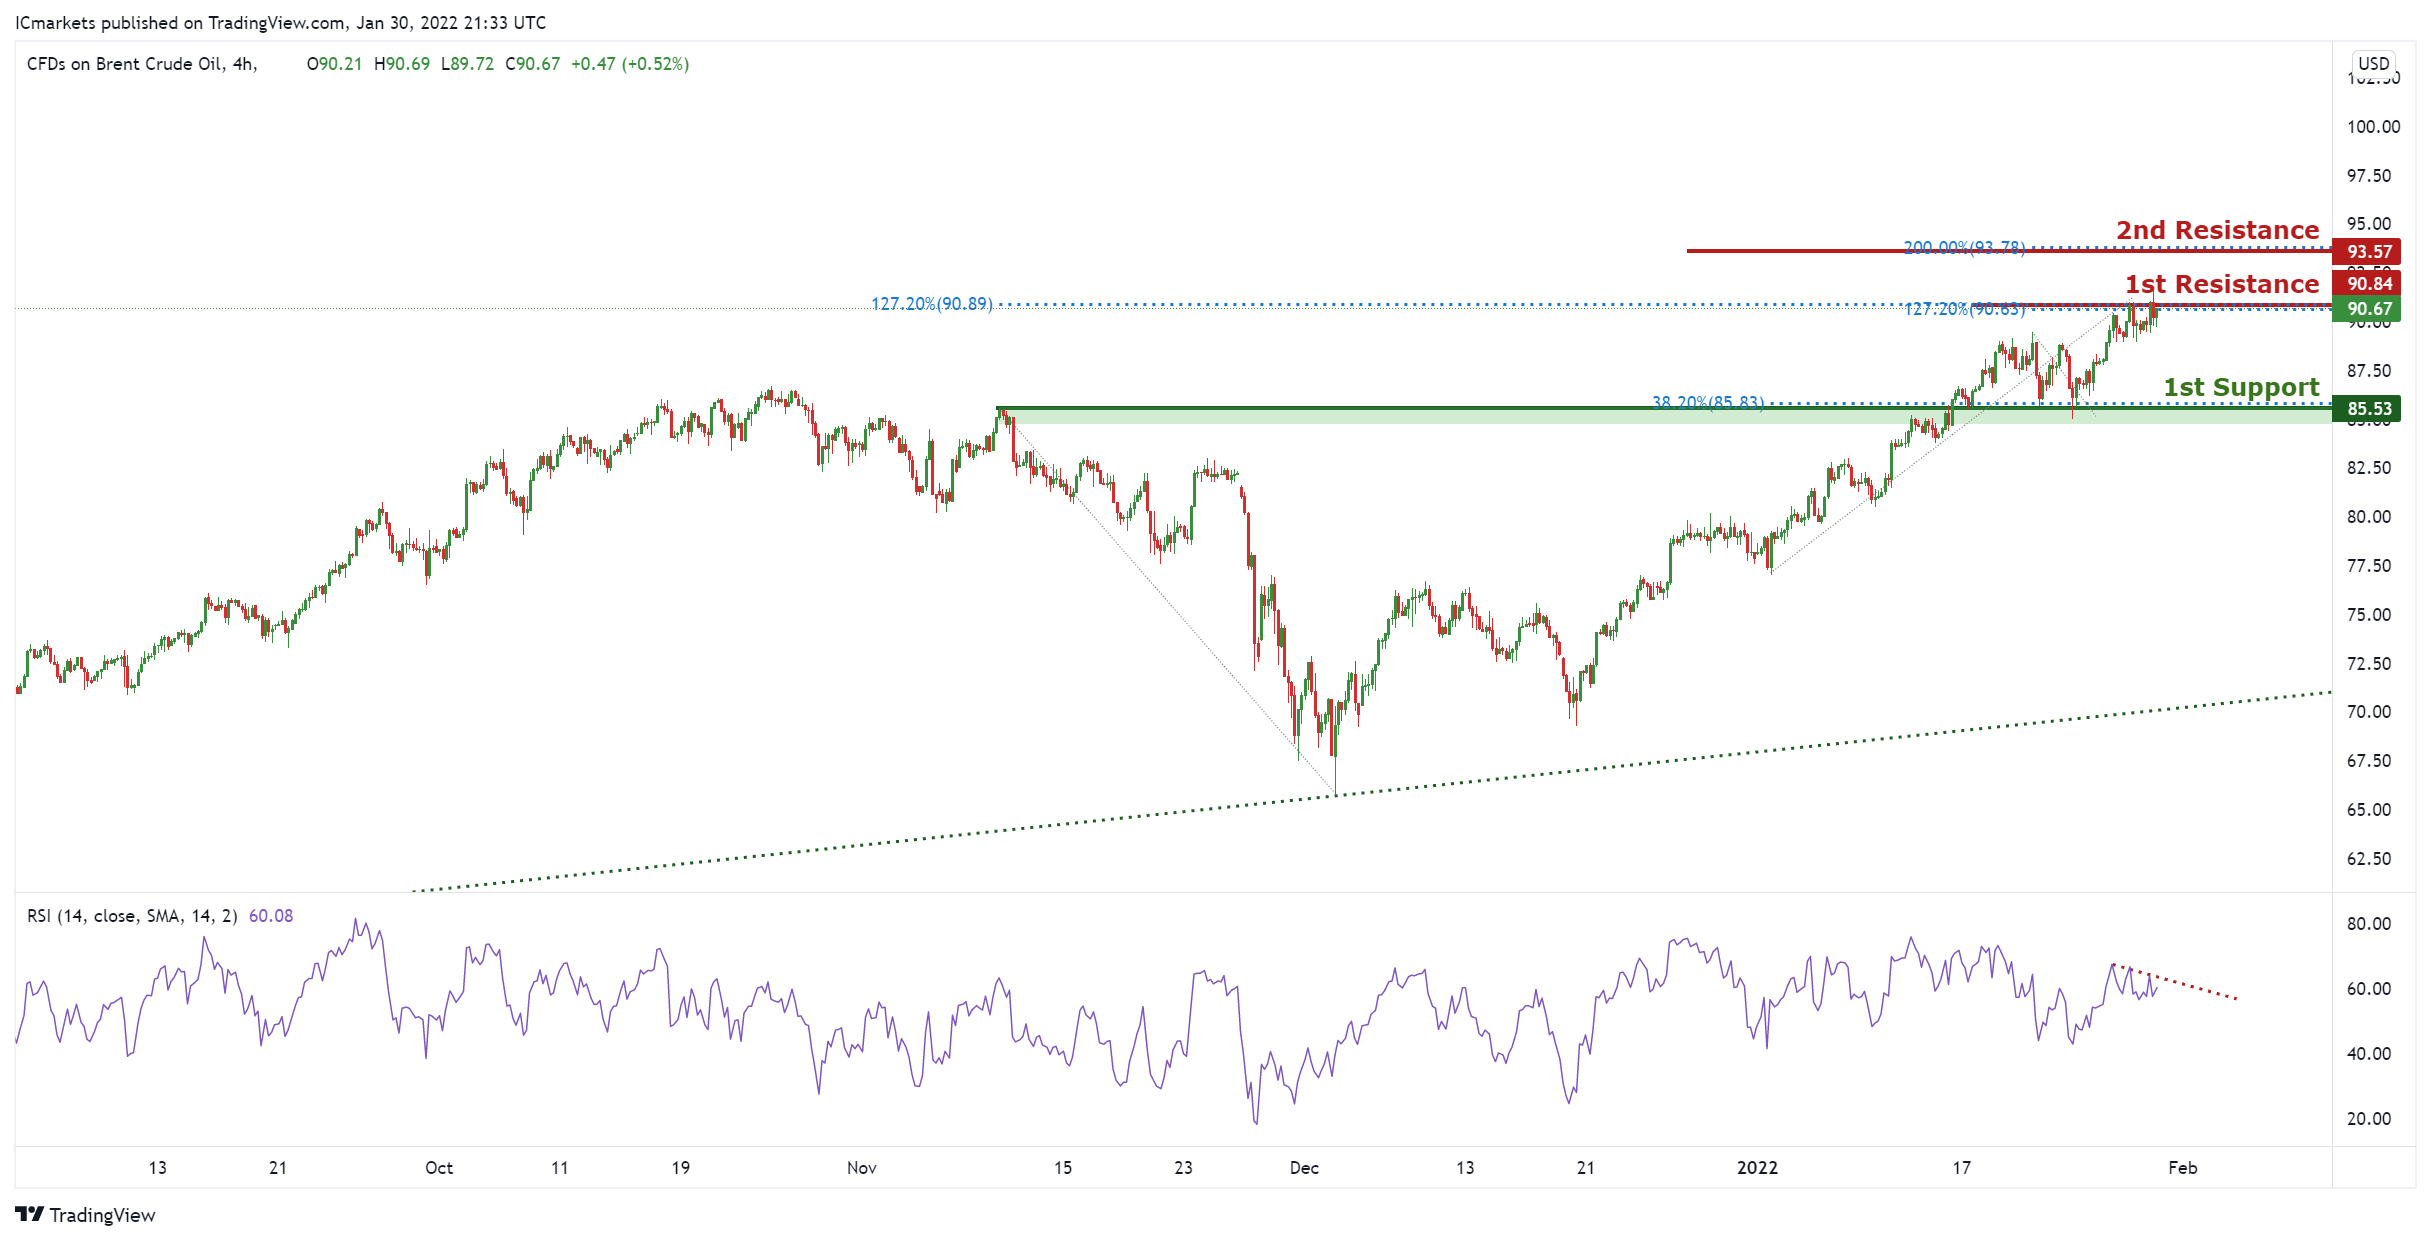
On the H4, with price expected to reverse off the resistance on the stochastics indicator, signifying an overall bearish momentum. We can expect price to drop from our 1st resistance at 90.84 in line horizontal graphical swing high resistance and 127.2% Fibonacci extension towards 1st support in line with horizontal overlap support ,38.2% Fibonacci retracement level at 85.53. Alternatively, price may break 1st resistance structure and head for 2nd resistance, which coincides with 200% Fibonacci extension level at 93.57.
Areas of consideration:
- H4 time frame, 1st resistance of 90.84
- H4 time frame, 1st support of 85.53
Dow Jones Industrial Average:
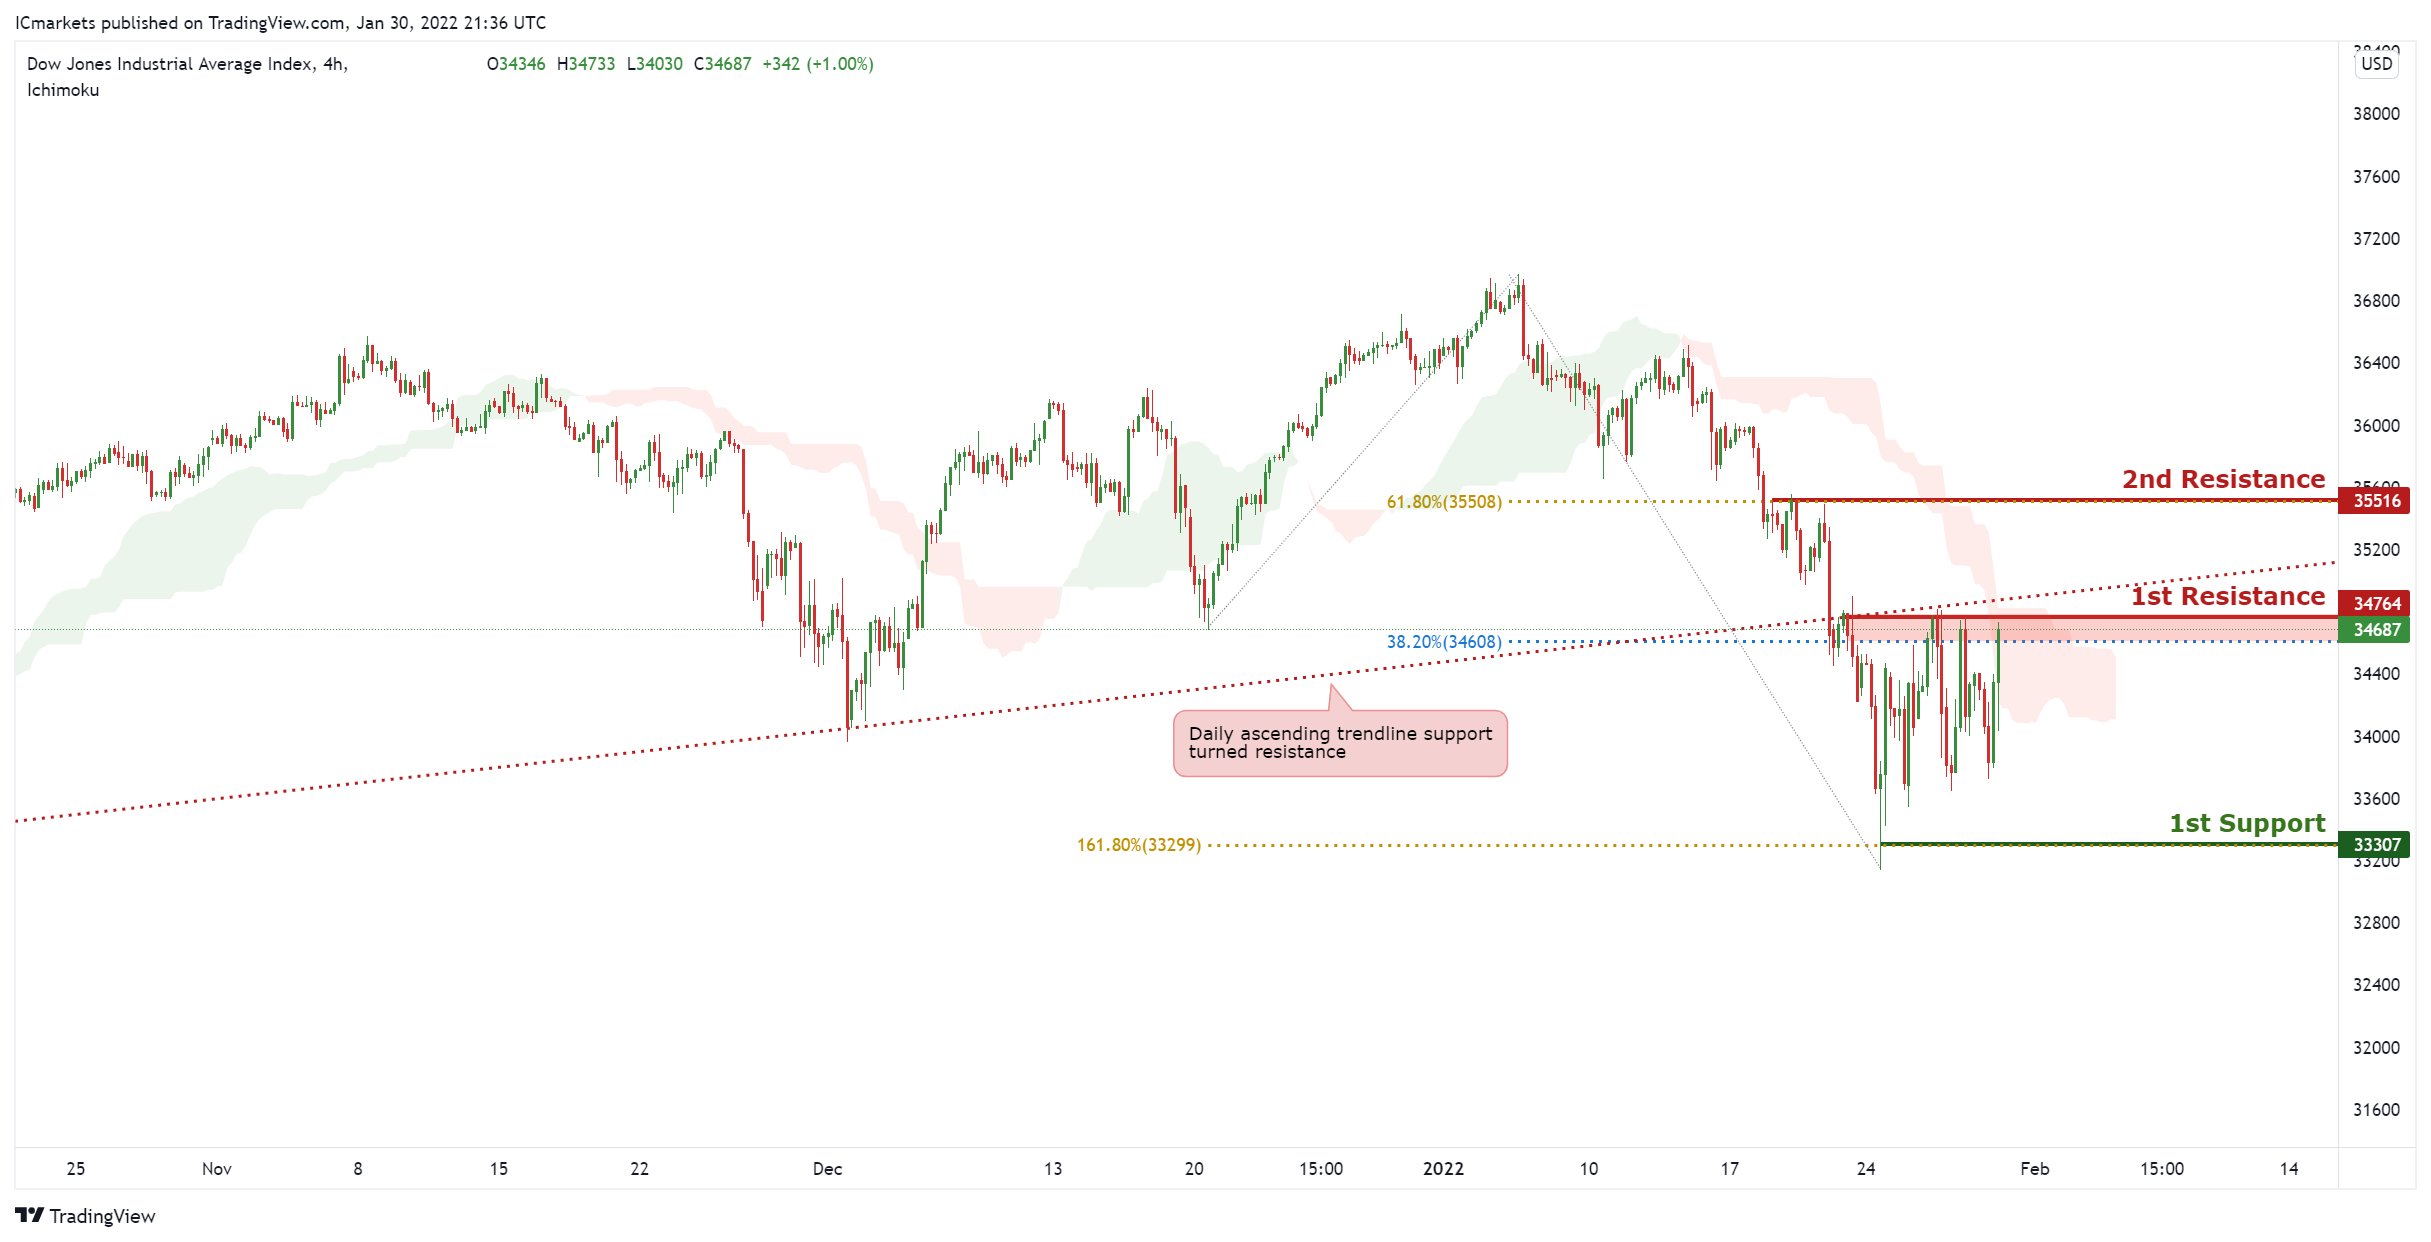
On the H4, with price moving below the ichimoku cloud, signifying an overall bearish momentum. We can expect price to drop from our 1st resistance at 34764 in line horizontal graphical overlap and 38.2% Fibonacci retracement towards 1st support in line with horizontal overlap support ,161.8% Fibonacci extension level at 33307. Alternatively, price may break 1st resistance structure and head for 2nd resistance, which coincides with 61.8% Fibonacci retracement at 35516. Traders should wait for price to swing higher or lower before entering.
Areas of consideration:
- H4 time frame, 1st resistance of 34764
- H4 time frame, 1st support of 33307
China Caixin PMI manufacturing dropped to 49.1, straining under the triple pressures
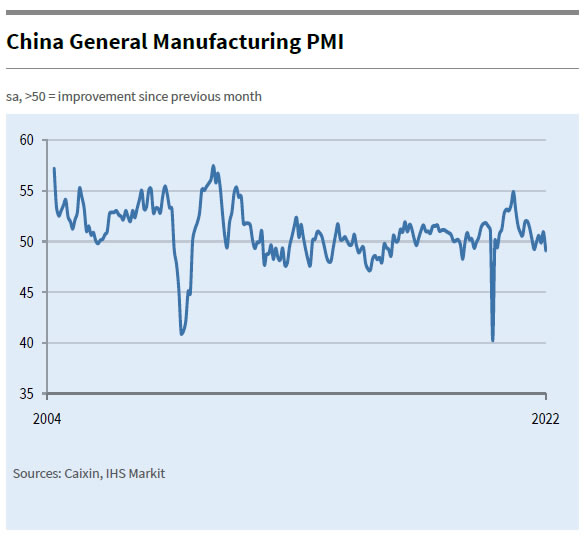
China Caixin PMI Manufacturing dropped from 50.9 to 49.1 in January. That's the worst reading in 23 months. Also, the index slumped into negative territory for the fourth time since February 2020.
Wang Zhe, Senior Economist at Caixin Insight Group said: "From December to January, the resurgence of Covid-19 in several regions including Xi'an and Beijing forced local governments to tighten epidemic control measures, which restricted production, transportation and sales of manufactured goods. It became more evident that China's economy is straining under the triple pressures of contracting demand, supply shocks and weakening expectations."
Japan industrial production dropped -1.0% mom in Dec, expected to rebound in Jan and Feb
Japan industrial production dropped -1.0% mom in December, worse than expectation of -0.8% mom. Manufacturers surveyed by the Ministry of Economy, Trade and Industry (METI) expected output to grow 5.2% in January and 2.2% in February.
Retail sales grew 1.4% yoy in December, below expectation of 2.7% yoy. That's nonetheless the third straight month of increase for sales, lifted by demand for general merchandise and food and beverages.
Fed Bostic comfortable with 50bps or if data support
Atlanta Fed President Raphael Bostic said in an FT interview that "every option is on the table" for every FOMC meeting. "If the data say that things have evolved in a way that a 50 basis point move is required or be appropriate, then I'm going to lean into that . . . If moving in successive meetings makes sense, I'll be comfortable with that," he said.
"The reduction of accommodation should translate into tighter financial markets," Bostic said. "The developments that we've seen on that front are comforting in the sense that markets are still functioning the way they're supposed to, and they are responding to conditions in ways that are rational and appropriate." He also supports starting the runoff of the USD 9T balance sheet "as quickly as" possible without impairing market functioning.
"Our policy path is not a constriction path. It's a less accommodative path," he said. "If we do the three [rate hikes] that I have in mind, that'll still leave our policy in a very accommodative space. "I don't think there's going to be a lot of constraint on growth as we remove these emergency actions."
EUR/USD Turns Red, More Losses Ahead?
Key Highlights
- EUR/USD started a major decline from well above 1.1350.
- A major bearish trend line is forming with resistance near 1.1200 on the 4-hours chart.
- GBP/USD could extend decline if there is a break below 1.3350.
- AUD/USD and NZD/USD saw a major drop.
EUR/USD Technical Analysis
The Euro started a major decline from well above 1.1400 against the US Dollar. EUR/USD traded below the 1.1320 support to move into a bearish zone.
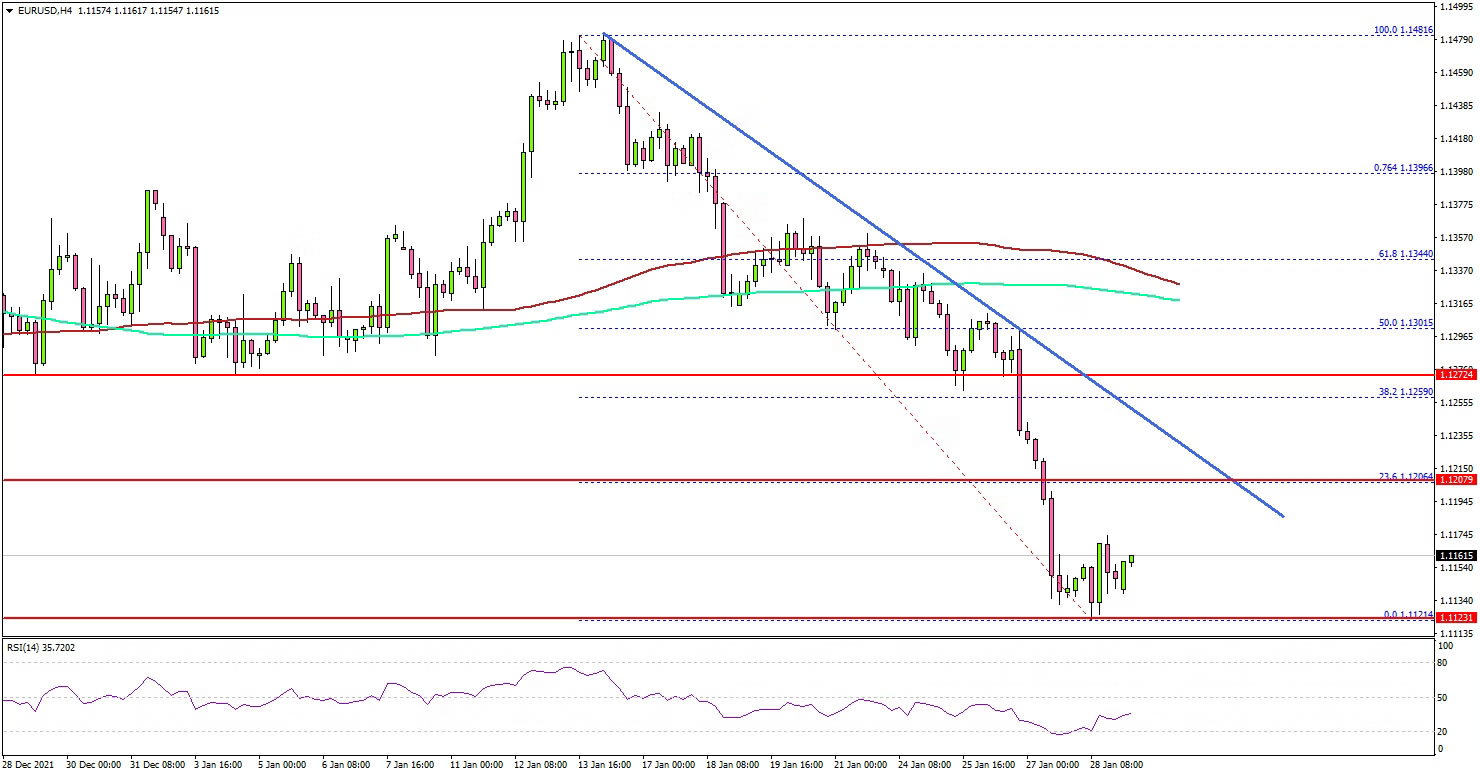
Looking at the 4-hours chart, the pair gained below the 1.1280 level, the 100 simple moving average (red, 4-hours), and the 200 simple moving average (green, 4-hours).
The bears gained strength for a move below the 1.1220 support. The pair even declined below the 1.1200 support. It is now consolidating losses above the 1.1120 level. If there is a downside break, the pair could continue to move down.
The next major support is near the 1.1050 level, below which it could test 1.1000. On the upside, an immediate resistance is near the 1.1180 level.
The first major resistance is near the 1.1200 level. A close above 1.1200 could open the doors for a steady recovery wave towards the 1.1250 level.
Looking at GBP/USD, the pair started a strong decline below the 1.3500 support zone. Similarly, AUD/USD dropped below the 0.7050 support zone and spiked below 0.7000.
Economic Releases
- Euro Zone Gross Domestic Product Q4 2021 (Preliminary) (QoQ) - Forecast 0.3%, versus 2.2% previous.
- German Consumer Price Index for Jan 2022 (YoY) (Prelim) – Forecast +4.7%, versus +5.7% previous.
- German Consumer Price Index for Jan 2022 (MoM) (Prelim) – Forecast -0.3%, versus +0.5% previous.