

Sample Category Title
Bitcoin breaks 40k, Ethereum breaks 3k, as selloff resumes
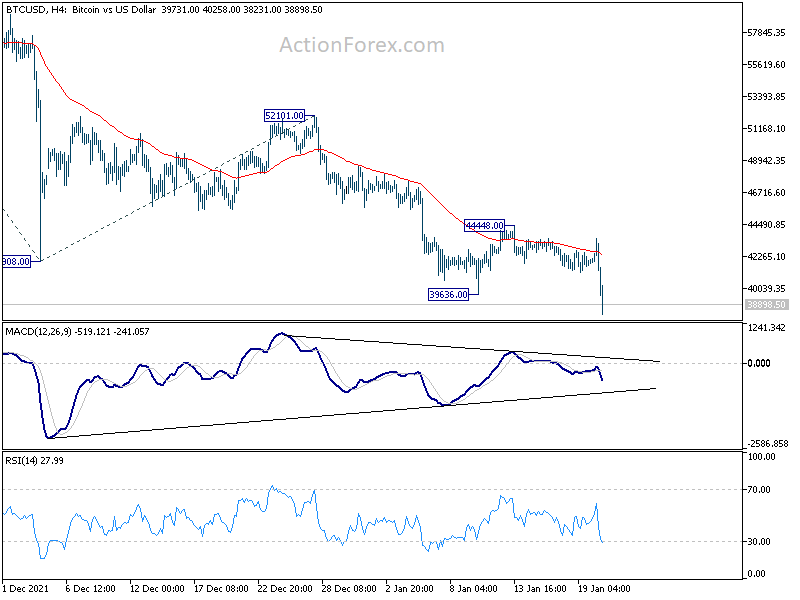
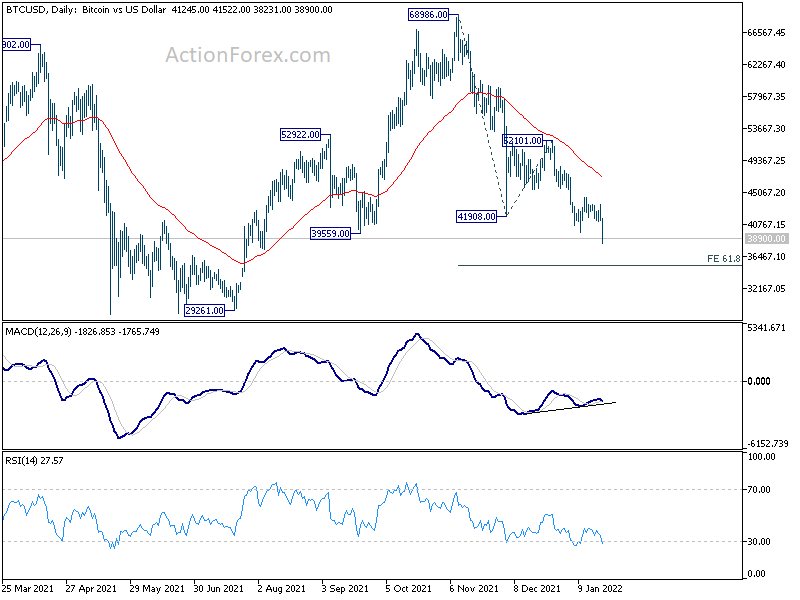
Bitcoin breaks down through 39636 temporary support today, after another rejection by 4 hour 55 EMA. Down trend from 68986 resumes and should now target 61.8% projection of 68986 to 41908 from 52101 at 35366. For now, such decline is seen as part of a long term range pattern between 29261 and 68986 only. Hence, momentum to start to diminish below 35366, and a bottom should be formed above 29261 low. Nevertheless, break of 44448 resistance is needed to indicate bottoming, or risk will stay heavily on the downside.
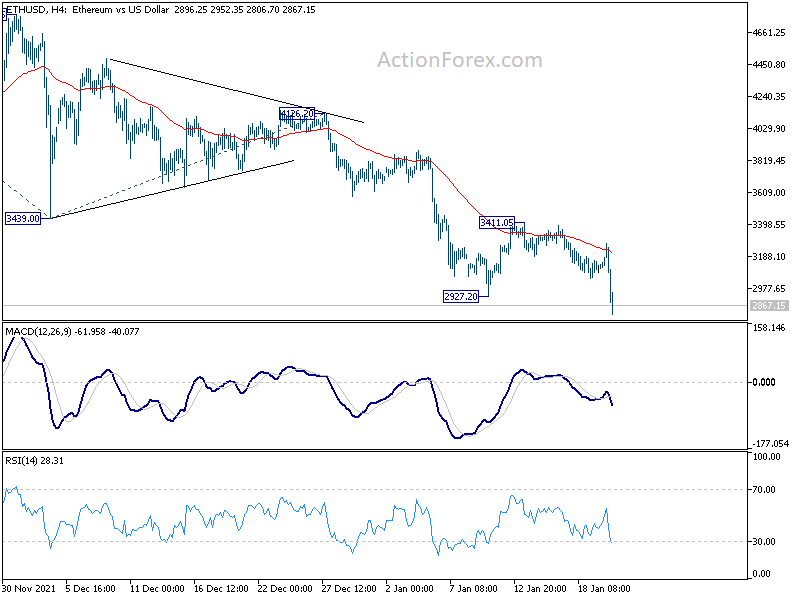
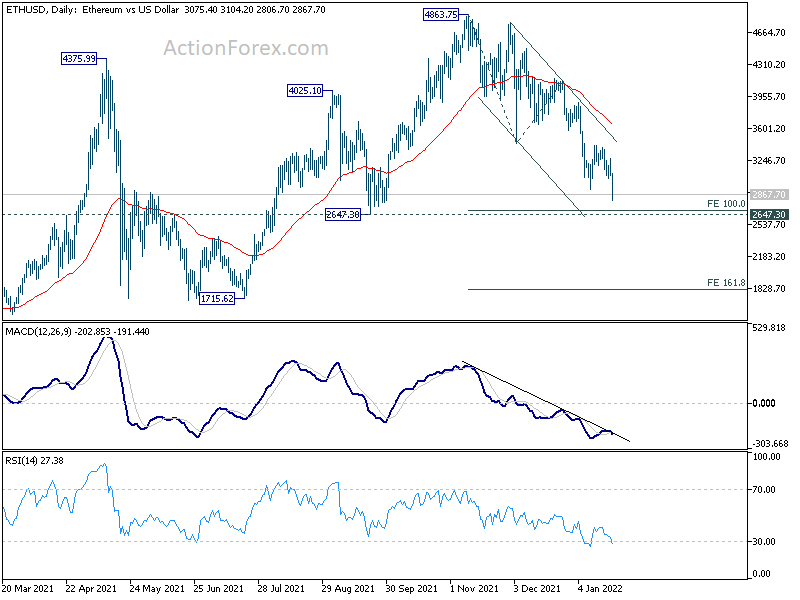
Ethereum also resumes recent fall from 4863.75 by breaking through 2927.20 today. Next target is 100% projection of 4863.75 to 3439.00 from 4126.20 at 2701.45, which is close to 2647.30 support. Downside momentum should start to diminish below this level. The question is where between 1715.62/2647.30 would ethereum forms a bottom. But in any case, break of 3411.05 is needed to indicate bottoming first, or risk will stay heavily on the downside. The fall from 4863.75 could eventually extend to 161.8% projection at 1820.95, which is close at 1715.62 low, become finishing.
Japan CPI core unchanged at 0.5% yoy in Dec
Japan CPI core (all item ex-food) was unchanged at 0.5% yoy in December, below expectation of 0.6% yoy. But that's still the second increase in a row, and the fastest pace in nearly two years. All item CPI accelerated from 0.6% yoy to 0.8% yoy. All item ex-food, ex-energy CPI dropped from -0.6% yoy to -0.7% yoy.
In the minutes of December BoJ meeting, a board member said, "we're seeing signs of change in the price-setting behavior of Japanese firms, which had been said to be cautious about raising prices for fear of seeing sales volume fall,."
Another member noted, "it's unlikely Japan will see wages rise as sharply as in the United States. But there's a significant chance both economic growth and inflation could overshoot expectations,"
Earlier this week, BoJ raised 2022 and 2023 core CPI projection. But it also indicated there is no rush to change the ultra-loose monetary policy.
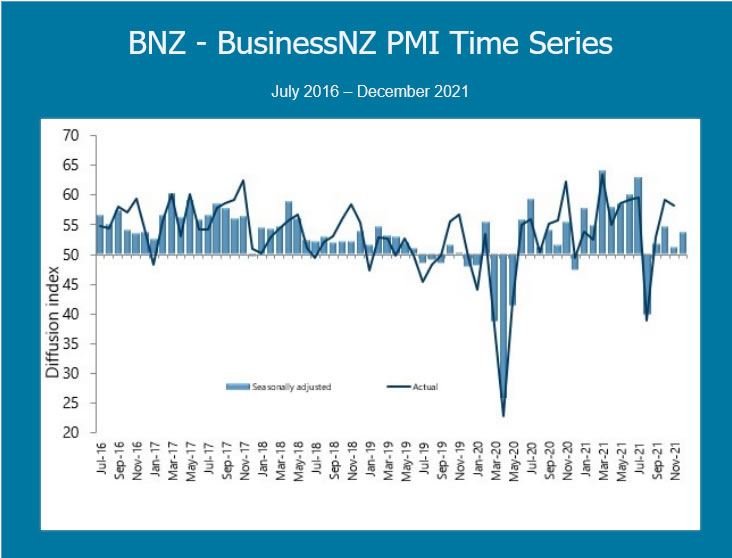
New Zealand BusinessNZ PMI rose to 53.7, return to growth
New Zealand BusinessNZ Performance of Manufacturing Index rose from 51.2 to 53.7 in December. Looking at some details, Production rose from 53.0 to 56.3. Employment rose from 48.5 to 52.0. New orders rose from 55.4 to 57.5. Finished stocks rose from 48.7 to 52.0. Deliveries rose from 43.9 to 50.0.
BNZ Senior Economist, Doug Steel stated that "in the final quarter of 2021 the PMI averaged 53.2, indicating a return to positive manufacturing GDP growth after a sharp negative in the prior quarter."
Technical Outlook and Review
DXY:
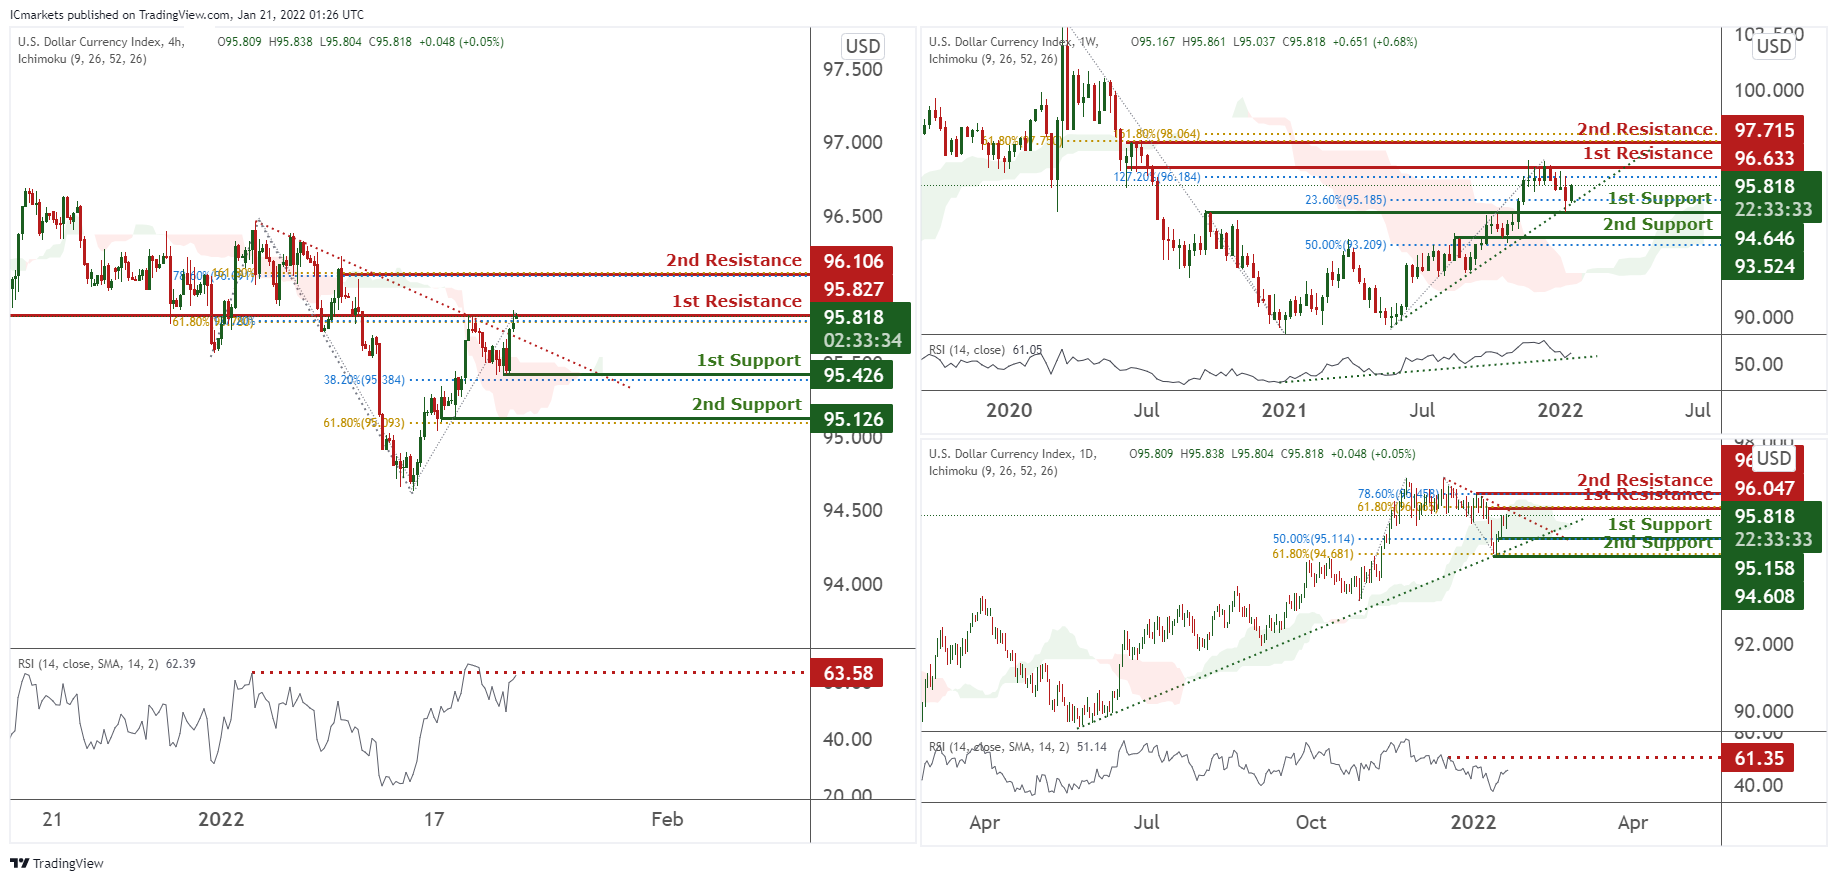
On the weekly, prices have recently broken out of our descending trendline. We are expecting prices to dip from our 1st resistance at 95.818 in line with 61.8% Fibonacci extension and 50% Fibonacci retracement towards our 1st support at 95.426 in line with 38.2% Fibonacci retracement. RSI is at a level where dips previously occurred.
On the daily, prices are consolidating in a triangle pattern. We see potential for prices for a drop from our 1st resistance at 95.818 in line with 61.8% Fibonacci extension towards our 1st support at 95.158 in line with 50% Fibonacci retracement. Our bearish bias is further supported by RSI being close to levels where dips occurred previously and also prices passing through our ichimoku cloud support.
On the H4 timeframe, prices are abiding to a descending trendline and are on bearish momentum. We would expect a dip from our 1st resistance at 95.818 in line with 61.8% and 78.6% Fibonacci retracement towards our 1st support at 95.426 in line with 38.2% Fibonacci retracement. RSI is at a level where dips occurred previously and also ichimoku clouds are showing further bearish momentum.
Areas of consideration:
- H4 time frame, 1st resistance at 95.827
- H4 time frame, 1st support at 95.426
XAU/USD (GOLD):
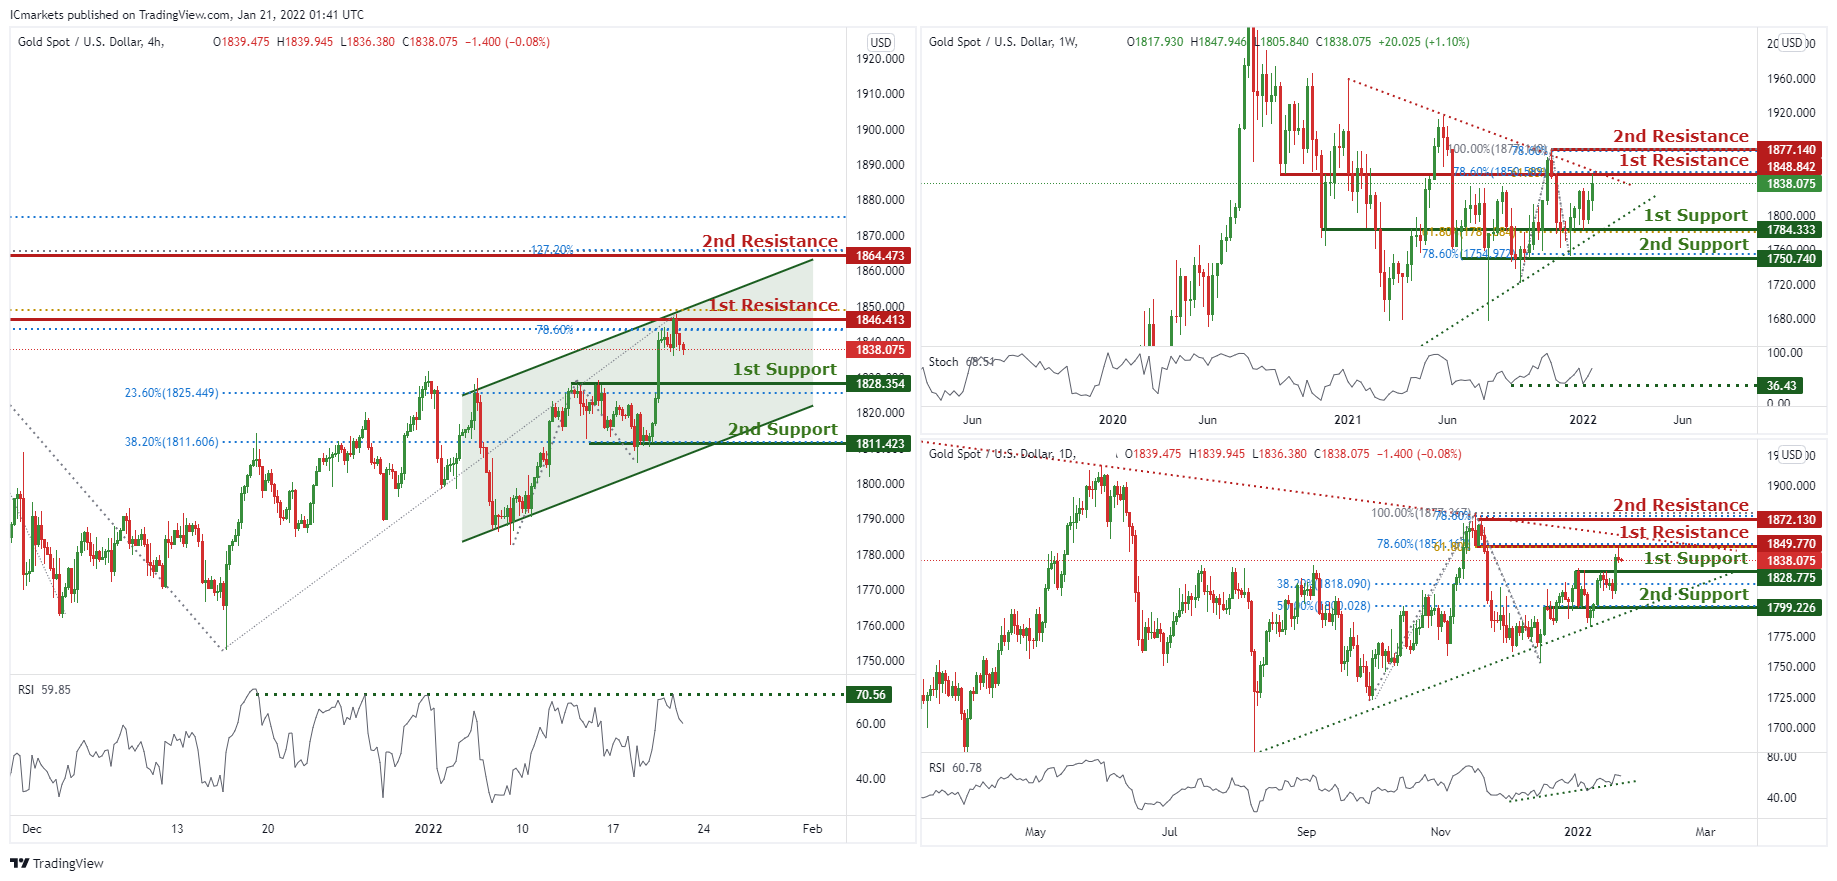
On the weekly, prices are consolidating in a triangle and have the potential to dip from our 1st resistance at 1848.842 in line with 61.8% Fibonacci extension and 78.6% Fibonacci retracement towards our 1st support at 1784.333 in line with 61.8% Fibonacci retracement. RSI are at levels where dips previously occurred.
On the daily, prices are consolidating in a triangle. We see potential for further bullish continuation from 1st support at 1828.775 in line with 38.2% Fibonacci retracement towards our 1st resistance at 1849.77 in line with 61.8% Fibonacci extension and 78.6% Fibonacci retracement. Our bias is further supported by the RSI at a level where bounces previously occurred.
On the H4 chart, prices are consolidating in a parallel channel. We see potential for prices to dip from our 1st support at 1828.354 in line with the area of Fibonacci confluences towards our 1st support at 1828.354 in line with 23.6% Fibonacci retracement. RSI is at a level where dips previously occurred. Alternatively, breaking our 1st resistance will find prices climbing further towards our 2nd resistance at 1864.473 in line with 127.2% Fibonacci extension which is our next level of strong resistance.
Areas of consideration:
- 4h 1st support at 1828.354
- 4h 1st resistance at 1811.423
GBP/USD
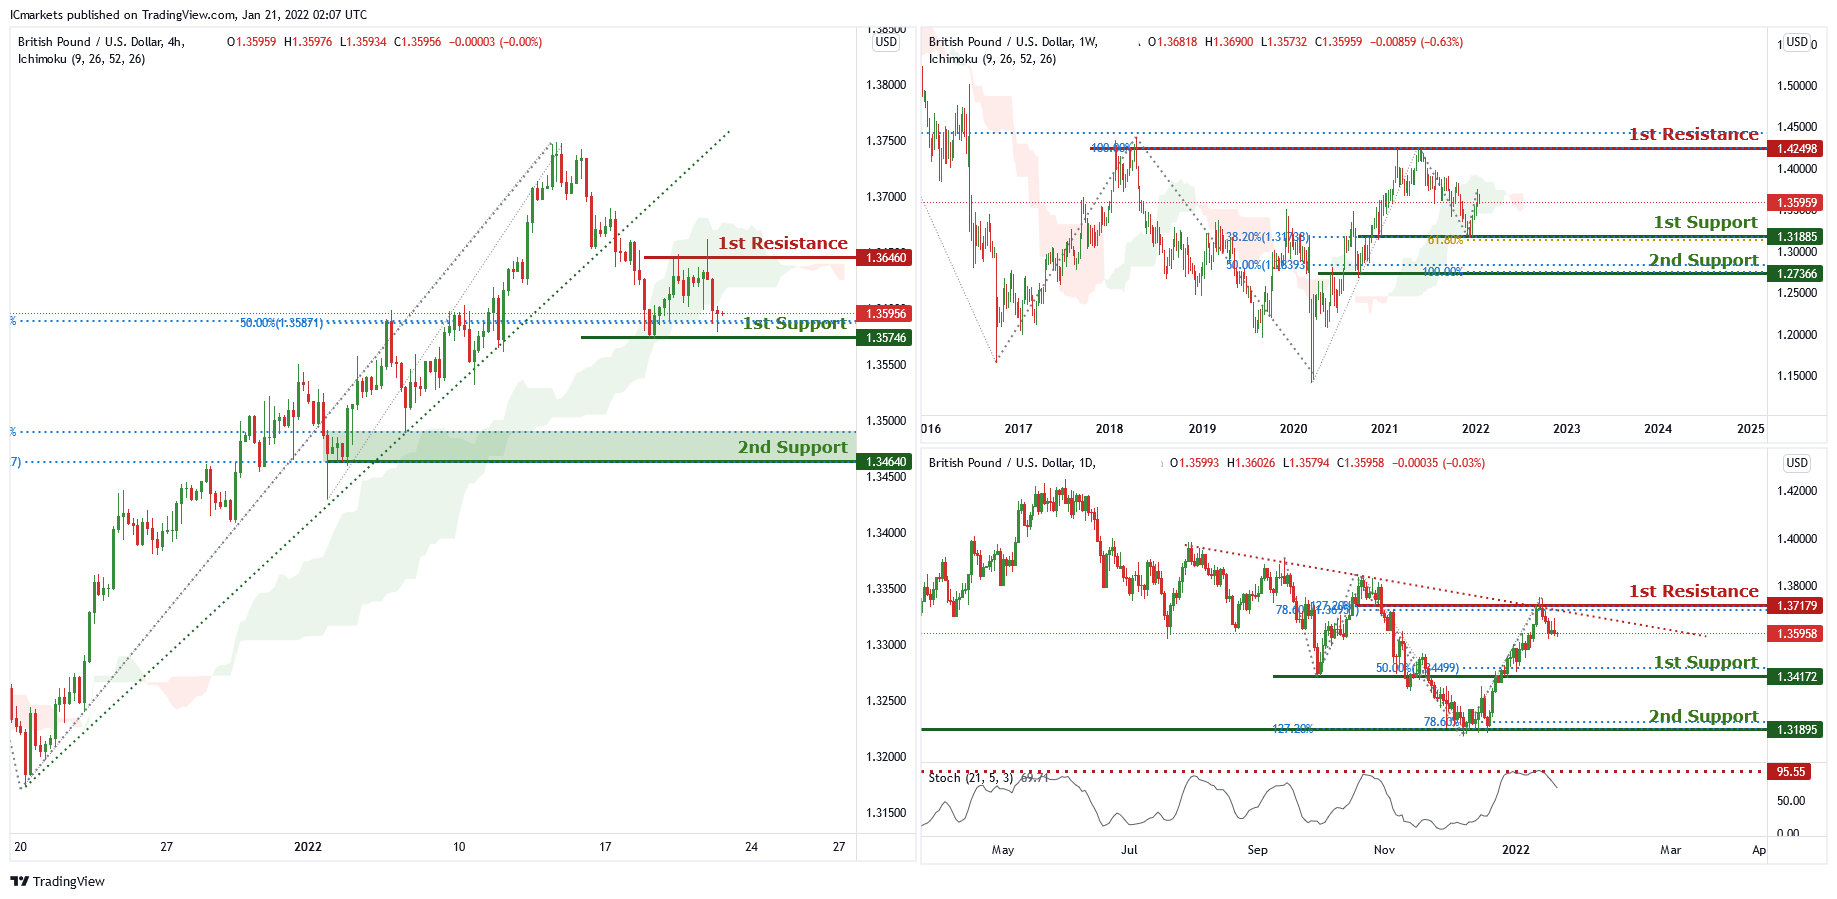
On the weekly chart price in between 1st resistance of 1.42498 which is in line with 100% Fibonacci projection, 50% Fibonacci retracement and 1st support of 1.31885 which is in line with 38.2% Fibonacci retracement and 61.8% fibonacci projection. Price can potentially go to the 1st resistance level of 1.42498 which is the graphical swing high level. Our bullish bias is supported by the ichimoku cloud indicator.
On the daily chart , price is abiding by the descending trendline and near 1st resistance level of 1.37179 which is also 127.2% Fibonacci projection and 78.6% Fibonacci retracement. Price can potentially dip to the 1st support of 1.34172 which is also 50% Fibonacci retracement. Our bearish bias is supported by the stochastic indicator as it is near resistance level.
On the H4 chart, price has recently broken out of the ascending trendline and near 1st support level of 1.35746 which is also 50% Fibonacci retracement and 78.6% Fibonacci projection. Price can potentially dip to the 2nd support of 1.34640 which is 127.2% Fibonacci projection and 50% Fibonacci retracement. Our bearish bias is supported by the ichimoku cloud indicator as price is trading below it.
Areas of consideration
- 1st resistance at 1.36049
- 1st support at 1.35289
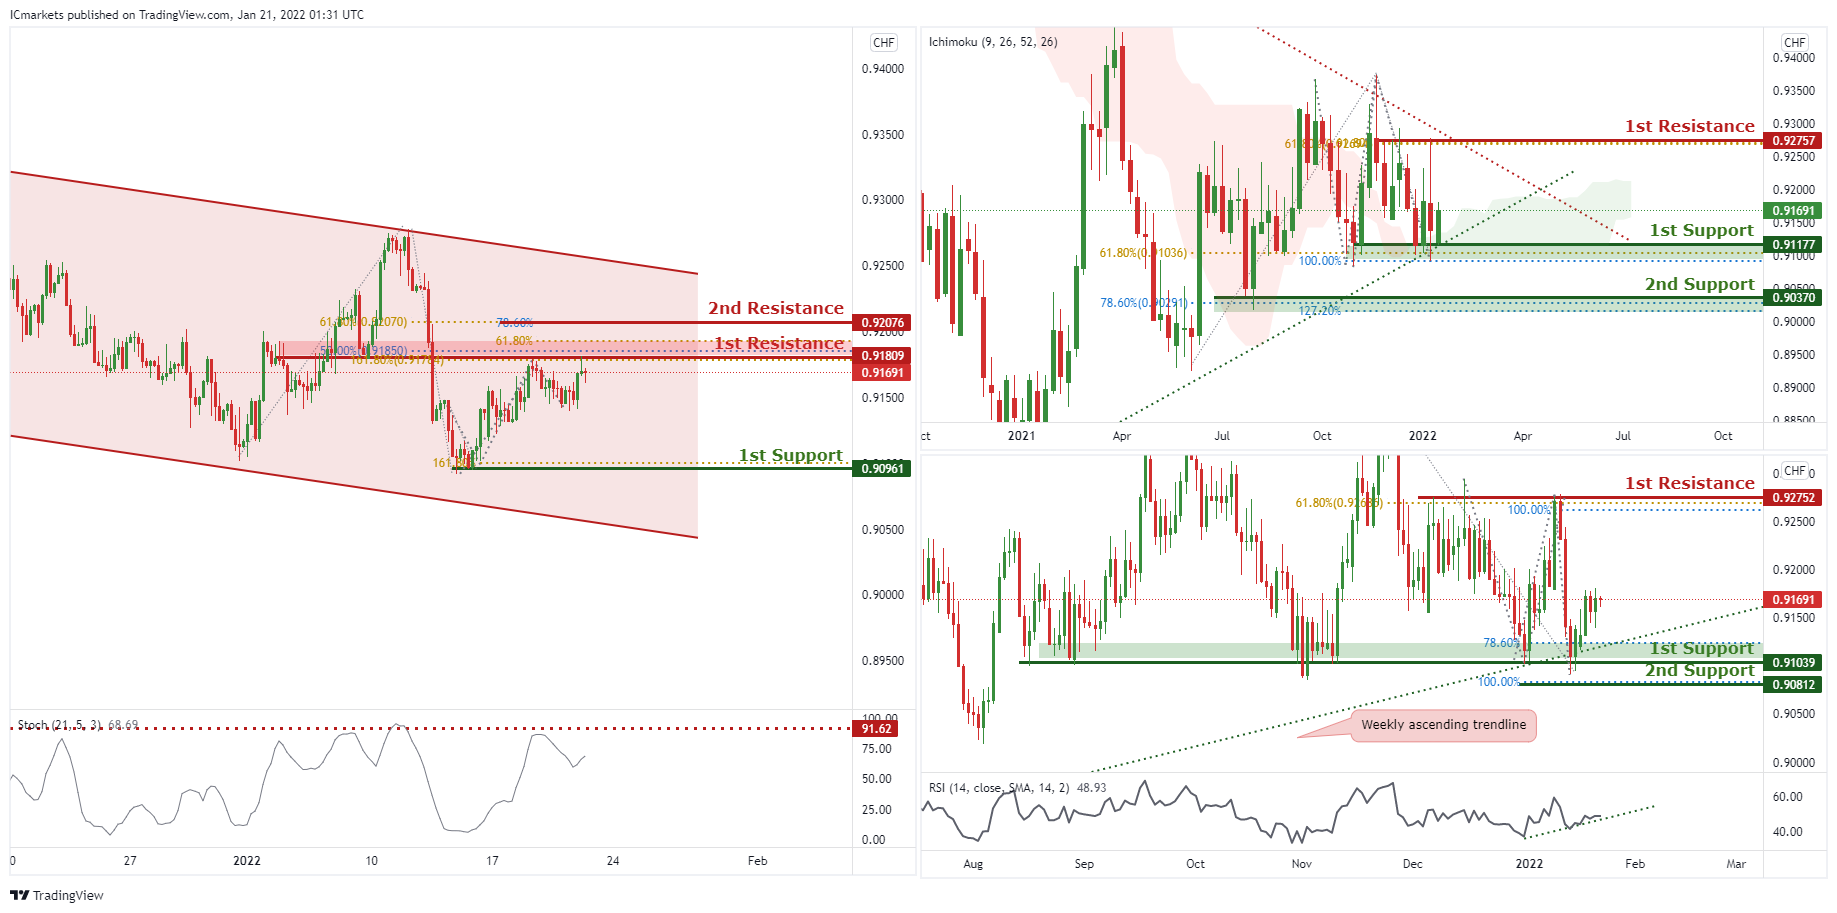
USD/CHF:
On the Weekly timeframe, price is reacting in a triangle pattern. Price is currently reacting at the 1st Support in line with ascending trendline support, 61.8% Fibonacci retracement and 100% Fibonacci projection. We can expect price to bounce from 1st Support towards 1st Resistance in line with 61.8% Fibonacci projection, 61.8% Fibonacci retracement and descending trendline resistance. On the Daily timeframe, price is abiding to the ascending trendline support on the weekly,we can expect an overall bullish momentum. Price could bounce from 1st Support in line with 78.6% Fibonacci retracement and 78.6% FIbonacci projection towards 1st Resistance in line with 61.8% Fibonacci retracement and 100% Fibonacci projection. Our bullish bias is further supported by the RSI indicator which is abiding to the ascending trendline.
On the H4 timeframe, price is abiding to a descending channel, signifying a bearish momentum. Price dropped from the 1st Resistance in line with 50% Fibonacci retracement, 161.8% Fibonacci extension and graphical overlap resistance. We can expect the price to drop to 1st Support in line with the previous swing low and 161.8% Fibonacci projection. Our bearish bias is further supported by the stochastic indicator where the %K Line dropped from the resistance level.
Areas of consideration:
- Watch 1st Support at 0.90961
- Watch 1st Resistance at 0.91809
EUR/USD :
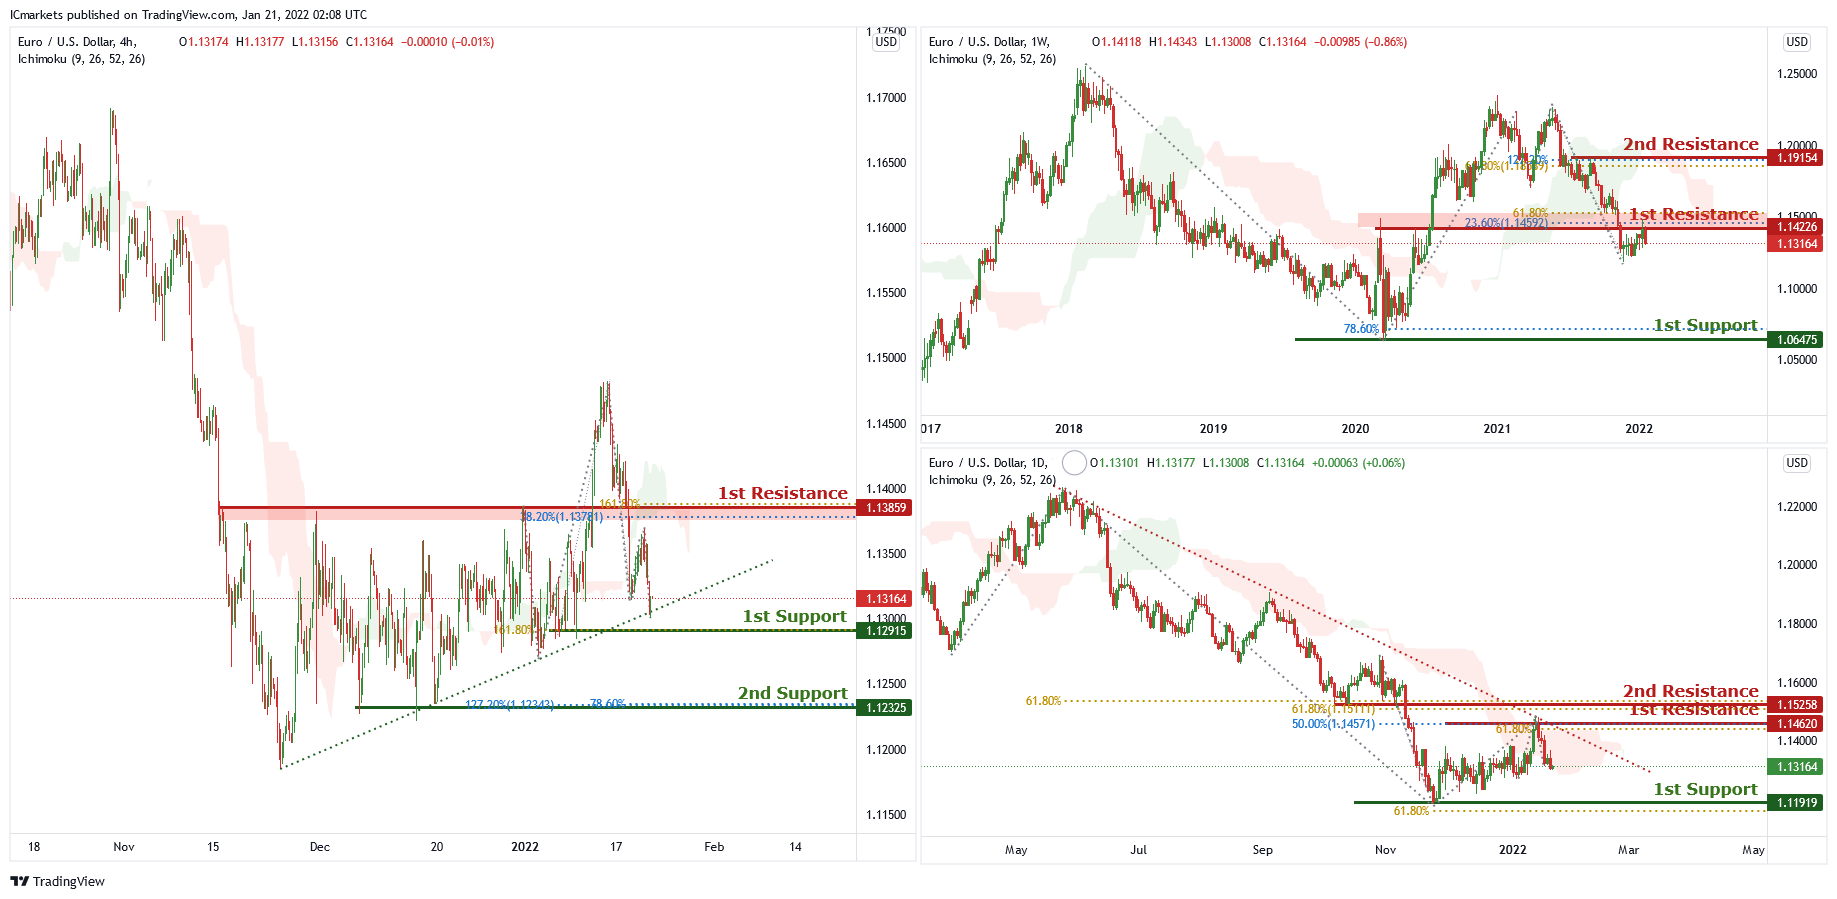
On the weekly chart, price is near the 1st resistance level of 1.14226 which is also 23.6% Fibonacci resistance and 61.8% Fibonacci projection. Price can dip to the 1st support of 1.06475 which is also 78.6% Fibonacci projection. Our bearish bias is supported by the ichimoku cloud indicator as price is trading below it.
On the daily chart, price is abiding by a descending trendline and near 1st resistance level of 50% Fibonacci retracement and 61.8% Fibonacci projection. Price can potentially dip to the 1st support level of 1.11919 which is also 61.8% Fibonacci projection. Our bearish bias is supported by the ichimoku cloud indicator as price is trading below it.
On the H4 chart , price is trading in an ascending trendline, and is near 1st support level of 1.12915 which is also 161.8% Fibonacci projection. Price can potentially go to the 1st resistance level of 1.13895 which is 161.8% Fibonacci projection and 38.2% Fibonacci retracement. Our bullish bias is supported by the stochastic indicator as it is near support level.
USD/JPY:
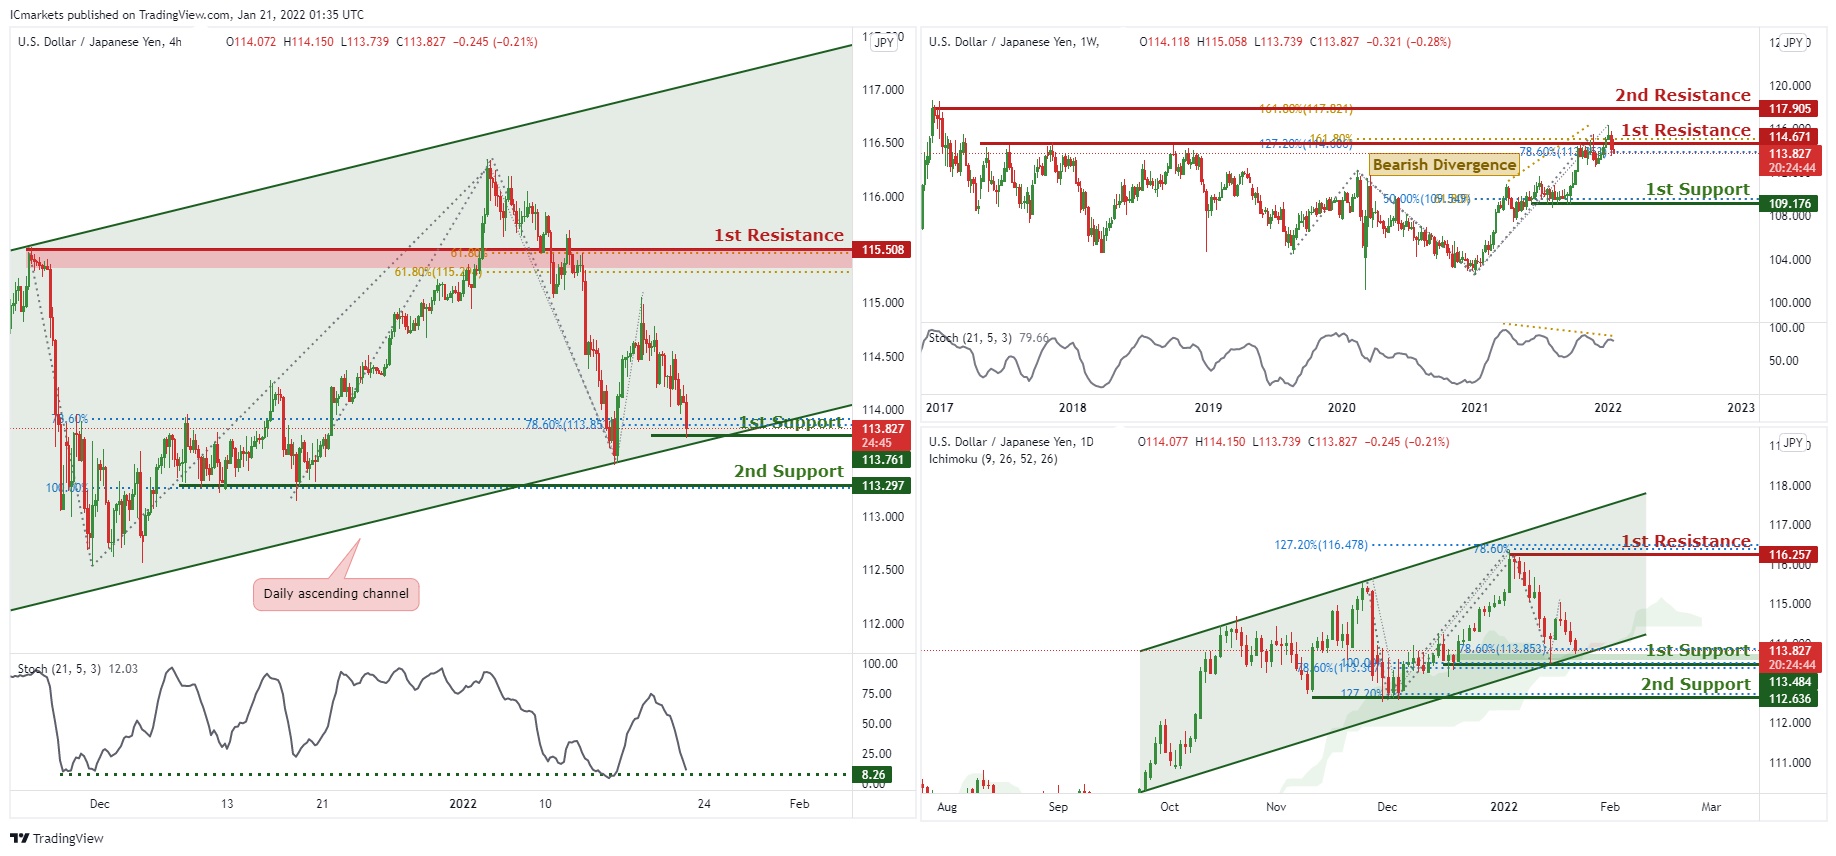
On the Weekly timeframe, we can see that price touched the 1st resistance in line with horizontal swing highs and 127.2% FIbonacci Retracement and 161.8% Fibonacci Projection. We can expect the price to drop from the 1st Resistance towards the 1st Support in line with 61.8% Fibonacci projection and 50% Fibonacci retracement. Our short-term bearish momentum is further supported by the stochastic %K line holding below the descending trendline resistance and a bearish divergence spotted. In reference to last week’s analysis, on the Daily timeframe price indeed dropped to the 1st Support. Price is now abiding to the ascending channel, we can expect price to bounce from 1st Support in line with 100% Fibonacci projection and 78.6% Fibonacci extension towards 1st Resistance in line with previous swing high, 127.2% Fibonacci expansion and 78,6% Fibonacci projection. Our bullish bias is further supported by the Ichimoku cloud acting as a support level.
On the H4 timeframe, is abiding to the ascending channel on the daily, signifying an overall bullish momentum. We can now expect price to bounce from 1st Support in line with 78.6% Fibonacci retracement and 78.6% Fibonacci projection towards 1st Resistance in line with 61.8% Fibonacci projection and 61.8% Fibonacci retracement. Our bullish bias is further supported by the stochastic indicator where the %K line is at the support level.
Areas of consideration:
- H4 1st resistance level 115.508
- H4 1st support level 113.761
AUD/USD:
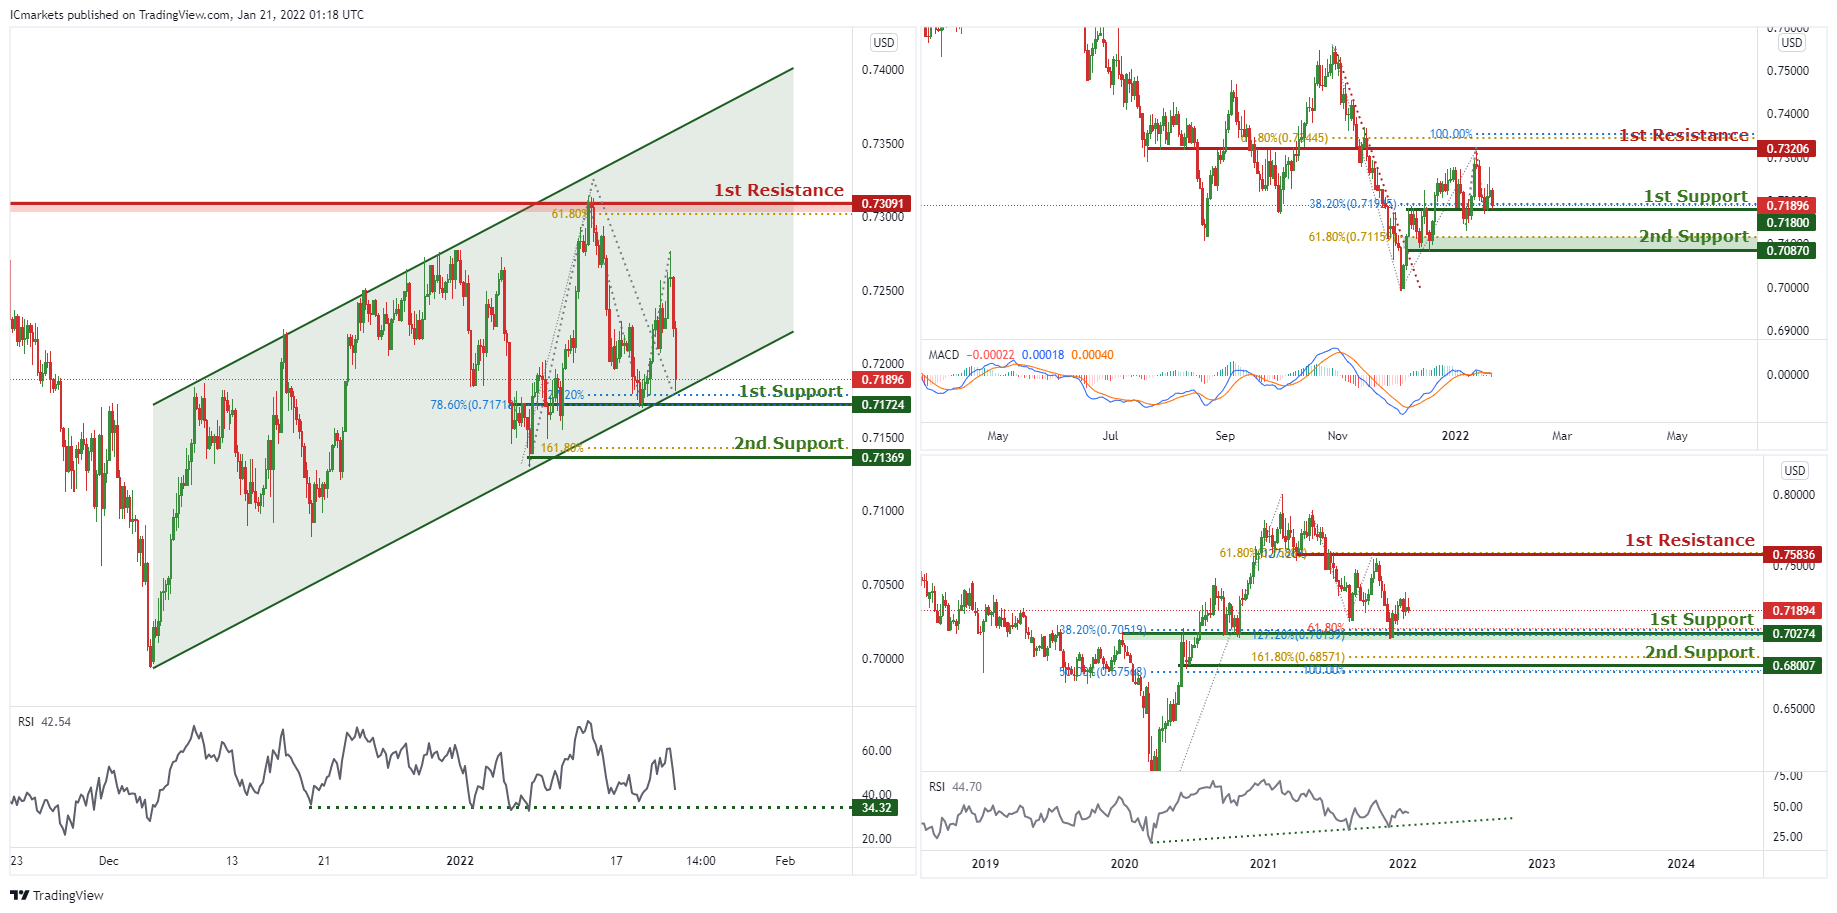
In reference to last week’s analysis, price has bounced nicely on the 1st Support. On the weekly, we can now expect the price to continue to push higher from the 1st Support in line with 61.8% Fibonacci projection, 38.2 % FIbonacci retracement and 127.2% Fibonacci extensions. Our bullish bias is further supported by the RSI indicator abiding to an ascending trendline. Traders should wait for prices to swing higher or lower before entering again. In reference to last week’s analysis price indeed bounced nicely on the 1st Support on the daily timeframe. On the Daily, the price is at the 1st support, we can expect the price to continue to push higher from 1st Support in line with 38.2% Fibonacci retracement towards 1st Resistance in line with 100% Fibonacci projection and 61.8% Fibonacci retracement. Our bullish bias is further supported by the MACD indicator where the MACD line is above the signal line.
On the H4, price is reacting within the ascending channel, signifying an overall bullish momentum. Price is approaching the 1st Support, we can expect to see price make a bullish bounce from 1st Support in line with 127.2% Fibonacci projection, 78.6% Fibonacci retracement and ascending channel support towards 1st Resistance in line with previous swing high and 61.8% Fibonacci projection. Our short-term bearish bias is further supported by the RSI indicator where it is approaching the support level.
Areas of consideration:
- H4 1st Support level 0.71724
- H4 1st resistance level 0.73091
NZD/USD:
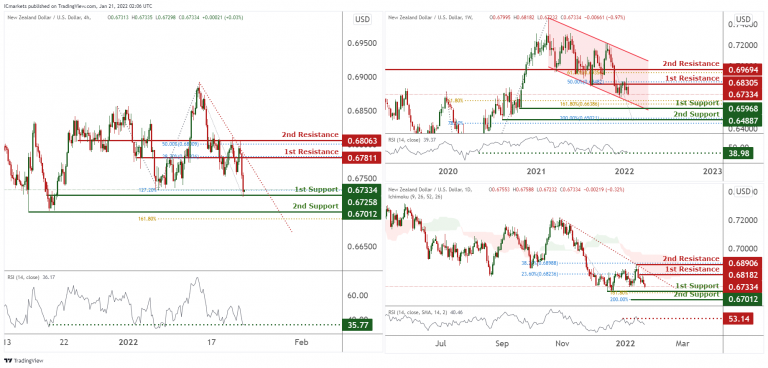
On the weekly, prices are on bearish momentum and abiding to our bearish channel. We see the potential for a dip from our 1st resistance at 0.68305 in line with 50% Fibonacci retracement towards our 1st support at 0.65968 which is an area of FIbonacci confluences.
On the daily, prices are on bearish momentum and abiding to a bearish trendline. We see the potential for further bearish continuation towards our 1st support at 0.67362 in line with 161.8% Fibonacci projection. RSI is at a level where dips occurred previously and prices are trading below our ichimoku clouds further supporting our bearish view.
On the H4, prices are on bearish momentum and abiding to a bearish trendline. We see the potential for a bounce from our 1st support at 0.67258 in line with 127.2% Fibonacci extension towards our 1st resistance at 0.67811. RSI is at a level where bounces occurred previously.
Areas of consideration:
- H4 time frame, 1st resistance at 0.67811
- H4 time frame, 1st support at 0.67258
USD/CAD:
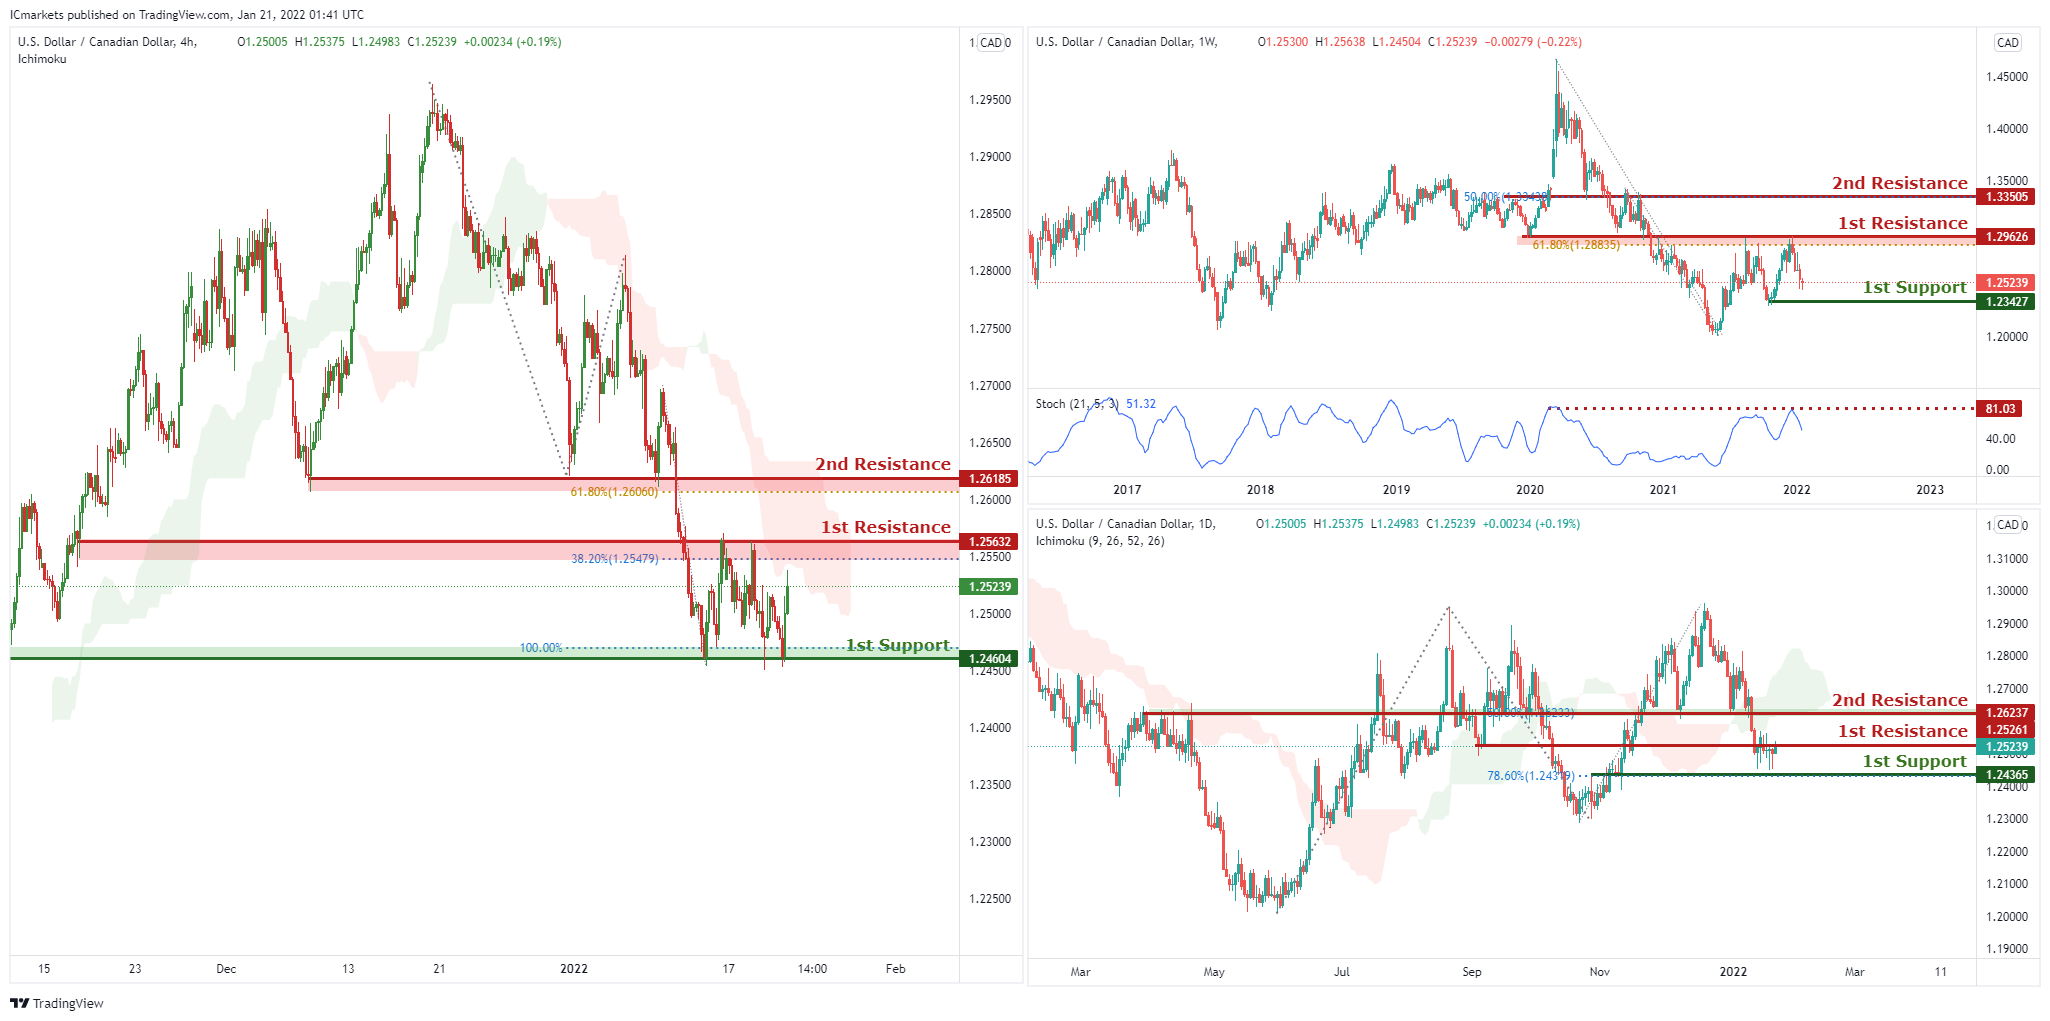
On the weekly, with price respecting the stochastics resistance, we have a bearish bias that price will from from our 1st resistance at 1.29626 which is in line with horizontal overlap resistance and 61.8% Fibonacci retracement to 1st support at 1.23427, which is in line with horizontal overlap support. Alternatively, price may break 1st resistance structure and head for 2nd resistance at 1.33505, which coincides with horizontal overlap resistance and 50% Fibonacci retracement.
On the daily, with price moving below the ichimoku cloud, we have a bearish bias that price will from from our 1st resistance at 1.25261 which is in line with horizontal overlap resistance to 1st support at 1.24365, which is in line with horizontal overlap support and 78.6% Fibonacci retracement level. Alternatively, price may break 1st resistance structure and head for 2nd resistance at 1.26237, which coincides with horizontal overlap resistance and 50% Fibonacci retracement.
On the H4, with price moving below the ichimoku cloud, we have a bearish bias that price will from from our 1st resistance at 1.25632 which is in line with horizontal overlap resistance and 38.2% Fibonacci retracement to 1st support at 1.24604, which is in line with horizontal overlap support and 100% Fibonacci projection level. Alternatively, price may break 1st resistance structure and head for 2nd resistance at 1.26185, which coincides with horizontal overlap resistance and 61.8% Fibonacci retracement.
Areas of consideration:
- H4 time frame, 1st support at 1.24604
- H4 time frame, 1st resistance at 1.25632
OIL:
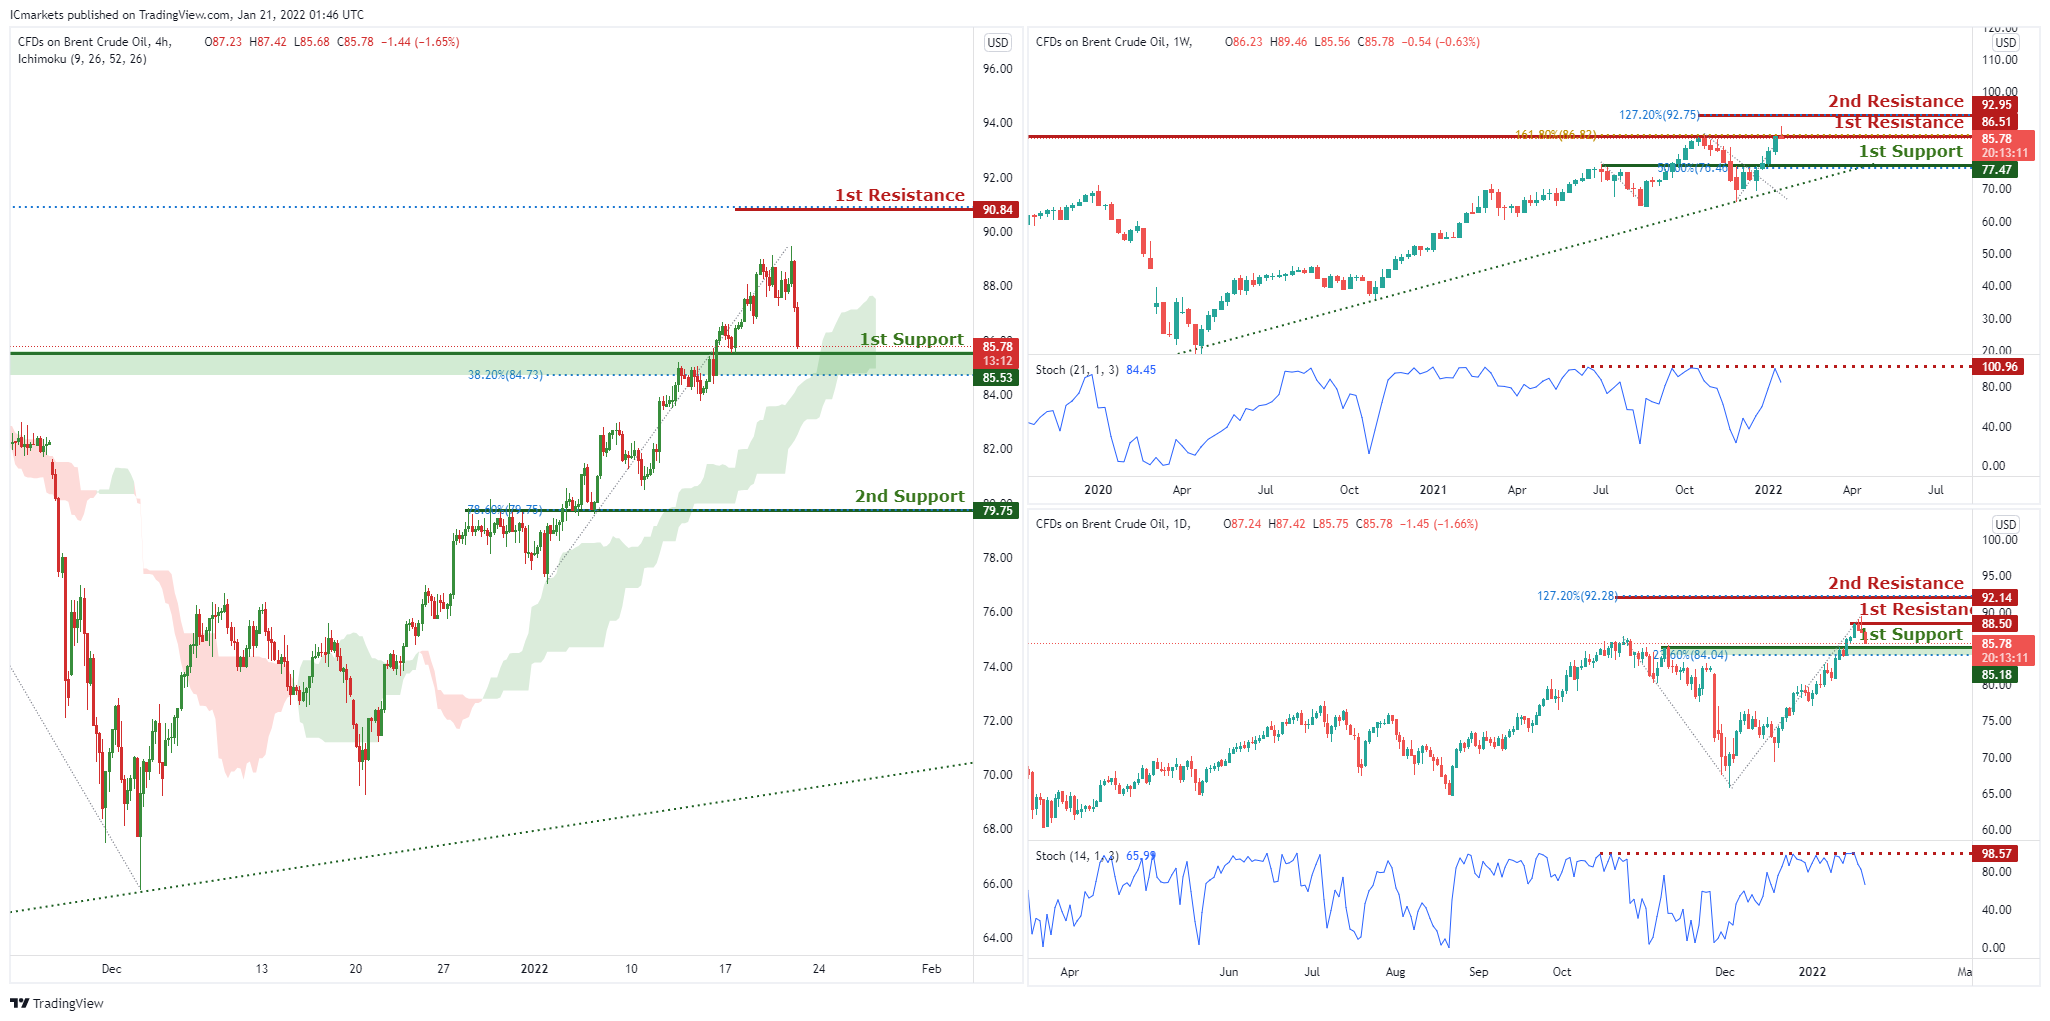
On the Weekly, with price moving below the ichimoku cloud, we have a bearish bias that price will from from our 1st resistance at 86.51 which is in line with horizontal overlap resistance and 161.8% Fibonacci extension to 1st support at 77.47, which is in line with horizontal overlap support and 50% Fibonacci retracement level. Alternatively, price may break 1st resistance structure and head for 2nd resistance at 92.95, which coincides with horizontal swing high resistance and 127.2% Fibonacci extension.
On the Daily, with price respecting the stochastics resistance, we have a bearish bias that price will drop from our 1st resistance at 88.5 which is in line with horizontal swing high resistance to 1st support at 85.18, which is in line with horizontal overlap support and 23.6% Fibonacci retracement level. Alternatively, price may break 1st resistance structure and head for 2nd resistance at 92.14, which coincides with horizontal overlap resistance and 127.2% Fibonacci extension.
On the H4, with price moving above the ichimoku cloud, we have a bullish bias that price will rise to our 1st resistance at 90.84 which is in line with horizontal swing high resistance and 127.2% Fibonacci extension level from 1st support at 85.53, which is in line with horizontal overlap support and 32.8% Fibonacci retracement. Alternatively, price may break 1st support structure and head for 2nd support at 79.75, which coincides with horizontal overlap support and 78.6% Fibonacci retracement.
Areas of consideration:
- H4 time frame, 1st resistance of 90.84
- H4 time frame, 1st support of 85.53
Dow Jones Industrial Average:
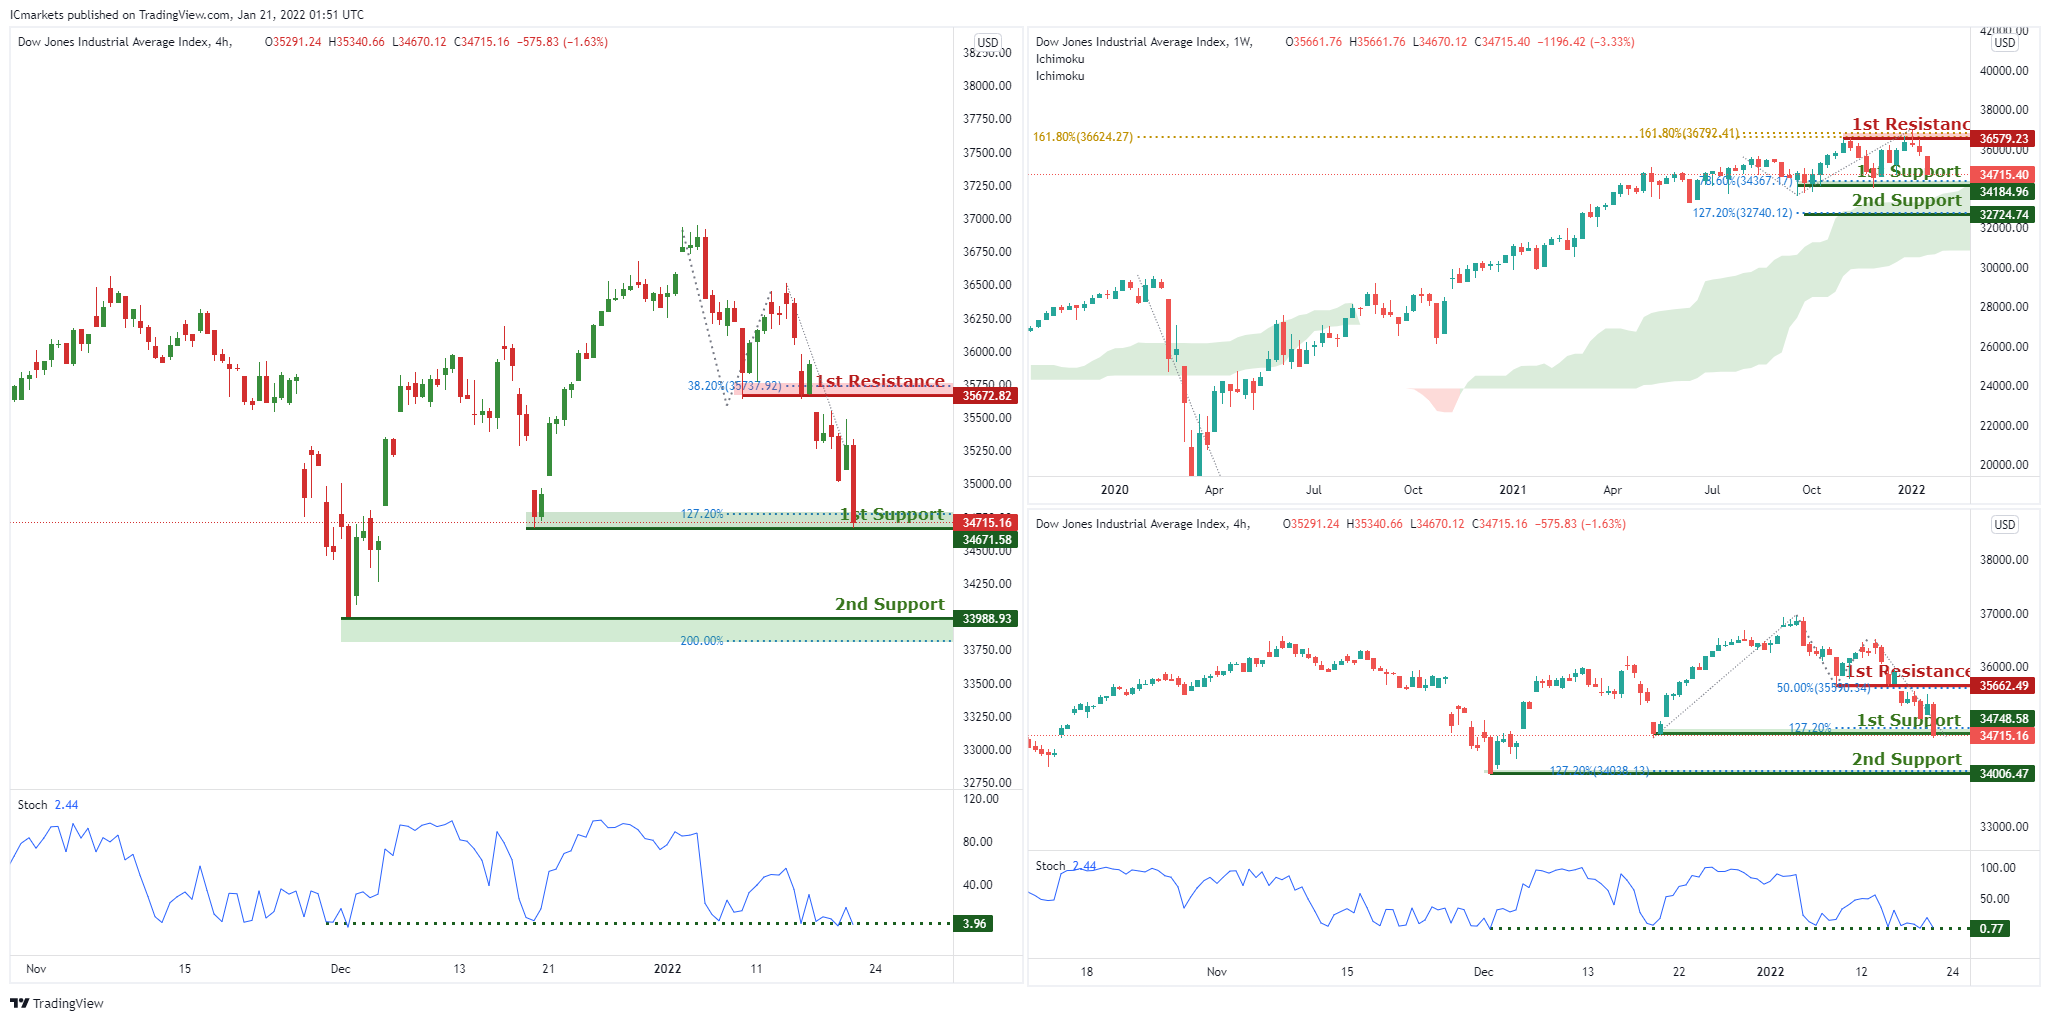
On the Weekly, with price moving above the ichimoku cloud, we have a bullish bias that price will rise to our 1st resistance at 36579 which is in line with horizontal swing high resistance and 161.8% Fibonacci extension level from 1st support at 34184, which is in line with horizontal overlap support and 78.6% Fibonacci retracement. Alternatively, price may break 1st support structure and head for 2nd support at 32724, which coincides with horizontal overlap support and 127.2% Fibonacci extension.
On the Daily, with price moving above the ichimoku cloud, we have a bullish bias that price will rise to our 1st resistance at 35662 which is in line with horizontal swing high resistance and 50% Fibonacci retracement level from 1st support at 34748, which is in line with horizontal overlap support and 127.2% Fibonacci extension. Alternatively, price may break 1st support structure and head for 2nd support at 34006, which coincides with horizontal overlap support and 127.2% Fibonacci extension.
On the H4, with price moving above the ichimoku cloud, we have a bullish bias that price will rise to our 1st resistance at 35672 which is in line with horizontal swing high resistance and 38.2% Fibonacci retracement level from 1st support at 34671, which is in line with horizontal overlap support and 127.2% Fibonacci extension. Alternatively, price may break 1st support structure and head for 2nd support at 33988, which coincides with horizontal overlap support and 200% Fibonacci extension.
Areas of consideration:
- H4 time frame, 1st resistance of 35672
- H4 time frame, 1st support of 34671
USD/JPY Could Resume Decline, 113.20 Holds The Key
Key Highlights
- USD/JPY started a fresh decline below the 115.00 support.
- A major bearish trend line is forming with resistance near 114.60 on the 4-hours chart.
- EUR/USD is facing resistance near 1.1400, GBP/USD started a fresh increase above 1.3600.
- Gold price started a fresh increase above the $1,830 resistance zone.
USD/JPY Technical Analysis
The US Dollar struggled to clear the 116.30 zone against the Japanese Yen. USD/JPY started a fresh decline below the 116.00 and 115.80 support levels.
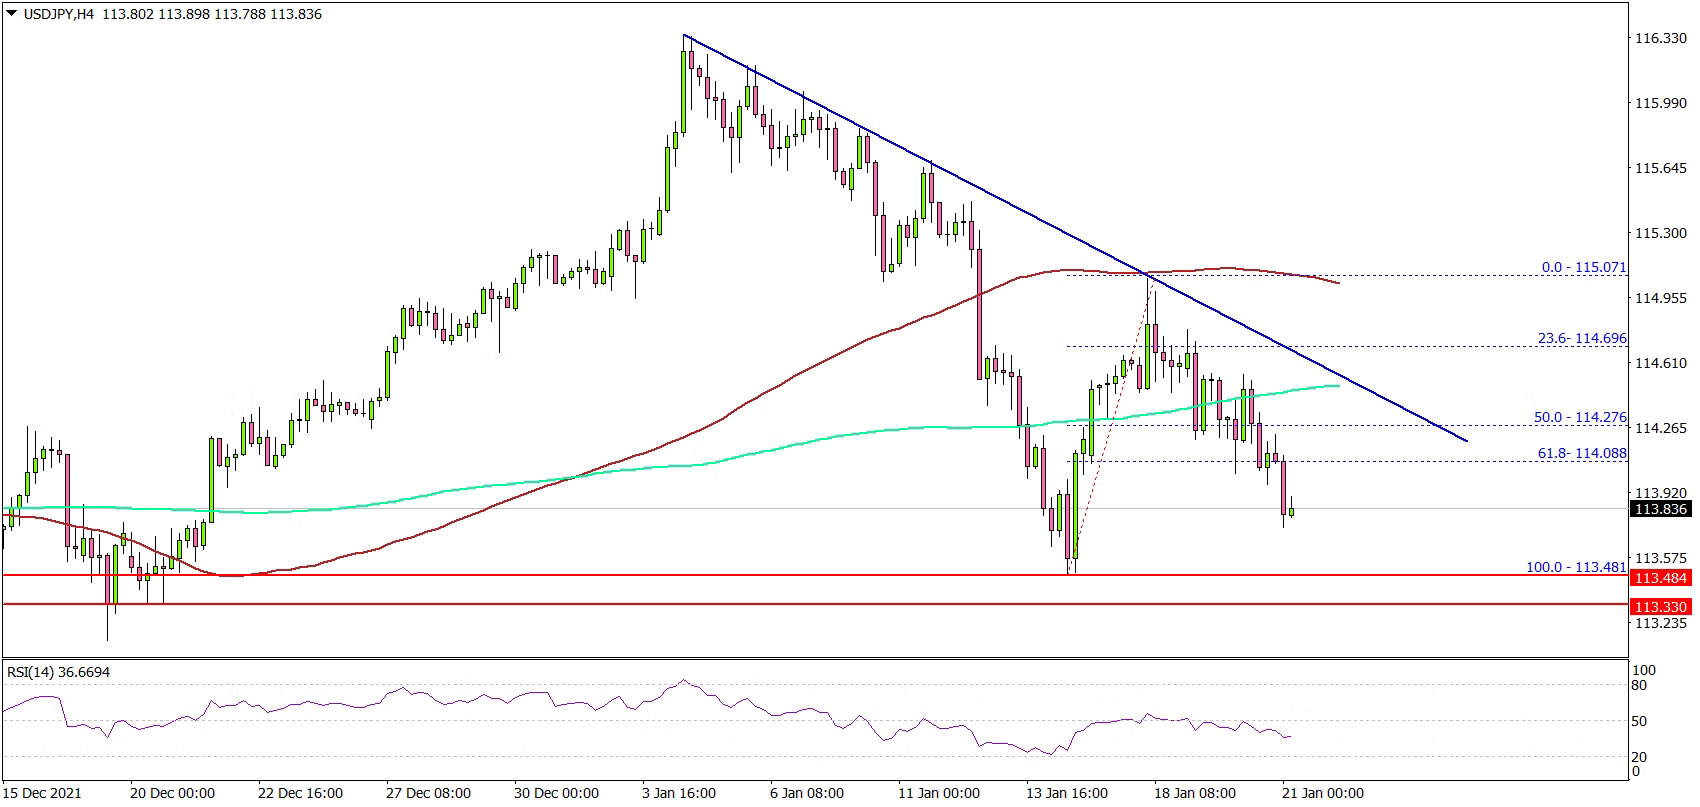
Looking at the 4-hours chart, the pair settled below the 115.00 level and the 100 simple moving average (red, 4-hours). There was a move below the 50% Fib retracement level of the upward move from the 113.48 swing low to 115.07 high.
There was also a break below the 114.20 support and the 200 simple moving average (green, 4-hours). On the downside, an immediate support is near the 113.65 level. The main support is near the 113.50 level.
If there is a downside break, the pair could continue to move down towards the 113.00 level. Any more losses might send the pair towards the 112.50 level.
On the upside, the pair is facing resistance near 114.60 level. There is also a major bearish trend line forming with resistance near 114.60 on the same chart. The next major resistance is near the 115.00 level, above which the pair could test 115.50.
Looking at EUR/USD, the pair is now facing resistance near the 1.1400 level. Conversely, GBP/USD started a steady increase above the 1.3600 resistance zone.
Economic Releases
- UK Retail Sales for Dec 2021 (YoY) - Forecast +3.4%, versus +4.7% previous.
- UK Retail Sales for Dec 2021 (MoM) - Forecast -0.6%, versus +1.4% previous.
Elliott Wave View: EURUSD Has Resumed Lower
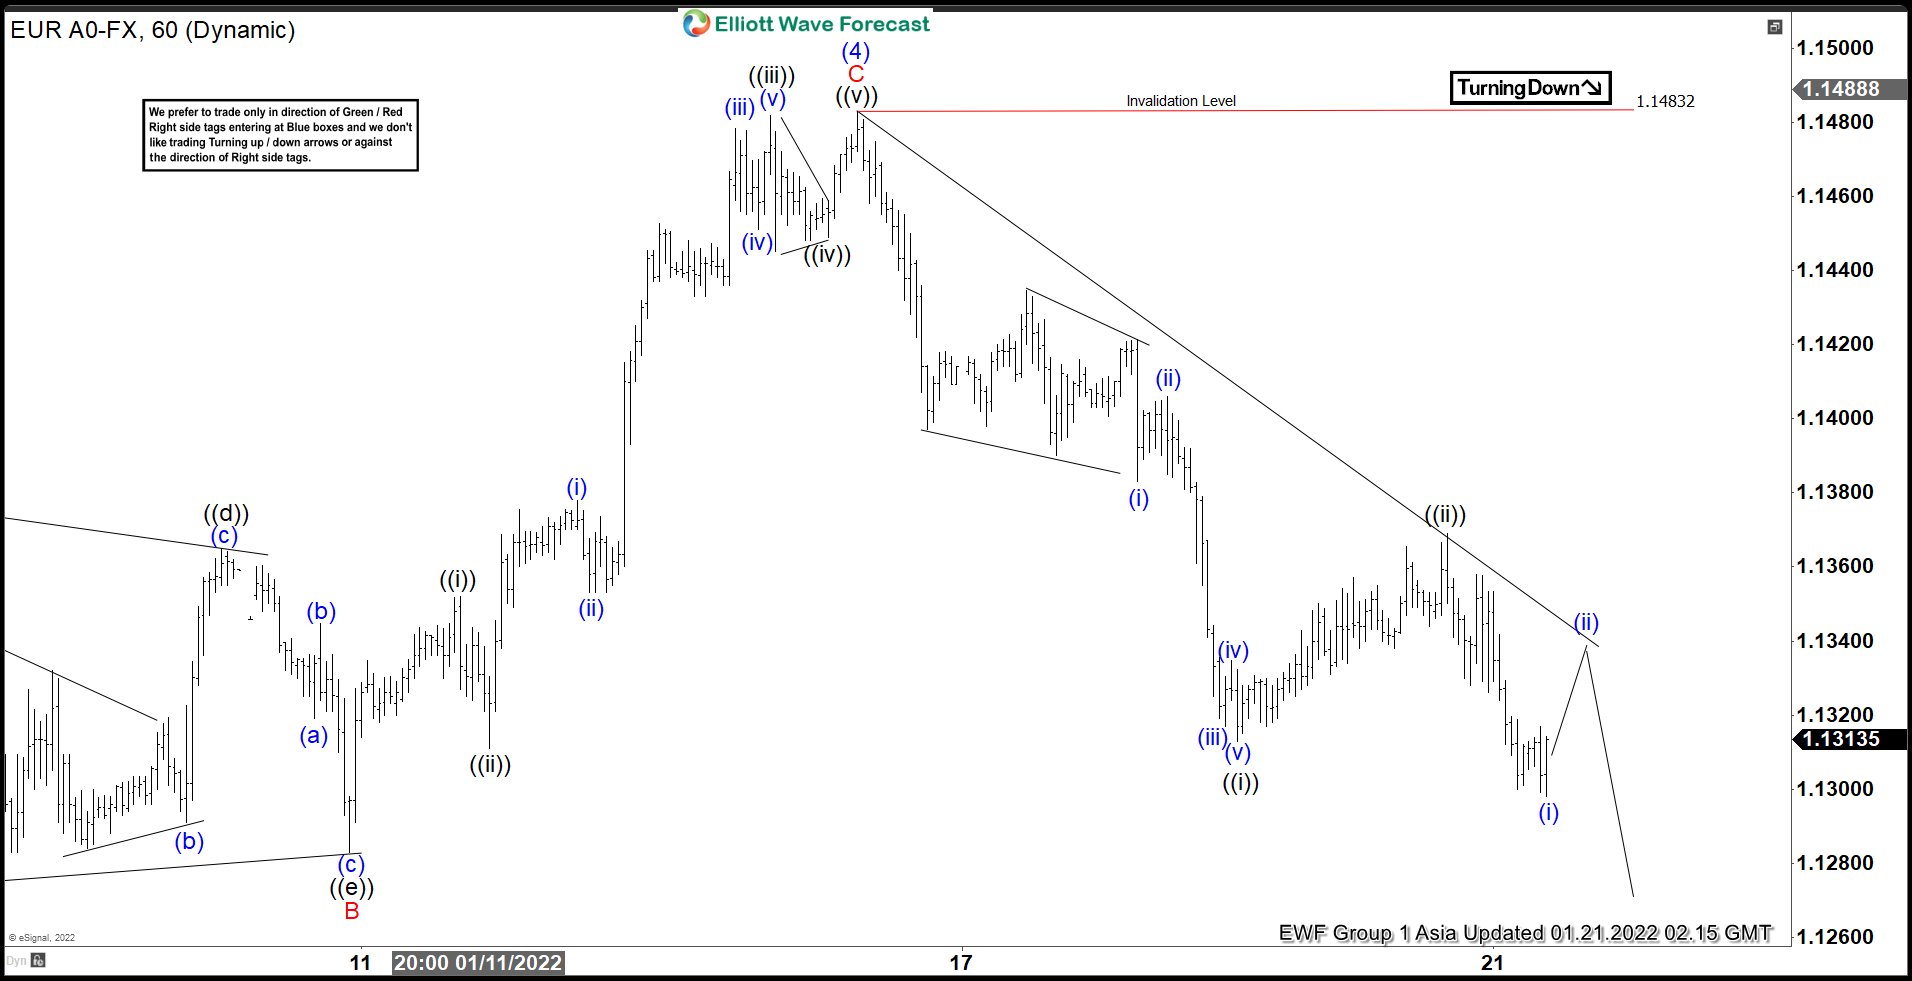
Short Term Elliott Wave view in EURUSD suggests rally to 1.1483 ended wave (4). Internal of wave (4) unfolded as an ABC zigzag Elliott Wave structure. In the 1 hour chart below, wave B ended as a triangle and wave C higher subdivided as a 5 waves impulse structure. Up from wave B, wave ((i)) ended at 1.135 and dips in wave ((ii)) ended at 1.1311. Pair then extended rally higher in wave ((iii)) towards 1.148 and dips in wave ((iv)) ended at 1.145. Final leg higher wave ((v)) ended at 1.148. This completed wave C and (4) in higher degree.
Pair has turned lower in wave (5). However, it still needs to break the previous low on November 24, 2021 low at 1.1185 to rule out a double correction higher. Down from wave (4), wave (i) ended at 1.138 and rally in wave (ii) ended at 1.1406. Pair then extended lower in wave (iii) towards 1.1317, wave (iv) ended at 1.1334, and final leg lower wave (v) ended at 1.1313 which completed wave ((i)). Rally in wave ((ii)) has also ended at 1.13769. While rally fails below there, and more importantly below 1.1483, expect pair to see further downside. Near term, as far as pivot at 1.1483 stays intact, expect rally to fail in 3, 7, or 11 swing for further downside.
EURUSD 1 Hour Elliott Wave Chart
Global Indices Bounce Off Major Levels
So far this year, volatility has been quite high as investors respond to high levels of inflation around the world, central bank policy tightening and another wave of coronavirus. We have seen some global indices fall sharply, especially in the US, while others have continued higher or consolidated. US technology and small cap shares have taken the brunt of the sell-off due to rising bond yields, while banks and industrials have outperformed. So, it has been quite a mixed start to the new year. With some of the major indices now testing key support levels, it is possible we may be heading for a period of relative calm as dip buyers take advantage of downbeat stocks and sectors.
Below I have shared several charts of the major indices. In a nutshell, it looks like markets in China and Hong Kong are showing potential bottoming signs following months of underperformance. The PBOC has started to loosen its policy again, which explains part of the reason for this. Meanwhile, hopes that the global economy will rebound after the latest wave of coronavirus should lead to higher levels of demand for Chinese exports. Elsewhere, the UK’s FTSE is continuing to outperform Europe, thanks to its high concentration of banks and resources stocks that tend to do well when yields are on the rise. Mainland European indices appear to be consolidating in bullish continuation patterns. Germany's tech index has possibly created a false breakdown bullish reversal pattern. US indices look the weakest, although the Dow and Nasdaq have both bounced off their respective key support levels and 200-day moving averages, with the latter having fallen 10% from its record high. But with the upcoming technology sector earnings, some investors are undoubtedly looking for at least short-term dip-buying opportunities.
Without further ado…
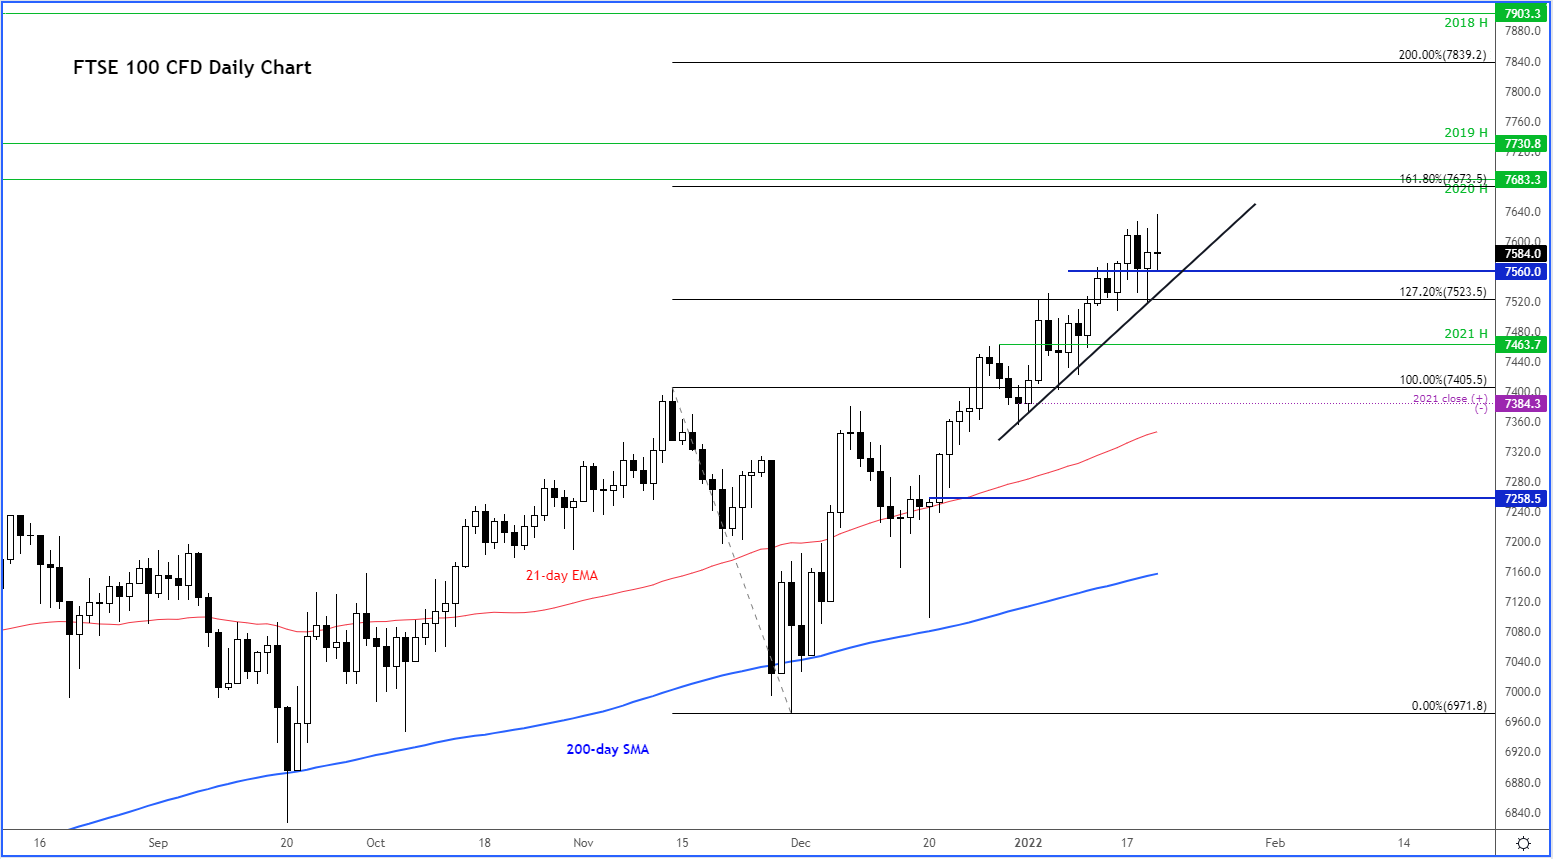
The FTSE is making higher highs and higher lows. It looks like investors are targeting the previous years’ highs:
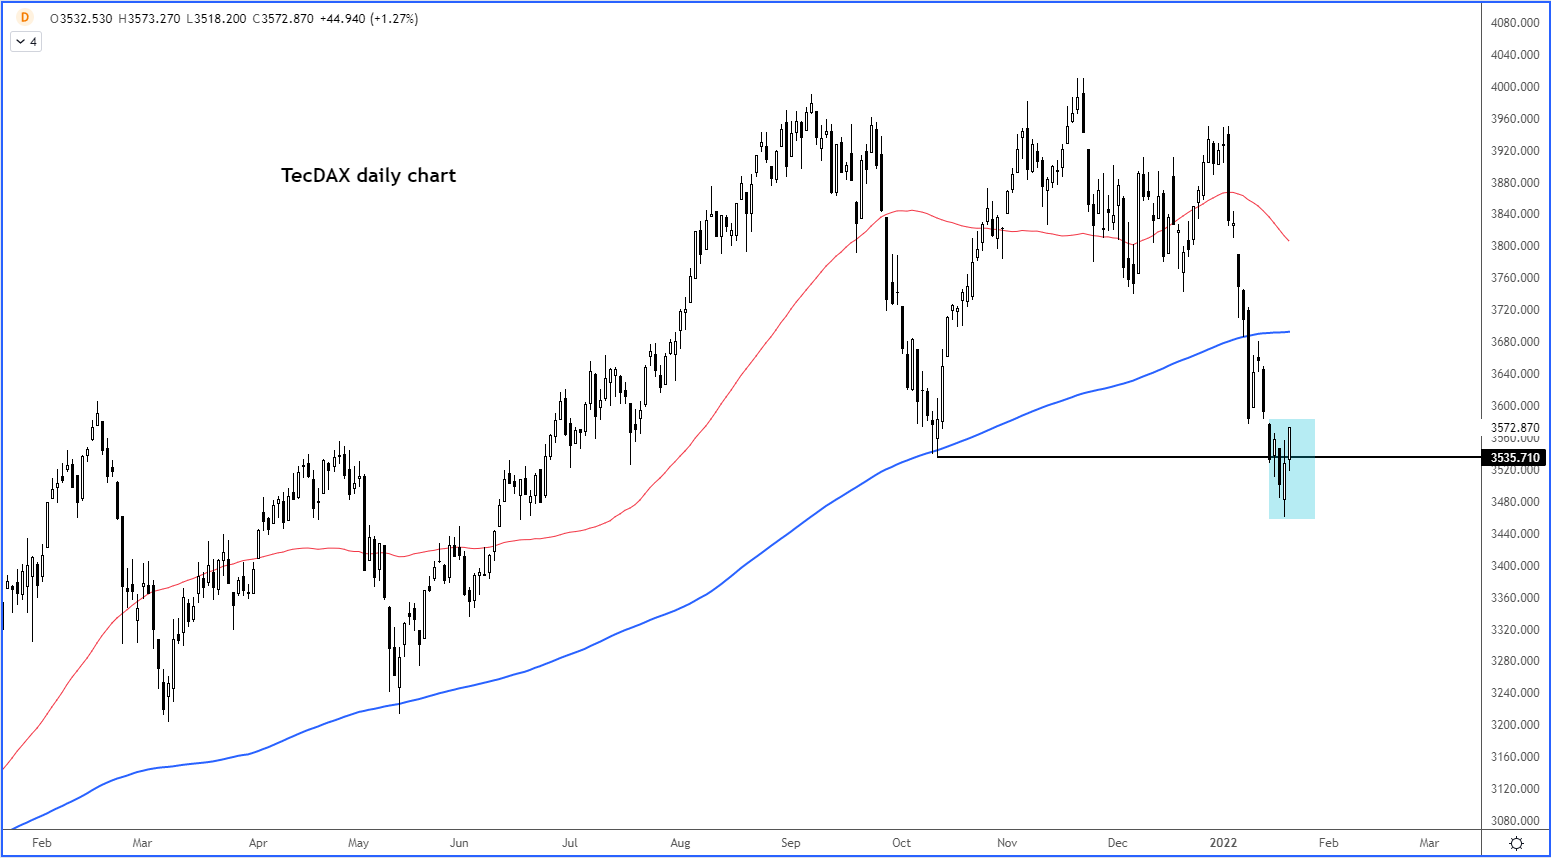
The TecDAX index has bounced sharply after briefly breaking its old low, thus forming a possible bottom sign (false break):
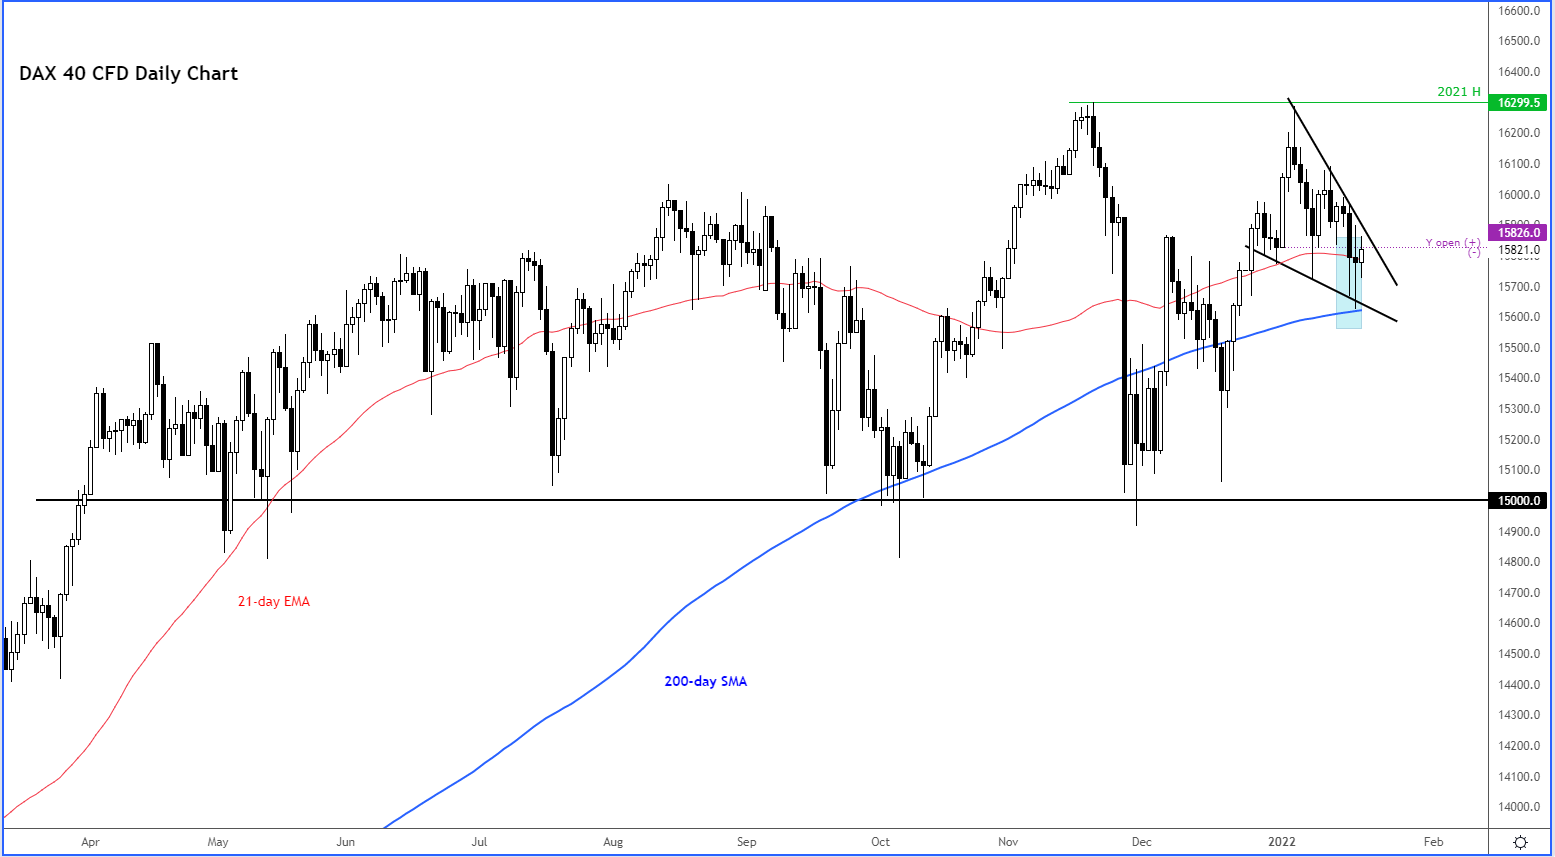
The DAX itself is holding its own above the 200-day average and consolidating inside a falling wedge pattern, which is a bullish continuation pattern. Will we see a breakout?
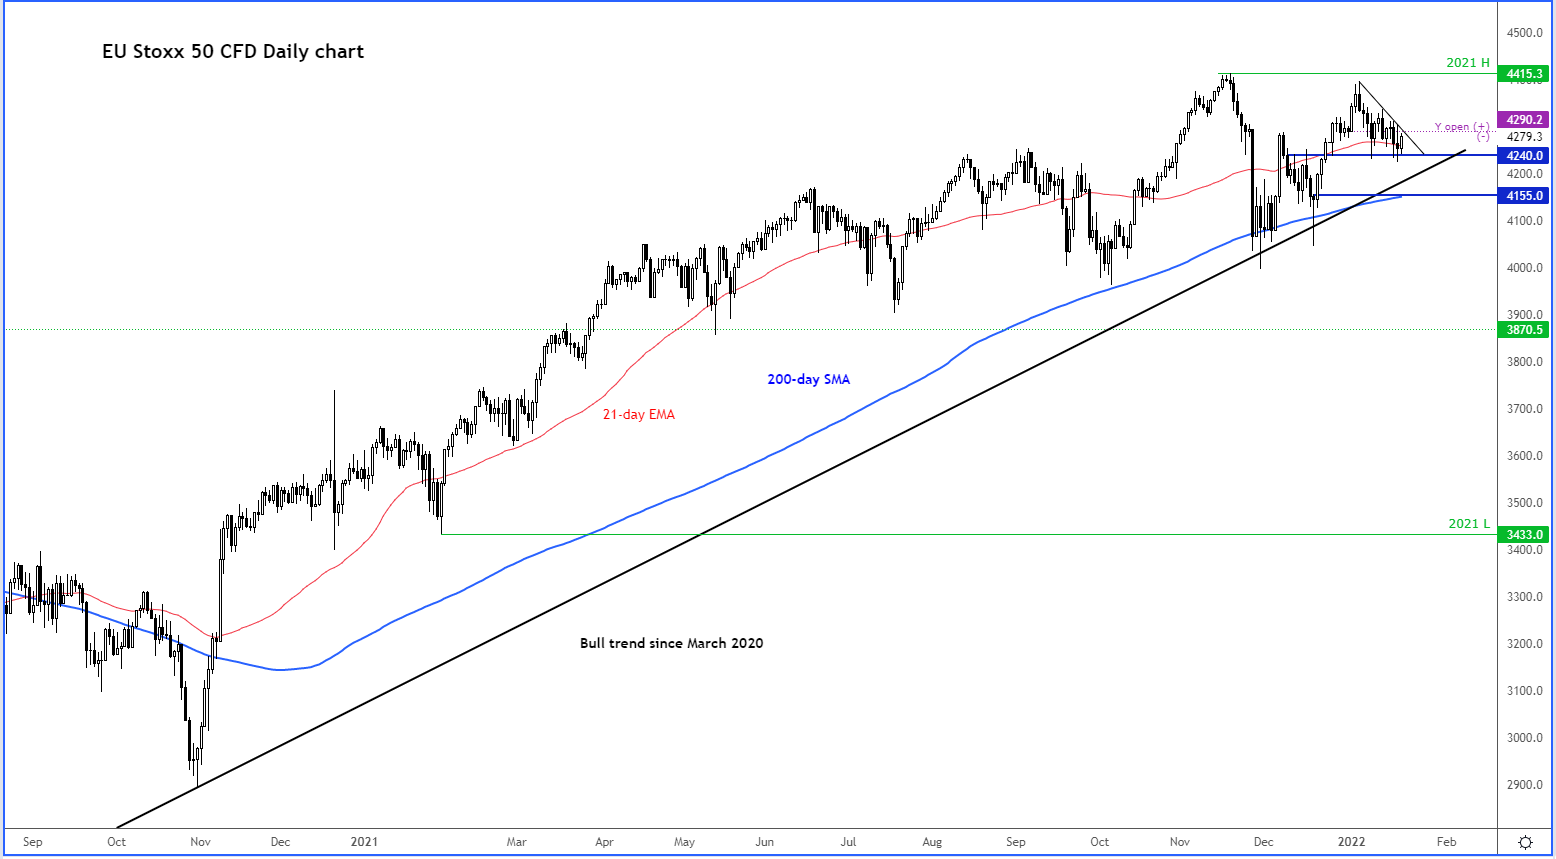
The Europe Stoxx 50 index is showing a similar pattern as the DAX (above) and other mainland European indices: bullish consolidation. Here’s how the daily looks like:
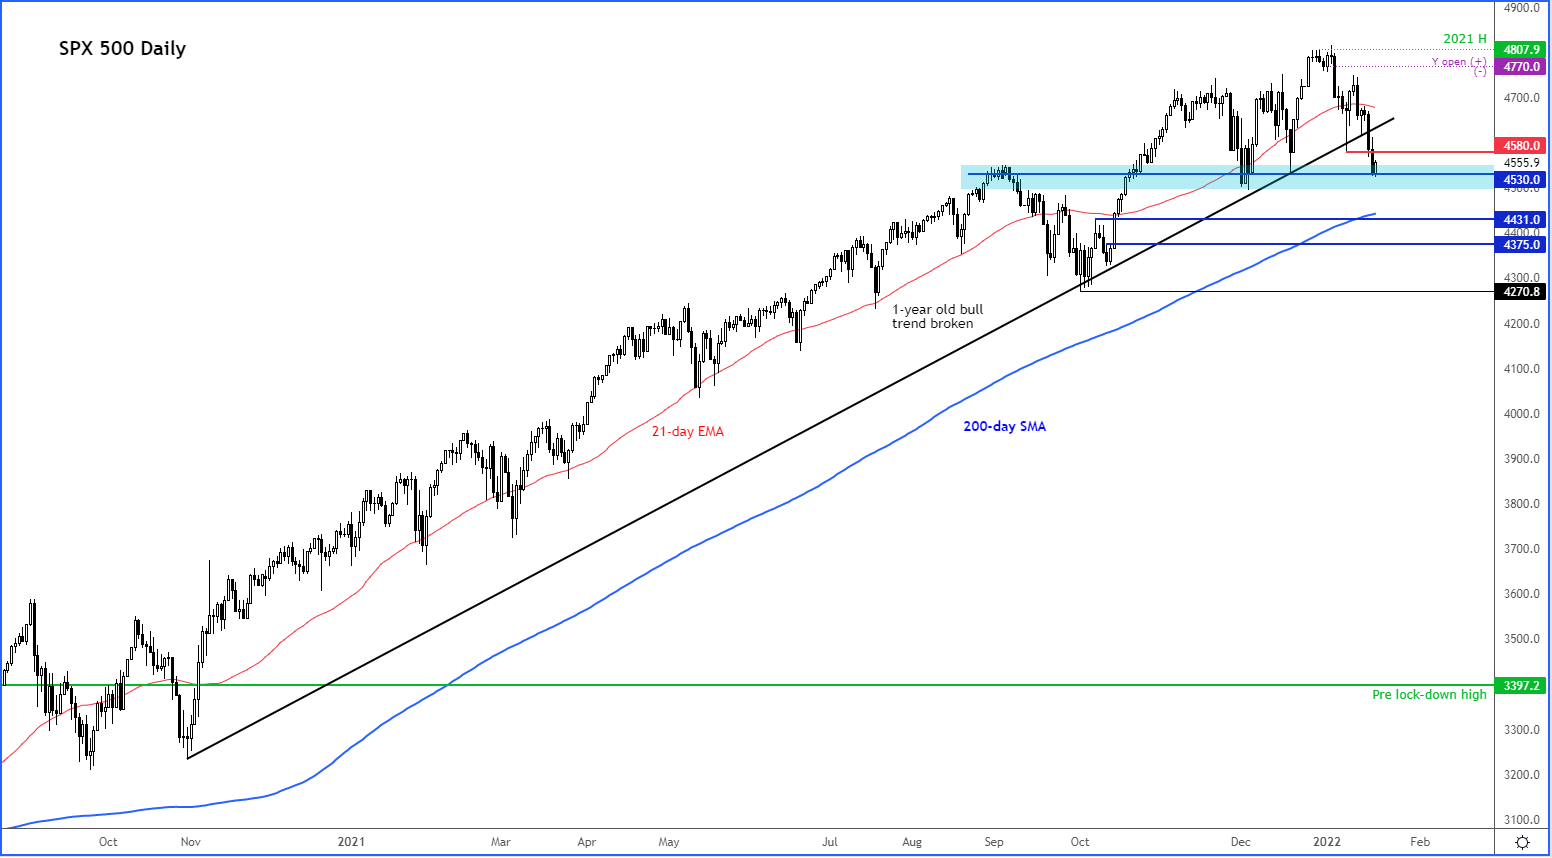
The S&P 500 is testing horizontal support around 4530, but with the bullish trend line broken, the US benchmark index doesn’t appear as bullish as some of the indices above.
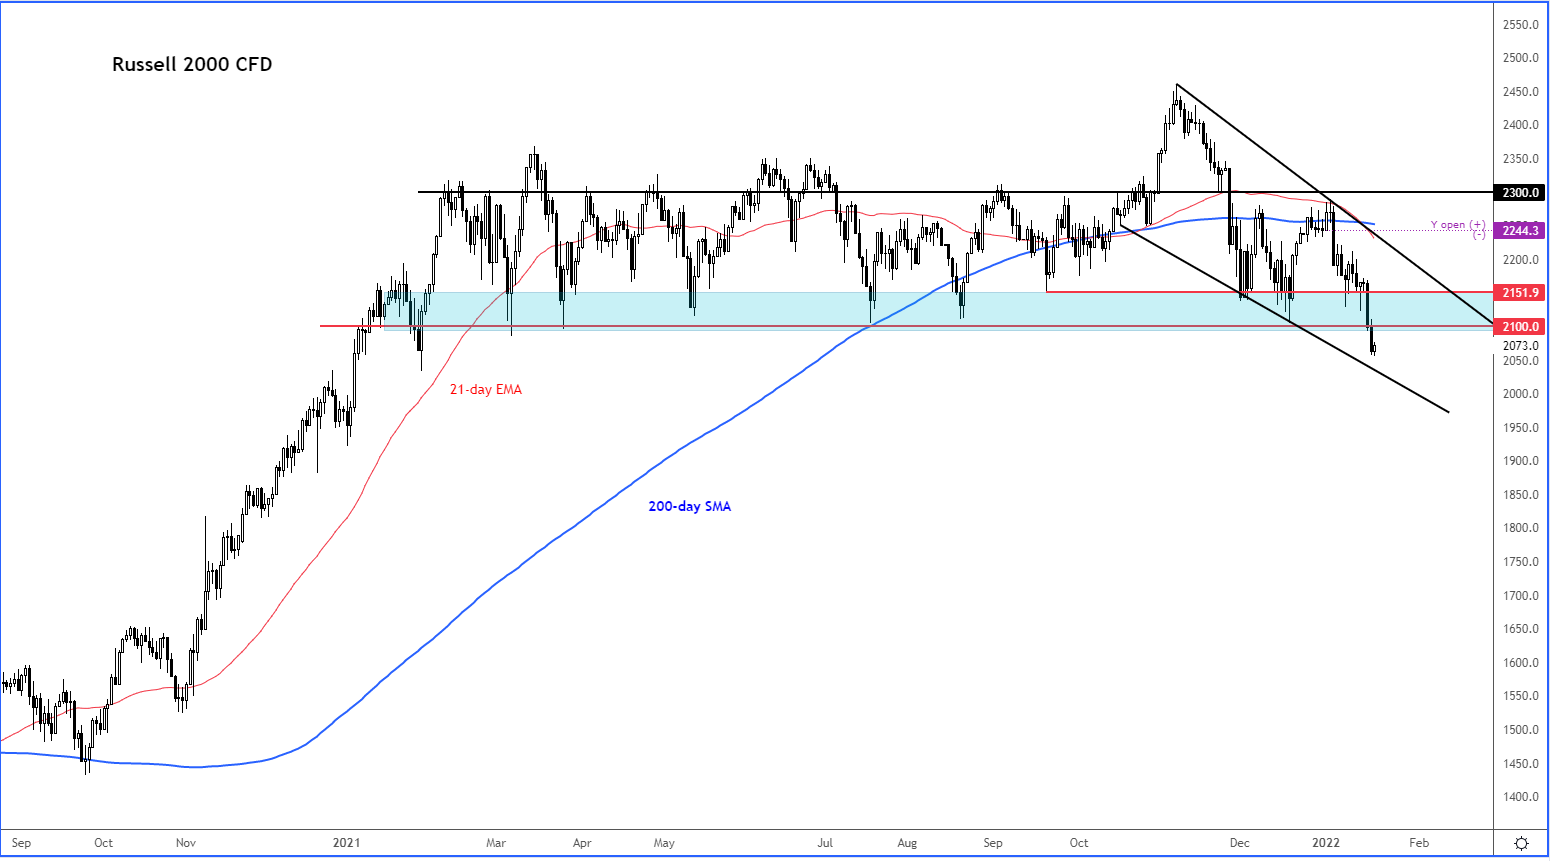
The Russell is also not looking very strong, having broken support around 2100. The bulls will need to reclaim that level and 2150ish before this market looks bullish again.
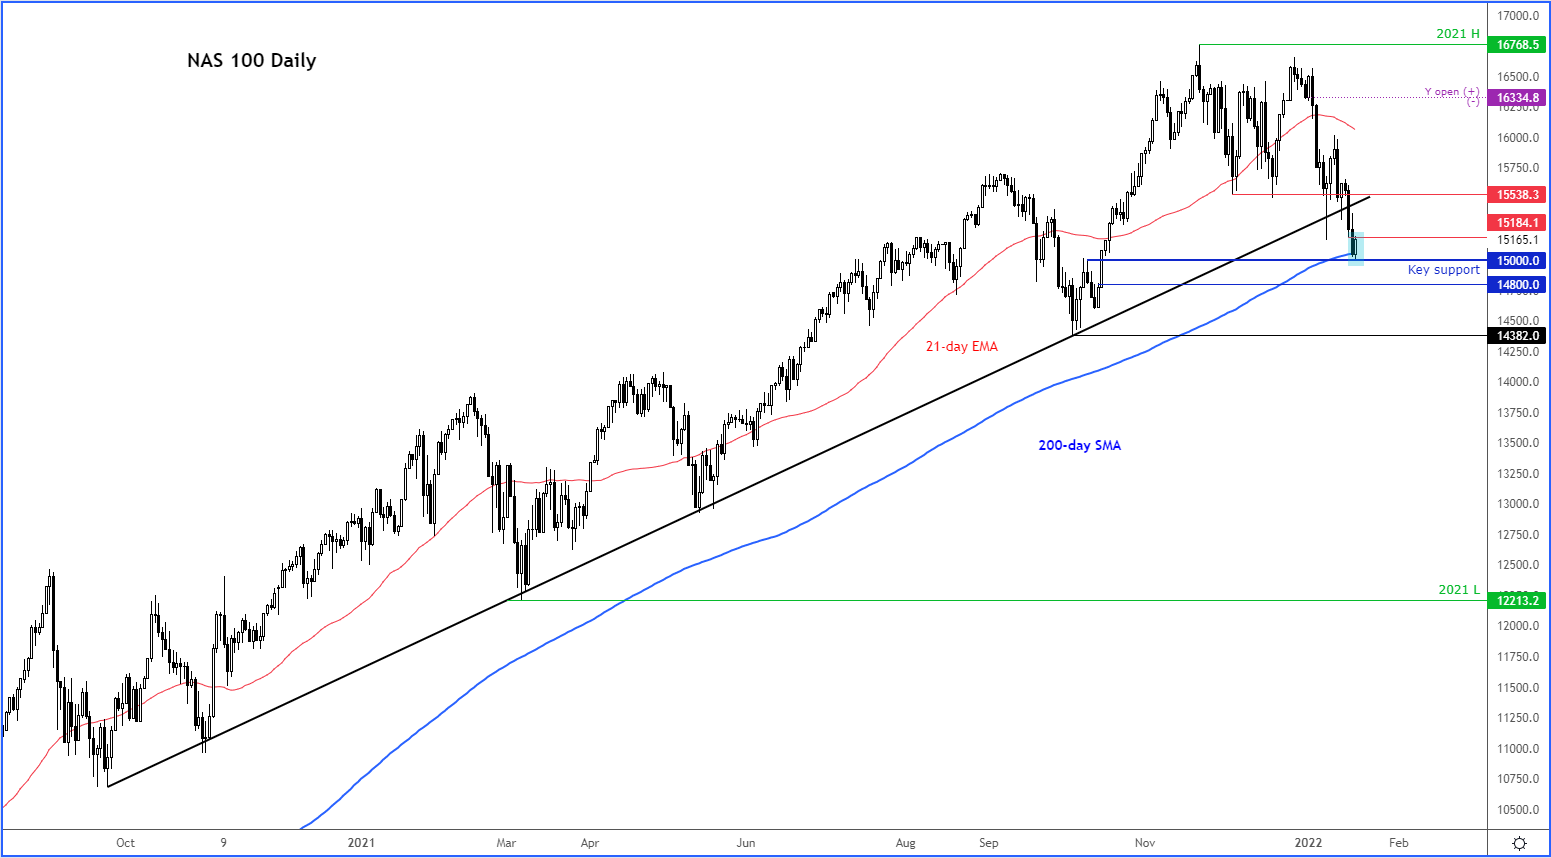
The Nasdaq 100 is bouncing right where it should: 15,000. This area marks the convergence of 200-day average with the previous breakout area. Are we going to see the bulls return here?
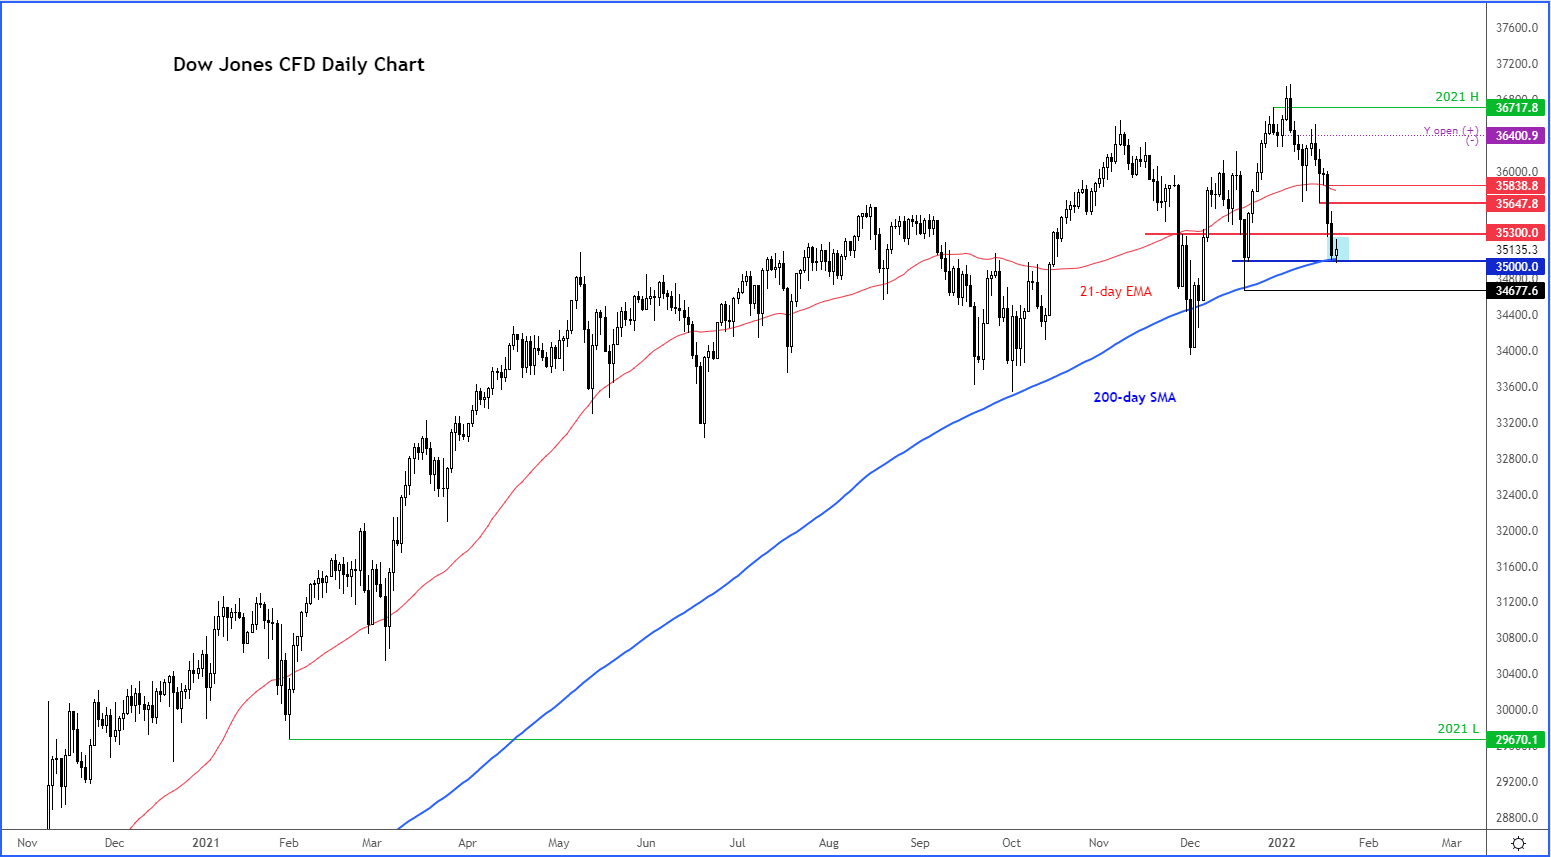
The Dow is also bouncing from its 200-day average. Given the stronger performance of industrial stocks around the world, the DJIA could potentially form a base here:
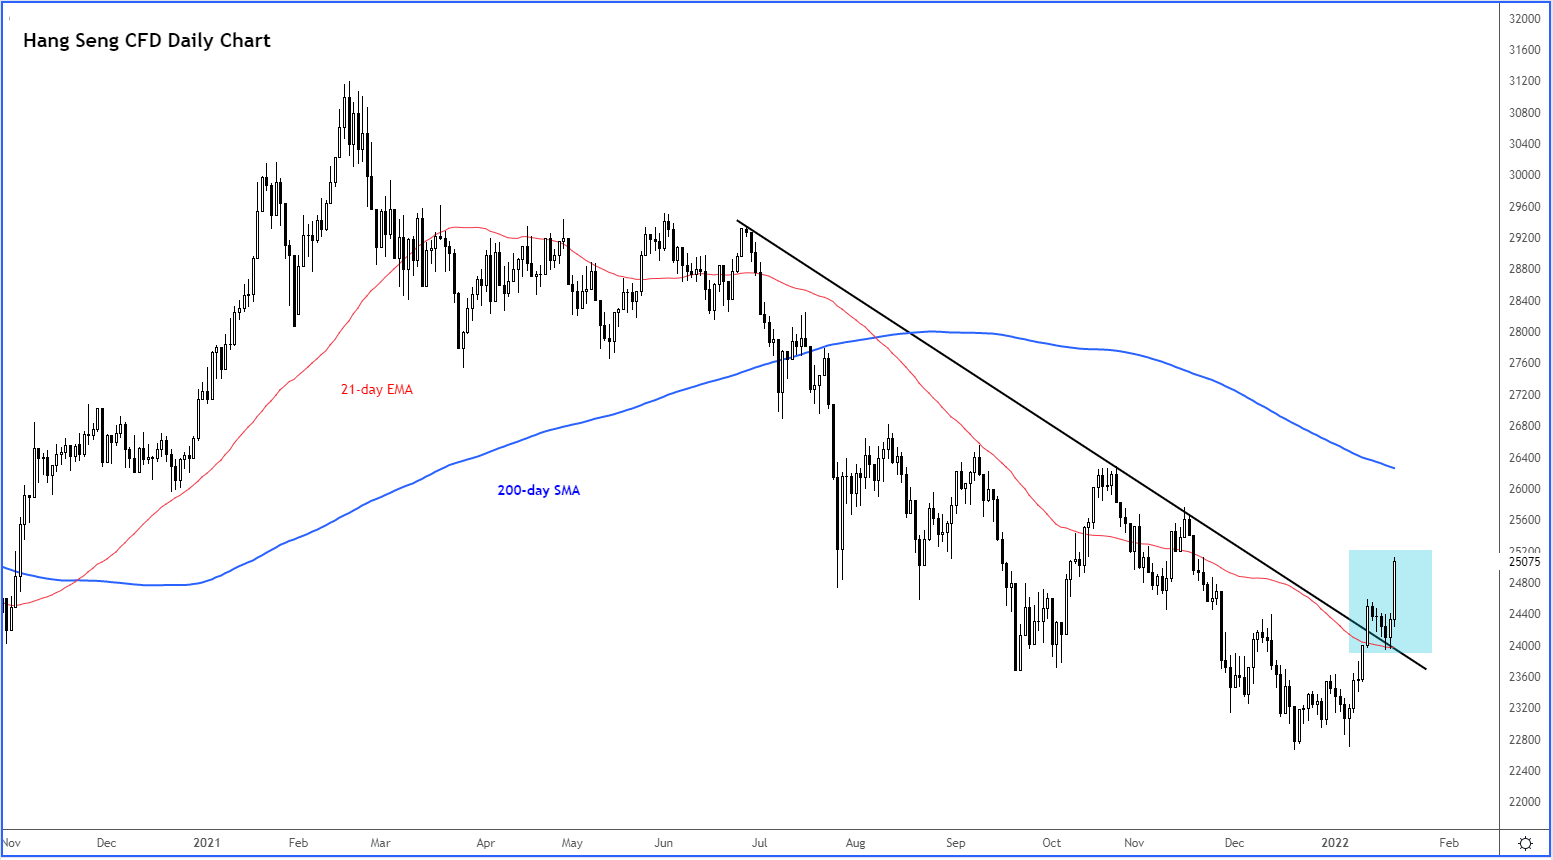
The Hang Seng index has broken above its bearish trend line after spending several months in a downtrend. This is potentially the start of a strong bull trend:
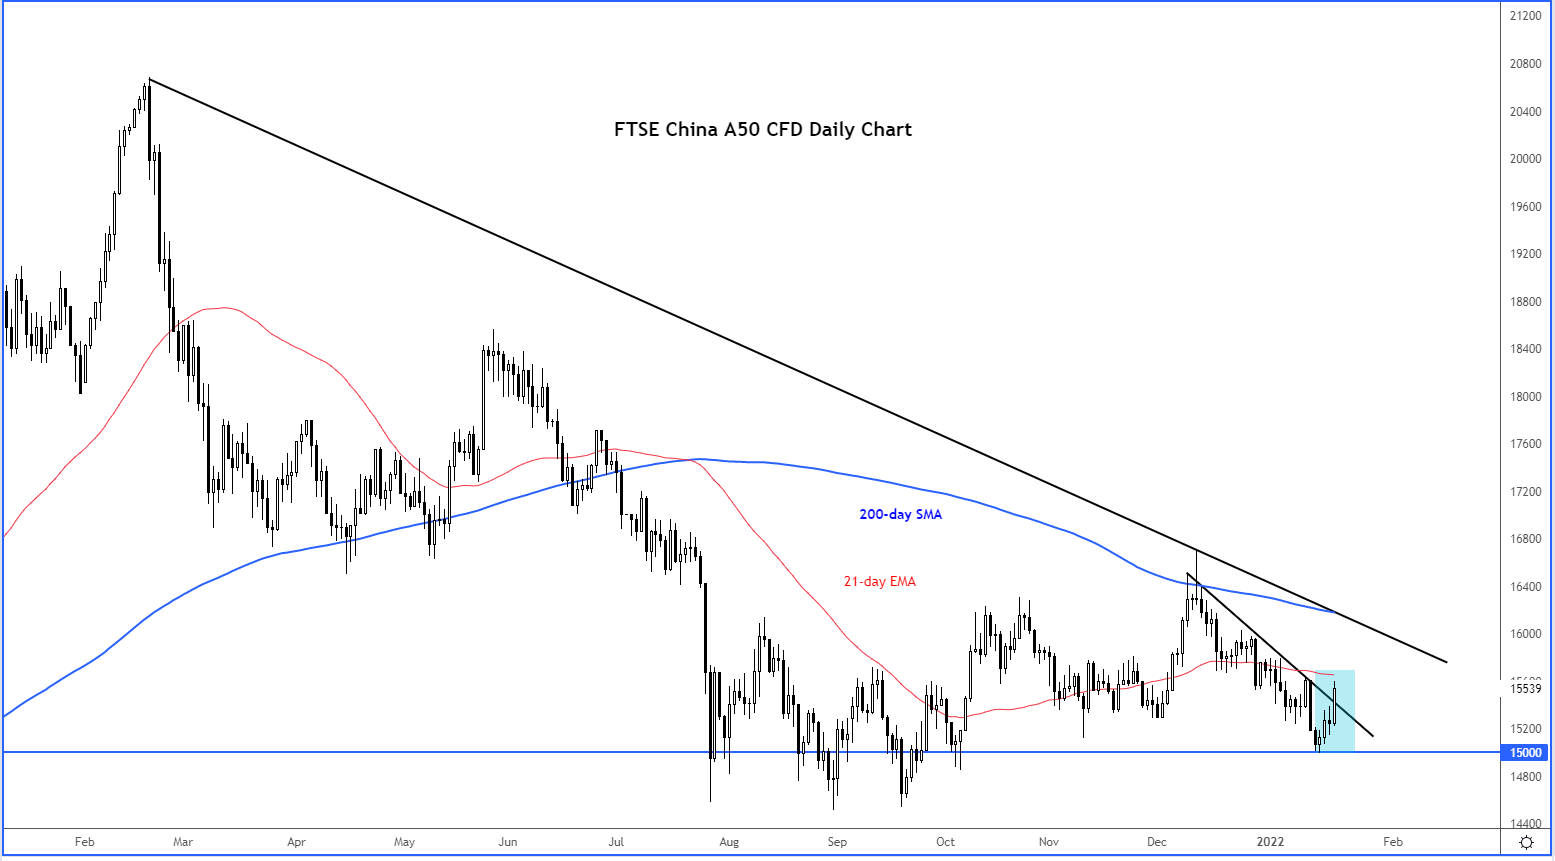
The FTSE China A50 index, which bucked the bullish trend for global markets last year, is starting to look promising again:
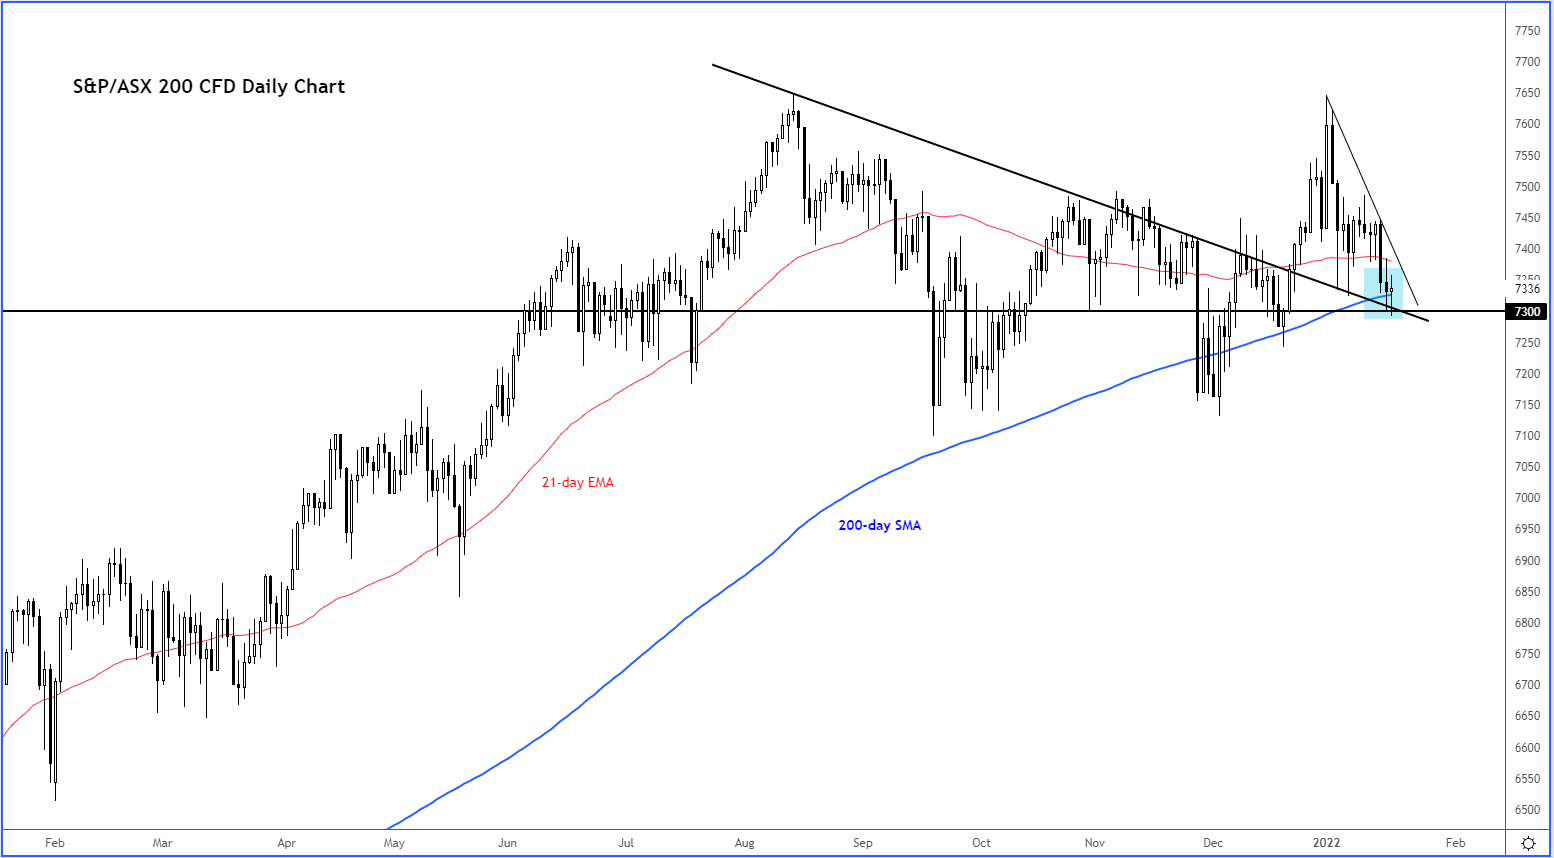
The resources and financial heavy S&P/ASX index is also bouncing off its 200-day and back side of the broken trend line. It needs to rise back above the 21-day exponential to trigger a bullish signal.
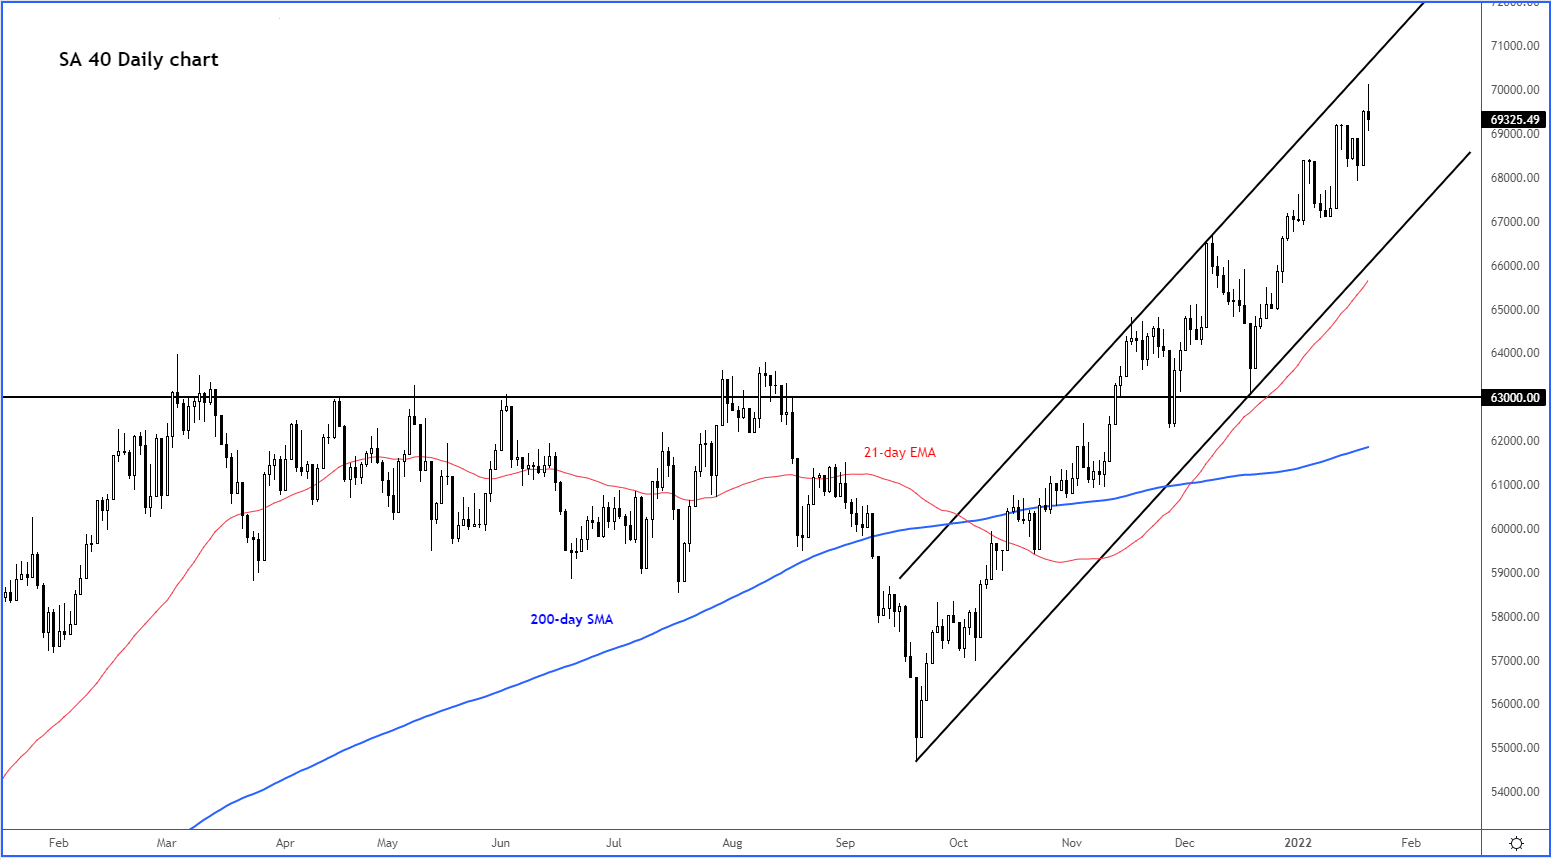
Just to make a point that not all indices have been selling off, have a look at South Africa’s SA40 index below!
EURNZD Wave Analysis
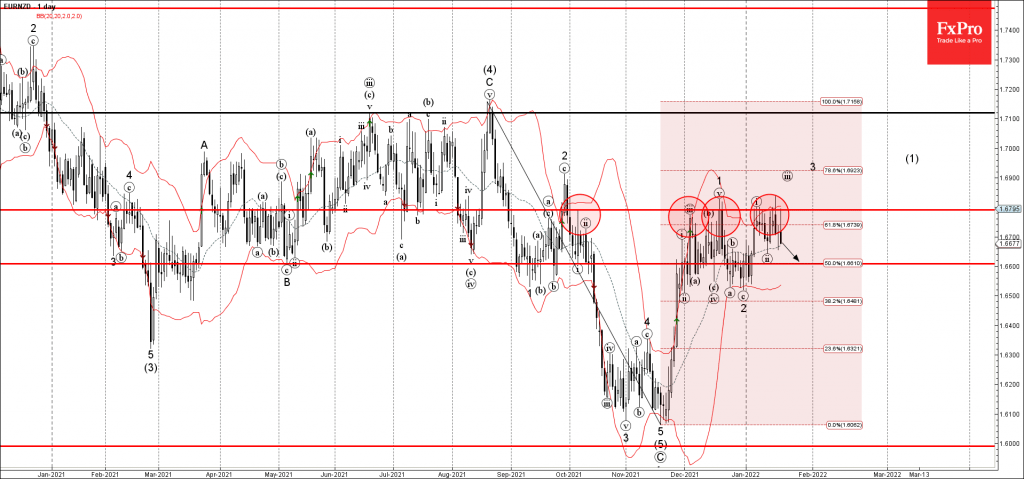
- EURNZD reversed from resistance level 1.6795
- Likely to fall to support level 1.6600
EURNZD recently reversed down from the key resistance level 1.6795 (which has been reversing the price from the start of October), intersecting with the upper daily Bollinger Band and the 61.8% Fibonacci correction of the downward impulse from August.
The downward reversal from the resistance level 1.6795 stopped the active impulse waves (iii), 3 and (1).
EURNZD can be expected to fall further toward the next support level 1.6600 (low of the earlier minor correction (ii)).
AUDCAD Wave Analysis
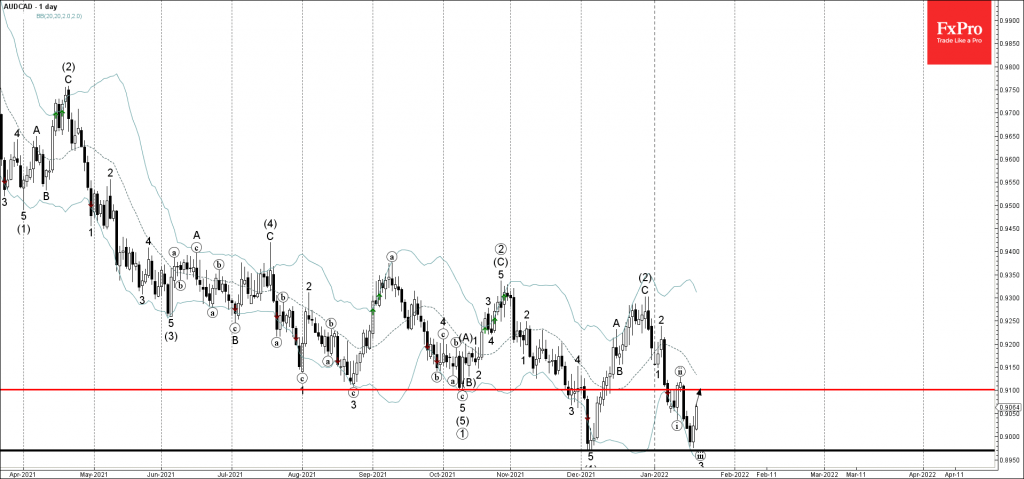
- AUDCAD reversed from key support level 0.8970
- Likely to rise to resistance level 0.9100
AUDCAD recently reversed up from the key support level 0.8970 (previous monthly low from December), intersecting with the lower daily Bollinger Band.
The upward reversal from the support level 0.8970 created the daily Bullish Engulfing – which stopped the previous sharp downward impulse waves (iii) and 3.
AUDCAD can be expected to rise further toward the next resistance level 0.9100 (which stopped the previous corrective wave (ii)).
Oil Report: WTI Breaks to Multiyear High But is it Done Yet?
The Oil market observed a series of impressive trading sessions in the past days, as WTI prices broke above the most recent highs they reached back in October and elevated to a new multiyear high level. The happening is certainly not by chance and this Oil report will be dedicated to explain the most important drivers of Oil prices at the moment and their potentiality for future price movement. At the end we will provide a technical analysis that will assist us with a more complete observation of the market, indicating important levels that may be used in the following sessions.
We start first with the Oil market data released in the past days as they may provide some valid understandings of the recent price action. During the past Friday, active US oil rigs jumped from previous 481 to current 492 according to the Baker Hughes. That is an increase of 11 active Oil rigs in the past week and is the highest weekly increase since the 15th of October. The notable jump in Oil rigs could be evidence of higher demand. In the past days, the American Petroleum Institute reported its weekly inventory levels of US crude oil, showing a surplus of 1.4M barrels. No major reaction was observed by WTI prices upon release. Today a reading that is anticipated by the market is the Energy Information Administration’s (EIA) weekly Crude Oil Inventories and will be released at 18:00 GMT+2. Oil traders may have to keep in an eye out for this figure as it can create volatility for WTI and Brent Oil prices.
In the past days, the OPEC January 2022 report was made public bringing to light the current views of the well-established Oil producing group. Based on the report some uncertainty over the spread of the new variant around the world persists while in 2022, the forecast for world oil demand growth also remains unchanged at 4.2 mb/d. In terms of World Oil supply, Non-OPEC supply growth in 2021 remains unaffected at around 0.7 mb/d, y-o-y. Upward revisions in the US and Kazakhstan were offset by downward adjustments to Brazil, Canada, Ecuador and Norway. With this comment we understand that World Oil supply increased very little if any. Moreover, OPEC’s crude oil demand in 2022 remains unchanged from the previous month to stand at 28.9 mb/d, around 1.0 mb/d higher than in 2021. Furthermore, from a geopolitical perspective some tensions in the Middle East between the Yemen’s Houthi group and the United Arab Emirates had been noted in the past days and are an important matter for traders to keep in mind especially if production is interrupted. In this scenario we could see temporary strong Oil price movement, possibly upwards.
On a separate note, according to various sources Russia is building up troops nearby the Ukraine border which is attracting major media attention at the moment. Even though great political powers from around the world are getting involved, we believe that if a military action is taken then Oil and Natural Gas can be affected possibly sending prices higher. Russia is a great producer of both commodities and the repercussions of making a military move into Ukraine can impact its availability to the energy market.
Finally, from our personal view, Oil demand continues to be on the rise even with the new variant. Despite the fact that more Oil is needed, major Oil producers from around the world are forced to keep output on the leash as it is difficult to predict how circumstances on the virus front can play out. For example according to the EIA Crude Oil production in the US was at 11 mb/d on the 8th of January 2021 while for the same month in 2022, it averaged at 11.725 mb/d. This is a very limited yearly increase in production, yet demand continues to increase. However, we have progressed much since the pandemic started thus adjustment in supply maybe required at this stage. For now, Oil demand continues to drive barrel prices higher.
Technical Analysis
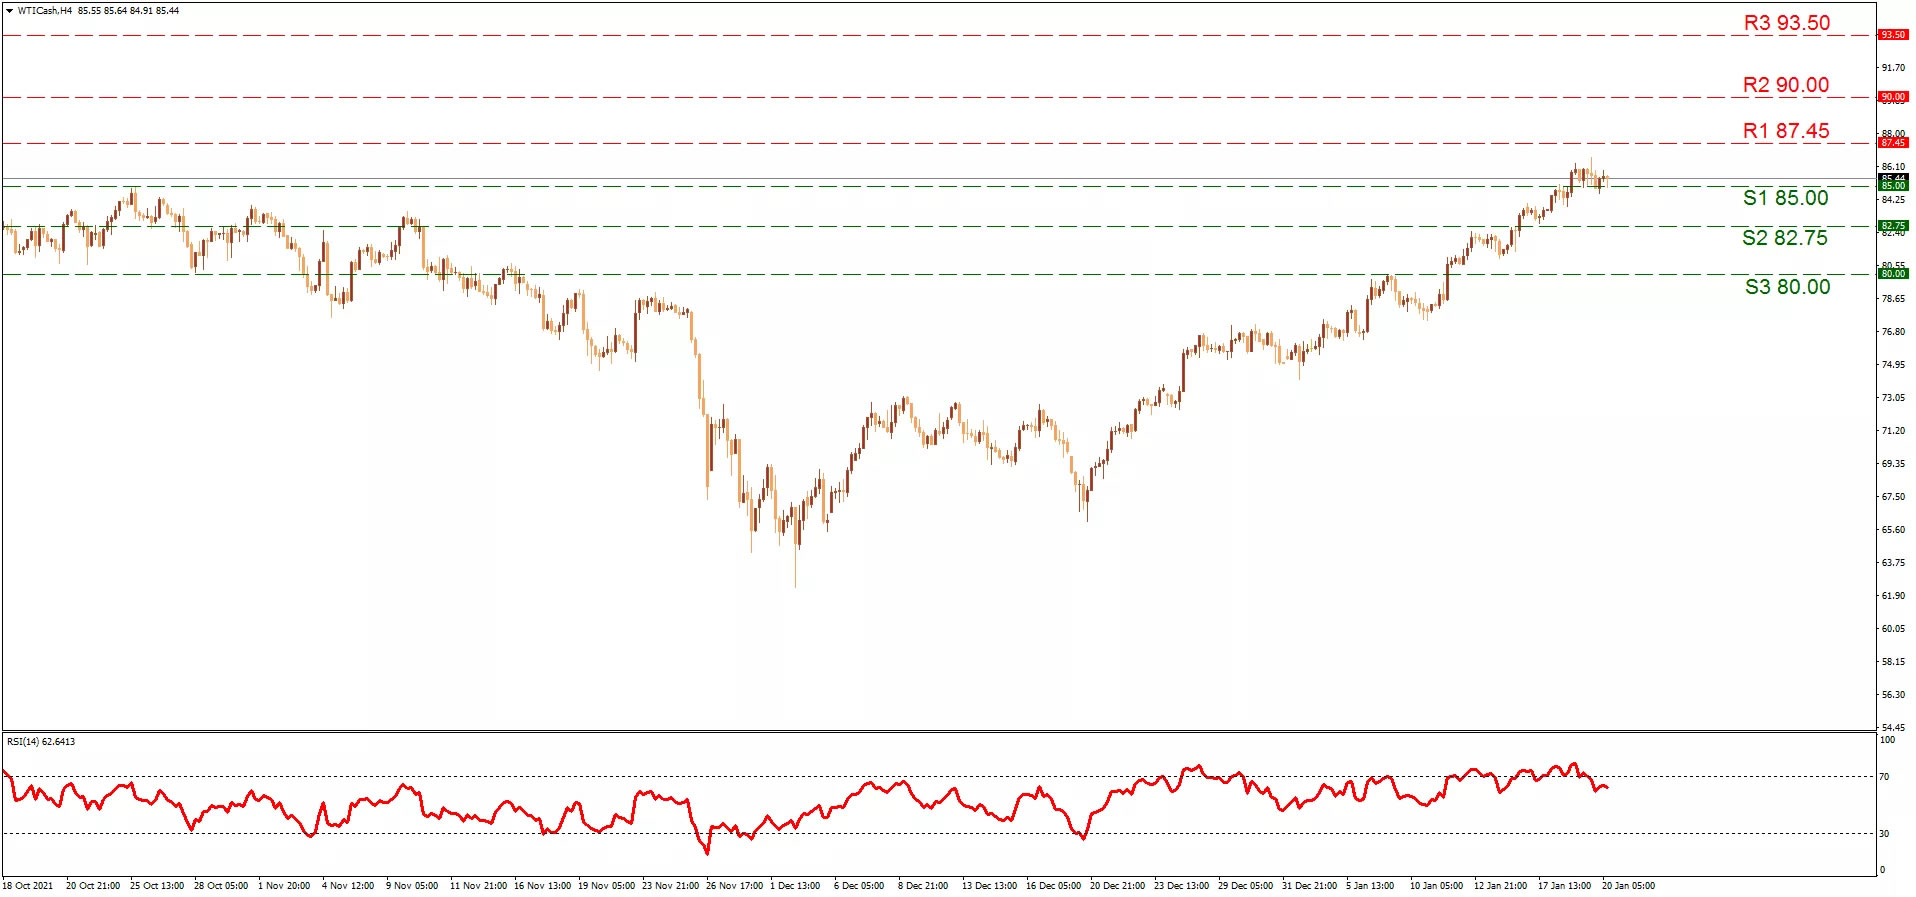
At the moment WTI remains in an ascending trend line that has commenced since the 20th of December. The price action for now has stabilized nearby the currently noted (S1) 85.00 support level which was our previous highest resistance level in the past weeks. As the commodity has not shown signs of stabilization yet, we could assume that some bullish tendencies may continue thus we note higher the (R1) 87.45 resistance as a possible target for the buyers. Even higher we note the round number (R2) 90.00 resistance line which could enable us to consider even higher grounds like the (R3) 93.50 level. If the price action is to correct lower, then the (S2) 82.75 could provide some support while the (S3) 80.00 line can also be reached if a notable correction lower takes place. The RSI indicator below our chart seems stable just below the 70 level implying some traders may be keeping their buying orders for the time being.