

Sample Category Title
ECB de Guindos: Inflation not going to be as transitory as expected
ECB Vice President Luis de Guindos said, "inflation is not going to be as transitory as forecast only some months ago. The assessment of risk for inflation is moderately tilted to the upside over the next 12 months."
"And the reasons are quite simple. First, supply side bottlenecks are going to be there and are more persistent than we and many expected in the past," de Guindos said. "And energy costs are going to remain quite elevated."
Nevertheless, over the longer term, risks to inflation outlook are still balanced. Inflation are projected to fall back below ECB's target of 2% in 2023 and 2024.
The Fed’s Balance Sheet: When Will It Shrink, and by How Much?
Summary
The outlook for U.S. monetary policy has shifted significantly in recent months. Inflation remains well-above the Federal Reserve's 2% target, while the labor market recovery has continued at a much stronger pace than occurred in the 2010s expansion. A more robust recovery in output, employment and prices in this cycle has translated into a much quicker pivot from the Federal Reserve on monetary policy. Markets are increasingly priced for the first fed funds rate hike in March, and our forecast agrees with this view. Several more rate hikes later this year and in 2023 appear likely.
With tighter monetary policy on the horizon, market attention has turned to possible reductions in the Fed's asset holdings, which total nearly $9 trillion at present, up from $4.2 trillion before the COVID-19 pandemic. Our baseline assumption is that the Federal Reserve will announce balance sheet runoff at the September 2022 FOMC meeting, with the actual runoff beginning one month later in October. Unlike the 2017 experience, we think the FOMC will also increase the federal funds rate at this meeting to 0.75%-1.00%.
Starting in October, we look for the Fed to stop reinvesting its maturing securities up to a monthly cap much like the central bank did the last time it shrank its asset holdings. We think these caps will be ultimately be $70 billion per month for Treasury securities and $30 billion per month for mortgage-backed securities (MBS). Similar to last time, we suspect the Fed will phase in the runoff, so we have penciled in initial caps of $20 billion and $5 billion per month for Treasuries and MBS, respectively. These caps would then be increased by $10 billion and $5 billion per month from November 2022 through March 2023 at which point the caps would level off at $70 billion and $30 billion. If these caps were kept in place through the end of 2024, we estimate the Fed's balance sheet would be just below $7 trillion at that point in time. Under this scenario, we project that the Fed's balance sheet would be 24.4% of GDP in Q4-2024, about the same level that prevailed in mid-2015.
If the Federal Reserve reduces its balance sheet by a couple trillion dollars over 2023 and 2024, this should contribute to the upward creep in yields on longer-dated Treasury securities and mortgage rates that we forecast in coming quarters. Quantifying the impact on Treasury yields from projected Fed balance sheet runoff is highly uncertain, much more uncertain than the pass-through from projected fed funds rate increases. We think the most likely outcome is for upward pressure on long-term Treasury yields, but only moderately so. The structural downward pressure on real long-term interest rates from demographic changes, lower potential GDP growth and elevated global savings remains intense. These factors are reflected in our 2023 year-end forecast for the 10-year Treasury yield of 2.35%.
How Do You Shrink a $9 Trillion Balance Sheet? One Bond At a Time.
On the eve of the COVID-19 pandemic in February 2020, the Federal Reserve's balance sheet was about $4.2 trillion. The asset side of the Fed's balance sheet was composed primarily of Treasury securities and mortgage-backed securities (MBS), while the liabilities side primarily consisted of currency in circulation, bank reserves held at the Federal Reserve and the U.S. Treasury's general account that it uses for managing daily cash inflows and outflows (Figures 1 & 2).
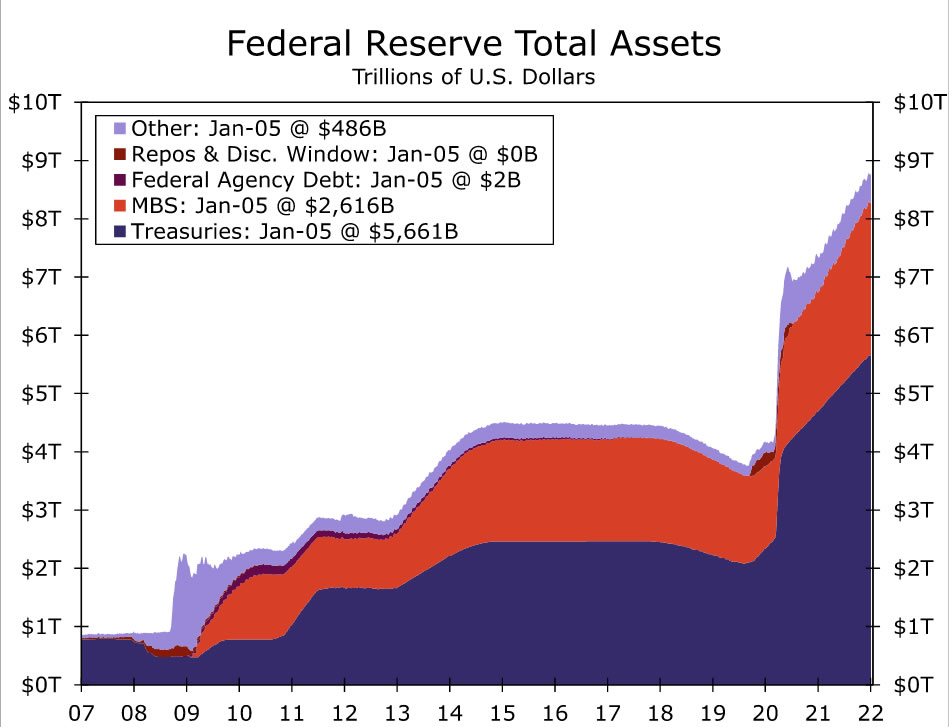
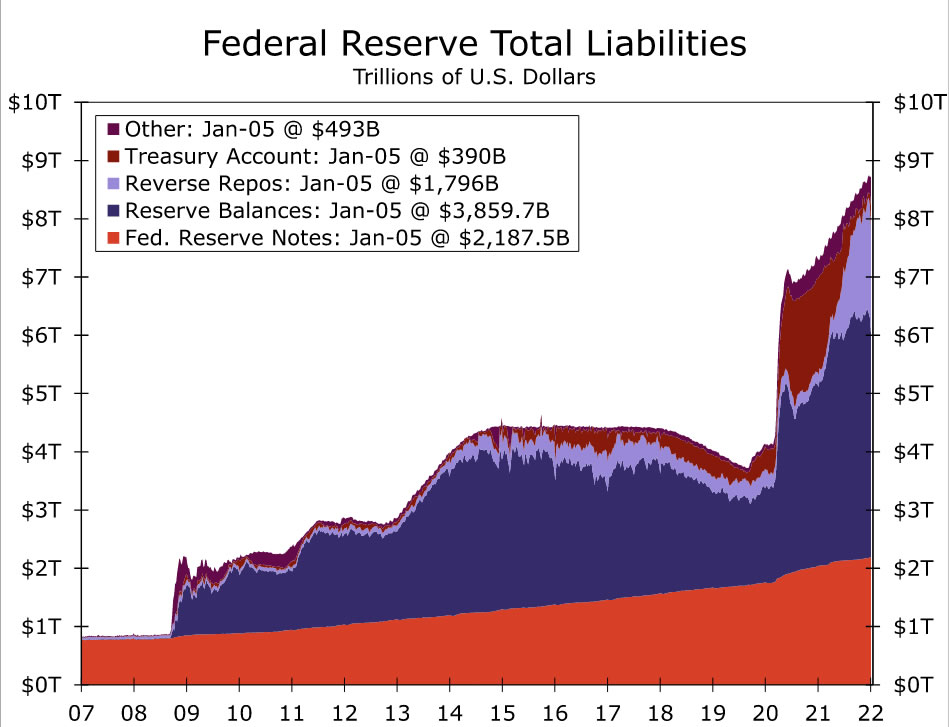
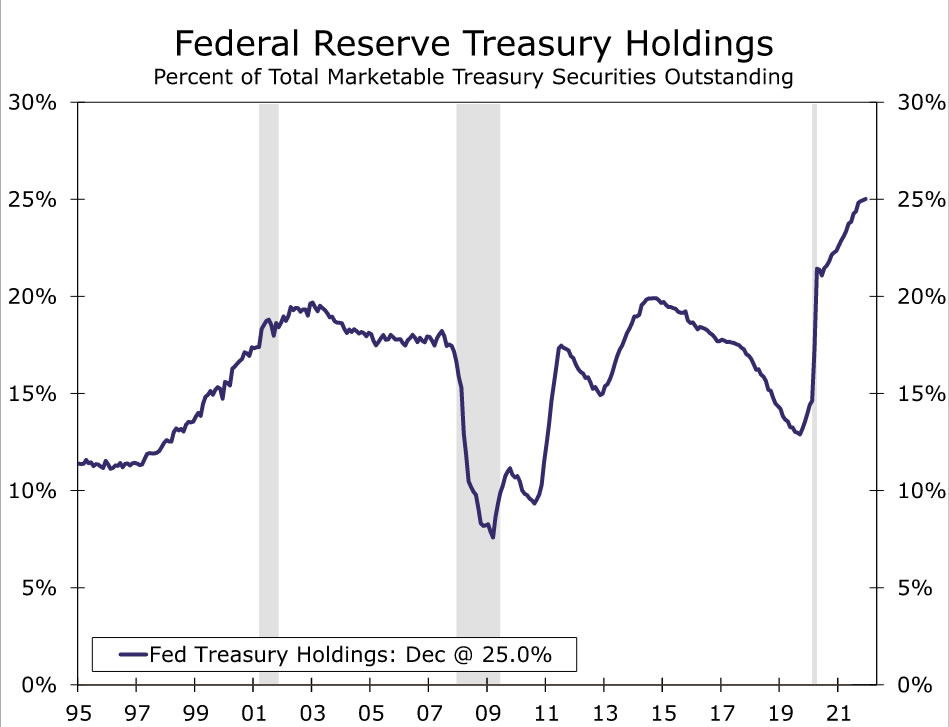
In some ways the Fed's balance sheet had normalized from the 2008-2009 recession. For example, the Federal Reserve owned 14.6% of total Treasury securities outstanding in February 2020, which was lower than the share it held in 2007 (Figure 3). However, the central bank still owned $1.4 trillion in MBS, an asset it did not hold before 2008, and the Fed's total assets as a share of GDP were about 18%, three times the level that prevailed in 2007 (Figure 4). Still, the Federal Reserve was in the process of gradually reinvesting its MBS holdings into Treasury securities, and steady economic growth was permitting the central bank to further "grow into" its sizable holdings. The central bank seemed to be slowly but surely reaching a new equilibrium for its balance sheet.
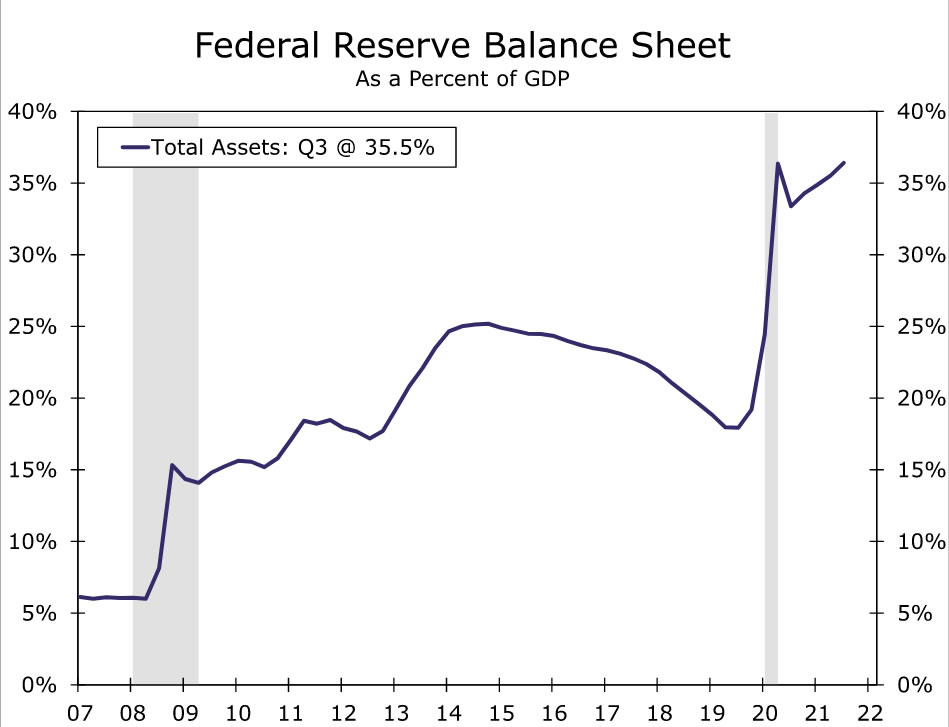
The pandemic upended that narrative entirely. The Federal Reserve bought trillions of dollars worth of Treasury securities and MBS to provide monetary policy stimulus to the economy and backstop deteriorating financial markets. It also provided a significant amount of additional support and liquidity through repurchase agreements, swaps with foreign central banks and non-traditional asset purchases/loans to businesses and municipal governments. As a result, the Fed's balance sheet has subsequently ballooned to nearly $9 trillion today.
Due, at least in part, to the Fed's actions the U.S. economy is in a much different place today than it was earlier in the pandemic. Nonfarm payrolls have recovered about 84% of the total jobs lost during the early stages of the pandemic, and total U.S. output now exceeds its pre-pandemic level. In addition, inflation has surged above the Fed's 2% target and appears likely to remain above target for most of 2022, if not longer. A much more robust recovery in output, employment and prices in this cycle compared to the 2010s has translated into a much quicker pivot from the Federal Reserve on monetary policy. In November, the Fed announced it would start slowing its bond purchases, with an eye toward ending purchases completely in June 2022. Just six weeks later the central bank began reducing its bond buying even more rapidly. Markets are increasingly priced for the first fed funds rate hike in March, and our forecast agrees with this view. Several more rate hikes later this year and in 2023 appear likely.
With tighter monetary policy on the horizon, market attention has turned to possible reductions in the Fed's asset holdings. Much of the Fed's non-traditional lending that occurred early in the pandemic, such as central bank swaps and corporate bond buying, has already rolled off the central bank's balance sheet. However, the Fed's Treasury securities and MBS holdings are still exceptionally high and in fact are still growing as bond purchases are not set to conclude until mid-March. This has not stopped financial market participants and analysts from speculating about when the Federal Reserve might start shrinking its Treasury security and MBS portfolio. Speculation was further stoked by the release of the minutes from the December FOMC meeting which showed that Fed officials engaged in a preliminary but robust discussion about various options on the timetable regarding balance sheet shrinkage. To better understand what the Fed might do going forward, we first turn to what the central bank did from 2017-2019 when it last reduced the size of its balance sheet.
"Quantitative Tightening": The 2017-2019 Experience
At the March 15, 2017 FOMC meeting, the FOMC increased the federal funds target range to 0.75%-1.00%. The minutes from that meeting were released a few weeks later and showed the first clear signs that balance sheet reductions were eventually coming: "Most participants judged that a change to the Committee's reinvestment policy would likely be appropriate later this year." At that time, the unemployment rate was 4.4%, and the core PCE deflator was 1.9% on a year-over-year basis.
A few months later, the Federal Reserve released a document outlining a tentative plan for balance sheet normalization. In short, the Fed would stop reinvesting maturing Treasury securities and MBS up to a monthly cap. These monthly limits would start at $6B per month for Treasuries and $4B per month for MBS, eventually rising to $30B and $20B, respectively. All proceeds in excess of these limits would be reinvested into their respective securities. At the September 2017 FOMC meeting, the central bank formally announced that balance sheet reductions would begin in October and follow the previously outlined parameters. Notably, the Fed chose not to hike rates at that meeting, holding the fed funds rate steady at 1.00%-1.25%.
From October 2017 through March 2019, the Federal Reserve's balance sheet shrank by about $500 billion. On the asset side, Treasury securities declined by about $300 billion while MBS holdings fell $200 billion. On the liability side of the balance sheet, bank reserves declined a bit more than $500 billion, essentially accounting for the entire offset. Notably, the Fed did not start this process with an end date or terminal size of the balance sheet in mind. Instead, the plan stated that the Committee "expects to learn more about the underlying demand for reserves during the process of balance sheet normalization."
And learn more about demand for reserves it certainly did. Upward pressure on a variety of short-term interest rates emerged throughout 2018 as the Federal Reserve shrank its balance sheet. Broadly speaking, this was a sign that bank reserves were becoming scarcer as the price (i.e. the interest rate) to borrow cash overnight rose. At first, the Fed resorted to tweaking the interest rate it pays on bank reserves to keep short-term interest rates well-anchored. However, in March 2019, just a few months after the monthly caps had been fully phased in, the Federal Reserve announced that it would reverse course and begin slowing the pace of decline in its balance sheet. The plan was to stop balance sheet shrinkage entirely by September 2019 and then reinvest principal payments from MBS into Treasury securities. This MBS-to-Treasuries shift would keep the overall balance sheet size unchanged but move the Fed's asset holdings towards primarily Treasury securities over the long-run.
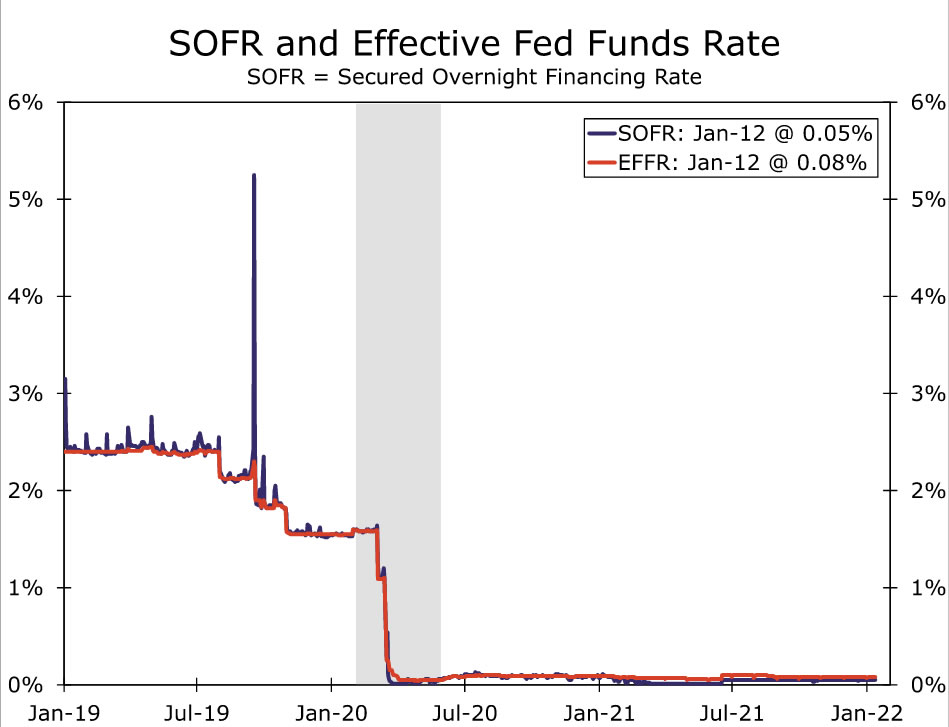
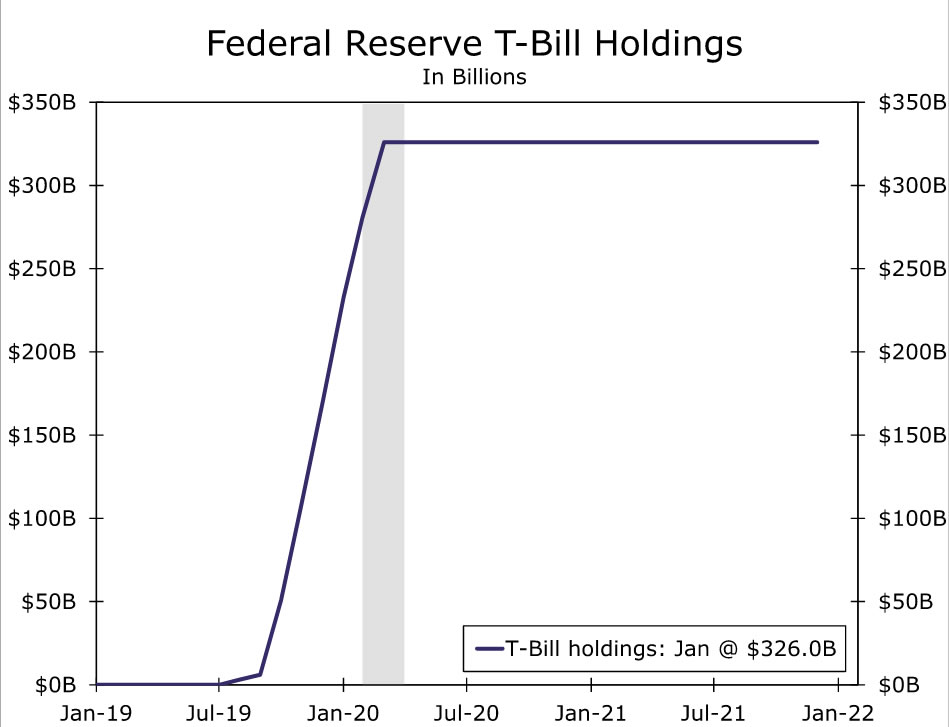
This plan was disrupted in September 2019 when Treasury repo rates exploded, putting significant upward pressure on numerous key short-term interest rates, including the effective fed funds rate and the secured overnight financing rate (SOFR), as shown in Figure 5. Although there were still more than $1.3 trillion in bank reserves held at the Federal Reserve at the time, it became clear that underlying demand for highly liquid, safe cash parked at the Fed was higher than many analysts had previously estimated.1 In response to this disruption, the Federal Reserve started performing overnight and term repo operations to provide additional liquidity to the financial system. The Fed also began modestly increasing the size of its balance sheet again, this time through purchases of Treasury bills, as a means of boosting bank reserves and putting downward pressure on short-term interest rates (Figure 6). Those ad hoc repo operations and T-bill purchases continued until March 2020 at which point the pandemic-induced policy changes reigned supreme.
We Expect Balance Sheet Runoff to Start in Q4-2022
So when and how will the Federal Reserve proceed with balance sheet reductions this time around? Our baseline assumption is that the FOMC will announce balance sheet runoff at the September 2022 FOMC meeting, with the actual runoff beginning one month later in October. Unlike the 2017 experience, we think the FOMC will also increase the federal funds rate at this meeting to 0.75%-1.00%. If realized, a September announcement would come just six months after the end of asset purchases, a sharp contrast to the nearly three years that elapsed between the end of Fed bond buying in December 2014 and the start of Fed balance sheet shrinkage in October 2017. This much faster turnaround from being a net buyer to a de facto net seller makes sense in the context of the much more rapid recovery in employment and inflation seen in this recovery. The unemployment rate is already below 4%, labor demand is strong enough to support solid additional employment gains and headline inflation is an eye-popping 7%.
Starting in October, we look for the Fed to stop reinvesting its maturing securities up to a monthly cap much like the central bank did the last time it shrank its asset holdings. We think these caps will be ultimately be $70 billion per month for Treasury securities and $30 billion per month for MBS. When scaled up for the growth in the Fed's asset holdings, monthly caps of $70 billion and $30 billion for Treasury securities and MBS, respectively, are roughly equivalent to the $30 billion and $20 billion caps that prevailed in the previous balance sheet runoff experience.
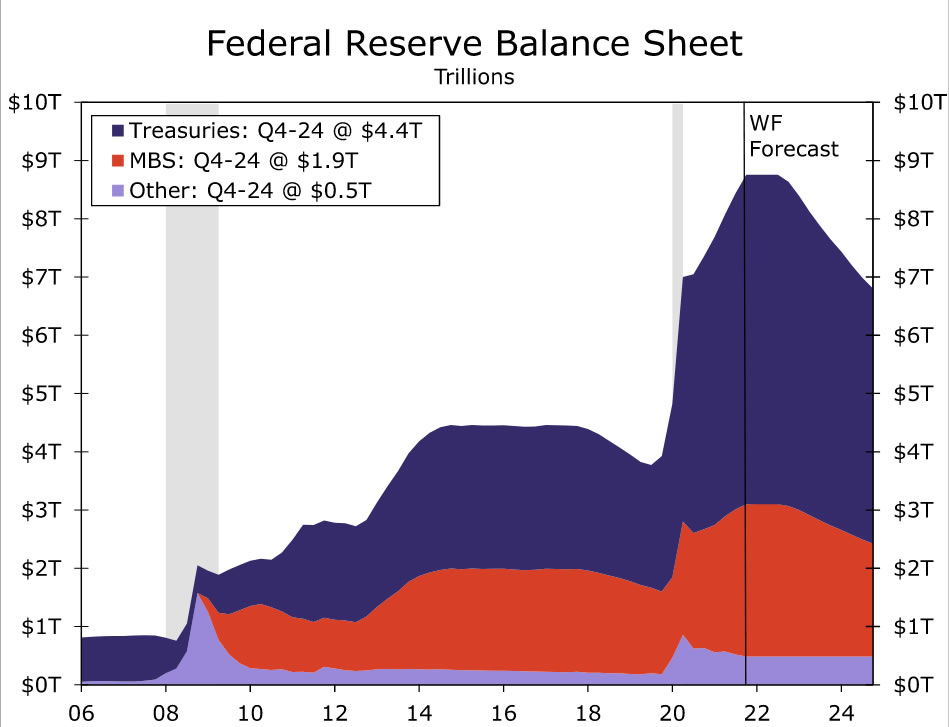
Similar to last time, we suspect the Fed will phase in the runoff, so we have penciled in initial caps of $20 billion and $5 billion per month for Treasuries and MBS, respectively. These caps would then be increased by $10 billion and $5 billion per month from November 2022 through March 2023 at which point the caps would level off at $70 billion and $30 billion. If these caps were kept in place through the end of 2024, we estimate the Fed's balance sheet would be just below $7 trillion at that point in time (Figure 7). Under this scenario, we project that the Fed's balance sheet would be 24.4% of GDP in Q4-2024, about the same level that prevailed in mid-2015.
Just how long might balance sheet reductions last? As we noted earlier, the Federal Reserve left this question open-ended during the last runoff period, committing only to "hold no more securities than necessary for efficient and effective policy implementation" over the long-run. Identifying this equilibrium level for the balance sheet proved to be harder than expected as evidenced by the repo market blow-up that occurred in September 2019. Ultimately, the terminal size of the balance sheet is driven by the liability side of the Fed's balance sheet, particularly the appropriate level of reserves in the system. This in turn is determined by bank demand for holding reserves at the Federal Reserve. Banks hold reserves at the central bank for numerous reasons, including as an optimal place to hold discretionary and legally-required liquidity buffers. If bank reserves decline too much, upward pressure on short-term interest rates can emerge, as was the extreme case in September 2019.
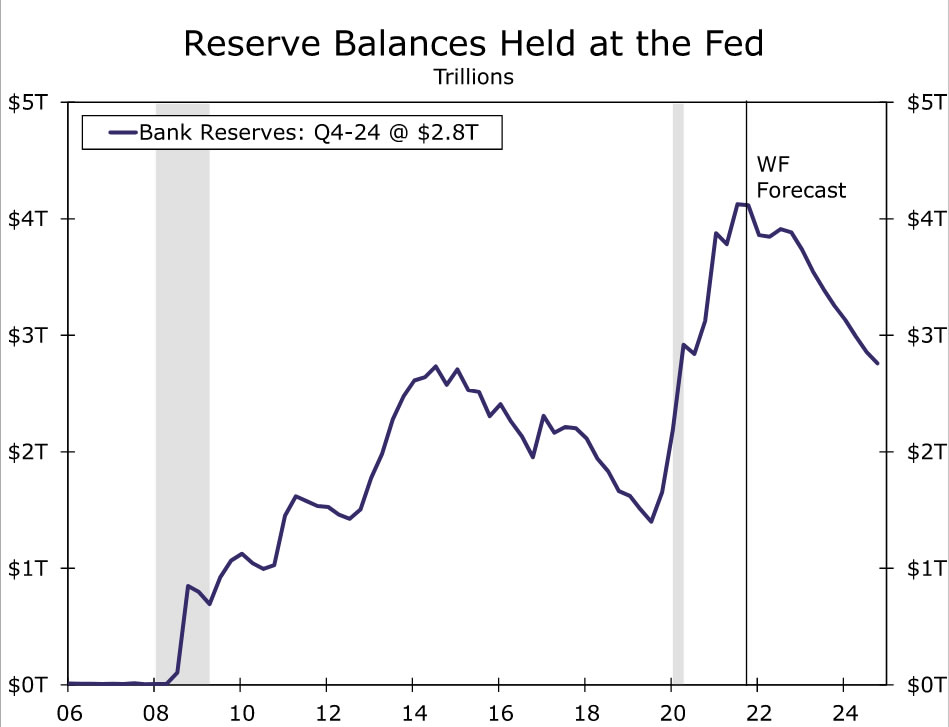
We are reasonably confident that the Federal Reserve's balance sheet would still provide ample reserves for the banking system through 2024 in our baseline runoff scenario. We estimate our baseline scenario would put bank reserves at roughly $2.5-$3.0 trillion (Figure 8).2 This would put reserves roughly 65% above pre-pandemic levels and should still provide enough cushion even after accounting for the projected growth in the economy and bank assets over that time period.
Past 2024, however, the outlook for additional balance sheet reduction is murky. Running off another $500-$750 billion in assets would push reserves much closer to their pre-pandemic level of roughly $1.7 trillion. Perhaps the Fed's new standing repo facility, which was established in July 2021 and permits banks to borrow reserves and collateralize the loan with Treasury securities, will encourage banks to hold more Treasuries and fewer reserves than was the case the last time the Fed's balance sheet was shrinking. That said, the facility is new and remains largely untested in times of stress, and questions remain about its ultimate effectiveness at backstopping money markets.
Of course, much can happen between now and 2024, and it is very possible balance sheet runoff will end well before then, either because the Fed wishes to stop tightening monetary policy or because of signs that reserves are starting to become scarce. For now, we think the Fed will start balance sheet runoff and, much like last time, feel its way through the dark for the "right" size of the balance sheet.
Interest Rate Implications: Higher Long-Term Yields, but Only So Much
If the Federal Reserve reduces its balance sheet by a couple trillion dollars over 2023 and 2024, this should contribute to the upward creep in yields on longer-dated Treasury securities and mortgage rates that we forecast in coming quarters. Estimating the projected impact is tricky, and even the FOMC stated in the minutes from its most recent meeting that "there is less uncertainty about the effects of changes in the federal funds rate on the economy than about the effects of changes in the Federal Reserve's balance sheet." That said, we are skeptical balance sheet reductions along these lines would cause long-term interest rates to jump sharply. For one, the Fed's balance sheet remains quite large at slightly less than $7 trillion in year-end 2024. The move by the Federal Reserve to an ample reserve regime likely have made the days of a much smaller balance sheet a distant memory.
Notably, the rapid shift in expectations for the start of Fed balance sheet reductions does not appear to have had a huge impact on Treasury yields thus far. As recently as early December the median respondent in the Fed's primary dealer survey did not expect balance sheet reductions to start until Q3-2023. Yet even as forecasts for balance sheet runoff and the first rate hike from the Fed have been pulled forward, the 10-year Treasury yield is "only" up about 27 basis points since the December 15 FOMC meeting.
Looking back at history, the 2017-2019 balance sheet reductions do not appear to have had a major impact on yields. Analysis published by Federal Reserve researchers suggested that the numerous rounds of asset purchases done during and after the 2008-2009 recession had reduced the 10-year Treasury yield term premium by about 100 basis points.3 Yet between March 2017 and March 2019 most estimates of the 10-year Treasury yield term premium did not show much of an increase (Figure 9). The move higher in 10-year Treasury yields over that period appears to have been driven more by rate hike expectations than balance sheet runoff, and perhaps unsurprisingly the Treasury curve flattened over most of these two years.
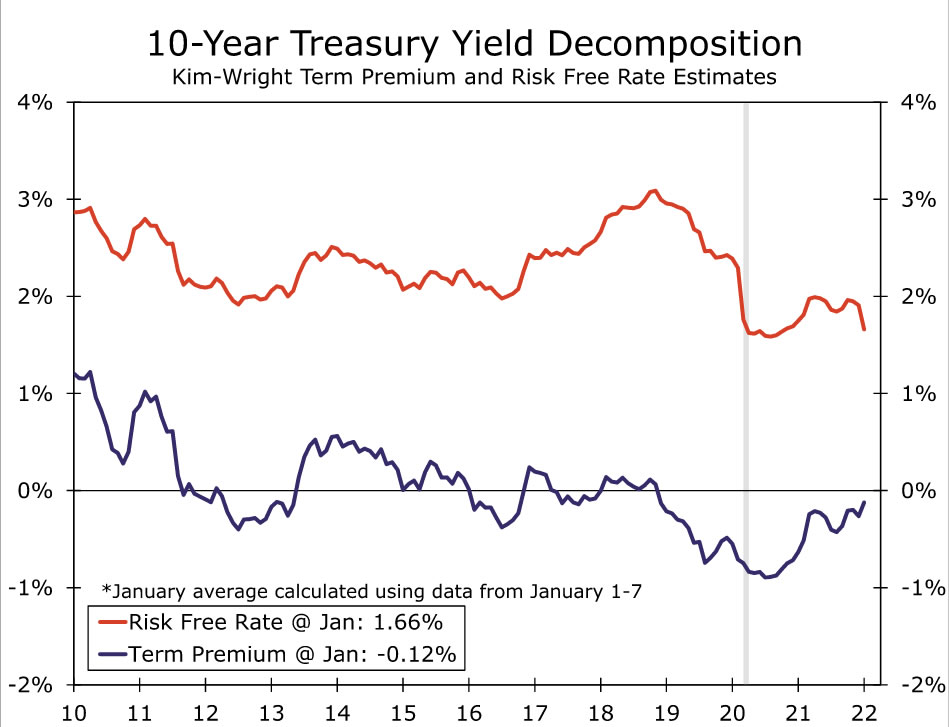
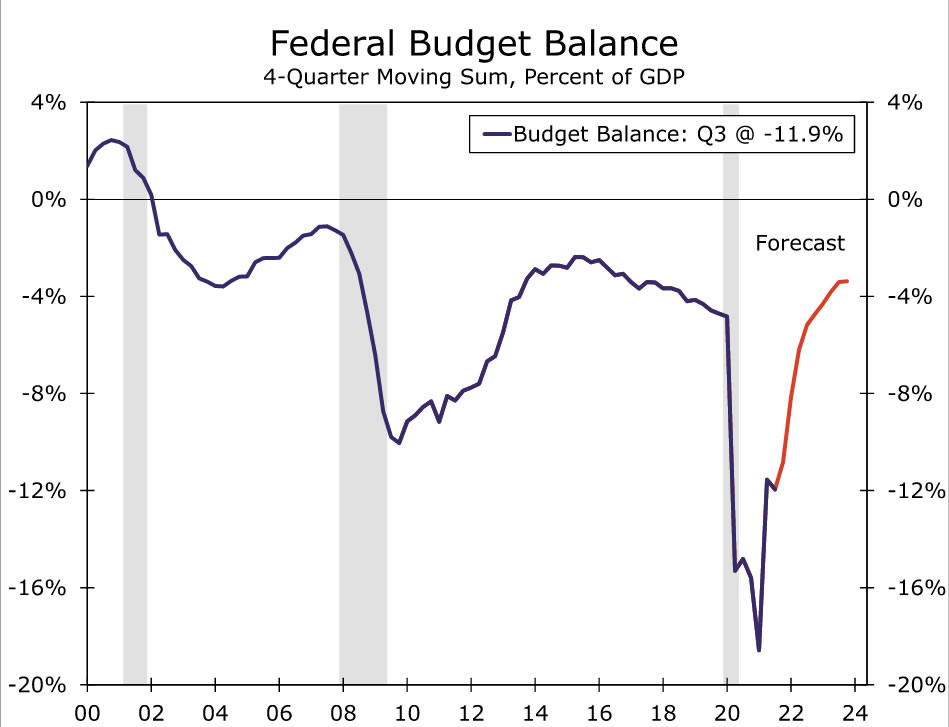
Of course, the Fed's balance sheet runoff ended earlier than expected, and other factors may have offset the upward pressure on the term premium from the Fed's balance sheet runoff. Indeed, the backdrop was a bit different in 2018-2019 as the European Central Bank and Bank of Japan were engaged in more robust asset purchases than we believe will be the case this time around in 2023 and 2024. But other factors have changed too, such as the direction of the federal budget deficit. In 2018 and 2019 the federal budget deficit was widening amid the 2017 Tax Cuts and Jobs Act and a material increase in discretionary spending. Our current forecast looks for the federal budget deficit to shrink dramatically over the next couple of years (Figure 10), and accordingly the U.S. Treasury is currently in the process of reducing the size of regularly scheduled debt auctions for longer-dated Treasury securities.
Ultimately the impact on Treasury yields from projected Fed balance sheet runoff is highly uncertain, much more uncertain than the pass-through from projected fed funds rate increases. We think the most likely outcome is for upward pressure on long-term Treasury yields, but only moderately so. The structural downward pressure on real long-term interest rates from demographic changes, lower potential GDP growth and elevated global savings remains intense. These factors are reflected in our 2023 year-end forecast for the 10-year Treasury yield of 2.35%.
Endnotes
1 For further reading on what happened in September 2019, see our previously published report "Repo Running Wild: A Deeper Dive". (Return)
2 This projection assumes trend-like growth in non-reserve liabilities, such as currency in circulation and the Treasury general account. This projection also assumes that the Fed's reverse repo liabilities return to more "normal" levels of $400-500 billion by year-end 2024. (Return)
3 Brian Bonis, Jane Ihrig and Min Wei. "The Effect of the Federal Reserve's Securities Holdings on Longer-term Interest Rates". April 2017. (Return)
Research China: Top 5 questions for 2022 – and financial implications
- In this paper, we give a short overview of the key questions in China in 2022 and what we expect.
- Overall, we look for the Chinese economy to recover moderately, crackdowns to ease but not end and that China's zero-tolerance policy on Covid is here to stay for most of 2022.
- We expect limited impact on the economic agenda of the 20th CPC National Congress, which is mostly a political event. We look for tensions around Taiwan to remain high but see a small probability of a military confrontation anytime soon.
- Based on this, we look for Chinese stock markets to move higher in 2022 and for the CNY to weaken moderately.
#1: Will China's economy recover?
Short answer: Yes – we lift our growth forecast from 4.5% to 5.0% in 2022
As we argued in Research China – Stimulus picks up ahead of CPC Congress in '22, 21 December 2021, a key policy goal this year is stability. Following a year of economic downturn and property crisis, Chinese polices aims at stabilisation and is already taking measures to steer the economy back towards the middle of the road. Given the latest improvement in data which came a quarter earlier than we expected, we revise up our GDP forecast for 2022 to 5% from 4.5%. Infrastructure projects are pushed forward and steps have been taken to stabilize the property markets via easing of mortgage lending, increasing bank loans to developers and loosening the 'three red lines' regulation that puts caps on developers' debt levels. The latter will facilitate that troubled developers can raise liquidity by selling projects to more healthy developers. While the economy is set to recover, it is likely to be a moderate one. Headwinds continue from Covid outbreaks, which will likely become more frequent due to Omicron. And Chinese policy makers still very much focus on long term sustainability and financial risks. So stimulus will be measured.
#2: Will the crackdowns continue in 2022?
Short answer: Yes, but probably less so than in 2021
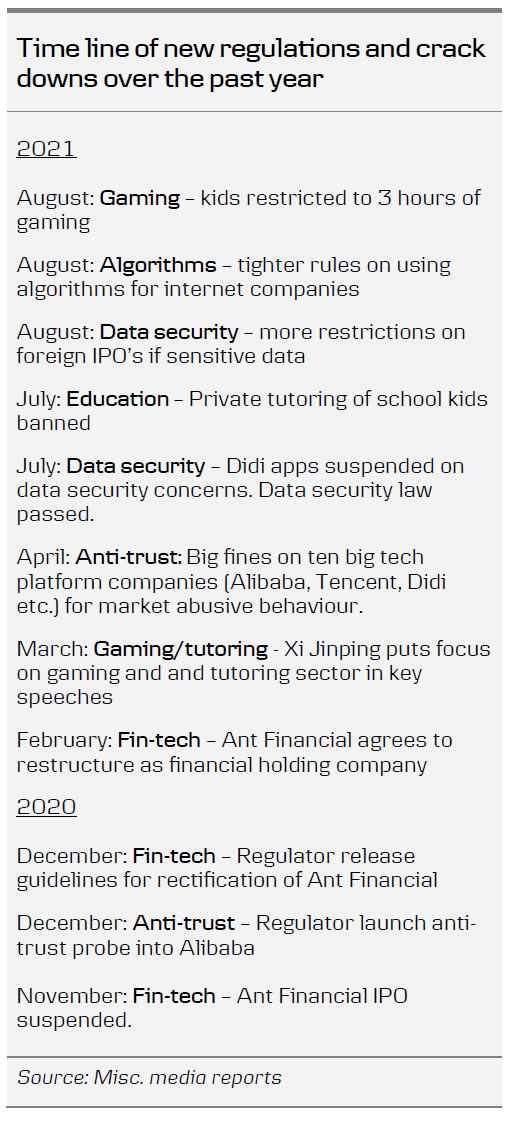
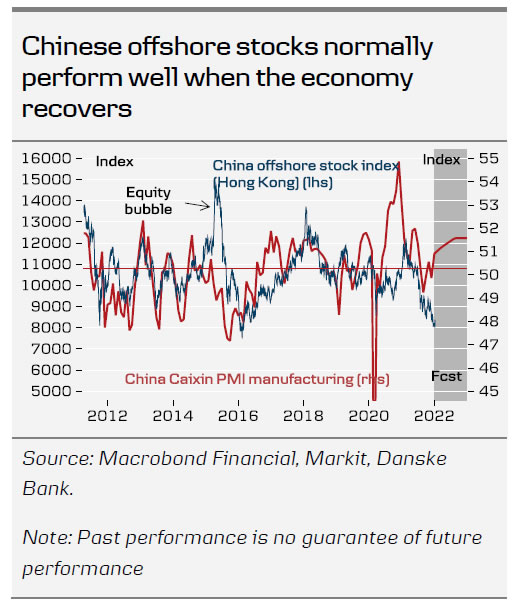
2021 was characterized by a blitz of crackdowns and new regulations: big tech internet companies received significant fines for abuse of market power, fin-tech faced much tighter regulation, a 3-hour ruls on kids' gaming was implemented, private tutoring of school kids was banned and ride hailing company Didi faced suspension of apps for listing in the US without proper guarantee of data security. The crackdowns led to a big hit to foreign investor sentiment and in combination with the economic slowdown was a key reason for China's significant underperformance in the offshore Hong Kong stock market.
While we expect regulations to continue in 2022, we look for the storm to calm down somewhat. The reason it is unlikely to go away is that China has already signalled it is set to continue. The rules are implemented for a variety of reasons that all have the goal of making the economy more efficient and improve the social balance. The crackdown on big tech, for example, is seen as an anti-monopoly market reform creating a more level playing field for smaller players. When it comes to gaming and education the motivation is social balance, protection of kids mental health and to some extent an aim to lower the cost of having a child in order to facilitate people getting more kids. Regarding Didi it is a matter of national security to protect sensitive data on hundreds of millions Chinese customers from ending up on foreign (not least American) hands.
The reason we expect it to slow down after all, is firstly that stability is a key objective in 2022. And rolling out too much new regulation in a short time has created uncertainty and instability in Chinese markets – which in turn raises Chinese companies financing costs. Secondly, the companies themselves are also better prepared to adapt to an environment where they know behaviour that can be seen as market abuse or breach of data security, will not be tolerated.
#3: Will the zero-tolerance COVID policy end?
Short answer: Probably not on this side of the CPC Congress
While China's zero-tolerance COVID policy is becoming more challenging with the arrival of Omicron, there is no sign that this will change China's policy on this issue. China sees its' handling of the pandemic as far more efficient than most Western countries and that it has saved millions of lives while limiting too severe negative impact on the economy. If China had a proportional amount of deaths as the US, it would have led to more than 3 million deaths in China due to its' 1.4 billion large population. While the official number of 4,636 deaths most likely underestimates the true amount, it is likely that China has indeed saved millions of lives.
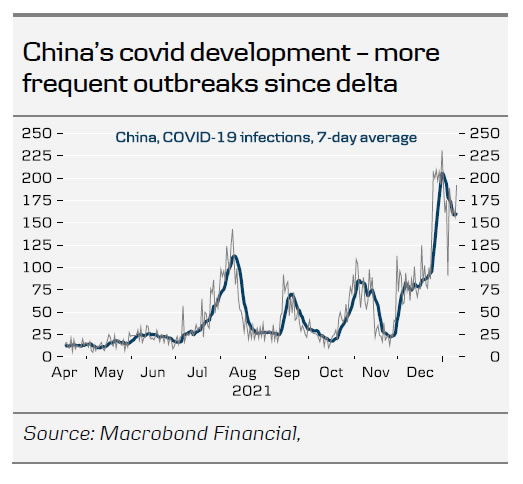
An article in Chinese state media China Daily on 10 January was titled 'Zero-Covid policy keeps pandemic under control'. It quotes head of China's National Health Commission Liang Wannian saying that "This approach is the best option and the guiding principle of China's disease control work. We must resolutely adhere to the policy and protect the health and safety of the population as the top priority." While China has implemented more frequent and often harsh local restrictions, they tend to last shorter than restrictions implemented in Europe and are less widespread but focused on the specific areas where? the virus pops up.
So when will China end the zero-tolerance policy and shift to the 'living with Covid' as in most other countries? China's respiratory disease expert Zhong Nanshan said in November that zero tolerance costs a lot but letting the virus spread would cost more. He outlined some criteria for when China could end its zero-tolerance policy: Basically the death rate and hospitalisation rate from Covid need to come down. This can be achieved by effective vaccines and a high vaccination rate. And a milder version of Covid. China has a high vaccination rate but its vaccines are less efficient and they need to be adjusted to Omicron. The fact that Omicron seems milder will help achieve this criteria. But it is too early to make that conclusion for China and they will demand clear evidence before they let it spread. In many parts of China the health system is weaker than in the big cities and hospitals could be overwhelmed if contagion is significant, which in turn could threaten social stability. China's population is also getting old and it implies a bigger risk group.
Hence, despite rising economic costs of the zero-tolerance policy due to Omicron, we believe China will stick with it at least until the other side of the CPC Congress in Q4, where hundreds of the top of the Communist Party is gathered in Beijing. By then China will also have experience from other countries to draw on to evaluate effects of a shift to a 'living with covid' strategy.
#4: How will the 20th CPC National Congress impact the economic agenda?
Short answer: Not much
The Congress is instead likely to cement the policies and economic goals that has already been outlined over the past five years in what was labelled Xi Jinping Thought on Socialism with Chinese Characteristics in a New Era. China's so-called New Development Philosophyhighlights a move from quantity to quality – from 'growth at all cost' during the first three decades of China's 'reform and opening-up' period to 'sustainable growth - economically, socially and ecologically.'
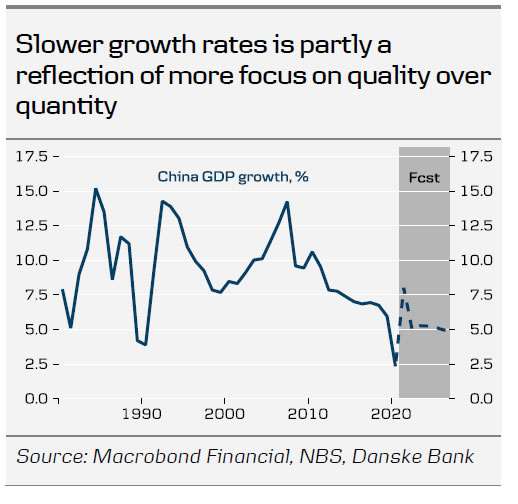
It puts much more focus on the long term goals and less on short term growth targets. China is far from having achieved many of these goals but the strategy and plans reflect the priorities of Beijing. The key pillars in the economic agenda are:
- More economic efficiency: One element of this is improved functioning of markets through for example anti-monopoly regulation, fighting vested interests and corruption, creating a better business environment – not least for SME's, improving governance of state owned enterprises and a better allocation of capital through better functioning financial markets. Protection of intellectual property rights and 'rule of law' is increasingly prioritized to create a transparent business environment where rights are protected. Capital is also increasingly directed towards high-tech manufacturing, R&D and 'smart infrastructure' (5G, cloud tech etc.) and less so to construction and traditional infrastructure such as roads and bridges. Innovation is a cornerstone in China's development strategy. Education and nurturing talent also play a key role in this. Finally short term stimulus measures aim increasingly to serve long-term needs as well such as 'smart infrastructure' projects and reduction of costs for businesses.
- Macroeconomic stability: A stable economic environment facilitates business investments but China is less fixated on a specific growth target and now sets targets that are easier to reach in order to avoid wasteful investments by local governments just to reach the target. China allows short term downturns but aims to keep a selection of indicators, such as employment and income growth, within a certain range.
- Dual circulation and improved self-sufficiency: The tech war with the US and to some extent the Covid crisis have made it clear, that China is vulnerable in certain parts of the supply chain. The dual circulation strategy aims to strengthen the weak links in supply chains and have a higher degree of self-sufficiency on key components and materials, such as technology, energy and food. At the same time China wants to develop a stronger domestic market while keeping the door open for foreign production in China. In that sense, China can become more independent of the world but at the same time keep the world dependent on China.
- Social balance: In China's view the economic development is only sustainable if it also comes with social balance. The polarisation and high inequality in the US are seen as a lack of focus on social balance. The increased emphasis on 'common
prosperity' suggests that in the new era, China will increasingly work on a more inclusive economic development compared to the previous decades. Education, social policies, regional strategies to decrease imbalances across the country, more affordable housing, a property tax and higher taxation on the rich and big corporations are likely tools that will get an even stronger weight. China has signalled it will be a gradual process, though, and not a sudden shift. - Ecological balance: Finally, sustainable development implies a much stronger focus on the environment and climate. China has strengthened environmental laws and the enforcement of them and the climate goal of achieving carbon neutrality in 2060 was formulated by Xi Jinping in 2020.
#5: Will tensions over Taiwan increase further?
Short answer: Probably not but high level of tensions is set to continue.
There is no doubt that tensions over Taiwan have increased in the past years and the 'strategic equilibrium' has been challenged. Frictions started to increase following two key political events: First, in 2016 Taiwan's current president Tsai Ing-Wen came to power as leader of the pro-independence Democratic Progressive Party taking over from the more pro-Beijing KMT party. Second, the election of Donald Trump for US President in the same year, which marked a clear hardening of US policy on China including on the Taiwan issue.
When Tsai Ing-Wen made a phone call to the at the time President-elect Trump in November 2016 to congratulate him, it was clear that a shift was under way that would challenge the US 'One-China' policy, which had been in place since 1972 and implied no diplomatic relations with Taiwan since 1979. For the past five years tensions have only increased and reached a new peak in 2021 with more US support for Taiwan and an increase in semi-diplomatic relations. China has responded by increasing military drills in the area and a record number of flights into Taiwanese air space. From China's perspective, Taiwan is Chinese taken from them by Japan in 1895
It has raised the question whether we are on course to a military confrontation. While risks have increased, most experts agree that a war within the next couple of years is unlikely, see for example this article from The Conversation. A war will come with significant risks for all three players. For China, it is likely to come with significant casualties and with many challenges to military success no matter which strategy they choose (surprise attack, full invasion or blockade). Add to this the risk of US intervention that could spiral out of control. Significant economic sanctions by the West and export bans of key technologies could cause severe disruption to the Chinese economy. For the US, intervention could also bring significant losses that American people might not be willing to sacrifice. As well as the similar risk as China faces of things spiralling out of control. And for Taiwan a war could, of course, be very costly with the risk of occupation and suppression and loss of many human lives.
China has been clear that Taiwan needs to come back to the mainland eventually, preferably peacefully but if necessary by force. But in a call with US President Biden, Xi Jinping said that "we have patience and will strive for the prospect of peaceful reunification with utmost sincerity and efforts", see overview hereof Xi's comments on Taiwan over the six monts. China is likely to respond with increasing military drills etc. whenever the US or Taiwan pushes closer to the 'red lines' to underline that China is serious about taking Taiwan if the 'red lines' are crossed. But at the same time, while the US and Taiwan are set to continue to confront China and push as close as possible to the 'red lines', they are unlikely to cross them due to the above mentioned reasons.
Despite the confrontations, the US has continued to officially state support of the 'One China' policy, although in practice it often take steps that seem at odds with it. It has also stuck to the so-called 'strategic ambiguity' where it sticks to the support for Taiwan to defend itself but without stating outright that the US would defend Taiwan directly in the case of war. This is a sign that while the US supports Taiwan, there is a limit to how much they wish to challenge Beijing.
So what are the 'red lines' that could trigger war? A clear declaration of independence from Taiwan with support from the US will likely be one of them (it is unlikely that Taiwan would make such a declaration without talking to the US first).
It cannot be ruled out that a possible new Republican government in 2024 in the US would go further than the Biden administration. But in our view it is unlikely we will see a war during the Biden administration. However, we should expect tensions to remain high and might even go higher in 2022.
Financial implications: Equities to recover, CNY to weaken
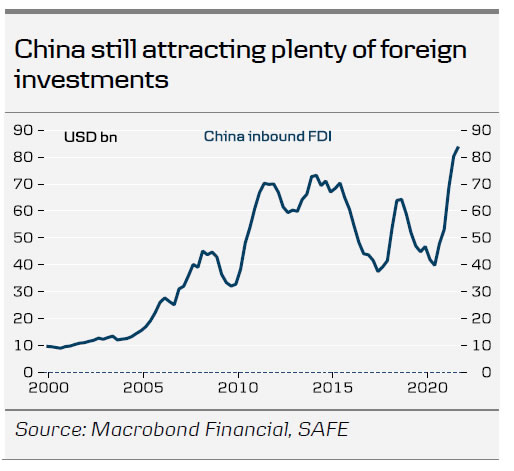
With China likely to recover this year and the crackdowns turning down a notch or two, we believe there is upside to Chinese stocks in 2022 – especially in the offshore market as this has taken the biggest hit in 2021.
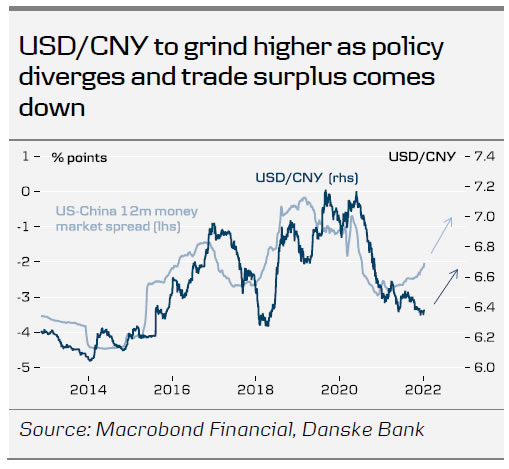
For the CNY, we expect the combination of easing monetary policy by the PBoC and Fed hikes starting this spring is set to underpin a move higher in USD/CNY. Importantly, we also look for a decline in China's trade surplus as exports will likely lose some steam while we look for imports to turn higher in line with the increase in domestic demand.
For global stock markets, the gradual recovery in China should provide some support but it will take place alongside headwinds from slower global growth, Fed tightening and less support from central bank liquidity.
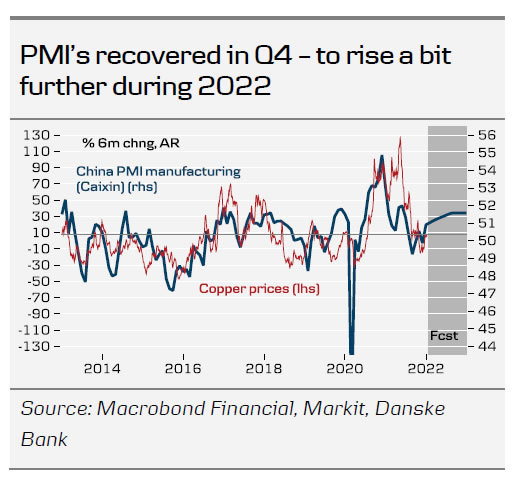
Looking to commodity markets, a Chinese recovery driven by investments will increase commodity demand from China. However, it will be a moderate recovery and also come in a year where global manufacturing outside China is set to see slower momentum. So commodity prices should still see only moderate increases which will help reduce global inflation pressures from this angle (wage growth will work in the other direction, though).
Cryptocurrencies Rebounded as Part of a General Downward Trend
The value of the cryptocurrency market rose almost 3% over the past 24 hours to 2.07 trillion. Exceeding the psychologically important circular mark pulled demand for coins outside the top 10.
Separately, bitcoin enjoyed demand from the pull into risky assets in traditional financial markets and the weakening dollar. Bitcoin has fallen slightly short of the entire crypto market since the beginning of the week, pushing its share down to 40%.
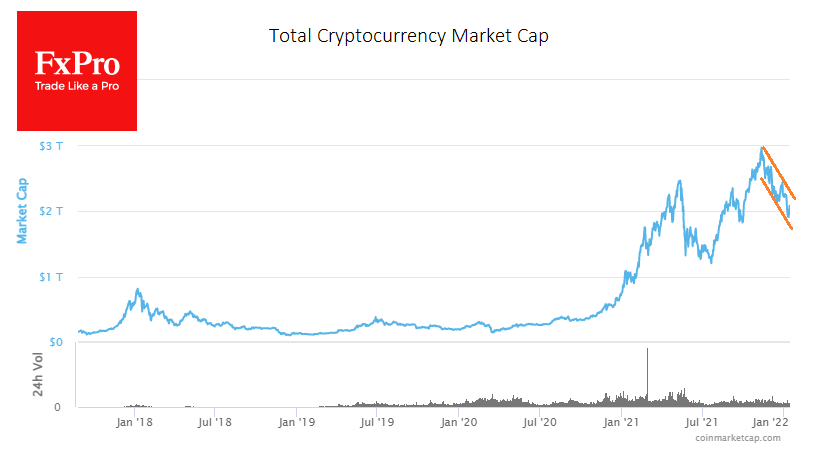
However, it is too early to say that a new rally in crypto has begun. The crypto market remains 30% below its peaks in early November, and capitalisation growth is uneven.
Interestingly, the cryptocurrency fear and greed index lost 1 point to 21 overnight, despite increasing market cap.
Yesterday’s rise did not gain traction at the start of the day on Thursday. Fixing above $45K against $43.5K now would confirm the strength of the bulls. It is reasonable to talk about a rebound within the descending channel until that time.
If the dollar goes back to growth in the nearest future, it will pressure stock markets. The cryptocurrency market, in these circumstances, risks reversing back to the downside, stopping the rebound and remaining in a prolonged downtrend channel. We should be wary of a smooth decline like this, as it drains optimists. We saw a similar descent in 2018 when the fall became uniformly smooth in the second half of the year, and a wide range of crypto-enthusiasts switched to standby mode until mid-2020.
Technical Analysis Suggests Deeper Correction for the Dollar
Fundamental and technical factors on the dollar locally give opposite signals. However, after a long period of strengthening the American currency, a corrective DXY pullback looks like a logical short-term prospect.
On Wednesday, the US dollar came under pressure, the sharpest loss since last May and coming out of a prolonged consolidation. The dollar index retreated below 95 for the first time in two months.
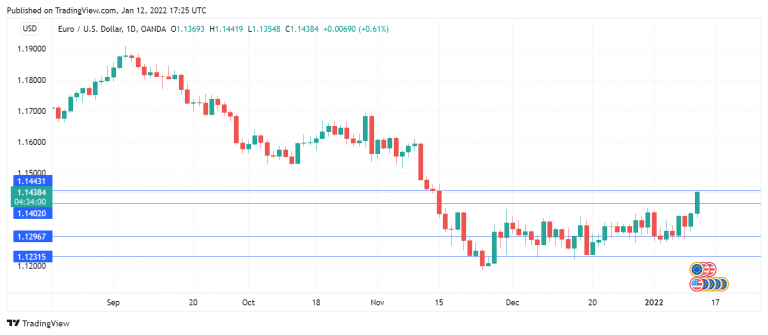
EURUSD surpassed 1.1400, trading at 1.1440 at the time of writing, having consolidated beyond the narrow range where the pair had spent the previous almost two months.
Often such a decisive move out of the range is followed by a further breakout move, which we may well see in the coming days.
The Dollar Index closed below the 50-day moving average on Tuesday and made a further move lower on Wednesday. The fall out of the range gave an informal start to the correction after the rally from May through most of November and the sideways movement in December.
A potential target for such a pullback is seen in the 93.50-94.00 area. Near 94 is the 61.8% Fibonacci retracement of the dollar’s move amplitude in 2021 and the starting point of the last rally in November. Near 93.50, the peak area of the index last year could be equally strong support.
It hardly makes sense to say now that we are seeing the start of a big wave of dollar decline, as solid fundamentals support its growth. It looks like Fed members started a competition on whose expectations and comments are the most hawkish, and consumer inflation has given little reason to change the rhetoric.
Among the latest comments is Powell’s reassurance that the economy can cope with rate hikes. Fighting inflation is a top priority for the US central bank. Mary Daly, president of the Federal Reserve Bank of San Francisco, predicts a first rate hike as early as March. This practically rules out a pause between the end of balance buying and the first policy tightening.
Furthermore, there are increasing signs that rate increases can continue to occur more frequently than once a quarter, as was the case in the previous tightening cycle. Many other central banks in developed countries are not yet prepared to tighten their policies as vigorously, which generally creates a sustained pull towards the USD on the interest rate differential in its favour.
Dollar Skids Despite US Inflation Jump, Euro Cracks above Range
- US dollar is pummelled as strong CPI fails to galvanize the bulls
- More Fed officials flag March rate hike but yields go nowhere
- Wall Street extends rebound but earnings may hold the key to more gains
US inflation hits 7%, markets take it in their stride
It was another disconcerting inflation report out of the United States on Wednesday as headline CPI edged up to 7.0% in December – the highest since 1982. But the figure was in line with expectations and hopes are rising that inflation is close to peaking. With fed funds futures already configured by investors to foretell at least three rate hikes this year and Treasury yields climbing to post-pandemic highs in January, the market’s job of pricing in higher inflation and higher borrowing costs may be done.
That’s assuming of course that inflation really is near its peak and the Fed won’t have to move more aggressively in tightening policy than it has already signalled. There has been a chorus of Fed speakers this week calling for interest rates to start rising immediately after tapering ends in March.
It will be interesting to see if Fed Vice Chair nominee, Lael Brainard, who is one of the more dovish FOMC members, will join that camp when she testifies before lawmakers later today. Chair Powell has so far not been specific about the timing of liftoff but has strongly hinted that March is an option.
Stocks mostly bullish after US CPI, earnings eyed
However, as long as the current inflation outlook holds, markets seem comfortable with the expected pace of rate hikes by the Fed. The big risk is if inflation doesn’t peak soon or doesn’t come down fast enough and the Fed is forced to press even harder on the monetary brakes. On the other hand, if yields don’t rise much further beyond current levels, the rally on Wall Street may still have some steam left in 2022.
US stocks extended their recovery on Wednesday, with the S&P 500 closing up 0.3% and the Nasdaq Composite by 0.2%. E-mini futures were slightly in the red on Thursday and Asian and European stock markets were mixed, signalling some caution.
There is still some uncertainty about the Omicron outbreak as well as ongoing concerns about the Chinese economy. China’s embattled real estate sector keeps flashing red as more property developers are seeking to extend the deadlines of their debt payments, while a smaller-than-expected increase in bank lending in December added to the somewhat downbeat sentiment in Asia today.
The main focus, though, for equity markets over the next few weeks will be on the latest US earnings season. Delta Air Lines will announce its earnings results before today’s market open but the season won’t properly kick off until tomorrow when the big banks begin to report.
Dollar slumps, euro comes alive
In the FX sphere, there was a much more notable reaction to the latest US inflation stats as the dollar took a heavy beating. Although the month-on-month CPI increase was slightly bigger than forecast and there was little to suggest that price growth will moderate soon, markets don’t see the Fed’s policy path being driven off course for the time being. Hence, the dollar rally may have run its course and key barriers were broken on Wednesday as the euro finally cracked the ceiling of its two-month old range. It’s continuing its ascent today, climbing to around $1.1465.
The dollar index, meanwhile, fell through the floor of its sideways channel, hitting a low of 94.71.
Aside from the euro, the Australian dollar was the other big winner, surging past the $0.73 level today. The loonie and kiwi also rose to two-month highs and sterling shot above $1.37 to reach an 11-week high.
Commodities rallied too on the back of the weaker dollar, though oil prices were somewhat held back by a mixed US inventories report and gold was back under pressure today.
WTI Futures Upside Risks Intact Despite Minor Pause
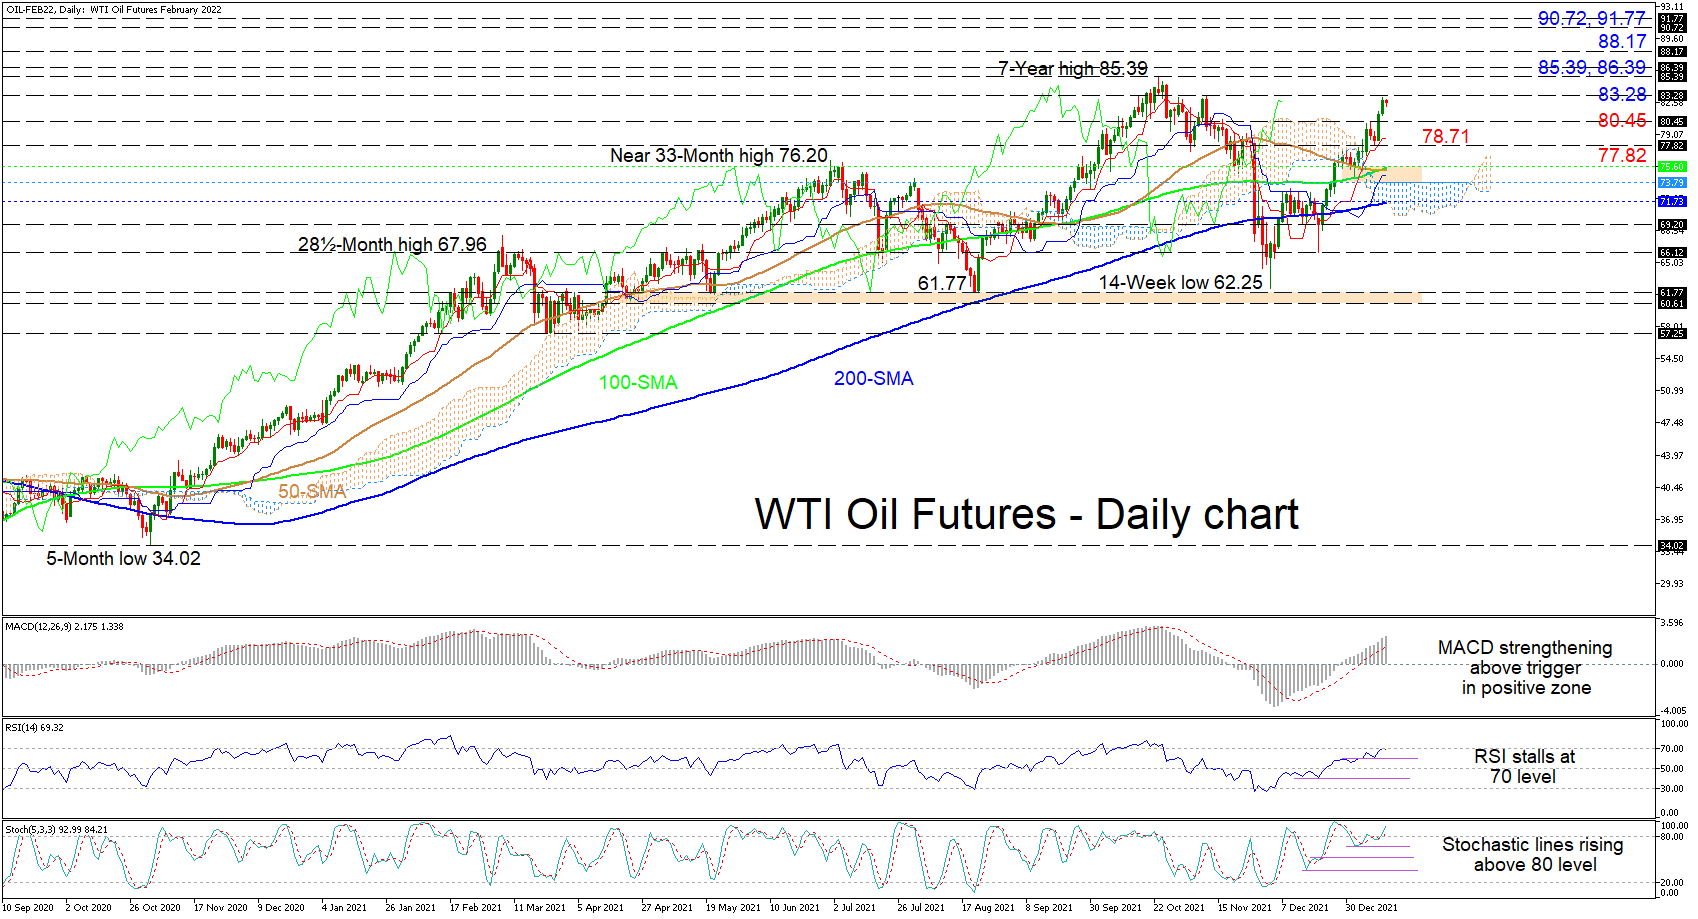
WTI oil futures have managed to maintain their bullish bearing, which began at the start of December 2021 from 62.25, and are currently facing the November 10 high of 83.28. The longer-term simple moving averages (SMAs) are sustaining a positive incline, backing the broader uptrend in the commodity.
The Ichimoku lines are indicating a small pause in bullish impetus, while the short-term oscillators are suggesting additional advances in the black liquid. The MACD, in the positive zone, is distancing itself further north of the red trigger line, while the positively charged stochastic oscillators’ lines are promoting extra price gains. The RSI is toying with the 70 overbought level but is not showing significant signs that sellers are starting to gain an advantage.
In the positive scenario, resistance may originate from the 83.28 barrier prior to buyers confronting the seven-year high of 85.39 and the nearby resistance obstacle of 86.39. Conquering these hurdles could reinforce optimism and encourage buyers to further aim for the 88.17 level before pursuing the 90.72 and 91.77 highs, from the early part of October 2016.
If upside progress is curbed by the 83.28 boundary, support could commence from the 80.45 mark ahead of the red-Tenkan-sen line at 78.71 and the adjacent 77.82 low. Dropping from here, the sellers may meet a hardened support zone moulded between the 100-day SMA at 75.60 and the Ichimoku cloud’s upper band at 73.79. Should a deeper retracement evolve, the 200-day SMA at 71.73 and the clouds lower band could come into play.
Summarizing, WTI oil futures are sustaining a bullish bias above the 77.82 low and the 73.79-75.60 support band. That said, a drop in the price beneath the 200-day SMA could start to feed negative tendencies in the commodity.
Streaking Pound Pushes Past 1.37
The British pound has extended its gains for a third straight day. In the European session, GBP/USD is trading at 1.3736, up 0.23% on the day.
There are no tier-1 events out of the UK today, so market participants will have to wait until Friday for a data damp which includes the monthly GDP report and Manufacturing Production. That doesn’t mean things are dull in the UK, with Boris Johnson and Brexit in the headlines.
Are the knives being sharpened for Boris?
There have been some key political developments which could have an impact on the financial markets. First, Prime Minister Boris Johnson is fighting for his job, after admitting that he broke Covid regulations by attending a party at his residence in May 2020, in the middle of a lockdown. Johnson’s claim that he thought it was a work event has been met with ridicule, and most serious for him, some senior Conservatives have joined in calls for his resignation. This latest escapade may prove to be one scandal too many for the feisty prime minister. An official inquiry into the matter will be published next week, and the verdict could determine whether Johnson remains as prime minister.
The conundrum over Northern Ireland will again be tackled, as the UK and EU are holding talks on how to avoid a hard border between Northern Ireland and Ireland and reaching an agreement on border checks between Northern Ireland and the rest of the UK. The sides have not been able to make much progress until now, but a surprise breakthough would bolster the pound.
In the US, all eyes are on the December PPI, after headline CPI for December jumped 7.0% YoY. Despite the high reading, investors were calm as the reading matched the forecast, and GBP/USD posted strong gains after the CPI release.
GBP/USD Technical Analysis
- 1.3650 has switched to a support role as GBP/USD continues to climb. Below, there is support at 1.3482
- GBP/USD is testing resistance at 1.3708. This is followed by resistance at 1.3818
Dollar Index Falls to Two-Month Low on ‘Buy the Rumor-Sell the Fact’
The dollar continues to travel south in early Thursday, extending previous day’s 0.63% post-US CPI data drop (the biggest one-day fall since Oct 28).
The dollar came under pressure after Fed Powell’s speech, which investors saw as too cautious, while further disappointment came from Dec CPI numbers coming at forecasted level although inflation rose to the highest in nearly four decades.
Rising price pressures keep the Fed on track towards tightening monetary policy, with the first rate hike expected as early as March and further two-to three hikes to follow, however, cautious tone from Powell and some comments that inflation have peaked in December, discouraged traders and prompted them out of dollar.
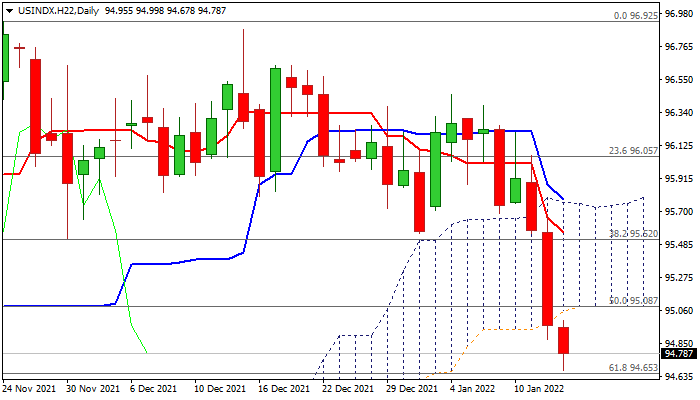
Bears hit two-month low and pressure pivotal Fibo support at 94.65 (61.8% of 93.24/96.92 upleg, reinforced by rising 100DMA) after generating strong bearish signal on Wednesday’s break and close below thick rising daily cloud.
Daily studies maintain strong bearish momentum and MA’s (10/20/30) formed bear-crosses, supporting fresh weakness, which could extend to 94 zone (Fibo 38.2% of 2021 89.50/96.92 uptrend), on break of 94.65 pivot.
Broken daily cloud base (95.08, also broken 50% of 93.24/96.92) reverted to solid resistance, which should ideally keep the upside limited and maintain fresh bears.
Res: 95.08; 95.62; 95.75; 96.05.
Sup: 94.65; 94.09; 93.79; 93.24.
ECB bulletin: Eurozone output to exceed pre-pandemic level in Q1
In the monthly economic bulletin, ECB said, "the global economy remains on a recovery path, although persisting supply bottlenecks, rising commodity prices and the emergence of the Omicron variant of the coronavirus (COVID-19) continue to weigh on the near-term growth prospects."
"Supply bottlenecks are expected to start easing from the second quarter of 2022 and to fully unwind by 2023." But "the future course of the pandemic remains the key risk affecting the baseline projections for the global economy." Risk to growth outlook are "tilted to the downside" and balance of risks to global inflation is "more uncertain".
Eurozone growth is "moderating" but "activity is expected to pick up again strongly in the course of this year." Output is expected to exceed pre-pandemic level in Q1 of 2022. However, as some Eurozone countries have reintroduced tighter restrictions, "this could delay the recovery, especially in travel, tourism, hospitality and entertainment".