Sample Category Title
WTI Futures Upside Risks Intact Despite Minor Pause
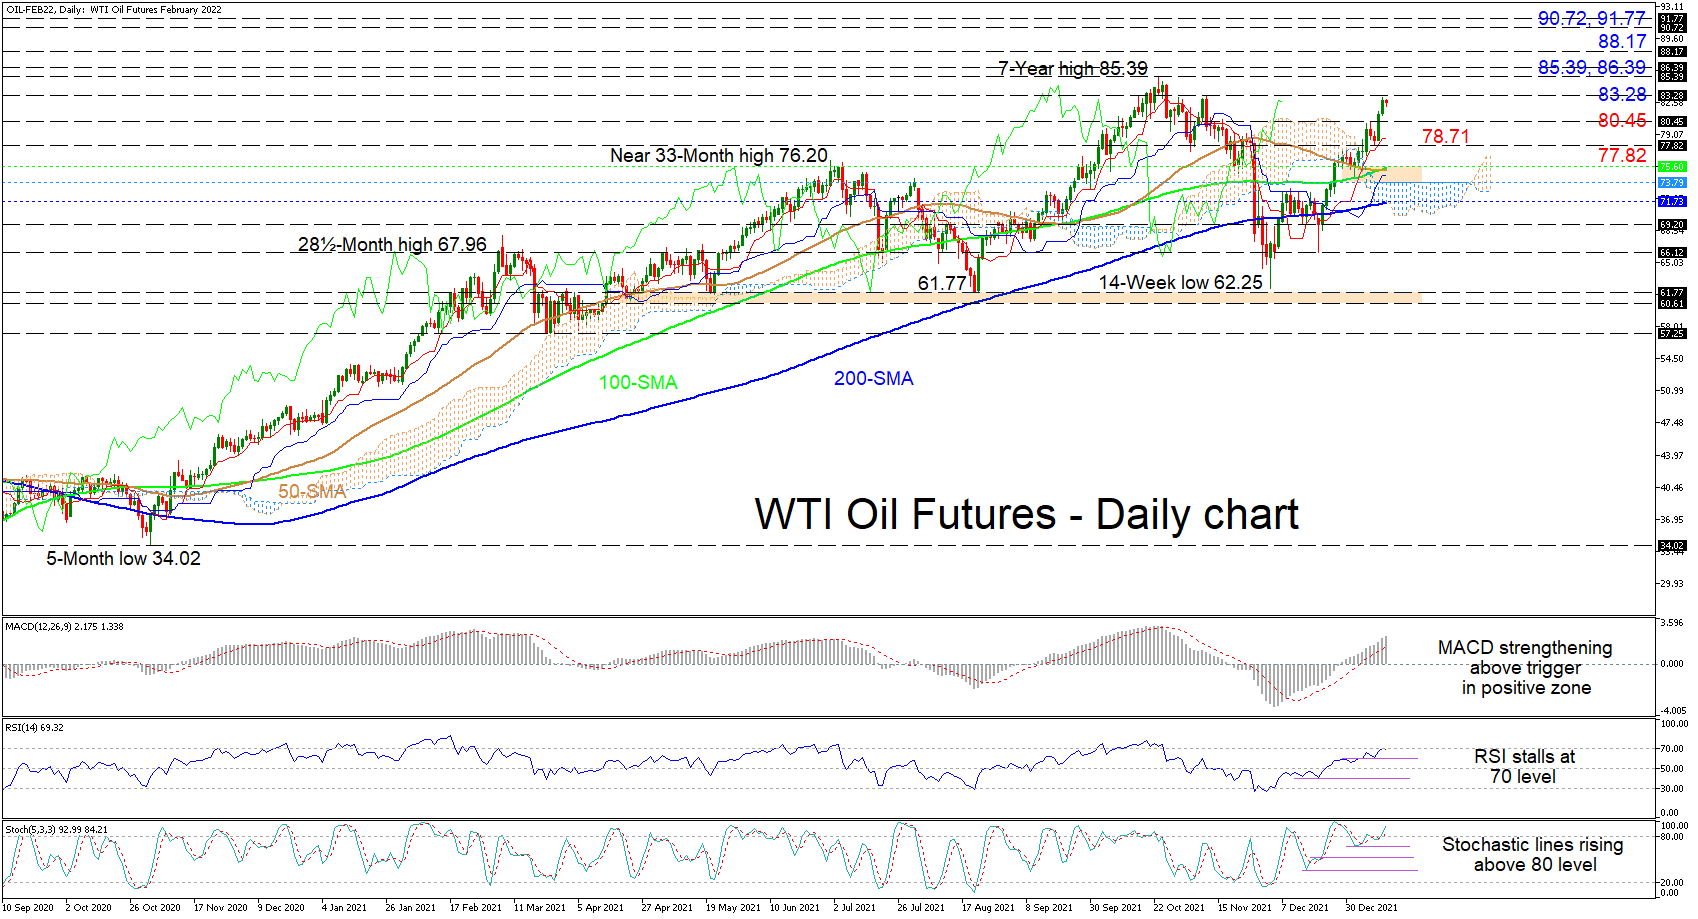
WTI oil futures have managed to maintain their bullish bearing, which began at the start of December 2021 from 62.25, and are currently facing the November 10 high of 83.28. The longer-term simple moving averages (SMAs) are sustaining a positive incline, backing the broader uptrend in the commodity.
The Ichimoku lines are indicating a small pause in bullish impetus, while the short-term oscillators are suggesting additional advances in the black liquid. The MACD, in the positive zone, is distancing itself further north of the red trigger line, while the positively charged stochastic oscillators’ lines are promoting extra price gains. The RSI is toying with the 70 overbought level but is not showing significant signs that sellers are starting to gain an advantage.
In the positive scenario, resistance may originate from the 83.28 barrier prior to buyers confronting the seven-year high of 85.39 and the nearby resistance obstacle of 86.39. Conquering these hurdles could reinforce optimism and encourage buyers to further aim for the 88.17 level before pursuing the 90.72 and 91.77 highs, from the early part of October 2016.
If upside progress is curbed by the 83.28 boundary, support could commence from the 80.45 mark ahead of the red-Tenkan-sen line at 78.71 and the adjacent 77.82 low. Dropping from here, the sellers may meet a hardened support zone moulded between the 100-day SMA at 75.60 and the Ichimoku cloud’s upper band at 73.79. Should a deeper retracement evolve, the 200-day SMA at 71.73 and the clouds lower band could come into play.
Summarizing, WTI oil futures are sustaining a bullish bias above the 77.82 low and the 73.79-75.60 support band. That said, a drop in the price beneath the 200-day SMA could start to feed negative tendencies in the commodity.
Streaking Pound Pushes Past 1.37
The British pound has extended its gains for a third straight day. In the European session, GBP/USD is trading at 1.3736, up 0.23% on the day.
There are no tier-1 events out of the UK today, so market participants will have to wait until Friday for a data damp which includes the monthly GDP report and Manufacturing Production. That doesn’t mean things are dull in the UK, with Boris Johnson and Brexit in the headlines.
Are the knives being sharpened for Boris?
There have been some key political developments which could have an impact on the financial markets. First, Prime Minister Boris Johnson is fighting for his job, after admitting that he broke Covid regulations by attending a party at his residence in May 2020, in the middle of a lockdown. Johnson’s claim that he thought it was a work event has been met with ridicule, and most serious for him, some senior Conservatives have joined in calls for his resignation. This latest escapade may prove to be one scandal too many for the feisty prime minister. An official inquiry into the matter will be published next week, and the verdict could determine whether Johnson remains as prime minister.
The conundrum over Northern Ireland will again be tackled, as the UK and EU are holding talks on how to avoid a hard border between Northern Ireland and Ireland and reaching an agreement on border checks between Northern Ireland and the rest of the UK. The sides have not been able to make much progress until now, but a surprise breakthough would bolster the pound.
In the US, all eyes are on the December PPI, after headline CPI for December jumped 7.0% YoY. Despite the high reading, investors were calm as the reading matched the forecast, and GBP/USD posted strong gains after the CPI release.
GBP/USD Technical Analysis
- 1.3650 has switched to a support role as GBP/USD continues to climb. Below, there is support at 1.3482
- GBP/USD is testing resistance at 1.3708. This is followed by resistance at 1.3818
Dollar Index Falls to Two-Month Low on ‘Buy the Rumor-Sell the Fact’
The dollar continues to travel south in early Thursday, extending previous day’s 0.63% post-US CPI data drop (the biggest one-day fall since Oct 28).
The dollar came under pressure after Fed Powell’s speech, which investors saw as too cautious, while further disappointment came from Dec CPI numbers coming at forecasted level although inflation rose to the highest in nearly four decades.
Rising price pressures keep the Fed on track towards tightening monetary policy, with the first rate hike expected as early as March and further two-to three hikes to follow, however, cautious tone from Powell and some comments that inflation have peaked in December, discouraged traders and prompted them out of dollar.
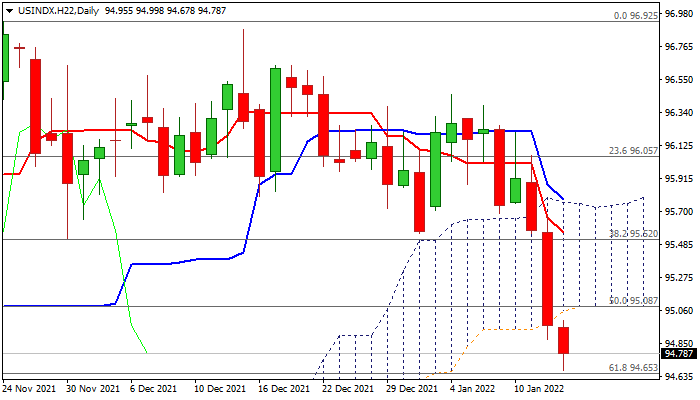
Bears hit two-month low and pressure pivotal Fibo support at 94.65 (61.8% of 93.24/96.92 upleg, reinforced by rising 100DMA) after generating strong bearish signal on Wednesday’s break and close below thick rising daily cloud.
Daily studies maintain strong bearish momentum and MA’s (10/20/30) formed bear-crosses, supporting fresh weakness, which could extend to 94 zone (Fibo 38.2% of 2021 89.50/96.92 uptrend), on break of 94.65 pivot.
Broken daily cloud base (95.08, also broken 50% of 93.24/96.92) reverted to solid resistance, which should ideally keep the upside limited and maintain fresh bears.
Res: 95.08; 95.62; 95.75; 96.05.
Sup: 94.65; 94.09; 93.79; 93.24.
ECB bulletin: Eurozone output to exceed pre-pandemic level in Q1
In the monthly economic bulletin, ECB said, "the global economy remains on a recovery path, although persisting supply bottlenecks, rising commodity prices and the emergence of the Omicron variant of the coronavirus (COVID-19) continue to weigh on the near-term growth prospects."
"Supply bottlenecks are expected to start easing from the second quarter of 2022 and to fully unwind by 2023." But "the future course of the pandemic remains the key risk affecting the baseline projections for the global economy." Risk to growth outlook are "tilted to the downside" and balance of risks to global inflation is "more uncertain".
Eurozone growth is "moderating" but "activity is expected to pick up again strongly in the course of this year." Output is expected to exceed pre-pandemic level in Q1 of 2022. However, as some Eurozone countries have reintroduced tighter restrictions, "this could delay the recovery, especially in travel, tourism, hospitality and entertainment".
Fed Harker open to more than three hikes if required
Philadelphia Fed President Patrick Harker said in an FT interview, "I currently have three increases in for this year, and I'd be very open to starting in March. I'd be open to more if that's required."
"We don't want to put the brakes on completely, but we do need to slow down some of the demand," he said. "We can do something . . . by raising the fed funds rate."
"Ultimately, what we worry about is that people start to think, 'Well, inflation is just not going to be at 2 per cent, it's going to be at 2.5 per cent or 3 per cent going forward'," he said.
As for the balance sheet run-off, Harker said if could start once interest rates were "sufficiently away" from zero. "I am very much in the camp of communicating over and over how we're going to do this and then being methodical," he said.
USDCHF Extends Retreat after Sharp Sell-Off
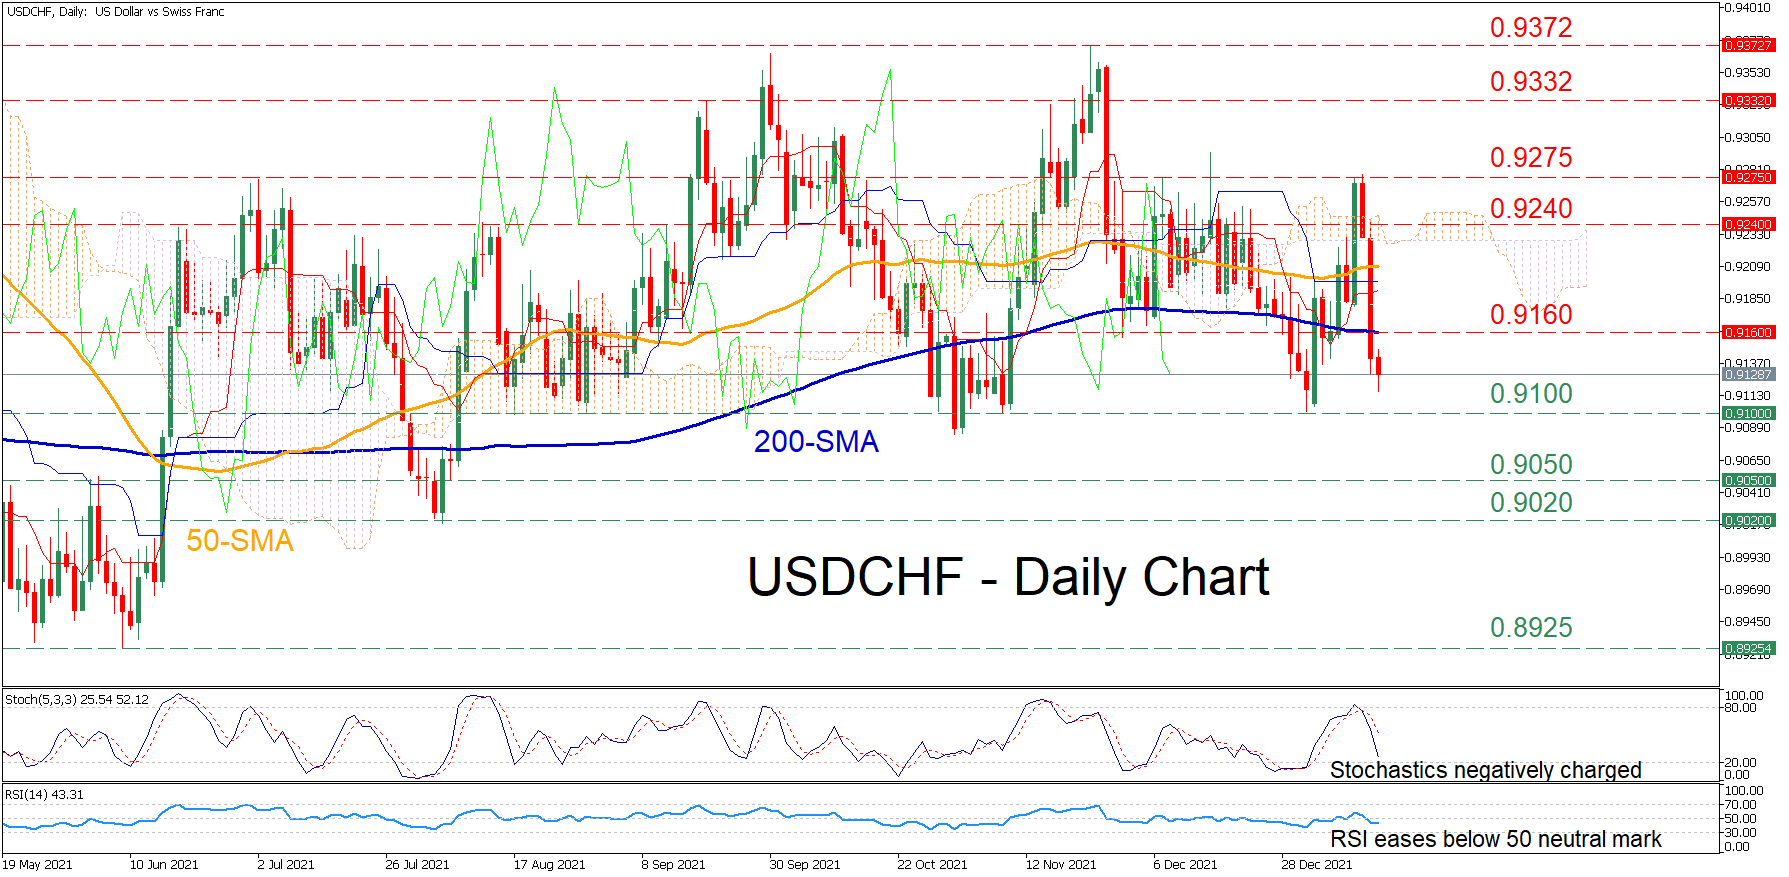
USDCHF has been marching higher in the medium-term, creating a profound structure of higher highs and higher lows. However, in the last few sessions the pair has experienced a moderate pullback as the price dived beneath both its 50- and 200-day simple moving averages (SMAs).
The recent retreat is likely to continue as the momentum indicators depict that negative momentum has strengthened. The stochastic oscillator is sloping downwards, while the RSI has flatlined in the negative area. Additionally, the price is currently trading far beneath the Ichimoku cloud.
Should the selling pressure intensify further, immediate resistance could be encountered at the recent low of 0.9100. Piercing through this barrier, the price might dip towards 0,9050 or lower to challenge the 0.9020 level. If the bears overcome these obstacles, the spotlight would turn to the 0.8925 hurdle.
Alternatively, if the bulls retake control, the 0.9160 region that overlaps with the 200-day SMA could act as an initial resistance point. Overcoming this barricade, the price could ascend towards the 0.9240 region. Higher up, the bulls might target 0.9275, before the price tests the 0.9332 region.
Overall, the short-term picture has deteriorated for USDCHF. For that bearish tone to reverse, the price needs to clearly cross above the 0.9275 region.
EURJPY Continues its Advance Amid Persisting Positive Forces
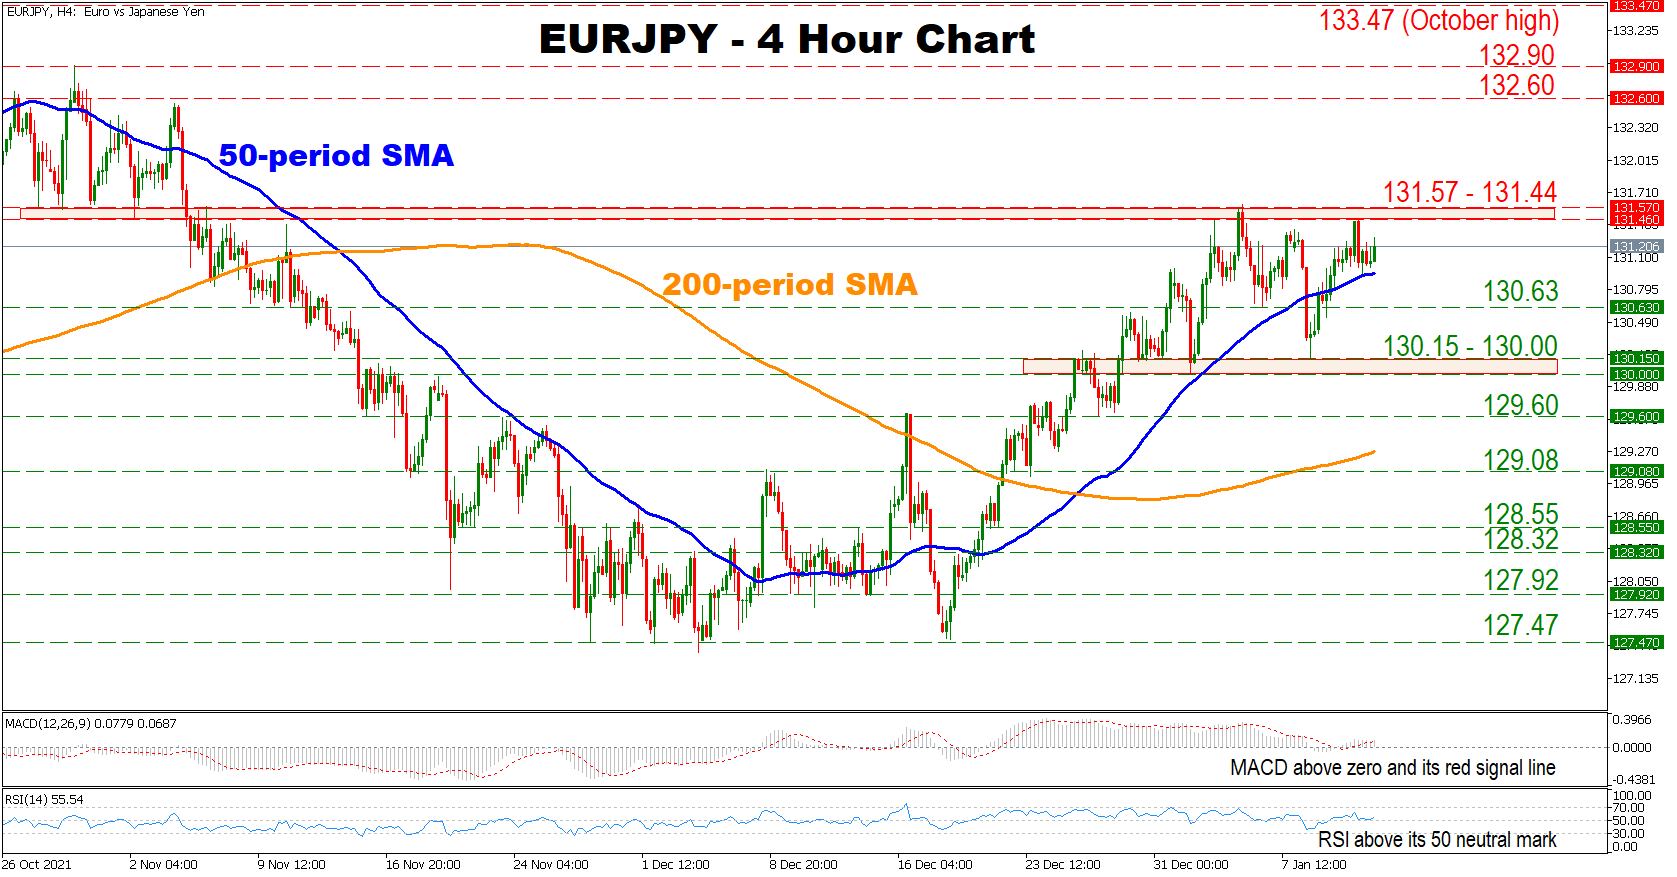
EURJPY continues its advance from the December lows, amid persistent positive momentum. Moreover, the pair’s successive higher lows together with the recent golden cross, where the 50-period simple moving average (SMA) has crossed above the 200-period SMA, reinforce the case for a sustained bullish outlook.
Short-term momentum indicators are also supporting a positive bias. The RSI is located above its 50 neutral mark, while the MACD is found above zero and its red signal line, which might indicate that momentum continues to gain traction, which could indicate that the optimistic bias might be gaining more traction.
Should the bulls maintain control, initial resistance might be found at the congested region which includes the 131.44 and 131.57 level. Crossing above the latter could strengthen the pair's bullish momentum, opening the door towards the 132.60 hurdle, before buyers shift their attention towards the 132.90 barrier.
On the flip side, if the price breaks below its 50-period SMA currently at 130.94, negative forces might resurface, sending the price to test the 130.63 obstacle. A break below that point could open the way towards the congested region which encapsulates the 130.15 and 130.00 support, before sellers eye the 129.60 obstacle.
In brief, the overall outlook for the pair is bullish. For sentiment to change, sellers would need to drive the price below the 50-period SMA.
AUDUSD Resumes Bullish Bias at 2-Month High
AUDUSD opened Thursday’s session on a positive note, aiming to repeat Thursday’s rally, which cracked the ceiling around 0.7274.
The price has already recovered half of November’s sell-off to trade at a 2-month high, with the momentum indicators hinting at additional gains as the RSI has bounced back above its 50 neutral level to mark fresh highs. Likewise, the MACD jumped to the highest level since November, while the rising Stochastics are still some distance below their 80 overbought number, signaling that there is more room for improvement in the market.
Further up, the pair could challenge the 61.8% Fibonacci retracement of the 0.7554 – 0.6992 downturn at 0.7376. The 200-day simple moving average (SMA) overhead at 0.7422 and marginally below the 78.6% Fibonacci could be a tougher obstacle given the strong rejection from the line at the end of October. Should the bulls claim that prize, buying pressures could accelerate towards the 3½ -month high of 0.7554 from October 28. Any step higher from here would upgrade the medium-term picture from neutral to bullish, bringing the 0.7640 resistance area next into view.
On the flip side, a drop below 0.7274 and back into the Ichimoku cloud could initially stabilize around the 20- and 50-day SMAs, which are currently overlapping with the 38.2% Fibonacci of 0.7207. Falling lower, the pair may test the 23.6% Fibonacci of 0.726 before meeting the 0.7280 support region. If the latter fails to cease selling pressures, the door will open for the 0.6992 bottom.
In brief, the latest upturn in AUDUSD switched the bias from neutral to bullish in the short-term picture, clearing the way towards the 0.7376 – 0.7422 key resistance territory. In the medium-term window, the bulls will need to run beyond 0.7554 to adjust the neutral outlook.

Equity Bulls Jittery, Dollar Sinks as Investors Digest Inflation Data
Most Asian shares ventured into negative territory this morning while European stocks markets have opened up marginally lower open after the December U.S. inflation report reinforced Fed rate hike expectations.
The U.S. consumer price index (CPI) jumped 7% year-on-year, matching the median forecast from economists surveyed by Bloomberg and up from 6.8% in November. Core inflation, which strips out volatile items like food and energy, rose 5.5%, well above the 4.9% reported in the previous month.
Markets initially offered a calm reaction to the hot report with Wall Street closing modestly higher on Wednesday. The most notable price action was seen in FX markets, with king dollar breaking down as Treasury yields pulled back, while gold bugs were injected with renewed confidence. The December CPI report has presented further evidence of persistent price pressures, especially with inflation registering its biggest annual gain since 1982.
As expectations intensify over the Fed raising interest rates as soon as March, this may weigh more heavily on global stocks. while supporting the dollar and Treasury yields in the medium term. Given how markets remain sensitive to comments from Fed officials, today could see more volatility with numerous Fed speakers on the roster.
Dollar Index (DXY) slams into 95.00
The dollar tumbled to a two-month low against a basket of currencies yesterday after the inflation figures for December matched expectations. Investors may have seen this data as bearish for the world’s reserve currency as they were possibly expecting the figures to be even hotter. Nevertheless, the headline surged 7% last month, its biggest year-on-year increase since June 1982 and seven of the last nine releases have now come in above consensus. Traders are currently pricing in an 84% probability of at least one rate hike by mid-March 2022.
Looking at the technical picture, the Dollar Index remains under pressure on the daily charts. A breakdown below 95.00 could open the doors towards 94.56 and 94.00, respectively.
Commodity spotlight – Gold
After notching its sharpest weekly loss since November, gold bulls have returned with a vengeance this week.
The precious metal continues to draw strength from a weaker dollar and slight pullback in Treasury yields with prices trading around $1826 as of writing. Inflation risks could also be supporting upside gains for gold which has often been considered a hedge against rising prices. With inflation in the United States jumping in December, this could encourage some investors to hold onto their gold investments.
However, the precious metal is certainly not out of the woods yet. The zero-yielding asset tends to perform poorly in a high interest rate environment. So, with the Fed expected to hike as soon as March, the road ahead for gold bugs could be filled with bumps and obstacles. On top of this, the dollar may regain its mojo on rate hike bets with Treasury yields pushing higher. Should this become a reality, gold could be in store for fresh pain down the road.
Technically, the precious metal has the potential to push higher towards $1845 if a daily close above $1831 is achieved. Alternatively, a decline back below $1810 could prices move lower towards $1800, $1786 and $1770.
US Oil Continues Upward
WTI crude climbed higher after a larger-than-expected fall in US inventories. A close above the daily resistance at 79.00 was a strong bullish sign.
Following a brief pause, the rally accelerated above 80.40. Sentiment remains upbeat and the bulls are keen to buy the dip during a pullback. A breach above 82.20 would clear the path to the peak at 85.00.
An overbought RSI may cause a temporary retreat. In that case, trend-followers could be looking to jump in near the closest support at 81.20.