Sample Category Title
Technical Outlook and Review
DXY:
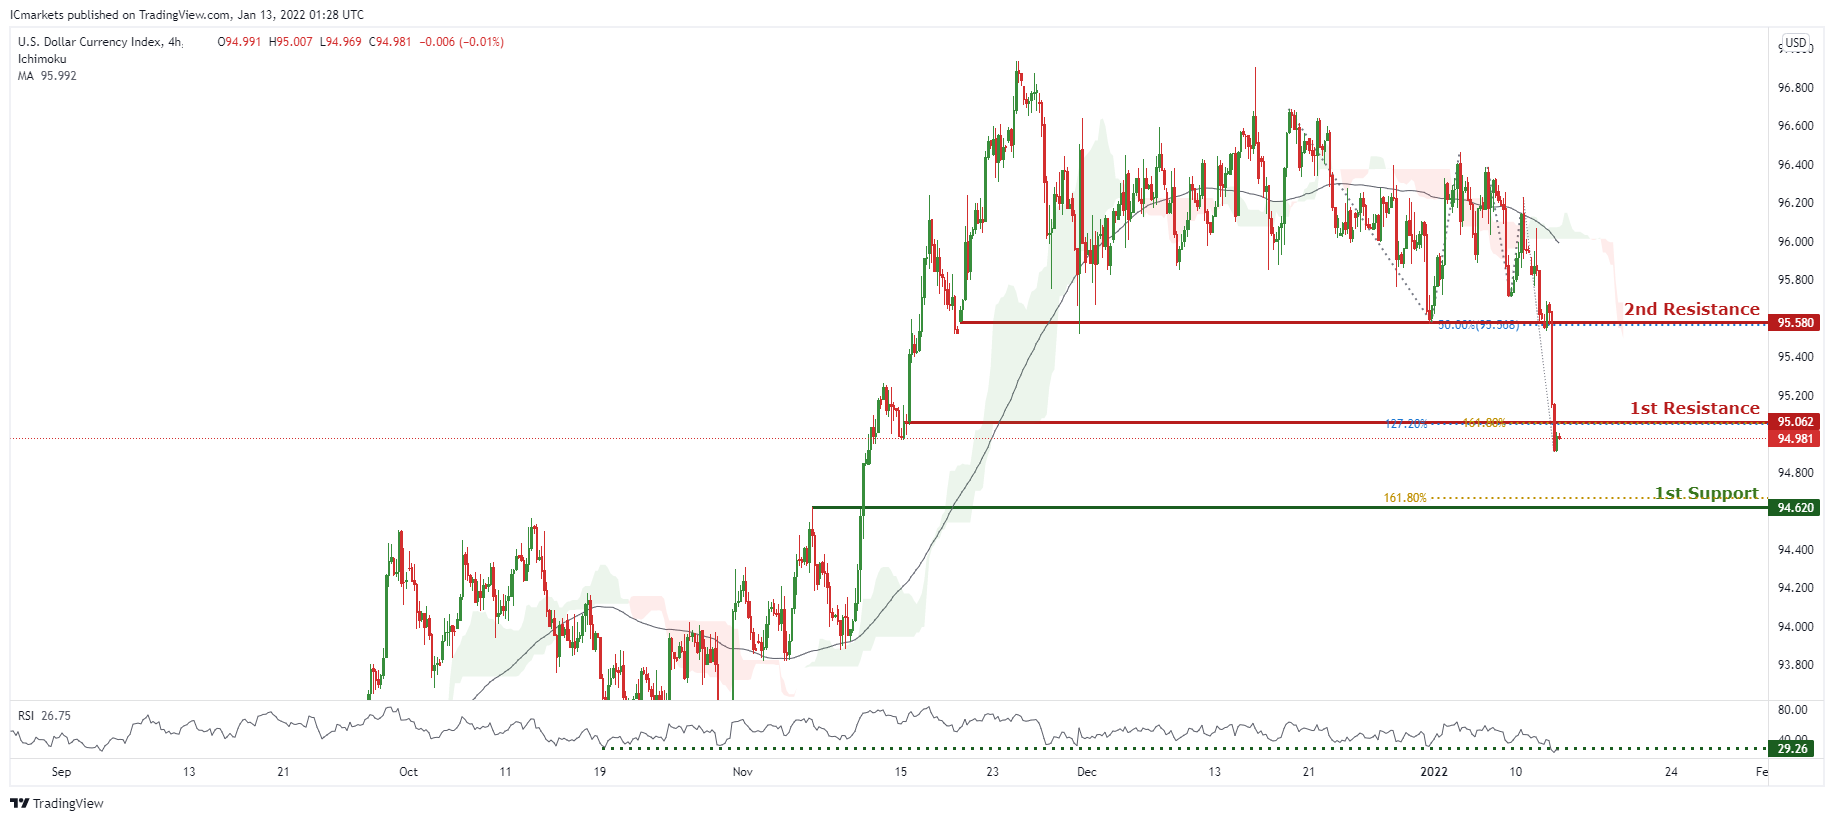
On the H4 timeframe, prices are on bearish momentum and abiding to our bearish trendline. We would expect further bearish continuation to test our 1st resistance at 95.062 in line with 127.2% Fibonacci extension and 161.8% Fibonacci projection. Our bearish bias is further supported by prices trading below ichimoku clouds and RSI forecasting bearish momentum.
Areas of consideration:
- H4 time frame, 1st resistance at 95.062
- H4 time frame, 1st support at 94.620
XAU/USD (GOLD):
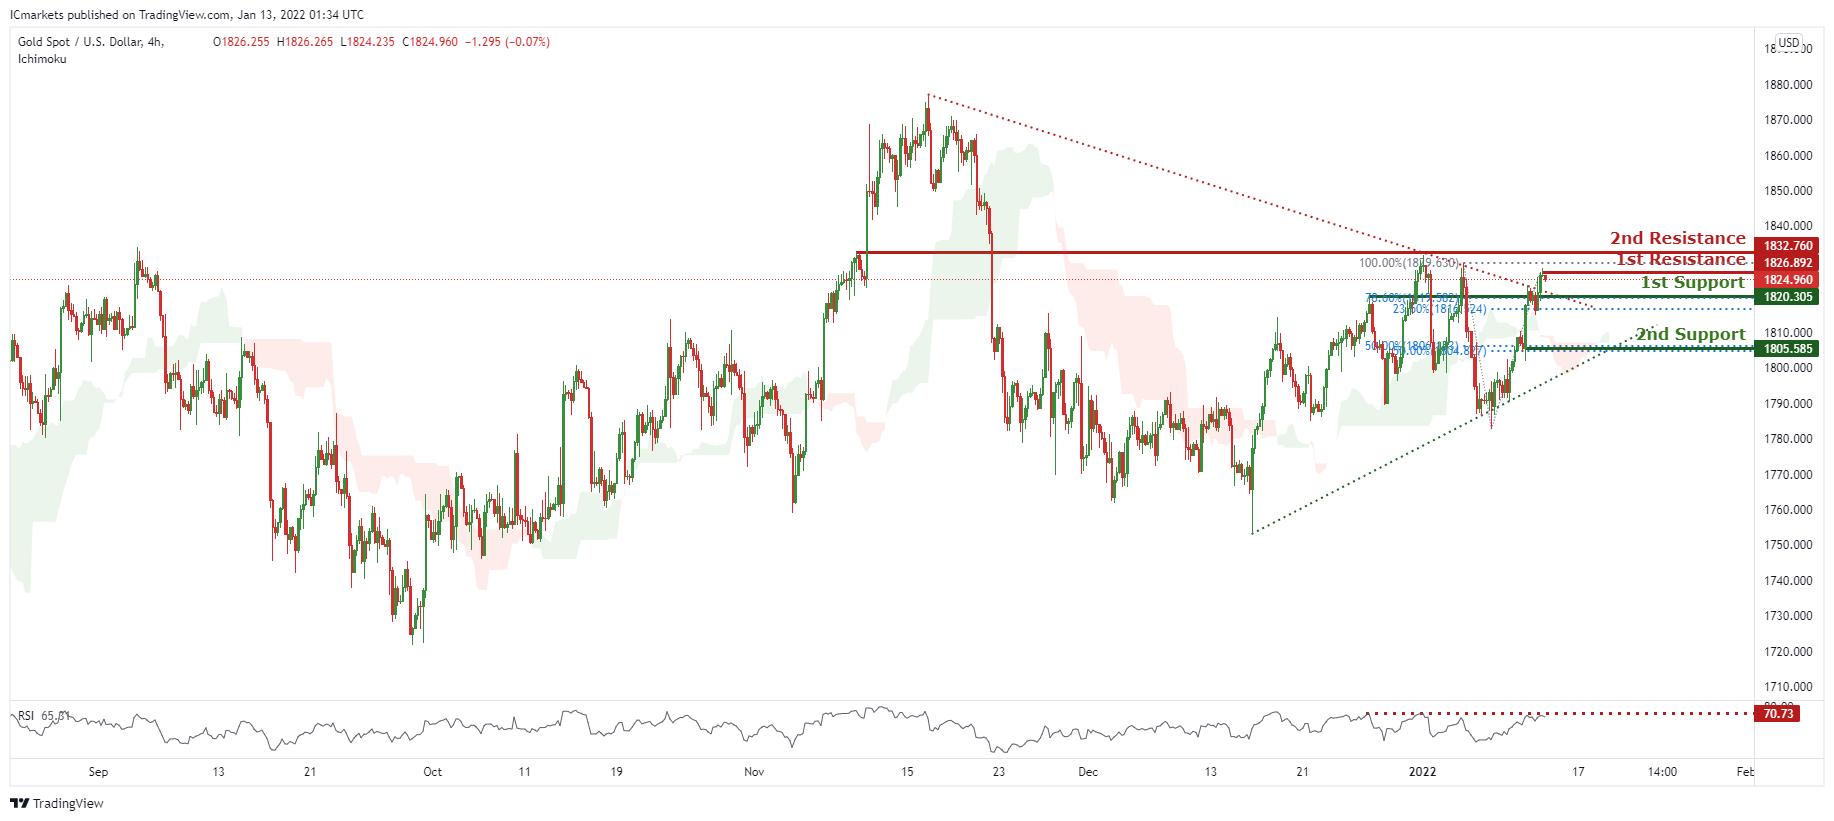
On the H4 chart, prices have broken out of the triangle. We see the potential for a dip from our 1st resistance at 1826.892 in line with 100% Fibonacci retracement towards our 1st support at 1820.305 in line with 78.6% Fibonacci extension and 23.6% Fibonacci retracement. RSI is at levels where dips occurred previously and ichimoku is turning red, further supporting our bearish bias.
Areas of consideration:
- H4 1st support at 1820.305
- H4 1st resistance at 1826.892
GBP/USD:
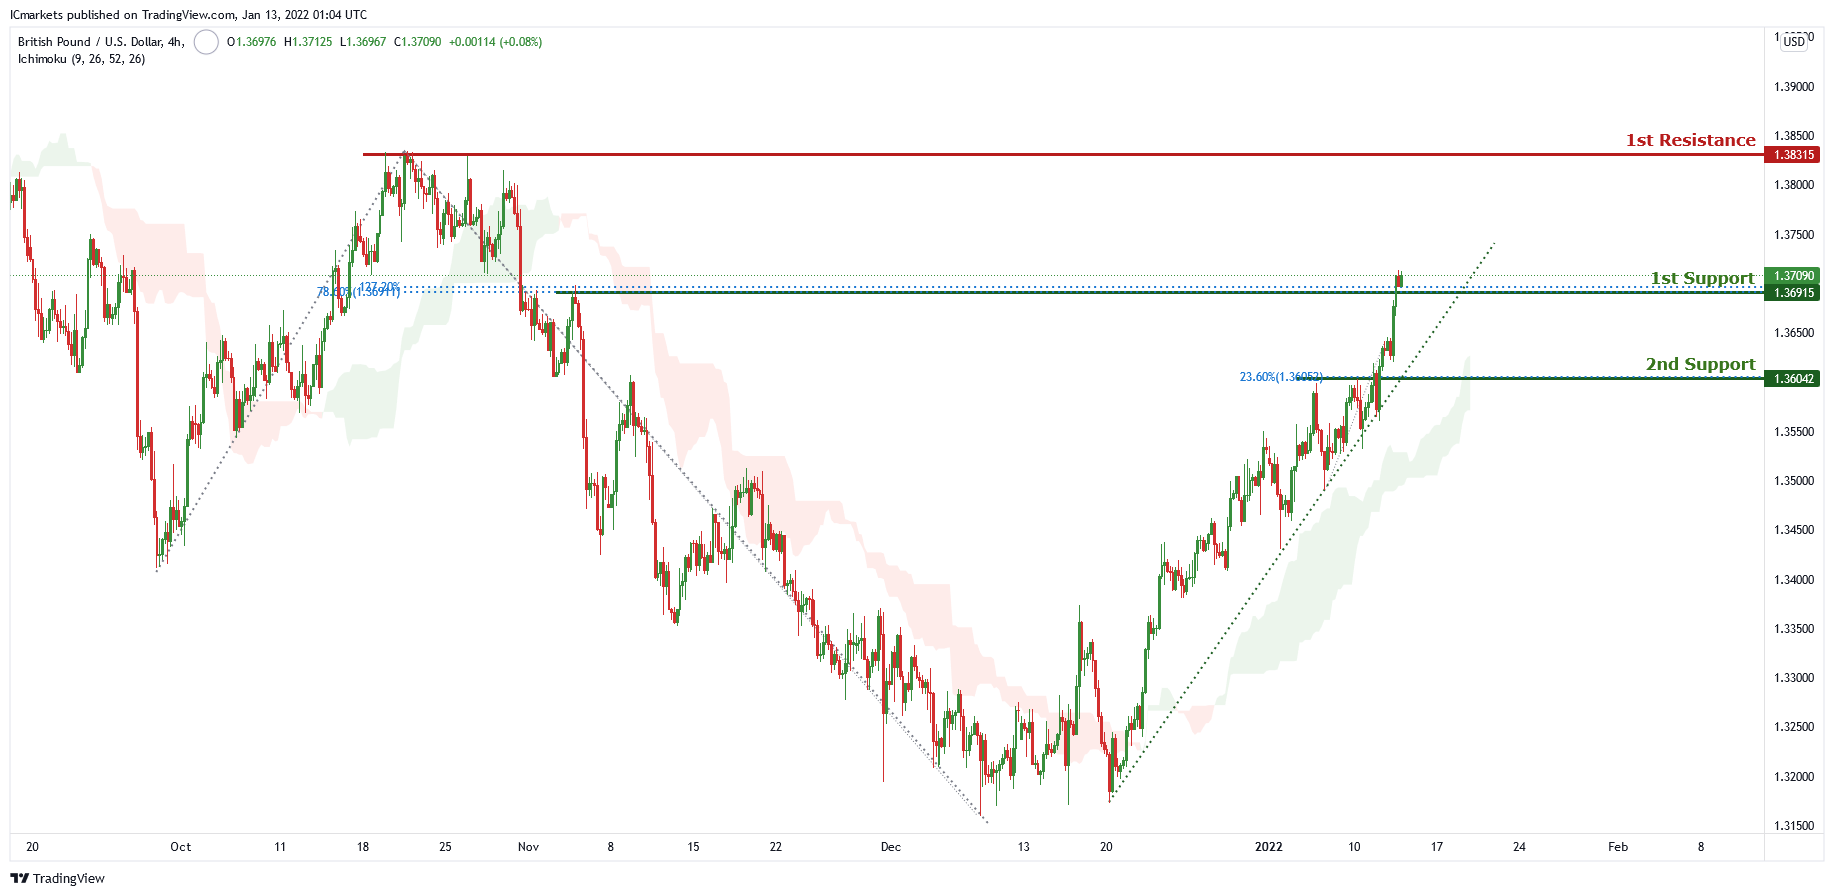
On the H4 chart price is abiding by an ascending trendline and near the first support level of 1.36915 which is also 78.6%% Fibonacci retracement and 127.2% Fibonacci projection . Price can potentially go to the 1st resistance level of 1.38315 which is the graphical swing high level. Our bullish bias is supported by the ichimoku cloud indicator as price is trading above it.
Areas of consideration:
- H4 1st resistance at 1.38315
- H4 1st support 1.36915
USD/CHF:
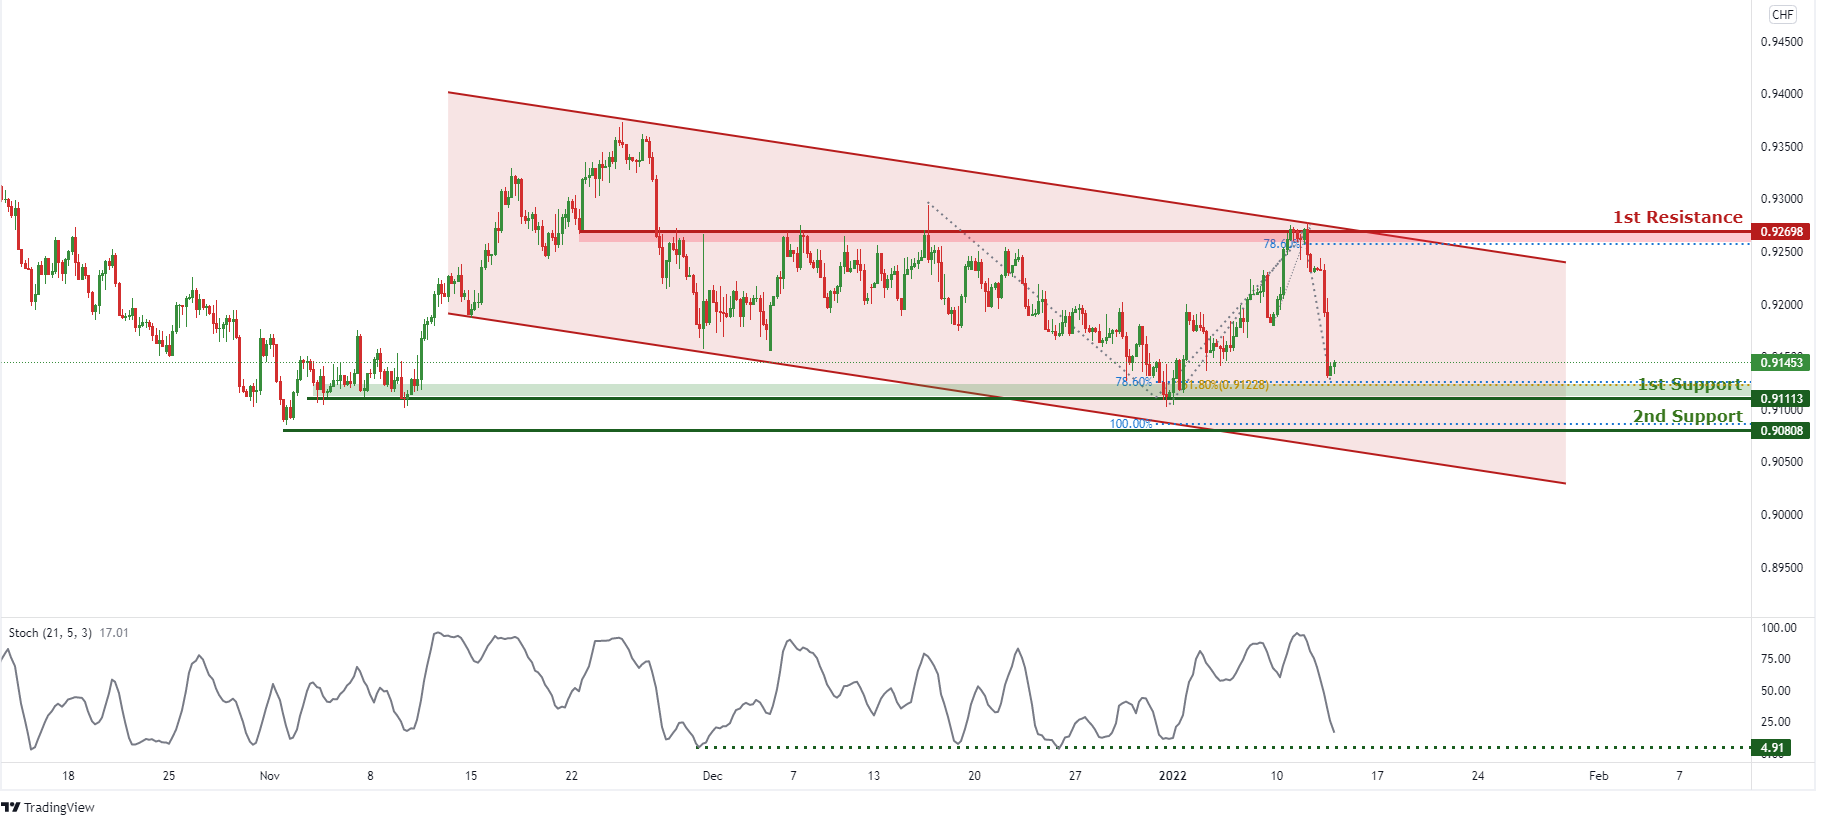
On the H4 timeframe, price is abiding to a descending channel, signifying a bearish momentum. Price is approaching a support level, we can expect price to make a short-term bullish bounce in line with 78.6% Fibonacci Projection and 161.8% Fibonacci retracement towards 1st Resistance in line with 78.6% Fibonacci projection. Our short-term bullish bias is further supported by the stochastic indicator where the %K line is approaching the support level.
Areas of consideration:
- Watch 1st Support at 0.91113
- Watch 1st Resistance at 0.92698
EUR/USD :
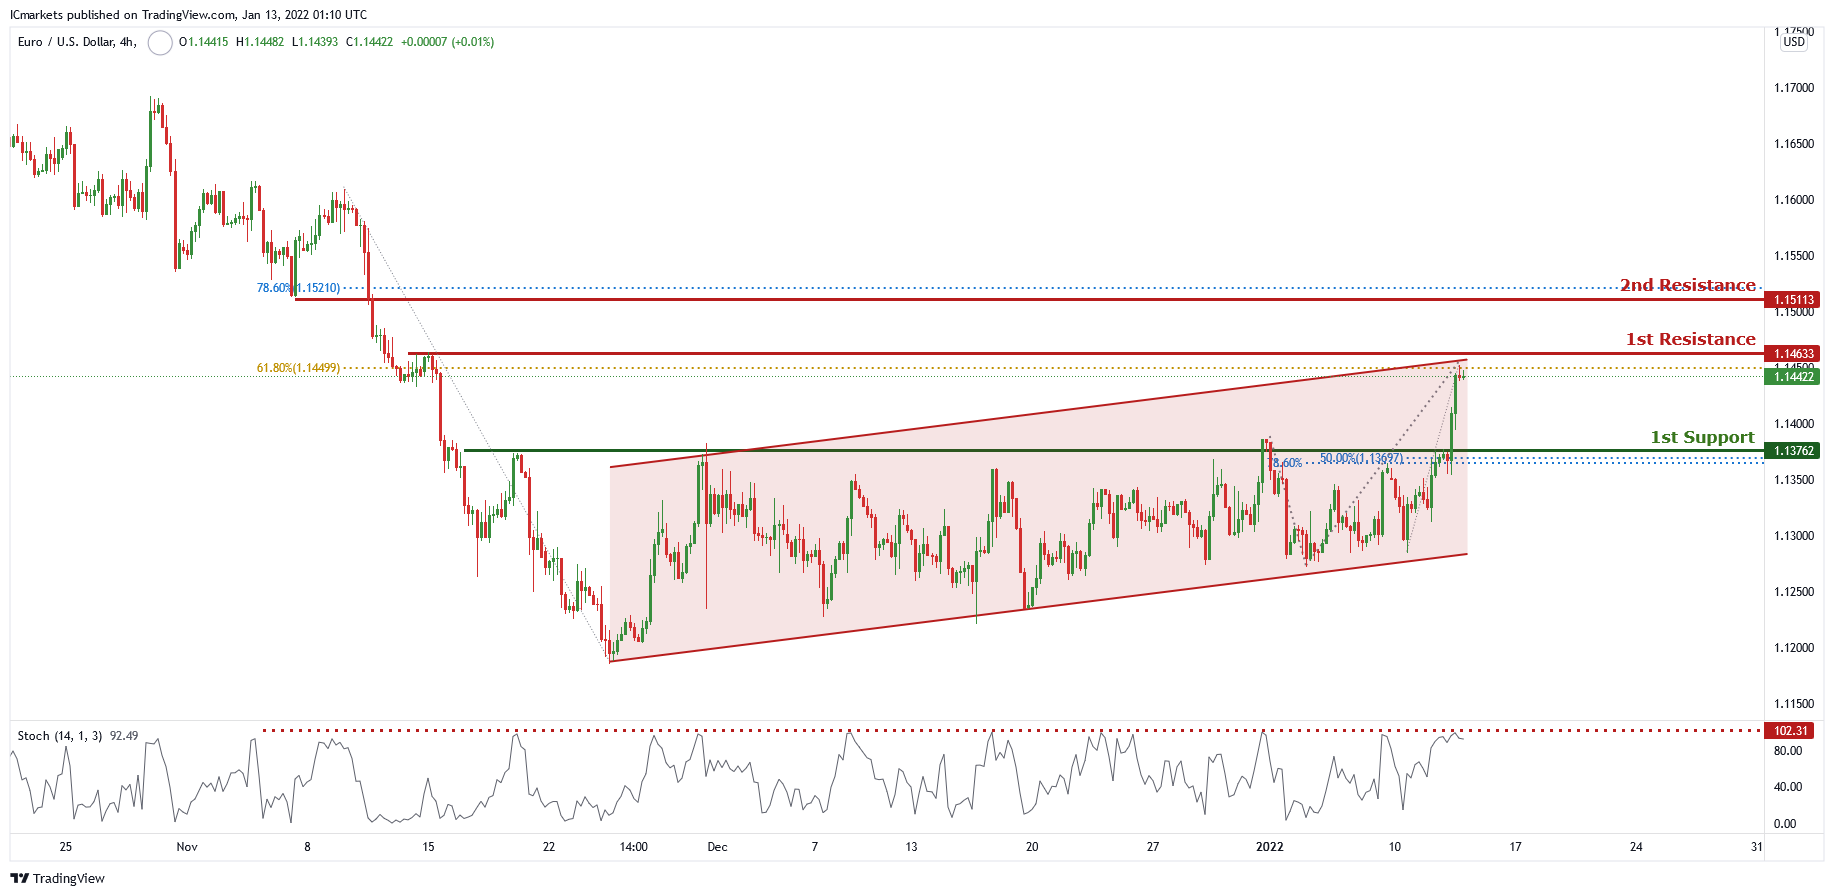
On the H4 chart price is trading in a descending channel and near 1st resistance level of 1.14633 which is also 61.8% Fibonacci retracement. Price can potentially dip to the 1st support level of 1.13762 which is also 50% Fibonacci retracement and 78.6% Fibonacci projection. Our bullish bias is supported by the stochastic indicator as it is near resistance level.
Areas of consideration:
- H4 1st support at 1.13762
- H4 1st resistance at 1.14633
USD/JPY:
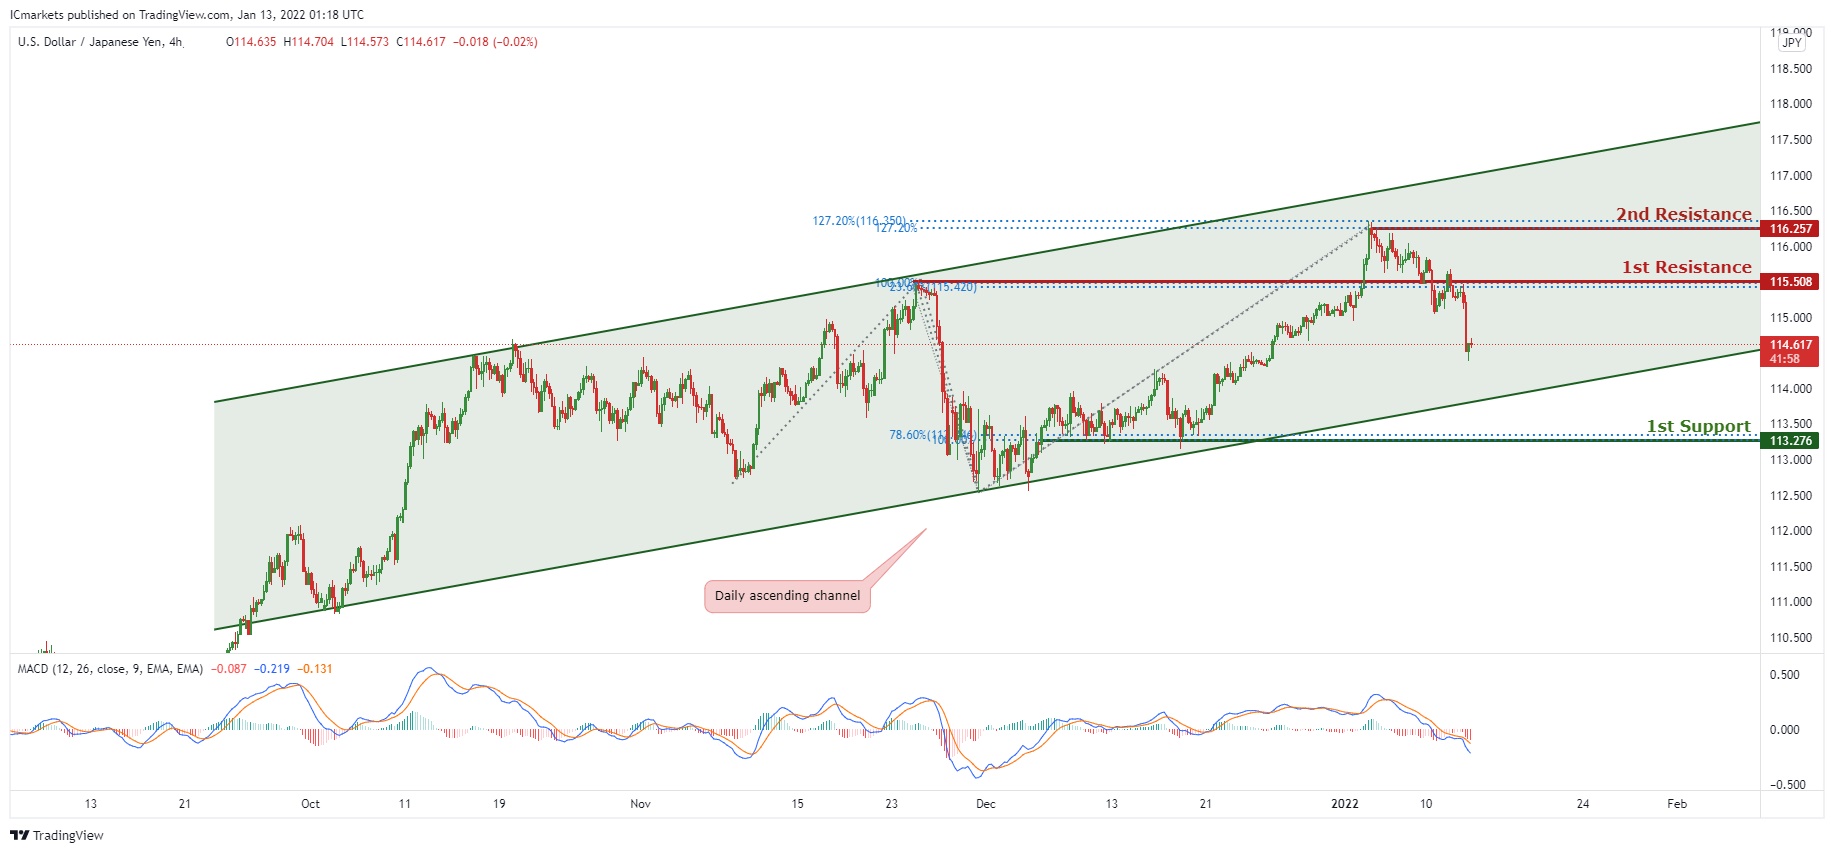
In reference to yesterday’s analysis, price is moving down nicely towards the 1st Support. On the H4 timeframe, is abiding to the ascending channel on the daily, signifying an overall bullish momentum. However, we can expect price to make a short-term bearish drop from 1st Resistance in line with 100% Fibonacci projection and 23.6% Fibonacci Retracement towards 1st Support in line with 78.6% Fibonacci retracement. Our short-term bearish bias is further supported by the MACD indicator where the signal line is above the MACD line. Traders are advised to wait for price to swing higher or lower before entering.
Areas of consideration:
- H4 1st resistance level 115.508
- H4 1st support level 113.276
AUD/USD:
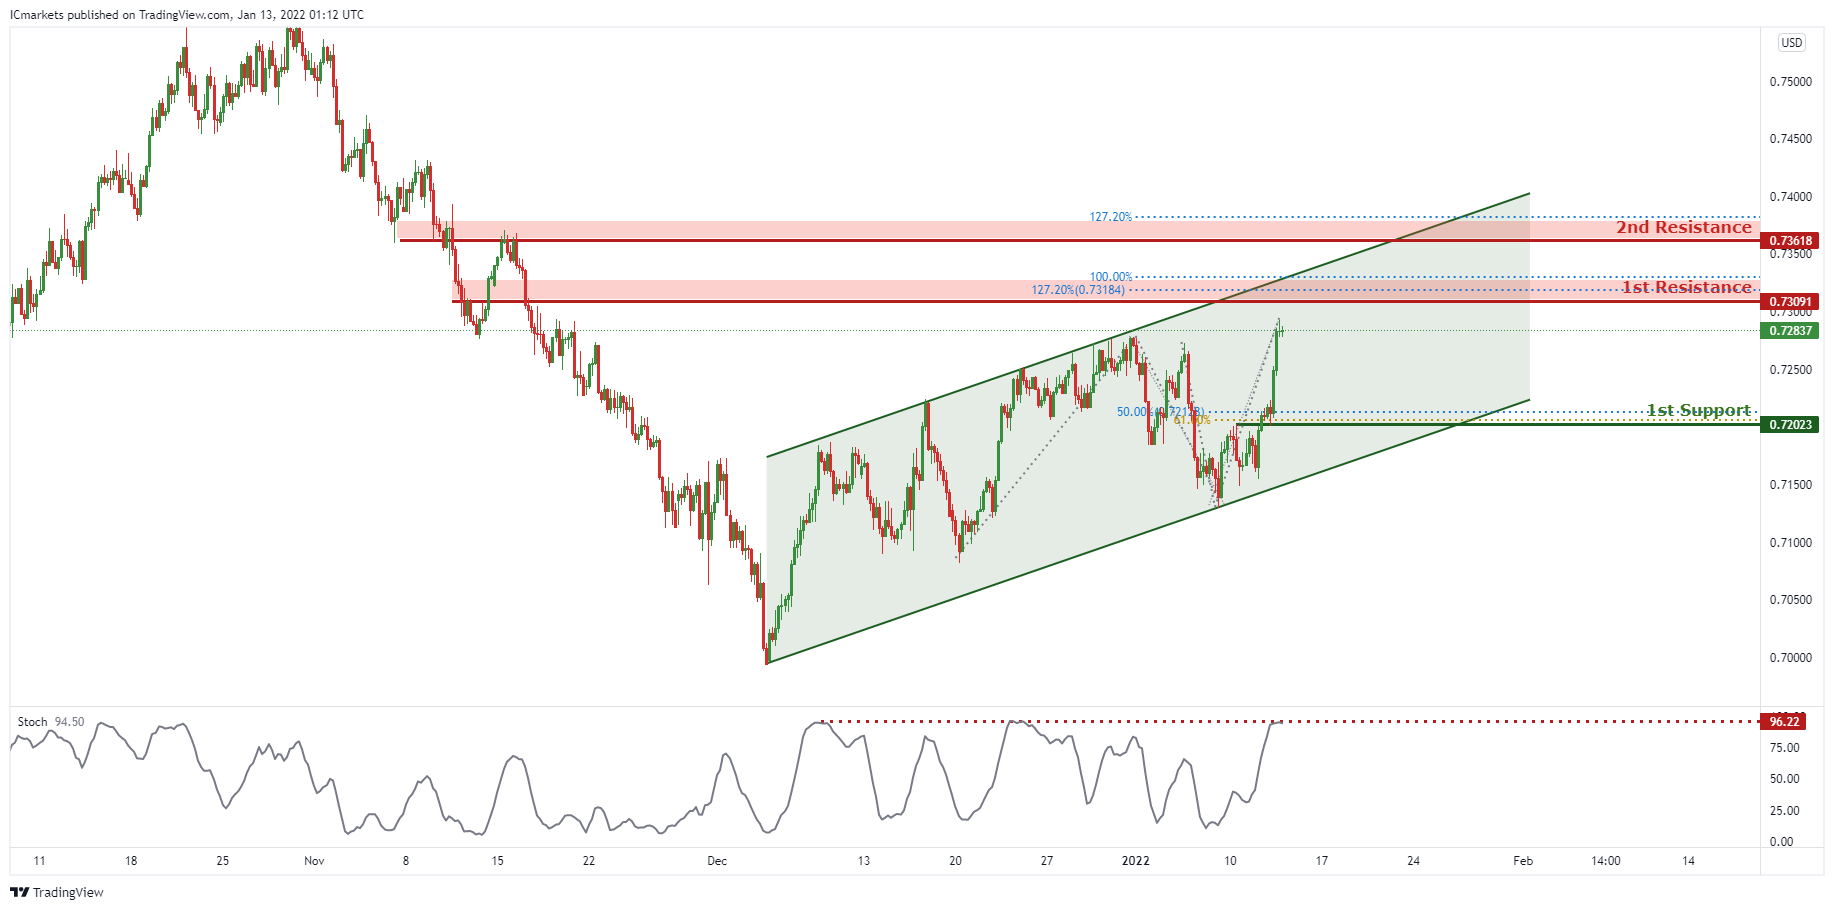
On the H4, price is reacting within the ascending channel, signifying an overall bullish momentum. Price is approaching the 1st Resistance, we can expect to see price make a short-term bearish drop from 1st Resistance in line with 127.2% Fibonacci extension and 100% Fibonacci projection towards 1st Support in line with 50% Fibonacci retracement and 61.8% Fibonacci projection. Our short-term bearish bias is further supported by the stochastic indicator where the %K line is at the resistance level.
Areas of consideration:
- H4 1st Support level 0.72023
- H4 1st resistance level 0.73091
NZD/USD:
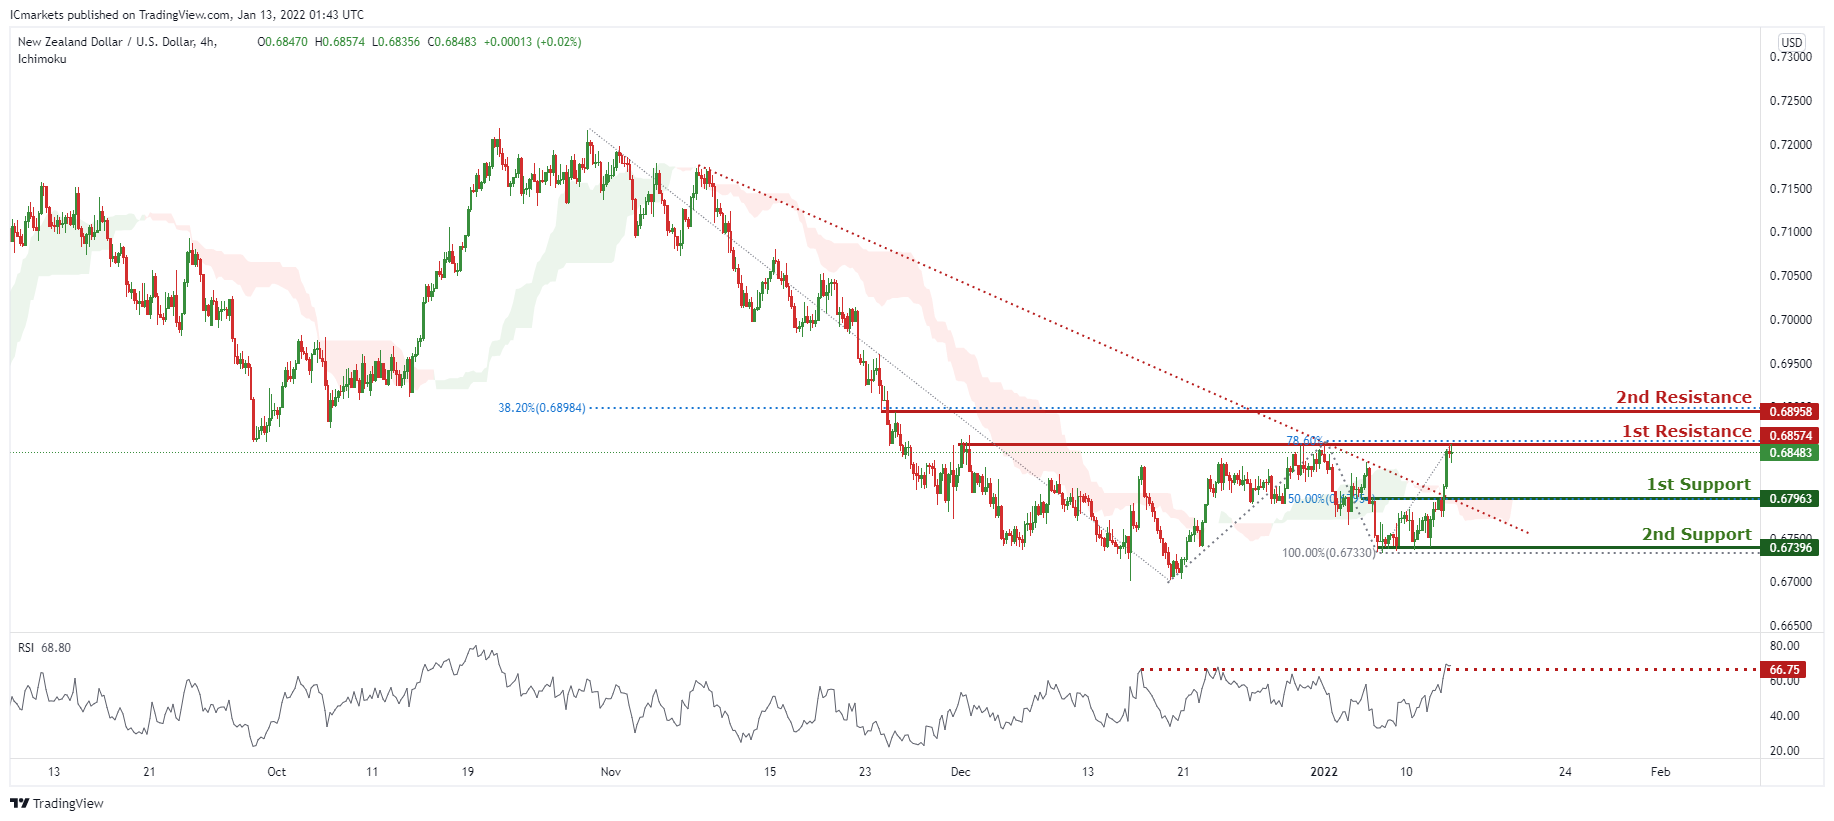
On the H4 timeframe, prices have broken out of our bearish trendline. We see potential for prices to dip further from our 1st resistance at 0.68574 in line with 78.6% Fibonacci retracement towards our 1st support at 0.67963 in line with 50% Fibonacci retracement. Our bias is further supported by ichimoku clouds forecasting the dip and RSI is at an all time high. If prices break our 1st support, prices can potentially dip towards our 2nd support at 0.67396 in line with 100% Fibonacci retracement.
Areas of consideration:
- H4 time frame, 1st resistance at 0.68574
- H4 time frame, 1st support at 0.67963
USD/CAD:
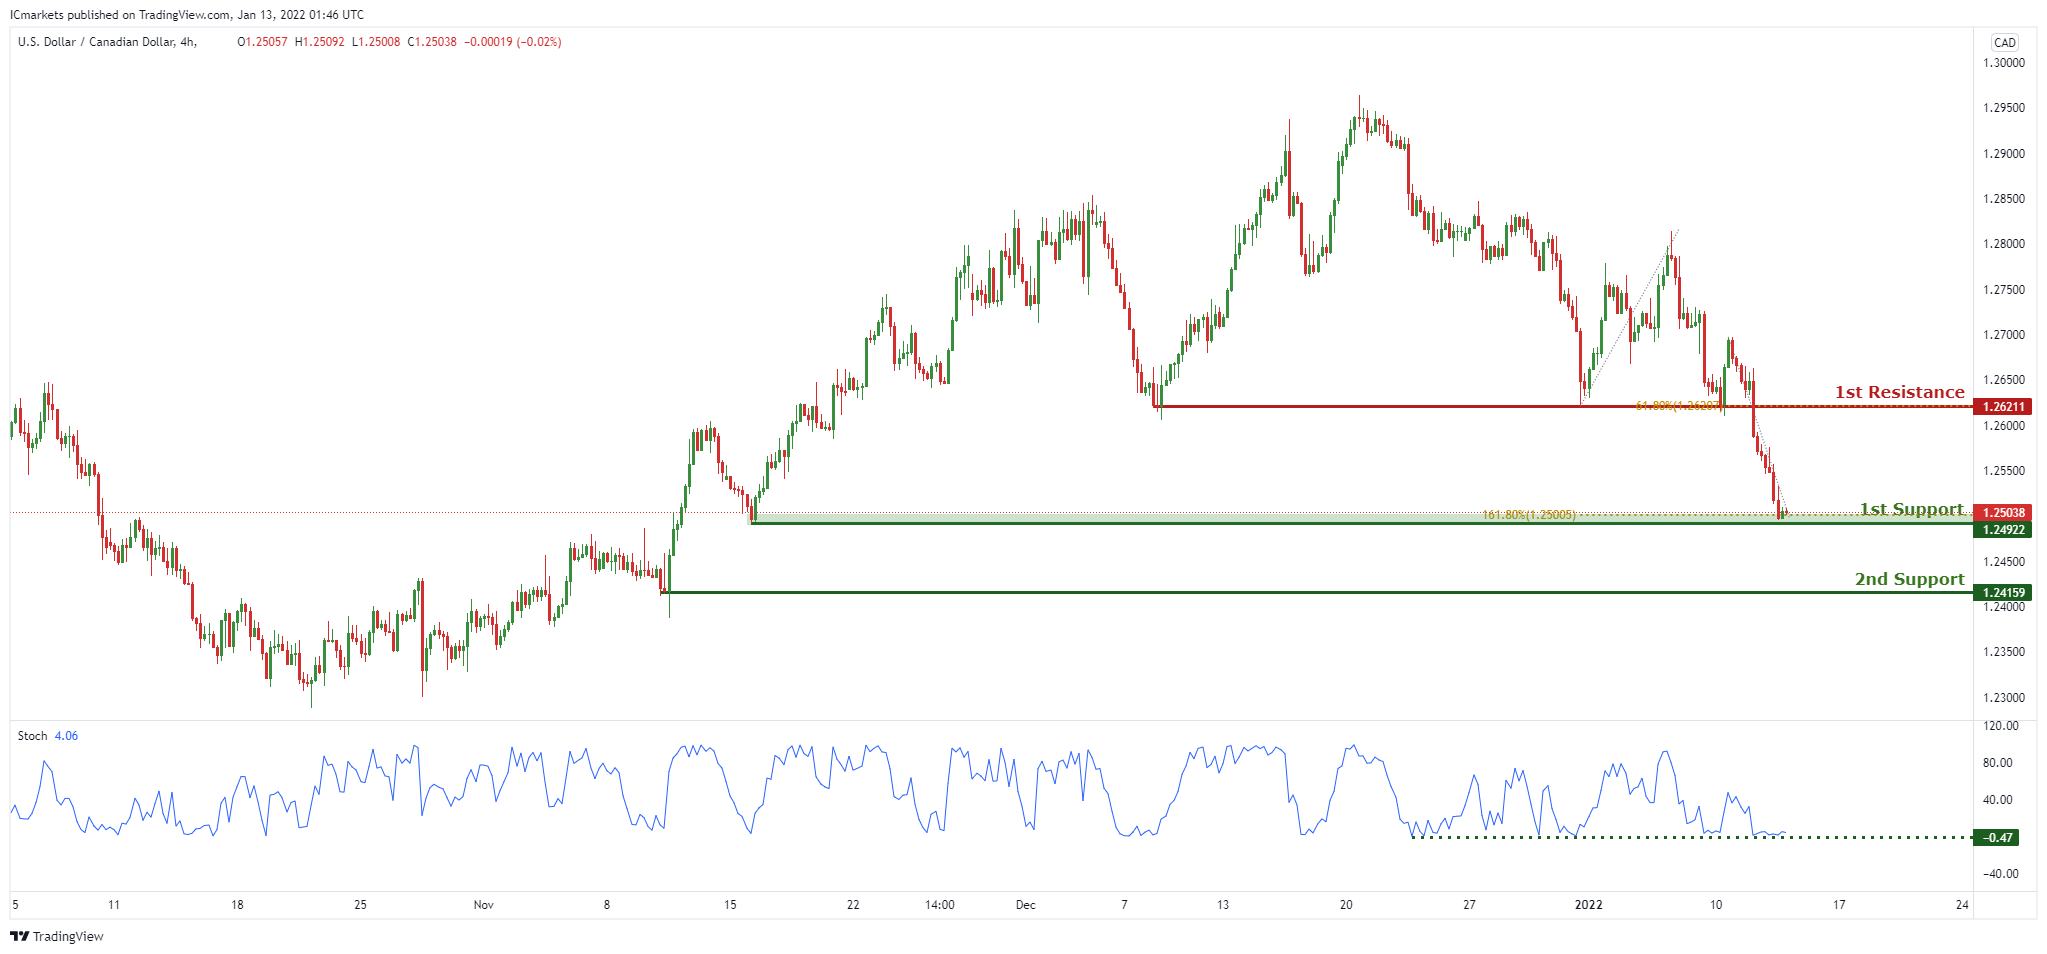
On the H4, with price at the support of the stochastics, we have a bullish bias that price will rise to our 1st resistance at 1.26211 which is in line with horizontal overlap resistance and 61.8% Fibonacci retracement from 1st support at 1.24922, which is in line with horizontal swing low support and 161.8% Fibonacci extension level. Alternatively, price may break 1st support structure and head for 2nd support at 1.24159, which coincides with horizontal swing low support.
Areas of consideration:
- H4 time frame, 1st support at 1.24922
- H4 time frame, 1st resistance at 1.26211
OIL:
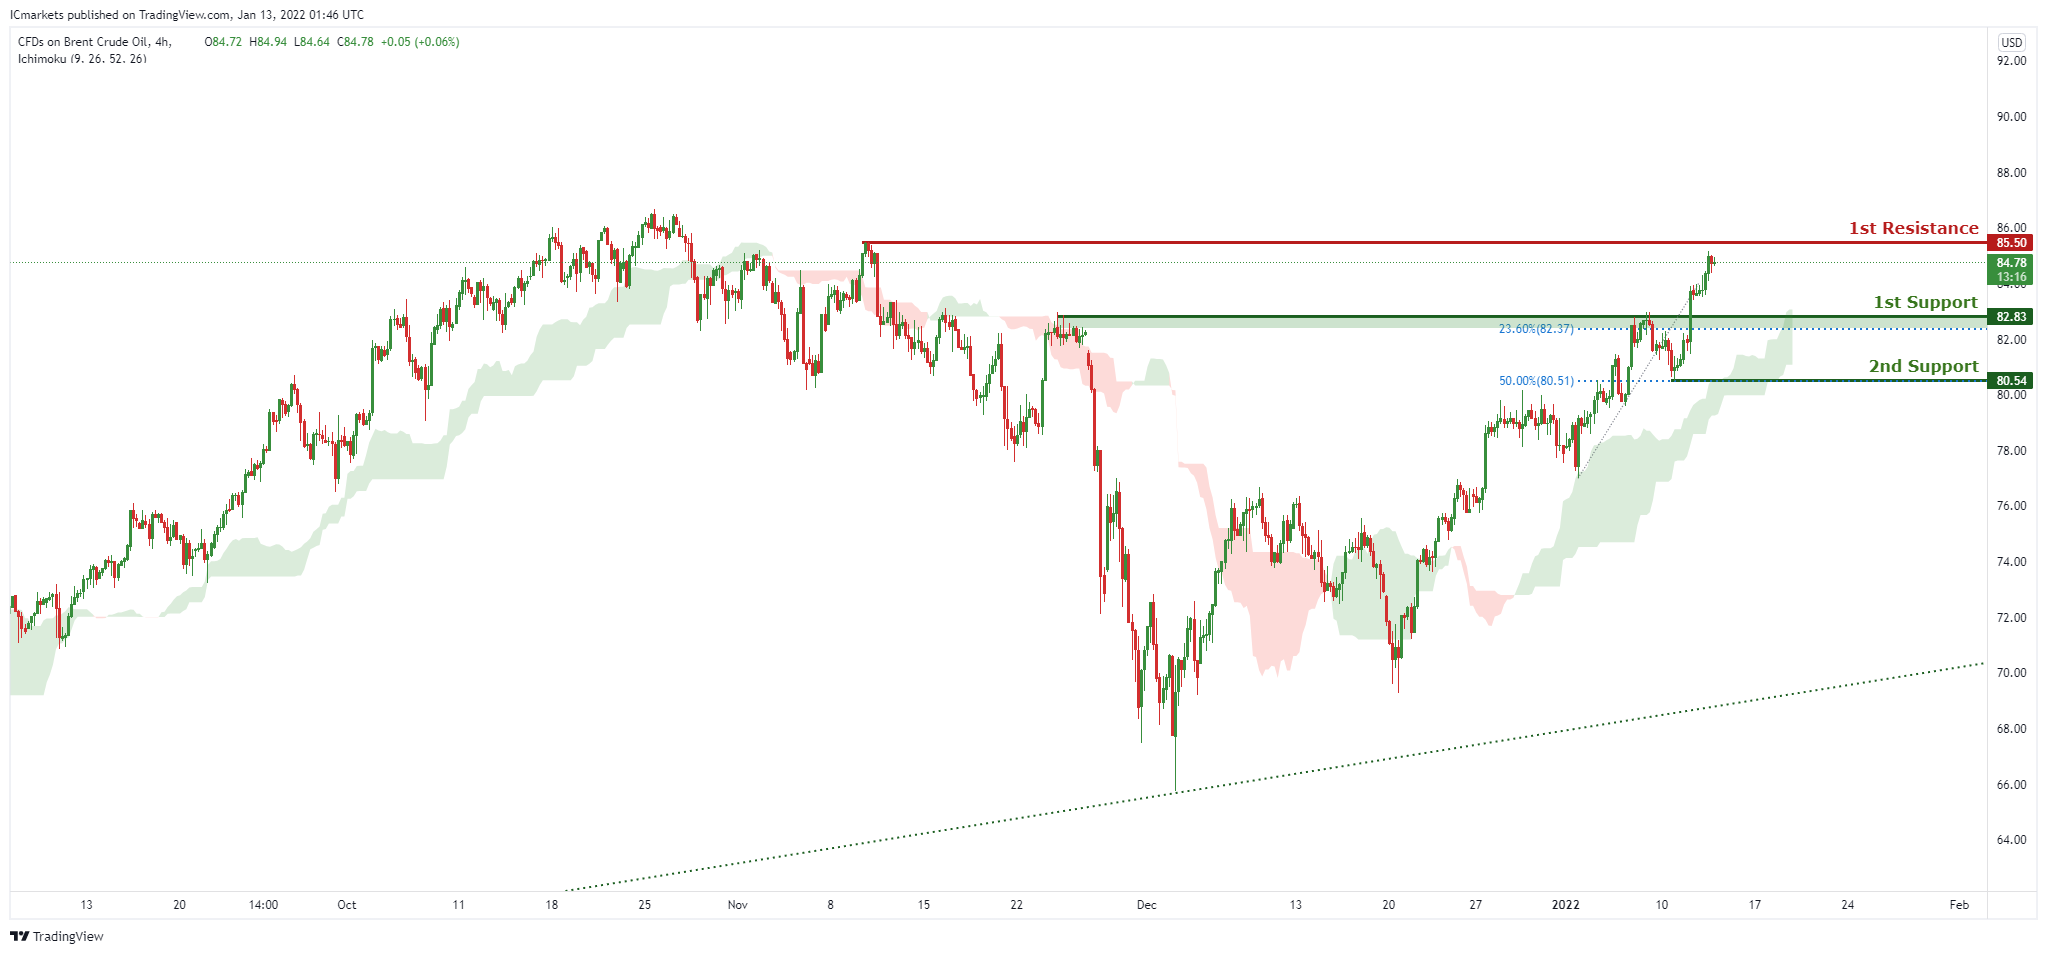
On the H4, with price moving above the ichimoku cloud, we have a bullish bias that price will rise to our 1st resistance at 85.5 which is in line with horizontal swing high resistance from 1st support at 82.83, which is in line with horizontal overlap support and 23.6% Fibonacci retracement level. Alternatively, price may break 1st support structure and head for 2nd support at 80.54, which coincides with horizontal swing low support and 50% Fibonacci retracement level .
Areas of consideration:
- H4 time frame, 1st resistance of 85.5
- H4 time frame, 1st support of 82.83
Dow Jones Industrial Average:
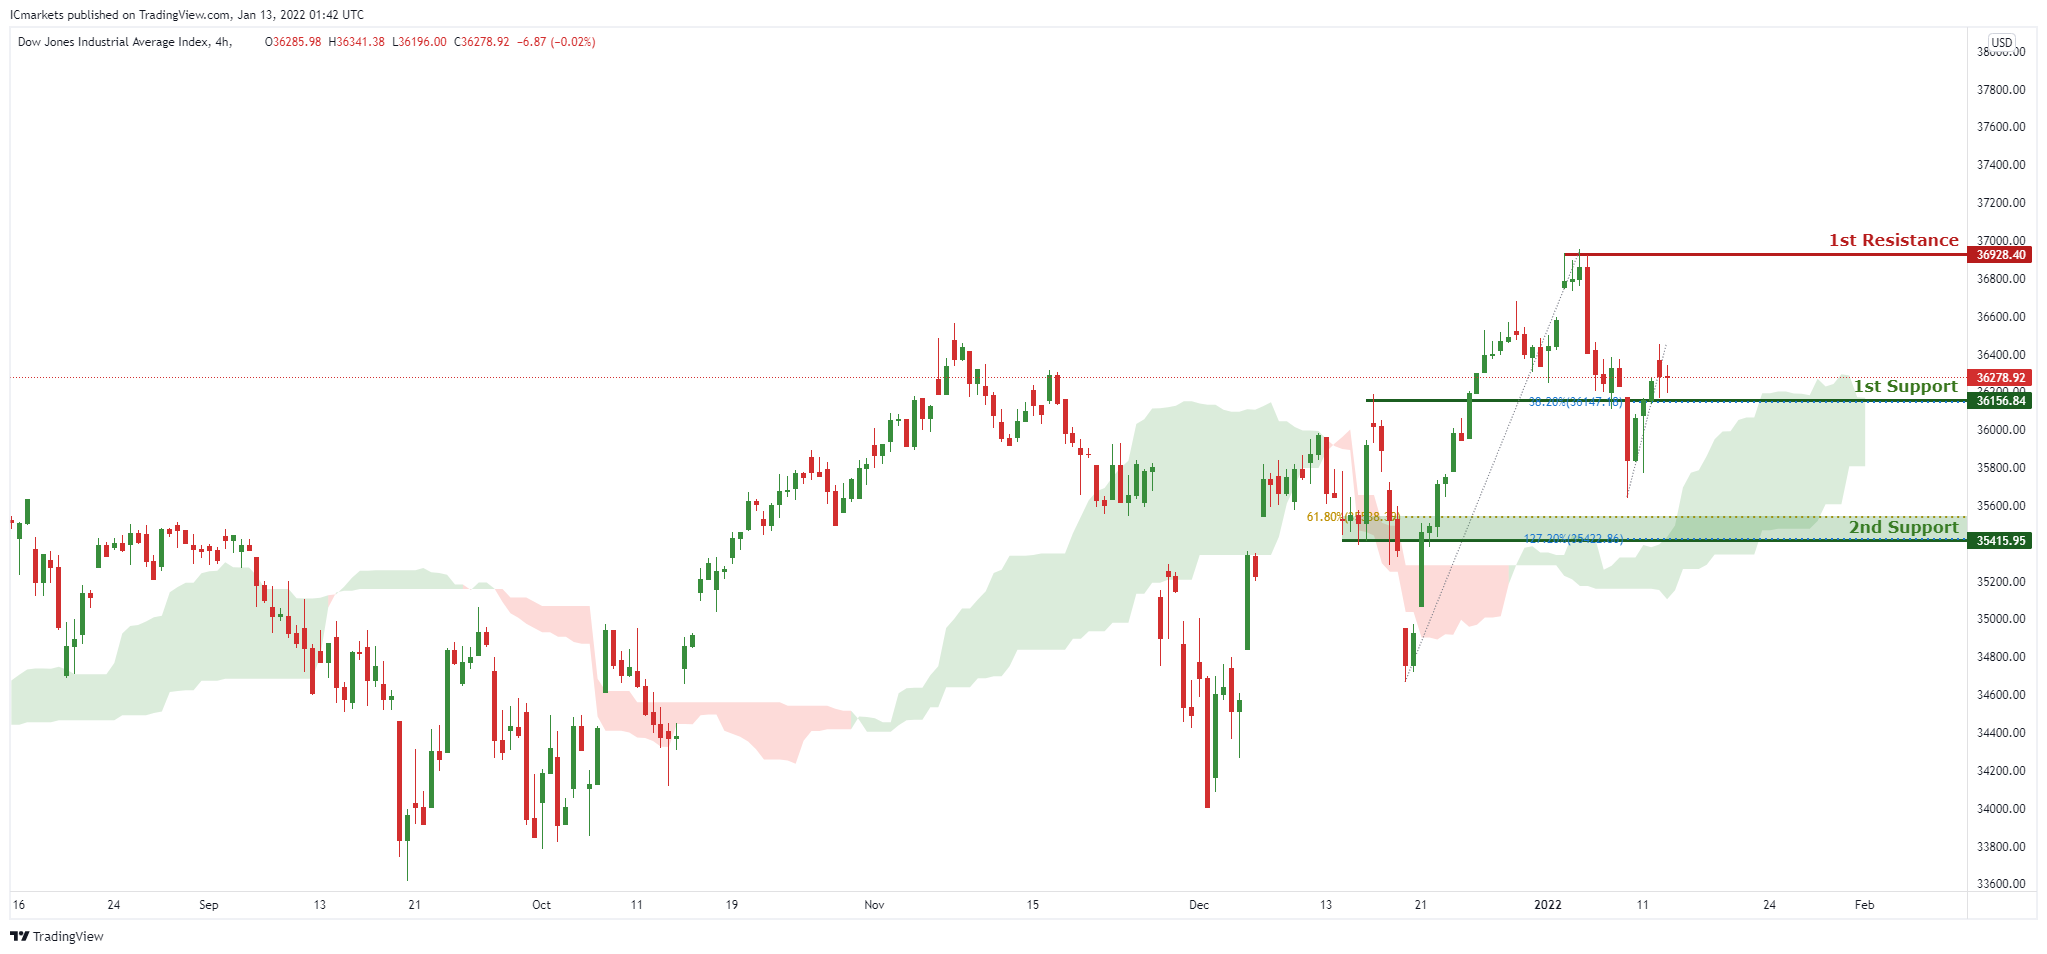
On the H4, with price moving above the ichimoku cloud, we have a bullish bias that price will rise to our 1st resistance at 36928 which is in line with horizontal swing high resistance from 1st support at 36156, which is in line with horizontal overlap support and 38.2% Fibonacci retracement level. Alternatively, price may break 1st support structure and head for 2nd support at 35415, which coincides with horizontal swing low support and 61.8% Fibonacci retracement level and 127.2% Fibonacci extension.
Areas of consideration:
- H4 time frame, 1st resistance of 36928
- H4 time frame, 1st support of 36156
Fed Daly: Time to start removing policy accommodation
San Francisco Fed President Mary Daly said inflation is "uncomfortably high" in the US. And, it's time to "start removing some of the accommodation we've been giving to the economy,"
"I definitely see rate increases coming, as early as March even," she noted. But she didn't want to predict the number of rate hikes needed for this year.
Fed Brainard: Policy focused on getting inflation back down to 2%
In the nomination hearing for Fed Vice Chair position, Lael Brainard said, "we are seeing the strongest rebound in growth and decline in unemployment of any recovery in the past five decades."
"But inflation is too high, and working people around the country are concerned about how far their paychecks will go," she added. "Our monetary policy is focused on getting inflation back down to 2% while sustaining a recovery that includes everyone. This is our most important task."
Fed Bullard: March hike is a definite possibility
St. Louis Fed President James Bullard said Fed "could begin increasing the policy rate as early as the March meeting in order to be in a better position to control inflation." He added, " it makes sense to get going sooner rather than later and so I think March would be a definite possibility."
"We need to risk manage here. We need to be prepared for the case where inflation does not moderate as much as hoped and instead the Fed has to come in and move inflation closer to the 2% target. How much the Fed has to do and how much natural moderation there will be is very much an open question," he said.
Separately, Bullard also told WSJ, "I actually now think we should maybe go to four hikes in 2022."
NZD/USD Breaks Key Resistance, Dollar Under Pressure
Key Highlights
- NZD/USD started a fresh increase from the 0.6735 support zone.
- It broke a major bearish trend line with resistance near 0.6790 on the 4-hours chart.
- EUR/USD cleared the 1.1380 resistance, and GBP/USD extended gains above 1.3620.
- The US CPI increased 7% in Dec 2021 (YoY), like the market forecast.
NZD/USD Technical Analysis
This past week, the New Zealand Dollar formed a base above 0.6730 against the US Dollar. NZD/USD started a fresh increase above the 0.6750 and 0.6770 resistance levels.
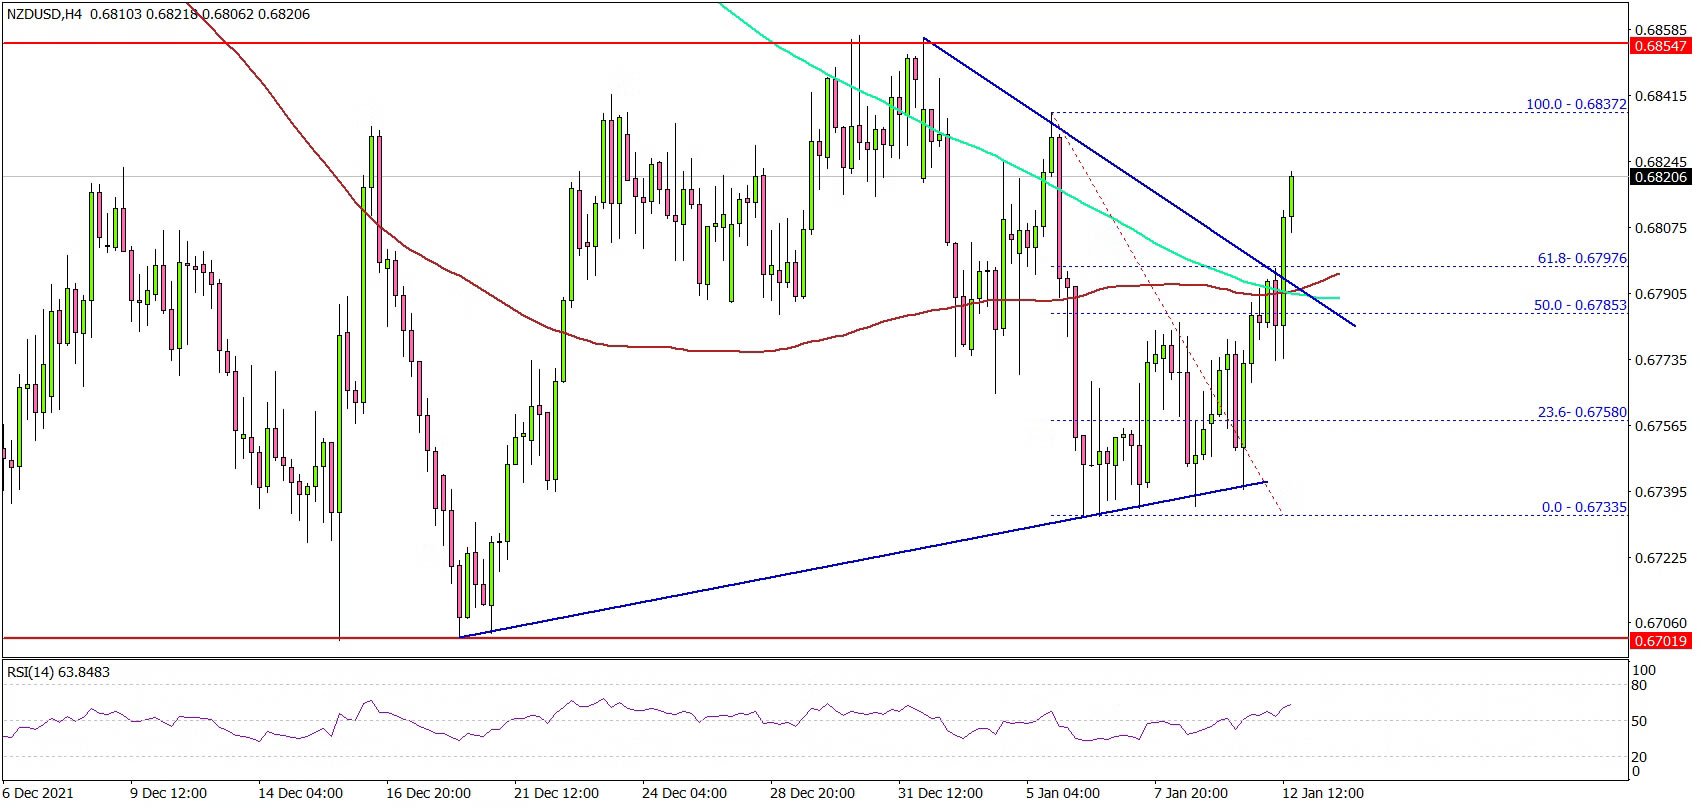
Looking at the 4-hours chart, the pair gained pace above the 0.6800 resistance, the 100 simple moving average (red, 4-hours) and the 200 simple moving average (green, 4-hours).
Besides, there was a break above a major bearish trend line with resistance near 0.6790 on the same chart. The pair even climbed above the 61.8% Fib retracement level of the downward move from the 0.6837 swing high to 0.6733 low.
On the upside, the pair is facing resistance near 0.6840 level. The next major resistance is near the 0.6860 level, above which the pair could test 0.6900.
On the downside, there is a decent support forming near 0.6790. The main support is forming near the 0.6740 level, below which the pair could drop to 0.6700.
Looking at EUR/USD, the pair was able to clear the 1.1380 resistance zone. Besides, GBP/USD rallied above the 1.3600 and 1.3650 resistance levels.
Economic Releases
- US Initial Jobless Claims - Forecast 200K, versus 207K previous.
- US Producer Price Index for Dec 2021 (MoM) – Forecast +0.4%, versus +0.8% previous.
- US Producer Price Index for Dec 2021 (YoY) – Forecast +9.8%, versus +9.6% previous.
USDCHF Wave Analysis
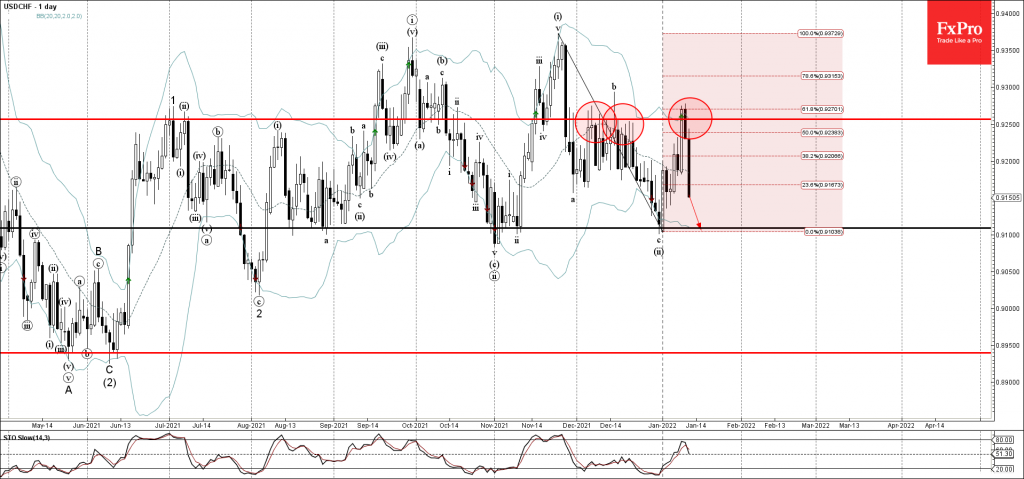
- USDCHF reversed resistance level 0.9250
- Likely to fall to support level 0.9110
USDCHF recently reversed down from the pivotal resistance level 0.9250 (which has been reversing the price from the end of November), intersecting with the upper daily Bollinger Band and the 61.8% Fibonacci correction of the downward wave (ii) from November.
The downward reversal from the resistance level 0.9250 created the daily reversal pattern Dark Cloud Cover.
Given the strength of the resistance level 0.9250 – USDCHF currency pair can be expected to fall further toward the next support level 0.9110 (which has been reversing the pair from August).
Eco Data 1/13/22
[php_everywhere instance="1"]
US oil inventories dropped -4.6m barrels, WTI extending rally
US commercial crude oil inventories dropped -4.6m barrels in the week ending January 7. At 413.3m barrels, crude oil inventories are about -8% below the five year average for this time of year.
Gasoline inventories rose 8m barrels. Distillate rose 2.5m barrels. Propane/propylene dropped -3.4m barrels. Total commercial petroleum inventories dropped -4.5m barrels.
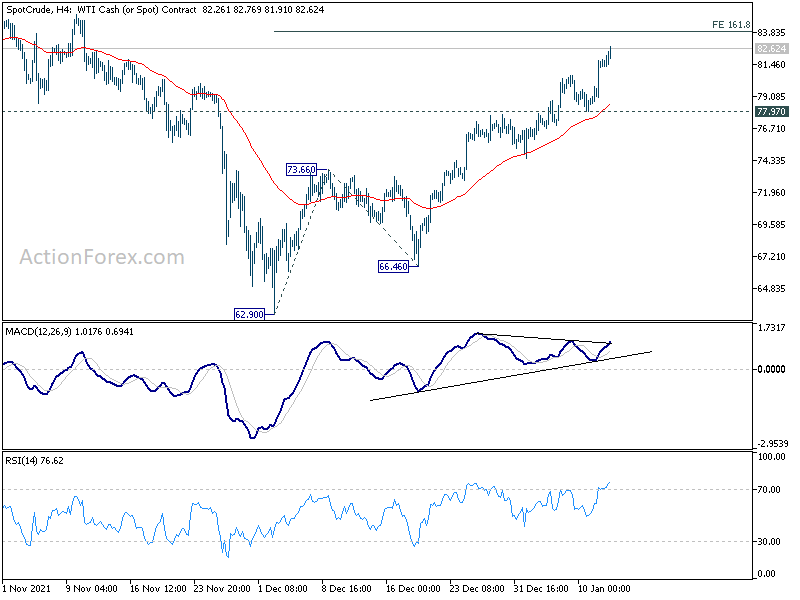
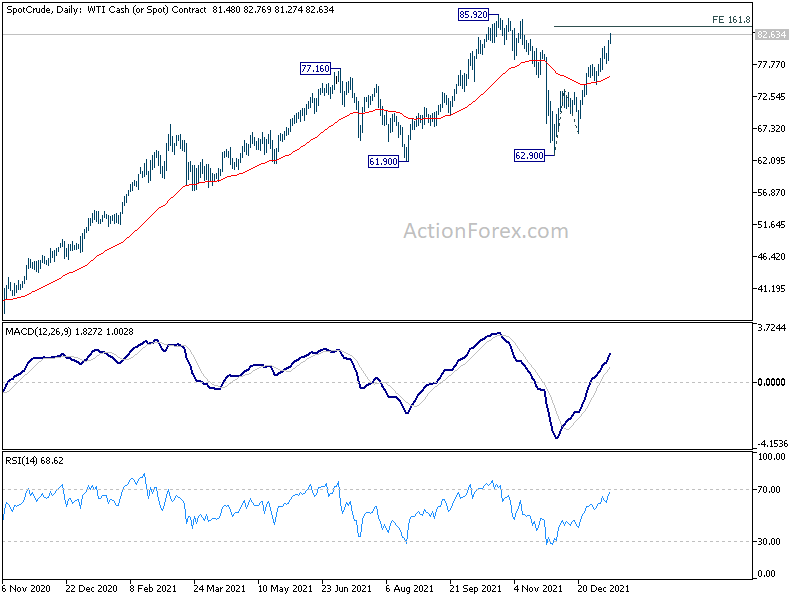
WTI crude oil's rally continues in early part of US session and hits as high as 82.76 so far. Further rise is expected to 161.8% projection of 62.90 to 73.66 from 66.46 at 83.86 and possibly further to 85.92 high.
We'd maintain the view that rise form 62.90 the second leg of the consolidation pattern from 85.92 only. Hence, we're not expecting a firm break of 85.92 yet. Instead, another fall should be seen before the consolidation completes. Break of 77.97 support will indicate rejection by 85.92 and target 73.66 resistance turned support first. However, firm break of 85.92 could pave the way to 90 handle.
Rate Hike Bets Fire Up Pound Again, UK Data May be Shrugged Off
GDP, industrial production and trade figures will be the first major set of data releases out of the UK in 2022 on Friday (07:00 GMT). However, as the data was collected before the Omicron variant started spreading like wildfire and as no new restrictions are currently on the horizon, markets will be more focused on the Bank of England’s next course of action. Rate hike expectations are building up again and the renewed speculation has put the wind in the pound’s sails.
Omicron: keep calm and carry on
Although it’s too soon to reach a definitive conclusion about the economic impact of Omicron, it is looking increasingly likely that this latest wave gripping Britain and many other parts of the world can be ridden without shutting down large swathes of the economy. Yes, hospitalizations are rising, but they remain below the peaks seen in previous waves. This can only be a good thing for the economic recovery that has been dealt several setbacks during the course of the pandemic and must come as a relief to policymakers.
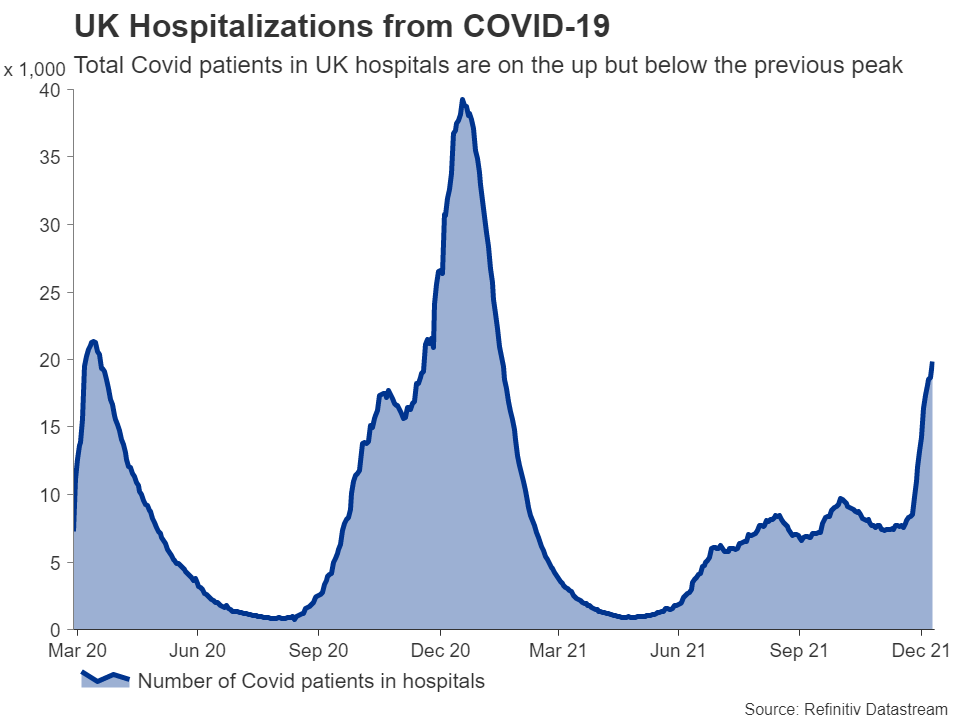
The recent flare up in price pressures has central banks most worried about inflation in decades. The Bank of England has already hiked interest rates once to keep a lid on surging inflation in the UK and could do so again at its next meeting in February. If Omicron had turned out to be more dangerous, policymakers would probably have proceeded much more cautiously with further tightening.
Supply disruptions not going away
But after Prime Minister Boris Johnson ruled out additional measures for England in the New Year, there is nothing stopping the BoE from raising the Bank Rate again in February by 25 basis points. If anything, Omicron has only heightened concerns that the pandemic-related supply constraints will likely persist well into 2022, forcing central banks to get even tougher on inflation.
Unless the economic conditions in the UK take a dire turn for the worse, market participants will continue to price in a strong probability of four rate hikes by year end. Friday’s data is unlikely to alter this outlook.
Pre-Omicron boost for UK growth
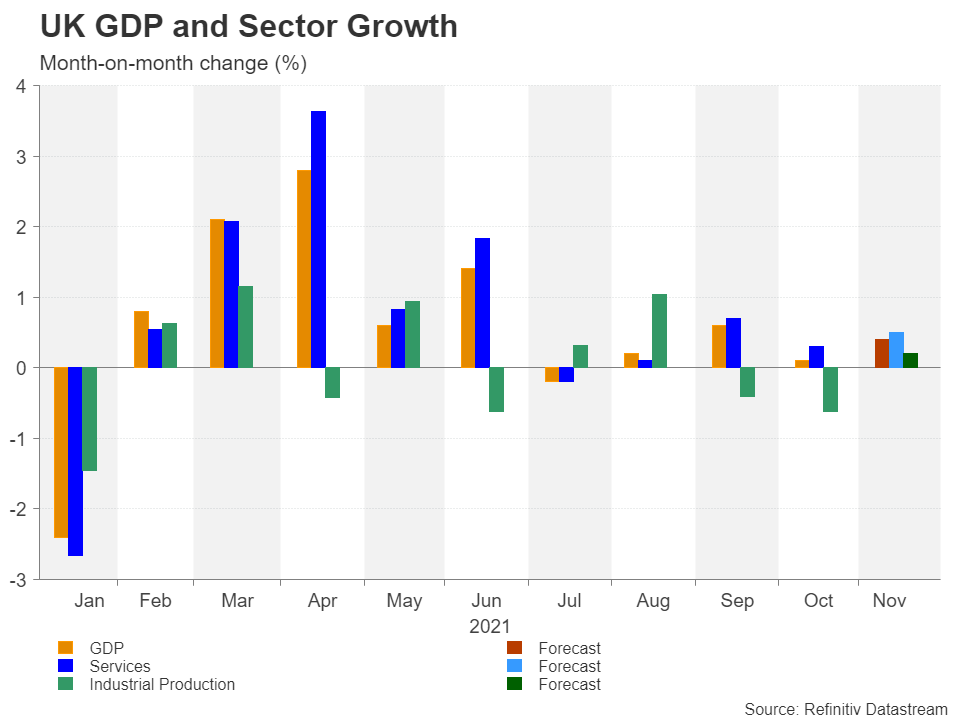
GDP growth is forecast to have accelerated to 0.4% month-on-month in November, after unexpectedly slowing to just 0.1% in October. This would push up the 12-month growth rate to 7.5% from 4.6% before. The expansion is expected to have been driven by the services sector, which is predicted to have risen by 0.5% m/m, as manufacturing and overall industrial production are both projected to have grown by a more meagre 0.2% in November.
Other data on Friday will include Britain’s trade balance in goods, which is expected to have widened slightly in November, although the figures rarely impact the pound these days. With the 10-year yield on UK gilts surging to 1.20% this week – the highest since late October, which itself was a post-pandemic high – sterling has been on a roll over the past month. The pound’s trade weighted index just reached the highest since the Brexit referendum in June 2016. Its gains versus the euro have been particularly notable, climbing to the highest in nearly two years.
How much further can the pound rally versus the euro?
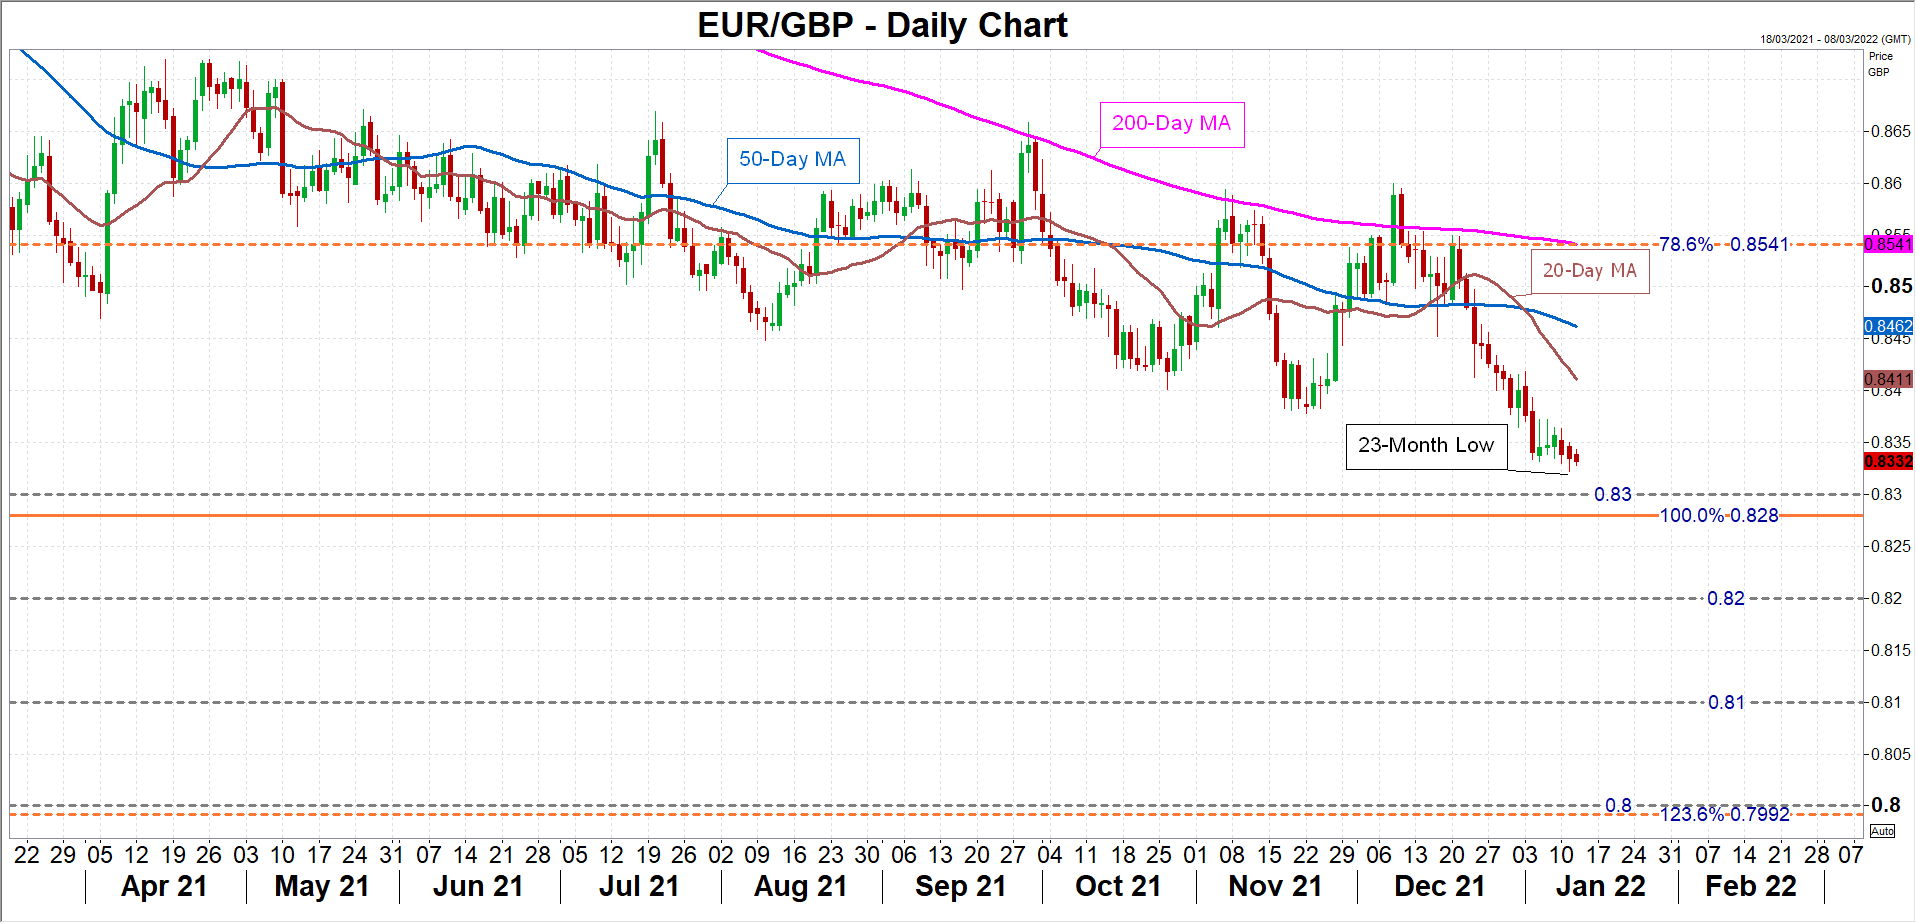
Euro/pound has breached all of its moving averages and is headed for the 0.83 mark. If this handle is broken too, only the 0.82 and 0.81 psychological levels stand in the way of the declines stretching towards the 123.6% Fibonacci extension of the February-March 2020 rally, which lies at 0.7992. On the upside, the 20-day moving average at 0.8420 is the nearest key resistance for the pair.
Whilst the Bank of England is looking more and more likely to lift borrowing costs in February and this should keep sterling well supported in the near term, there could be some slight downside pressure for the currency from renewed Brexit woes as London and Brussels are still locked in talks to try and resolve the impasse over the contentious Northern Ireland protocol. In addition, Johnson has been facing scandal after scandal in recent weeks and some political turbulence in the upcoming weeks shouldn’t be ruled out.
GBPJPY Struggles to Secure Advances Beyond Multi-Year High
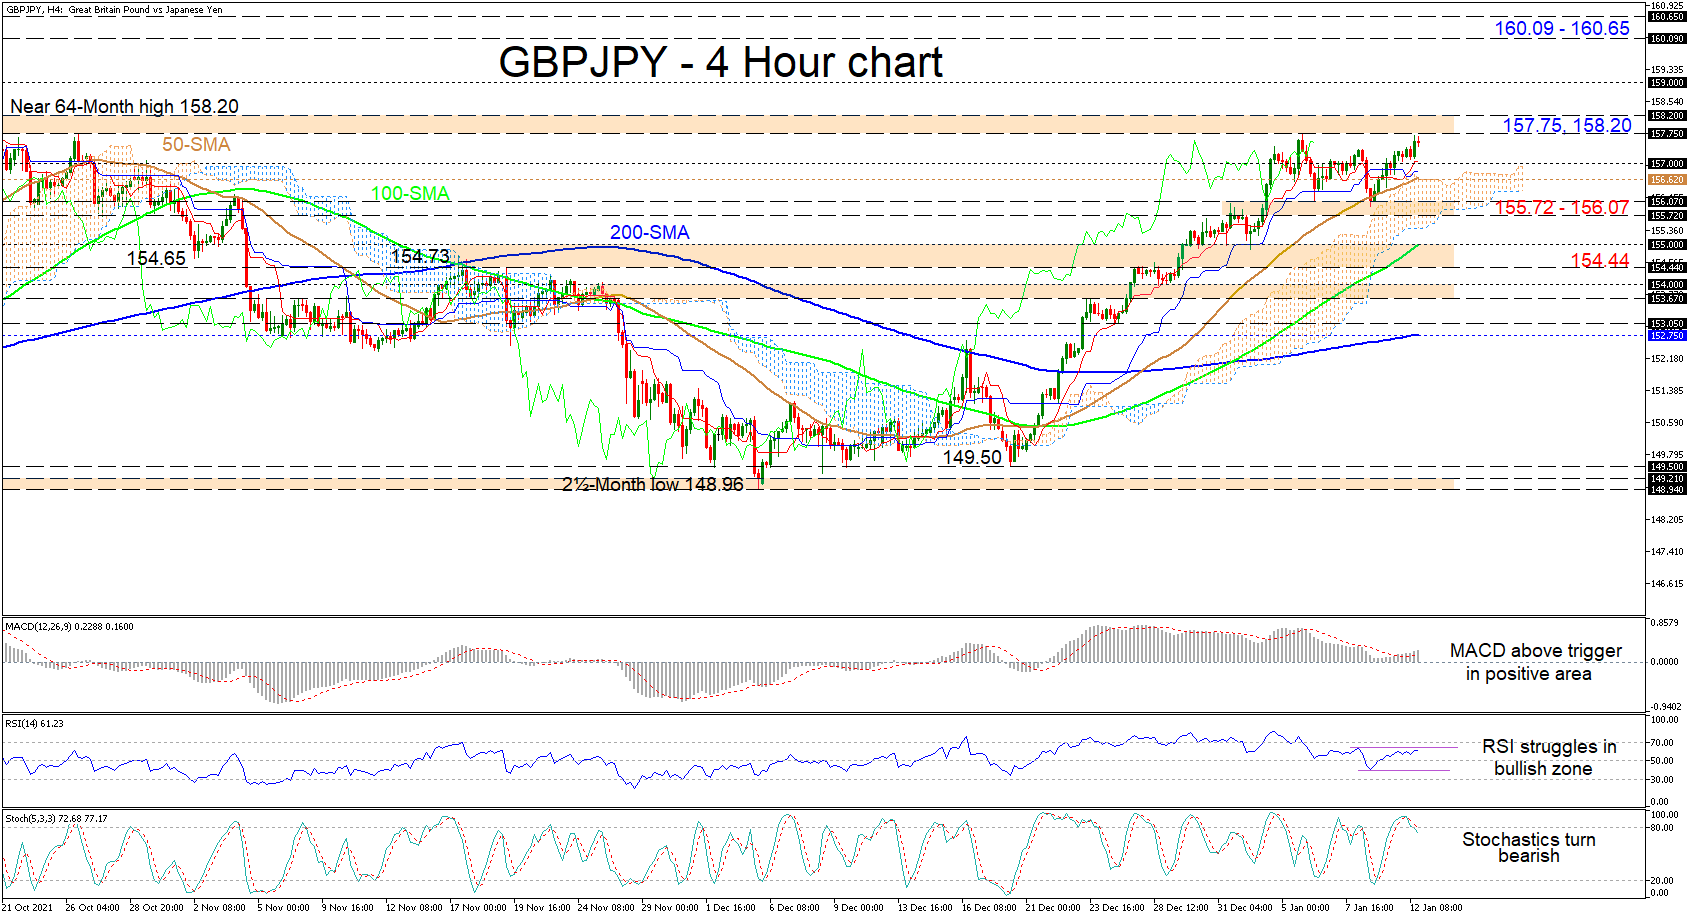
GBPJPY is lacking bullish impetus to conquer the immediate resistance barricade shaped by the 157.75 barrier and the more than five-year high of 158.20. That said, the simple moving averages (SMAs) are defending the three-week uptrend from the 149.50 trough.
Moreover, the Ichimoku lines are reflecting a pause in bullish forces, while the short-term oscillators have yet to fully line up with the pair’s mood to push higher. The MACD, in the positive zone, is strengthening above its red trigger line, while the RSI is struggling to improve in the bullish territory. On the other hand, the stochastic oscillator has adopted a bearish demeanour supporting a price pullback in the pair.
If the 157.75-158.20 resistance border caps advances, sellers could encounter prompt support in an area between the 157.00 handle and the 50-period SMA at 156.62. Retreating deeper into the Ichimoku cloud, the bears may then meet the key 155.72-156.07 support boundary. From here, should this border fail to dismiss further loss of ground from unfolding, sellers could target the support section from the 155.00 level until the 154.44 barrier.
In a positive scenario, if buyers pilot north of the 157.75-158.20 resistance obstacle, the price may aim for the 159.00 psychological number. Should buying interest intensify further, the pair could then pursue the 160.09-160.65 resistance belt, which was formed from the end of May until the end of June 2016, the former level being a high from where the pair started a collapse of around 27 basis points back in 2016.
Summarizing, GBPJPY is exhibiting a bullish bias above the SMAs and the 155.72-156.07 support zone. Yet, it remains a difficult undertaking to surpass the more than five-year high of 158.20, not to mention the upcoming 160.09 key resistance.