Sample Category Title
Gold Analysis: Gains Faster than Expected
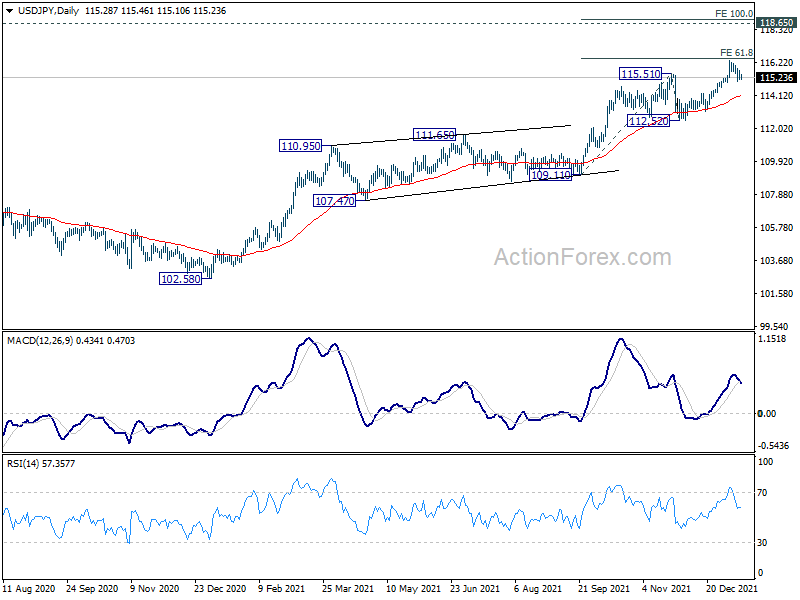
The price for gold surged faster than expected, as the bullion broke through the upper trend line of the channel up pattern and reached the 1,823.50 level on Tuesday. Afterward, a consolidation down to the 1,815.00 level occurred. The 1,815.00 acted as support and started a surge.
On Wednesday, at 13:30 GMT, the US Consumer Price Index and Core Consumer Price index data was released. The USD reacted by declining. On the bullion charts the move was observed as a test of the resistance of the 1,825.00 mark. By large, it can be observed that the price respects round price levels.
If the price for gold continue to surge, the bullion would most likely encounter resistance in 1,825.00. The surge could eventually end at the summer high-level zone that starts at 1,830.00. On the other hand, a decline would need to pass the 1,815.00 mark, before reaching the 50 and 200-hour simple moving averages at 1,810.00.
USD/JPY Analysis: Bounces off Trend Line
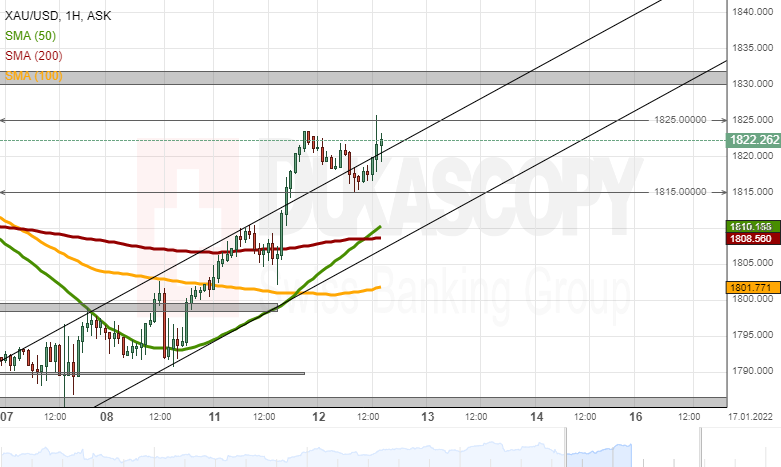
As the USD/JPY currency exchange rate was testing the resistance of the descending January high levels near 115.50, the US Consumer Price Index data was published. Namely, on Wednesday, at 13:30 GMT, the US Consumer Price Index and Core Consumer Price index data was released. The USD reacted by declining.
A decline of the USD/JPY currency exchange rate could eventually reach and test the support zone that surrounds the 115.00 mark at 114.96/115.04. Below the zone, note the weekly S1 simple pivot point at 114.92.
However, a potential recovery of the US Dollar against the Japanese Yen could face resistance in the 50-hour simple moving average near 115.30, before the pair aims at the combined resistance of the January high-level resistance line and the 100 and 200-hour simple moving averages near 115.50. Higher above, note the weekly simple pivot point at 115.64.
GBP/USD Analysis: Reaches 1.3680 Level
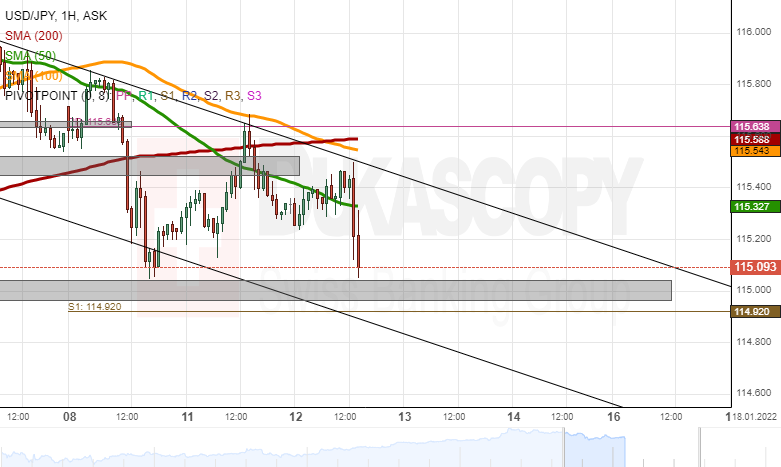
On Wednesday, at 13:30 GMT, the US Consumer Price Index and Core Consumer Price index data was released. The USD reacted by declining. The GBP/USD currency exchange rate reacted by sharply moving to the 1.3680 mark, which at 14:00 GMT appeared to have stopped the jump.
In the case that the GBP passes the 1.3680 level against the US Dollar, the currency exchange rate could look for resistance in the 1.3700 mark. Afterward, the weekly R2 simple pivot point at 1.3709 might act as resistance. Above the R2, there is no technical resistance as high as the 1.3820 level, where the R3 simple pivot point is located.
Meanwhile, a potential decline would most likely look for support in the weekly R1 simple pivot point at 1.3652 and the 1.3650 mark, before aiming at the 50 and 100-hour simple moving averages and the 1.3600 level.
EUR/USD Analysis: Jumps Due to US CPI
On Wednesday, at 13:30 GMT, the US Consumer Price Index and Core Consumer Price index data was released. The USD reacted by declining. The data beat the forecasts, as the US CPI came in at 0.5% instead of the forecast 0.4%. Meanwhile, the US Core CPI was revealed to be 0.6%, compared to the expected 0.5%.
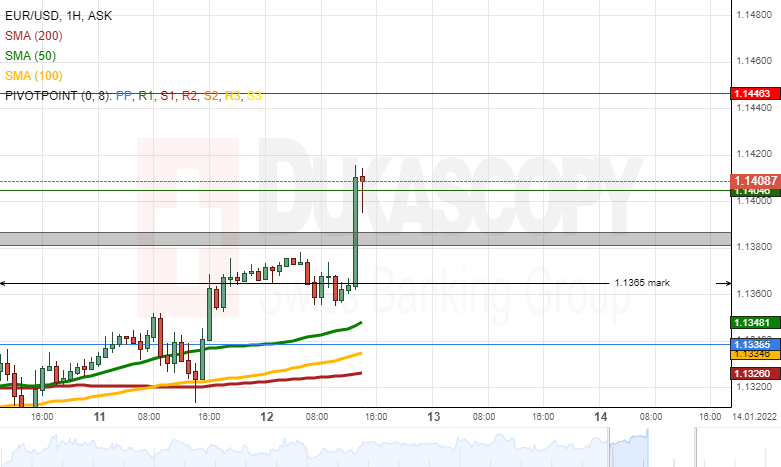
The event pushed the EUR/USD currency exchange rate above various resistance levels and the 1.1400 mark. By 14:00 GMT, it appeared that the rate had pierced the weekly R1 simple pivot point at 1.1405 and had no resistance as high as the weekly R2 simple pivot point at 1.1446. In theory, the pair could aim at the 1.1446 level and the 1.1450 mark.
On the other hand, a potential retracement back down could look for support in the 1.1400 mark, the weekly R1 at 1.1405, before aiming at the December high-level zone at 1.1382/1.1387.
Sunset Market Commentary
Markets
Today’s economic center piece was US CPI. Inflation in December rose 0.5% m/m to be up 7% year-on-year. That’s up from 6.8% the month before and the highest since June 1982! The less volatile core gauge not only accelerated y/y, from 4.9% to a three-decade high of 5.5%. Monthly price dynamics also quickened, from 0.5% to 0.6% suggesting a sharp inflation cooldown isn’t materializing so far. Energy prices fell in December (-0.4% m/m) but was more than compensated by a broad increase in almost every other category: housing (0.4% m/m), transportation (0.8% m/m), household furnishings (1.3% m/m) and apparel (1.7% m/m) are some of the most important contributors. A rudimental split, showed services and goods inflation added 2.19 ppt and 2.16 ppt respectively to the headline figure. Energy (1.8 ppt) and food (0.89 ppt) make up for the remaining difference. The high inflation only strengthens the Fed’s case to double down on its normalization intentions. This recently gained traction in markets under the form of faster (March gets an almost 90% market probability) and more (four instead of the dot plot’s suggested three) rate hikes followed by a run-off of the balance sheet shortly after rate lift-off. It also means quite some of the Fed’s expected path has been discounted by now and that may explain some of the buy-the-rumour, sell-the-fact market reaction. The US yield curve flattens. Short tenors already retreated from intraday highs in the run-up to the CPI release. Yields are up 0.6 bps (2) currently. Medium (5y) to longer maturities (10y) lose 1.2 to 2 bps. Technicals play a role here as well, with the 10y yield for example having lost momentum earlier this week after failing to break above 1.77% resistance on a sustained basis. The German bond market suffers from collateral damage on the US’. Yields were already downwardly oriented and that move accelerated in lockstep with US Treasuries’ gaining traction. In particular for the 10y yield (-4.8 bps) there were some technical elements at play too with the psychological 0% coming within striking distance but proving a (mental) step too far for now. Other changes range from -2.3 bps (2y) to -4.7 bps (30y). The dollar receives a little blow. EUR/USD surpasses recent highs/minor resistance around 1.138 and captures the 1.14 big figure. 1.1422 is the next ST resistance zone (June 2021 interim high/upper bound of the upward sloping trend channel) with 1.1495 next on the radar in case of a break. The trade-weighted greenback is moving lower to the weakest level since mid-November at 95.37. USD/JPY flirts with the 115 barrier. EUR/GBP is literally going nowhere near the well-known 0.833/4 area. Norway’s krone stands out on FX markets today. EUR/NOK again dips below 10. This happened already a few times in recent weeks though the move today is the first one showing some actual strength. Recent gains in oil prices, which surged from $70/b early December to $84 today and a constructive sentiment (European/US stocks print gains from 0.3-0.8%) certainly help the commodity-reliant currency. News Headlines
Czech inflation rose further in December by 0.4% M/M to 6.6% Y/Y, up from 6.0% in November. The figure is 1% pt above the CNB November staff projections. Even so, this time it was in line with market expectations. Rising prices related to housing and transport (gasoline) still were important drivers. The December reading almost certainly isn’t the peak of the Czech inflation cycle yet. A resumption of VAT payments on electricity and gas will come in play in January. At the same time, many firms are expected to incorporate higher costs (commodities etc) in their price lists for the new year. In this context, inflation is likely surpass 8.0%. According to Petr Kral from the CNB monetary department inflation might even touch double digit levels for a few months early this year. The reaction of the Czech koruna to the CPI release was limited. EUR/CZK stabilized in the 24.40 area after yesterday’s koruna correction.
Inflation Hits its Fastest Pace in Four Decades
Powell calms the markets
Fears that the US economic expansion could be jeopardized by tighter monetary policy have been alleviated for now, as the Fed Chair Jerome Powell reassured investors that the central bank would bring down inflation without derailing the US economic recovery.
Powell also avoided a comment on the timing of rate hikes and stressed that no decision has yet been made regarding the reduction of the Fed’s balance sheet. After his hearing, not much has changed regarding market expectations, with three rate hikes fully priced in for 2022, together with a decent probability for a fourth.
CPI data came out ‘hot’; dollar weakens
US inflation has closed 2021 near its highest level since 1982, with the headline CPI rate coming as expected at 7.0%. The core CPI for December rose to 5.5% y/y from 4.6% and by 0.6% m/m versus forecasts of 0.5%, which could solidify market expectations for a fourth rate hike. However, the 10-year Treasury yield has failed to capitalize on the back of hotter-than-expected core inflation reading, pushing the dollar lower against a basket of currencies.
In the rest of the FX arena, the Australian and Canadian dollar have emerged as the undisputed winners, edging higher against the greenback and the euro due to rapidly increasing oil prices. Looking ahead, January could prove to be a stellar month for the loonie, as market participants appear optimistic about a BoC rate hike later this month. Moreover, the perceived risk-on sentiment continues to cast a shadow over the Japanese yen, which resumed its losses against the euro and the dollar.
US stocks headed for opening gains
On Tuesday, US stocks finished the session firmly higher as investors weighed comments from Fed Chair Jerome Powell. The S&P 500 index rose by 0.9% snapping a five-session losing streak, while investors appeared to have bought the dip on the recently pressured tech stocks, pushing the Nasdaq 100 higher by 1.4%. Eight of the eleven S&P 500 sectors finished the session in the green, with energy companies leading the gains on the back of surging oil prices.
Futures for the major US indices are pointing for a higher opening on Wednesday as investors shift their attention towards the upcoming earnings season. A strong growth in earnings could offer the much needed ‘fuel’ for the stock market, driving US shares higher. Moreover, oil continues its advance, driven by tight supply and easing fears regarding Omicron’s impact on the economic recovery.
In Europe, the Stoxx 600 index is in positive territory, while Hong Kong’s Hang Seng index closed 2.79% higher. Chinese shares surged after inflation data in the country came out lower-than-expected, increasing calls for further monetary easing by the PBOC to cushion the increasing slowdown fears in the world’s second largest economy.
US: Inflation Ended 2021 Near a 40-Year High
Consumer prices were up a solid 0.5% month-on-month (m/m) in December, slightly slower than November's 0.8% jump, but a tenth higher than markets were expecting. That took the year-on-year (y/y) pace of inflation to 7% – the fastest pace since 1982.
In a key shift, energy prices fell in December (-0.4% m/m), but remained up 29.3% versus a year ago. Food prices continued to rise at a solid clip, up 0.5% m/m, and are up 6.3% y/y.
Core inflation (ex. food and energy) was hotter than expected, jumping up 0.6% m/m. As a result, the year-on-year rate of core inflation picked up to 5.5%, from 4.9% in November, and the fastest pace in over 30 years.
The biggest drivers of core inflation were shelter (+0.4% m/m) and used vehicle prices (+3.5% m/m). The heavy hitters within shelter – rent and owners' equivalent rent – both rose 0.4% m/m, matching November's pace. Prices were up strongly for other categories too, including household furnishings and operations (+1.1% m/m), apparel (+1.7% m/m), new vehicles (+1.0% m/m).
Overall within core inflation, goods prices contributed the most to the upside surprise in core inflation (+1.2% m/m). Core services were up 0.3% m/m, cooling from October and November.
You had to look hard to find price declines in November's data. Car insurance was down again (-1.5% m/m), and recreation was down 0.2% m/m again.
Key Implications
Buckle up. After reaching new highs, core inflation is likely to get even higher in the first quarter of 2022 on a year-on-year basis as price levels are compared to relative weakness in early 2021. Inflation's persistently high readings have caught the attention of the Federal Reserve, which accelerated winding down its extraordinary stimulus measures in December. As outlined in our latest forecast, we expect rate hikes are not very far behind.
We also expect price pressures to ease somewhat this year from their current high levels, but to remain above the Fed's comfort zone long enough to lead to multiple rate hikes over the course of the year.
Risk Back On?
Stock markets remain in positive territory on Wednesday after a reassuring appearance from the Chairman of the Federal Reserve and some inflation data.
Jerome Powell put in a decent performance on Tuesday but sentiment is clearly very fragile and it may not take much to tip investors over the edge again. Three rate hikes are now heavily priced into the markets this year, with balance sheet reduction perhaps starting in the third quarter.
While investors could get on board with that, the situation is clearly extremely fluid. Expectations have changed considerably in recent months and while a few rate hikes and some balance sheet reduction may be preferential to prolonged, uncontrolled inflation, there is a limit to what investors will tolerate.
In a sign of the times we're living in, the US inflation data wasn't too bad. At 7% year on year, the CPI was in line with expectations while the core reading was only marginally ahead at 5.5%. On a monthly basis, the CPI readings were also marginally ahead of expectations, although not to the degree that has caused any alarm.
Rather, it seems the inflation data has been welcomed with investors seemingly fearing much worse. The dollar is slipping after the data, while US yields have eased and US futures are rallying. It would appear relentless optimism is perhaps returning to the markets and dip buyers are diving back in.
This once again brings me back to two key points this week. It's a strange time of year and one in which we should never read too much into investor doom and gloom. That's not to say this time may not be different, and there's certainly cause for concern. But it's not unusual for investors to suffer the January blues in what otherwise turns out to be a very good year.
And then there's earnings season which kicks off on Friday. While there is a good reason for caution at the moment, fourth-quarter earnings could offer a timely reminder that there is still plenty to be optimistic about this year. Inflation and interest rates are major headwinds but the economy is strong, the labor market is tight and consumers are in a good position. This may be what investors are clutching on to.
Fundamentals remain bullish for crude
Oil prices are trading back around their highest levels since late October after another surgeon Tuesday. The rally continues as OPEC continues to miss output targets and Libya reportedly struggles to ramp up production again. There was some good news as Kazakhstan looks set to get back to pre-disruption levels in a couple of days.
But the fundamentals still look bullish for crude, with omicron seen being less of a drag on growth and demand than feared. Combine this with short supply and there may be some room to run in the rally as restrictions are removed. Of course, Covid brings unpredictability and zero-covid policies to China and some others bring plenty of downside risk for prices.
Gold choppy after inflation data
Gold prices are quite choppy on Wednesday after making decent gains on Tuesday. The CPI data has weighed on the dollar, despite beating expectations, which has given gold a lift. It briefly went above yesterday's highs before some profit-taking kicked in, with focus now back on the $1,833 resistance that's proven so key in the past.
Powell's testimony took some heat out of the move in yields yesterday which hit the dollar and boosted gold. It's weathered the storm incredibly well in recent weeks as yields have surged and the dollar remained strong.
With markets potentially at peak Fed fear, at least for now, perhaps the bullish case for gold stems from yields not rising much further and expectations perhaps being slightly pared back. Because while the tightening environment shouldn't be bullish for gold, it's certainly doing it no harm at the moment. Which shouldn't be ignored.
Bitcoin staging a recovery?
Bitcoin is enjoying some mild reprieve over the last couple of days as risk appetite has returned a little in the markets. While some may be hoping the crypto has hit a bottom, after seeing strong support around $40,000 earlier this week, there's little yet to suggest that's the case. It's still early days but the rebound hasn't been particularly forceful. It was lifted by the US inflation data though, which has boosted risk appetite more broadly. Whether that will be enough is another thing.
USD/CHF Mid-Day Outlook
Daily Pivots: (S1) 0.9219; (P) 0.9249; (R1) 0.9264; More....
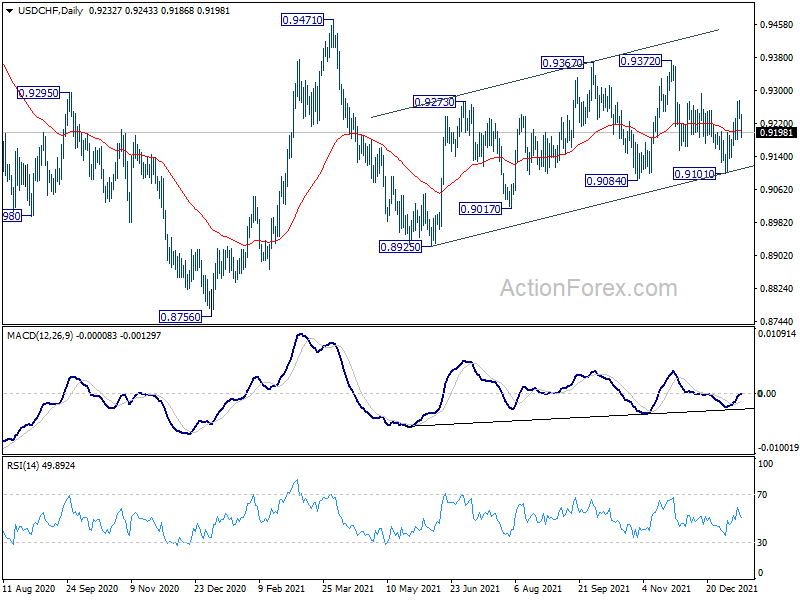
USD/CHF's break of 0.9199 support suggests that rebound form 0.9101 has completed at 0.9276. Intraday bias is turned back to the downside for 0.9084/9101 support zone. Firm break there will argue that choppy rise from 0.8925 has completed. On the upside, above 0.9276 will target 0.9372 resistance.
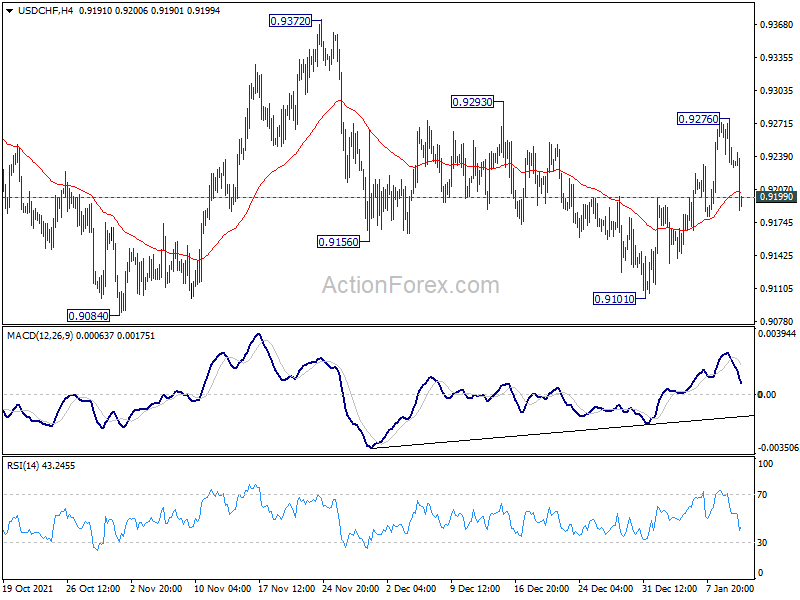
In the bigger picture, the corrective structure of the rebound from 0.8925 argues that fall from 0.9471 is not complete yet. It could either be the second leg of pattern from 0.8756 (2021 low), or resuming larger down trend from 1.0237 (2018 high). We'd pay attention to the downside momentum and assess the odds later. But for now, medium term outlook will be neutral at best as long as 0.9471 resistance holds.
USD/JPY Mid-Day Outlook
Daily Pivots: (S1) 115.05; (P) 115.37; (R1) 115.60; More...
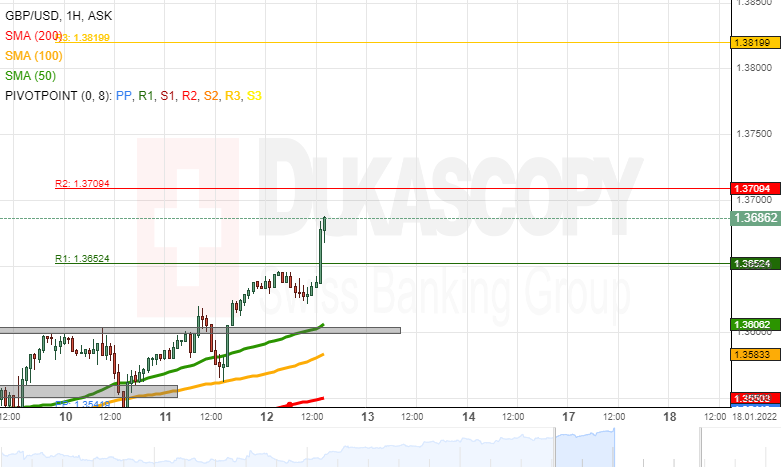
USD/JPY is staying in consolidation from 116.34 and intraday bias remains neutral first. Downside of retreat should be contained well well above 114.26 resistance turned support to bring rally resumption. On the upside, firm break of 61.8% projection of 109.11 to 115.51 from 112.52 at 116.47 will pave the way to 100% projection at 118.90, which is close to 118.65 long term resistance.
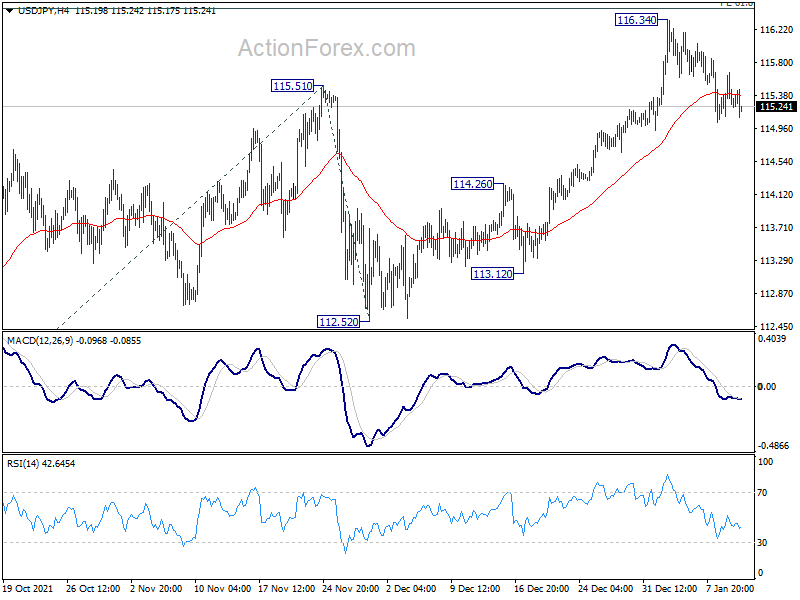
In the bigger picture, no change in the view that rise from 102.58 is the third leg of the up trend from 101.18 (2020 low). Such rally should target a test on 118.65 (2016 high). Sustained break there will pave the way to 120.85 (2015 high) and raise the chance of long term up trend resumption. For now, this will remain the favored case as long as 112.52 support holds, in case of deep pull back.