Sample Category Title
Dollar Drops as US Inflation Doesn’t Exceed Expectations
It has been a relief to see the US inflation not going above expectations for once! The consumer price index in the US rose 7% y-o-y in December, the highest pace in four decades, BUT, the figure was in line with analyst expectations, and brought forward the idea that this could be the point we see a peak in the inflation levels and light at the end of the long and dark inflation tunnel.
But, this is just a bet for now, as we haven’t seen the data print a number lower than a previous one just yet. Yesterday’s data was still stronger than the previous month’s read of 6.8%. And today’s PPI read should confirm that the factory-gate prices may have advanced to 9.8% in December in the US. A figure above the 10% mark could dent yesterday’s optimism that we are out of the woods in the inflation battle.
Cautiously positive market reaction
US stock indices reacted positively to the four-decade high inflation read yesterday. The S&P500 gained the most among the three major US indices thanks to a strong energy sector performance and closed the session only 0.28% higher. And Nasdaq is headed towards its own 50-DMA, which stands near 16150.
There is potential for further recovery in US equities given that the Federal Reserve (Fed) hawks went ahead of themselves at the start of the year. The latter would slow, but not reverse the positive pressure on the US yields, as the Fed must deal with high inflation, and it must deal fast. Moreover, according to a poll released by the S&P Global Market Intelligence this Tuesday, 52% of US businesses expect prices of their products to continue rising in 2022, and only 3% expect them to decline. So, it just the beginning of the battle, and not the end.
Dollar drops
With the Fed hawks losing field, the dollar index tanked below the 95 mark and even slipped below its past six-month up-trending channel base. The EURUSD finally broke above its December horizontal channel top, and above its 6-month down-trending channel top. The next natural target for the EURUSD bulls is the 1.15/ 1.1510 area, which includes an important psychological level and the 100-DMA- Yet, those who are looking for a stronger technical hint on a medium-term bullish reversal should wait for the 1.16 level to fall. This is the major 38.2% Fibonacci retracement on May-November decline and should call the end of the broader negative trend.
The GBPUSD also stepped above its medium-term descending channel top and the 50% Fibonacci retracement on June – December decline. The pair has been the best performer among the G10 currencies in the first week of 2022 thanks to position unwind and expectations that the Band of England (BoE) could opt for a second rate hike at its February meeting. The BoE hawks should help the pound gain more field against the greenback in the next couple of weeks. For now, Cable is preparing to test the 200-DMA which stands just a couple of pips higher at 1.3740 and an advance toward the 1.40 is no longer a faraway dream.
EUR/USD Daily Outlook
Daily Pivots: (S1) 1.1379; (P) 1.1416; (R1) 1.1477; More...
Intraday bias in EUR/USD remains on the upside. Rebound from 1.1185 should target 38.2% retracement of 1.2265 to 1.1185 at 1.1598. As we're tentatively treating is as a corrective move, we'd look for strong resistance from 1.1598 to bring down trend resumption. On the downside, below 1.1284 support will bring retest of 1.1185 low. However, sustained break of 1.1598 will argue that the trend is reversing already.
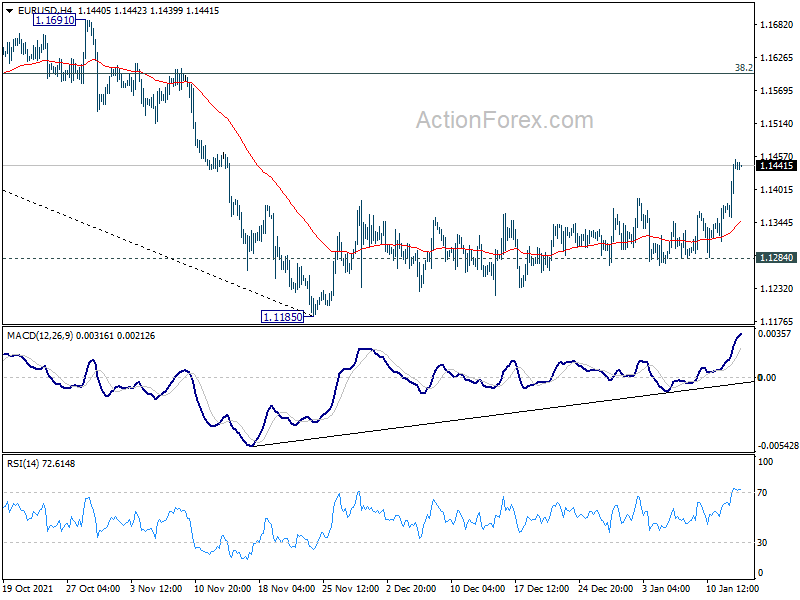
In the bigger picture, there are various ways of interpreting the fall from 1.2348 (2021 high). It could be a correction to rise from 1.0635 (2020 low), the fourth leg of a sideway pattern from 1.0339 (2017 low), or resuming long term down trend. In any case, outlook will now stay bearish as long as 1.1703 support turned resistance holds. Sustained break of 61.8% retracement of 1.0635 to 1.2348 at 1.1289 would pave the way back to 1.0635.
GBP/USD Daily Outlook
Daily Pivots: (S1) 1.3646; (P) 1.3680; (R1) 1.3737; More...
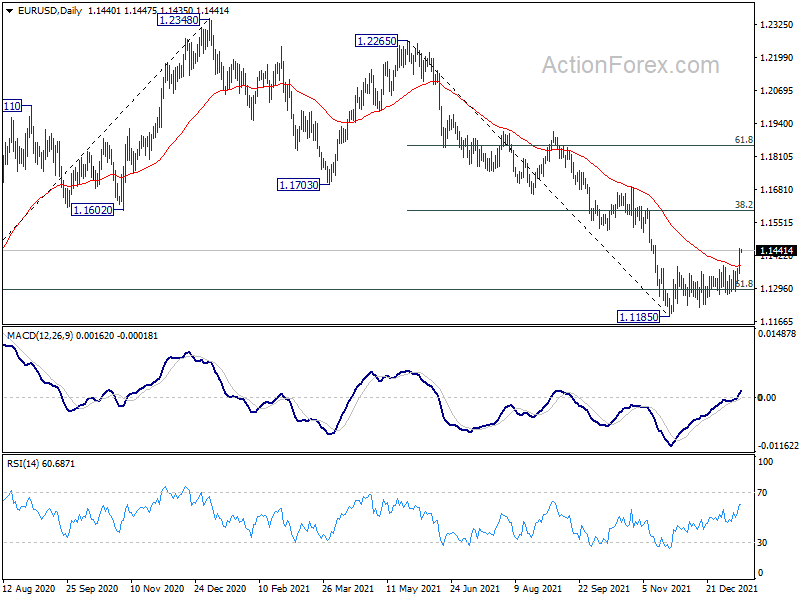
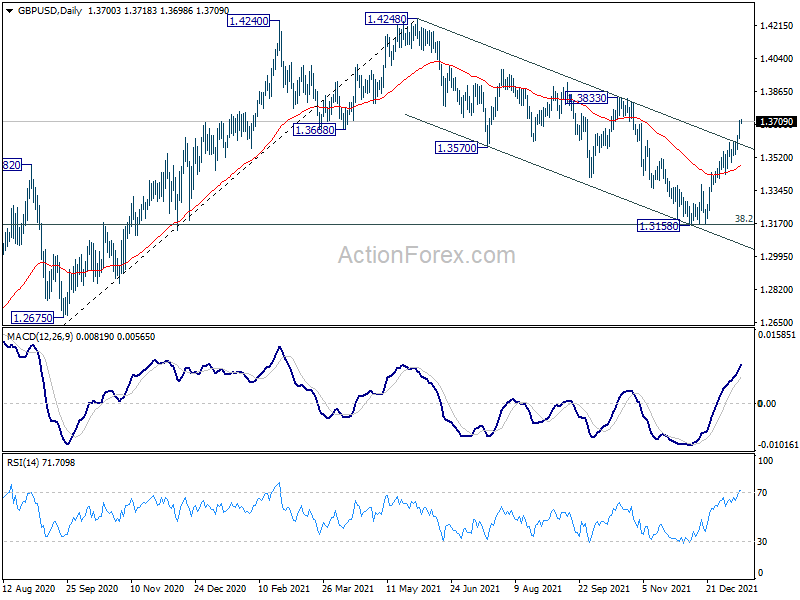
Intraday bias in GBP/USD remains on the upside as rise from 1.3158 is extending. No change in the view that corrective fall from 1.4282 should have completed with three waves down to 1.3158, after hitting 1.3164 medium term fibonacci level. Further rally should be seen to 1.3833 resistance first. Firm break there will pave the way to retest 1.4248 high. On the downside, below 1.3619 minor support will turn intraday bias neutral first. But further rise will remain in favor as long as 55 day EMA (now at 1.3479) holds.
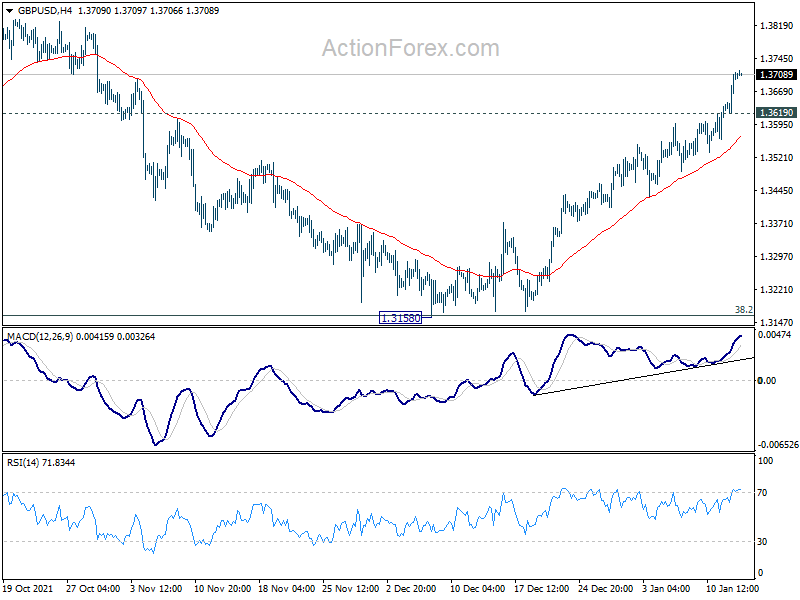
In the bigger picture, strong support was seen from 38.2% retracement of 1.1409 to 1.4248 at 1.3164. The development suggests that up trend from 1.1409 (2020 low) is still in progress. On resumption, next target will be 38.2% retracement of 2.1161 to 1.1409 at 1.5134. Nevertheless sustained break of 1.3164 will argue that whole rise from 1.1409 has completed and bring deeper fall to 61.8% retracement at 1.2493.
USD/CHF Daily Outlook
Daily Pivots: (S1) 0.9101; (P) 0.9172; (R1) 0.9215; More....
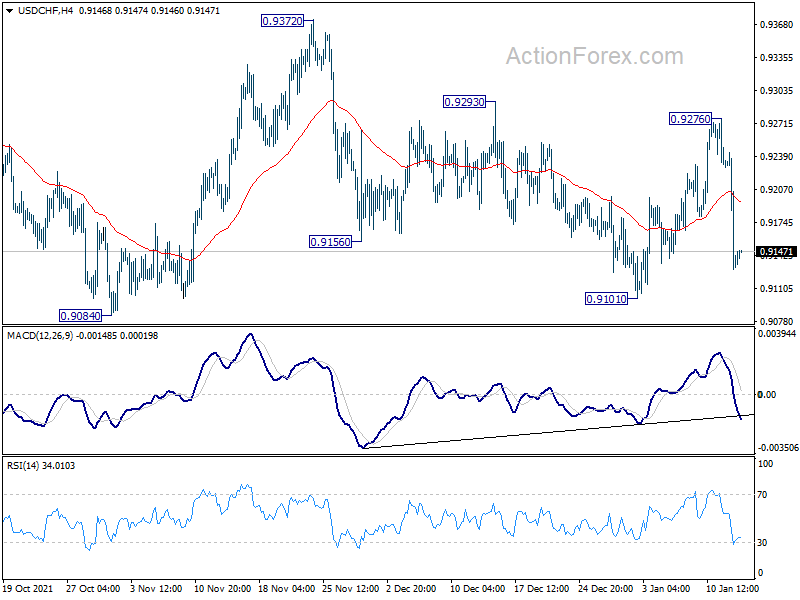
Intraday bias in USD/CHF remains on the downside for 0.9084/9101 support zone. Firm break there will argue that choppy rise from 0.8925 has completed. Deeper fall would then be seen back to 0.8925 support. On the upside, above 0.9276 will target 0.9372 resistance instead.
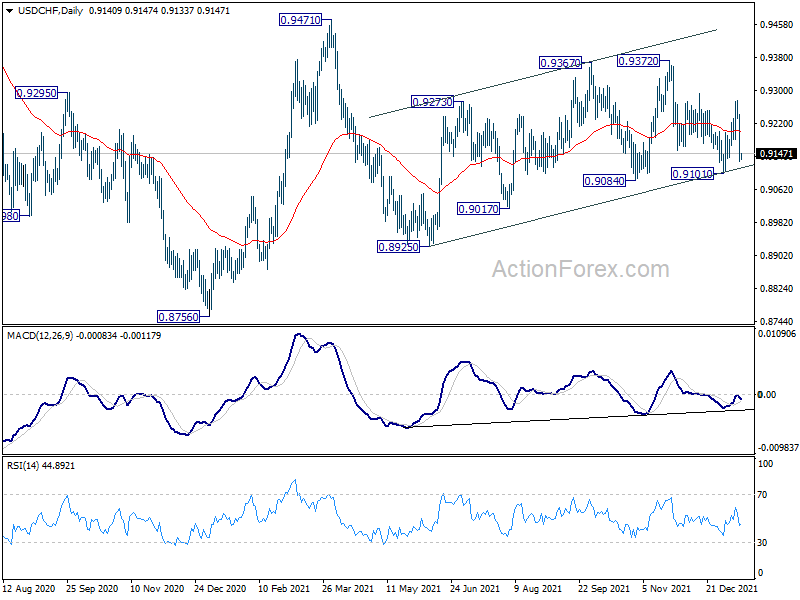
In the bigger picture, the corrective structure of the rebound from 0.8925 argues that fall from 0.9471 is not complete yet. It could either be the second leg of pattern from 0.8756 (2021 low), or resuming larger down trend from 1.0237 (2018 high). We'd pay attention to the downside momentum and assess the odds later. But for now, medium term outlook will be neutral at best as long as 0.9471 resistance holds.
USD/JPY Daily Outlook
Daily Pivots: (S1) 114.19; (P) 114.83; (R1) 115.28; More...
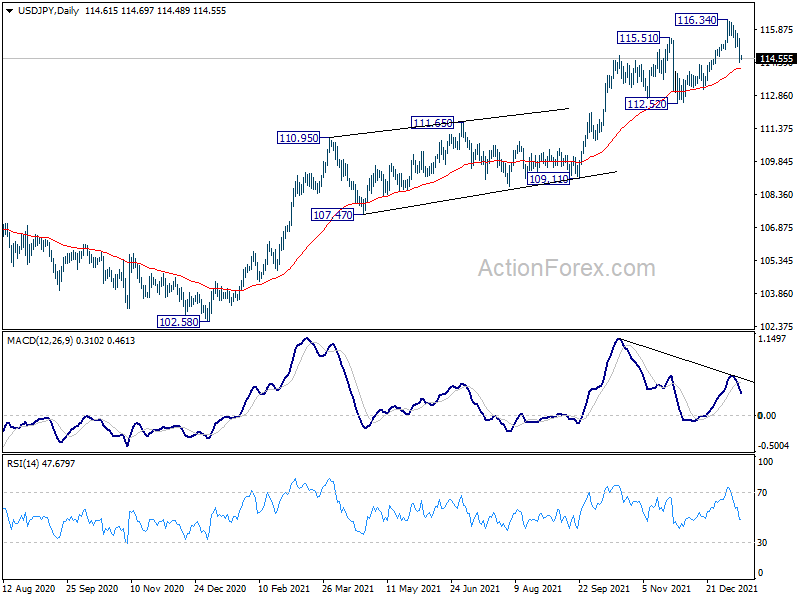
USD/JPY's fall from 116.34 accelerated lower. But we'll still expect strong support from 114.26 resistance turned support to bring rebound. On the upside, above 115.03 minor resistance will turn bias back to the upside for retesting 116.34 high. However, considering bearish divergence condition in daily MACD, firm break of 114.26 will argue that USD/JPY is already in a larger scale correction. Deeper fall would then be seen to 112.52 support and possibly below.
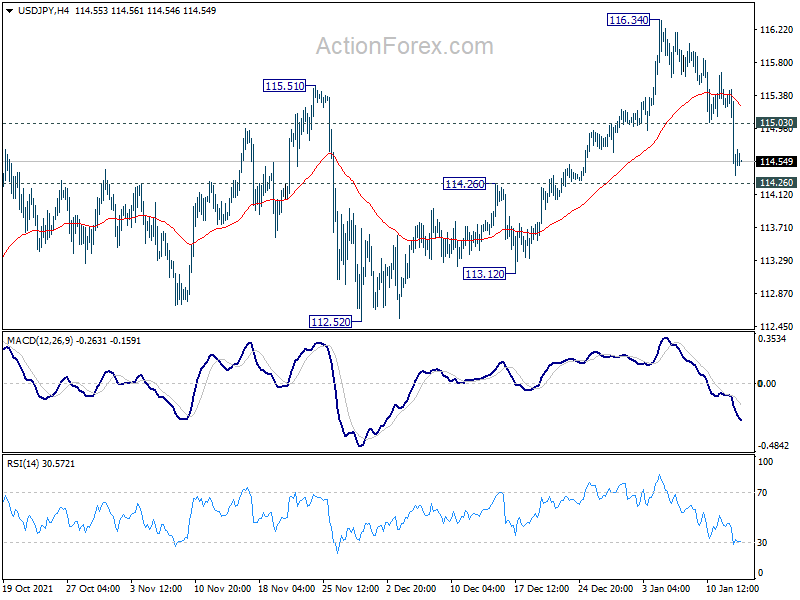
In the bigger picture, no change in the view that rise from 102.58 is the third leg of the up trend from 101.18 (2020 low). Such rally should target a test on 118.65 (2016 high). Sustained break there will pave the way to 120.85 (2015 high) and raise the chance of long term up trend resumption. For now, this will remain the favored case as long as 112.52 support holds, in case of deep pull back.
USD/CAD Daily Outlook
Daily Pivots: (S1) 1.2474; (P) 1.2527; (R1) 1.2558; More...
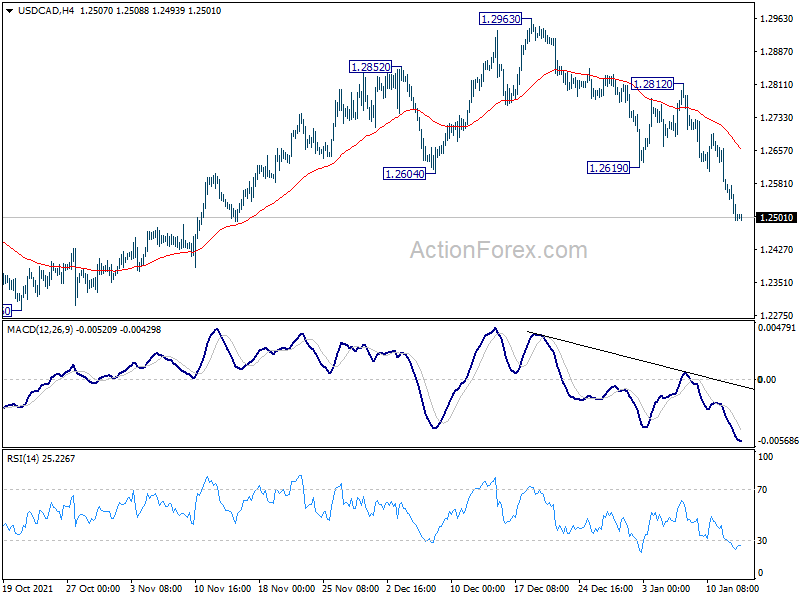
USD/CAD's fall from 1.2962 is still in progress and intraday bias stays on the downside. Rise from is finished at 1.2963, and possibly the whole pattern from 1.2005 too. Deeper decline would be seen back to 1.2286 support first. Break there will target 1.2005 low. For now, risk will stay on the downside as long as 1.2812 resistance holds, in case of recovery.
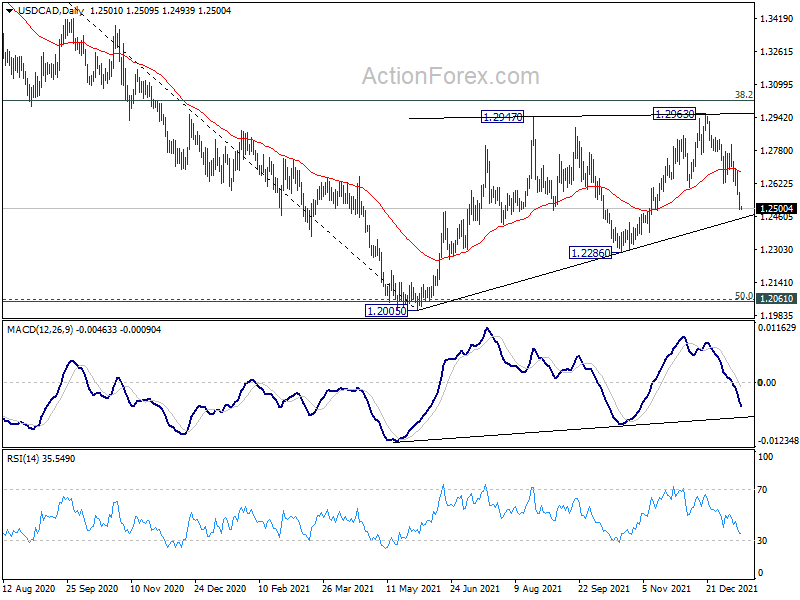
In the bigger picture, focus will be on 38.2% retracement of 1.4667 (2020 high) to 1.2005 (2021 low) at 1.3022. Sustained break there should confirm that the down trend from 1.4667 has completed after defending 1.2061 long term cluster support. Further rise would then be seen towards 61.8% retracement at 1.3650. However, rejection by 1.3022 will maintain medium term bearishness. Break of 1.2005 will resume the down trend form 1.4667 and that carries larger bearish implications too.
AUD/USD Daily Report
Daily Pivots: (S1) 0.7226; (P) 0.7259; (R1) 0.7318; More...
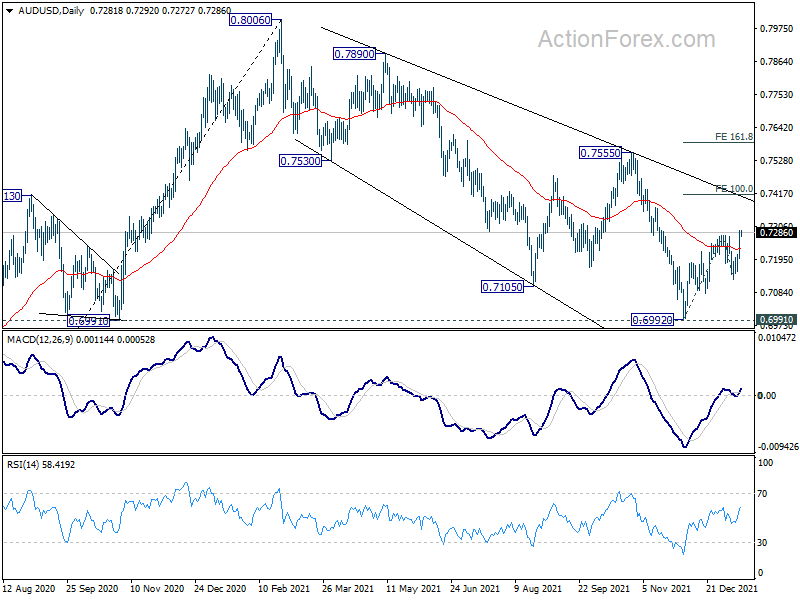
AUD/USD's rebound from 0.6992 resumed by breaking through 0.7277 resistance. The development revives the case that correction form 0.8006 has completed after defending 0.6991. Intraday bias is back on the upside for 100% projection of 0.6992 to 0.7277 from 0.7128 at 0.7413 first. For now, further rally will remain in favor as long as 0.7128 support holds, in case of retreat.
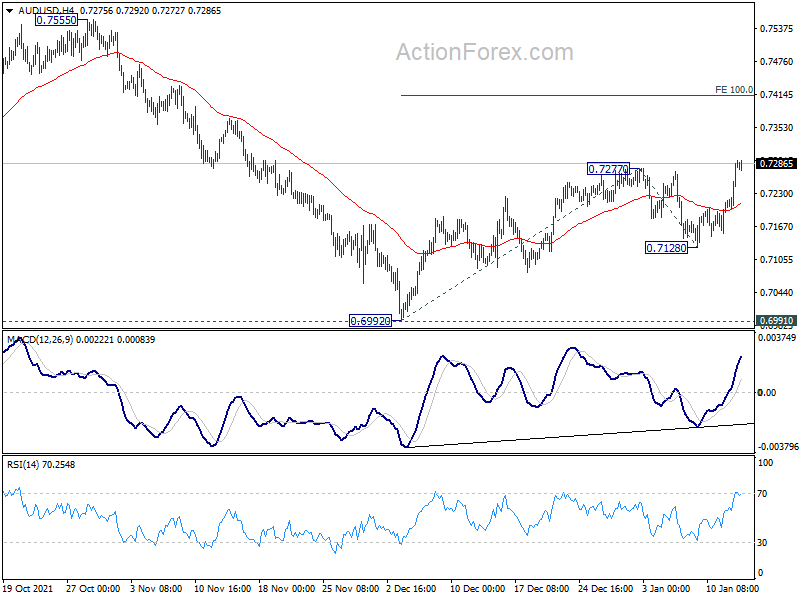
In the bigger picture, strong rebound from 0.6991 key structural support will retain medium term bullishness. That is, whole up trend from 0.5506 is still in progress. Firm break of 0.7555 resistance will target 0.8006 high and above. However, sustained break of 0.6991 will argue that the whole up trend from 0.5506 might be finished at 0.8006, after rejection by 0.8135 long term resistance. Deeper decline would then be seen back to 61.8% retracement of 0.5506 to 0.8006 at 0.6461.
Dollar Extending Selloff, Aussie Leads Commodity Currencies Higher
Dollar's post CPI selloff continues today and remains generally weak. For now, Swiss Franc is the second worst performer for the week, followed by Euro. Commodity currencies are the strongest, with Aussie overtaking Canadian. Sterling is mixed for now. Other markets are mixed for now, with Asian stocks lacking a clear direction. Global benchmark yields are retreating slightly. Gold and Silver, though, are firm together with oil.
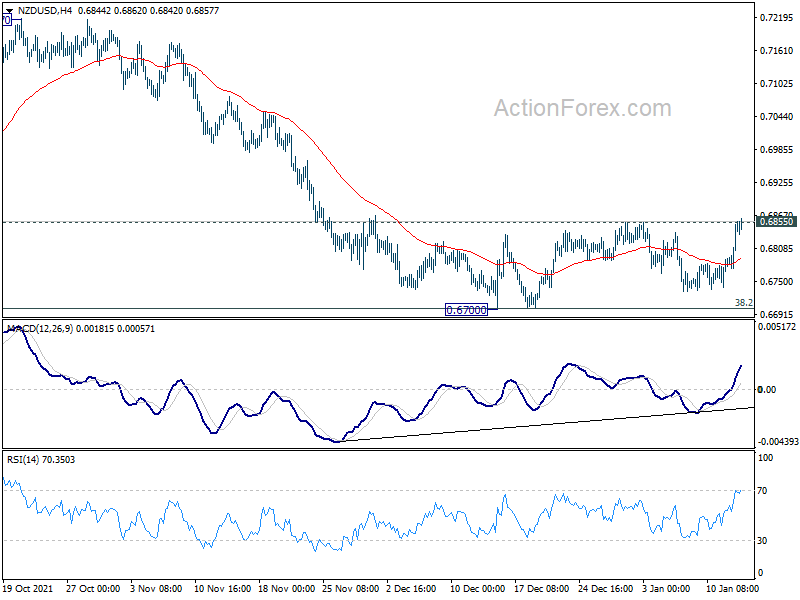
Technically, USD/CAD took the lead by breaking through 1.2619 support to resume the fall from 1.2963 earlier in the week. AUD/USD followed yesterday by breaking 0.7277 resistance to resume the rebound from 0.6992. Now, it's NZD/USD's turn to break through 0.6855 resistance firmly to resume the rebound from 0.6700.
In Asia, at the time of writing, Nikkei is down -0.77%. Hong Kong HSI is down -0.09%. China Shanghai SSE is down -0.50%. Singapore Strait Times is down -0.08%. Japan 10-year JGB yield is up 0.0041 at 0.133. Overnight, DOW rose 0.11%. S&P 500 rose 0.28%. NASDAQ rose 0.23%. 10-year yield dropped -0.021 to 1.725.
Dollar breaks 95 in steep fall, to draw support from 93.97 fib level
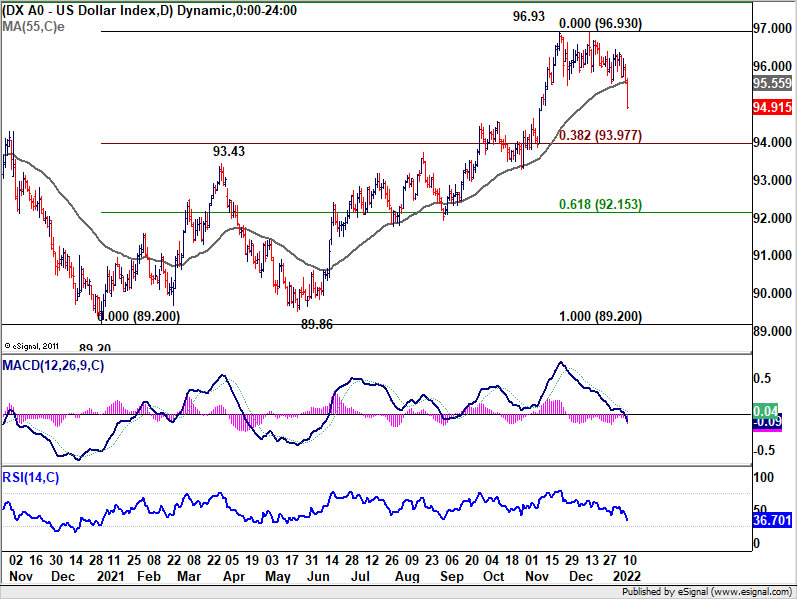
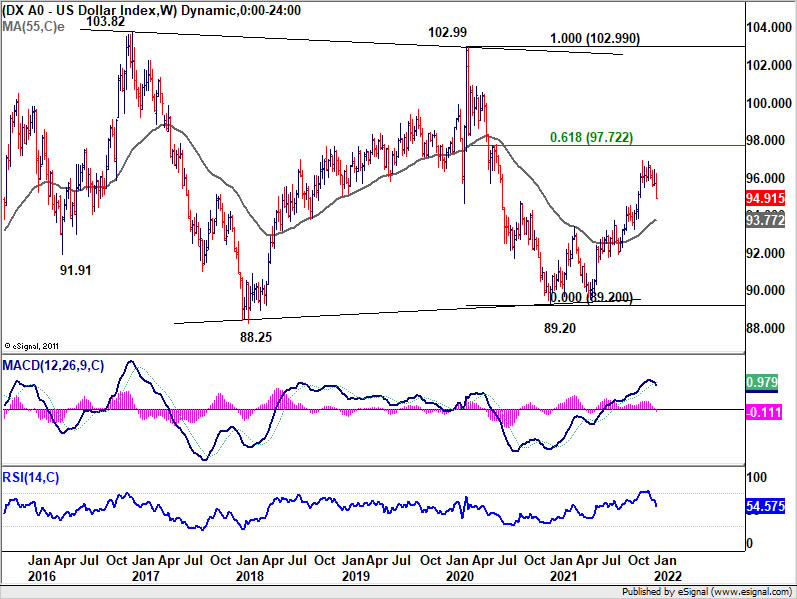
Dollar index tumbled sharply overnight and dived through 55 day EMA to close at 94.91. At this point, price actions from 96.93 are seen as a correction only. Hence, we'd look for strong support at 38.2% retracement of 89.20 to 96.93 at 93.97 to contain downside. The level is also close to 55 week EMA at 93.77. That would set the base for resuming the up trend from 89.20 through 96.93 at a later stage.
However, sustained break of 93.97 will argue that rise from 89.20 has already completed at 96.93. The three wave structure in turn suggests that it's a correction to the down trend from 102.99. Such development, together with the index back below 55 week EMA, would be rather bearish and could set up another medium term fall through 89.20 later in the year.
Fed Bullard: March hike is a definite possibility
St. Louis Fed President James Bullard said Fed "could begin increasing the policy rate as early as the March meeting in order to be in a better position to control inflation." He added, " it makes sense to get going sooner rather than later and so I think March would be a definite possibility."
"We need to risk manage here. We need to be prepared for the case where inflation does not moderate as much as hoped and instead the Fed has to come in and move inflation closer to the 2% target. How much the Fed has to do and how much natural moderation there will be is very much an open question," he said.
Separately, Bullard also told WSJ, "I actually now think we should maybe go to four hikes in 2022."
Fed Daly: Time to start removing policy accommodation
San Francisco Fed President Mary Daly said inflation is "uncomfortably high" in the US. And, it's time to "start removing some of the accommodation we've been giving to the economy,"
"I definitely see rate increases coming, as early as March even," she noted. But she didn't want to predict the number of rate hikes needed for this year.
Fed Brainard: Policy focused on getting inflation back down to 2%
In the nomination hearing for Fed Vice Chair position, Lael Brainard said, "we are seeing the strongest rebound in growth and decline in unemployment of any recovery in the past five decades."
"But inflation is too high, and working people around the country are concerned about how far their paychecks will go," she added. "Our monetary policy is focused on getting inflation back down to 2% while sustaining a recovery that includes everyone. This is our most important task."
Looking ahead
ECB will release monthly economic bulletin today. US will release PPI and jobless claims.
AUD/USD Daily Report
Daily Pivots: (S1) 0.7226; (P) 0.7259; (R1) 0.7318; More...
AUD/USD's rebound from 0.6992 resumed by breaking through 0.7277 resistance. The development revives the case that correction form 0.8006 has completed after defending 0.6991. Intraday bias is back on the upside for 100% projection of 0.6992 to 0.7277 from 0.7128 at 0.7413 first. For now, further rally will remain in favor as long as 0.7128 support holds, in case of retreat.
In the bigger picture, strong rebound from 0.6991 key structural support will retain medium term bullishness. That is, whole up trend from 0.5506 is still in progress. Firm break of 0.7555 resistance will target 0.8006 high and above. However, sustained break of 0.6991 will argue that the whole up trend from 0.5506 might be finished at 0.8006, after rejection by 0.8135 long term resistance. Deeper decline would then be seen back to 61.8% retracement of 0.5506 to 0.8006 at 0.6461.
Economic Indicators Update
| GMT | Ccy | Events | Actual | Forecast | Previous | Revised |
|---|---|---|---|---|---|---|
| 21:45 | NZD | Building Permits M/M Nov | 0.60% | -2.00% | -2.10% | |
| 23:50 | JPY | Money Supply M2+CD Y/Y Dec | 3.70% | 3.90% | 4.00% | |
| 06:00 | JPY | Machine Tool Orders Y/Y Dec P | 64.00% | |||
| 09:00 | EUR | ECB Economic Bulletin | ||||
| 13:30 | USD | PPI M/M Dec | 0.40% | 0.80% | ||
| 13:30 | USD | PPI Y/Y Dec | 9.80% | 9.60% | ||
| 13:30 | USD | PPI Core M/M Dec | 0.40% | 0.70% | ||
| 13:30 | USD | PPI Core Y/Y Dec | 8.00% | 7.70% | ||
| 13:30 | USD | Initial Jobless Claims (Jan 7) | 213K | 207K | ||
| 15:30 | USD | Natural Gas Storage | -175B | -31B |
Dollar breaks 95 in steep fall, to draw support from 93.97 fib level
Dollar index tumbled sharply overnight and dived through 55 day EMA to close at 94.91. At this point, price actions from 96.93 are seen as a correction only. Hence, we'd look for strong support at 38.2% retracement of 89.20 to 96.93 at 93.97 to contain downside. The level is also close to 55 week EMA at 93.77. That would set the base for resuming the up trend from 89.20 through 96.93 at a later stage.
However, sustained break of 93.97 will argue that rise from 89.20 has already completed at 96.93. The three wave structure in turn suggests that it's a correction to the down trend from 102.99. Such development, together with the index back below 55 week EMA, would be rather bearish and could set up another medium term fall through 89.20 later in the year.
Elliott Wave View: Rally in Bitcoin May Fail
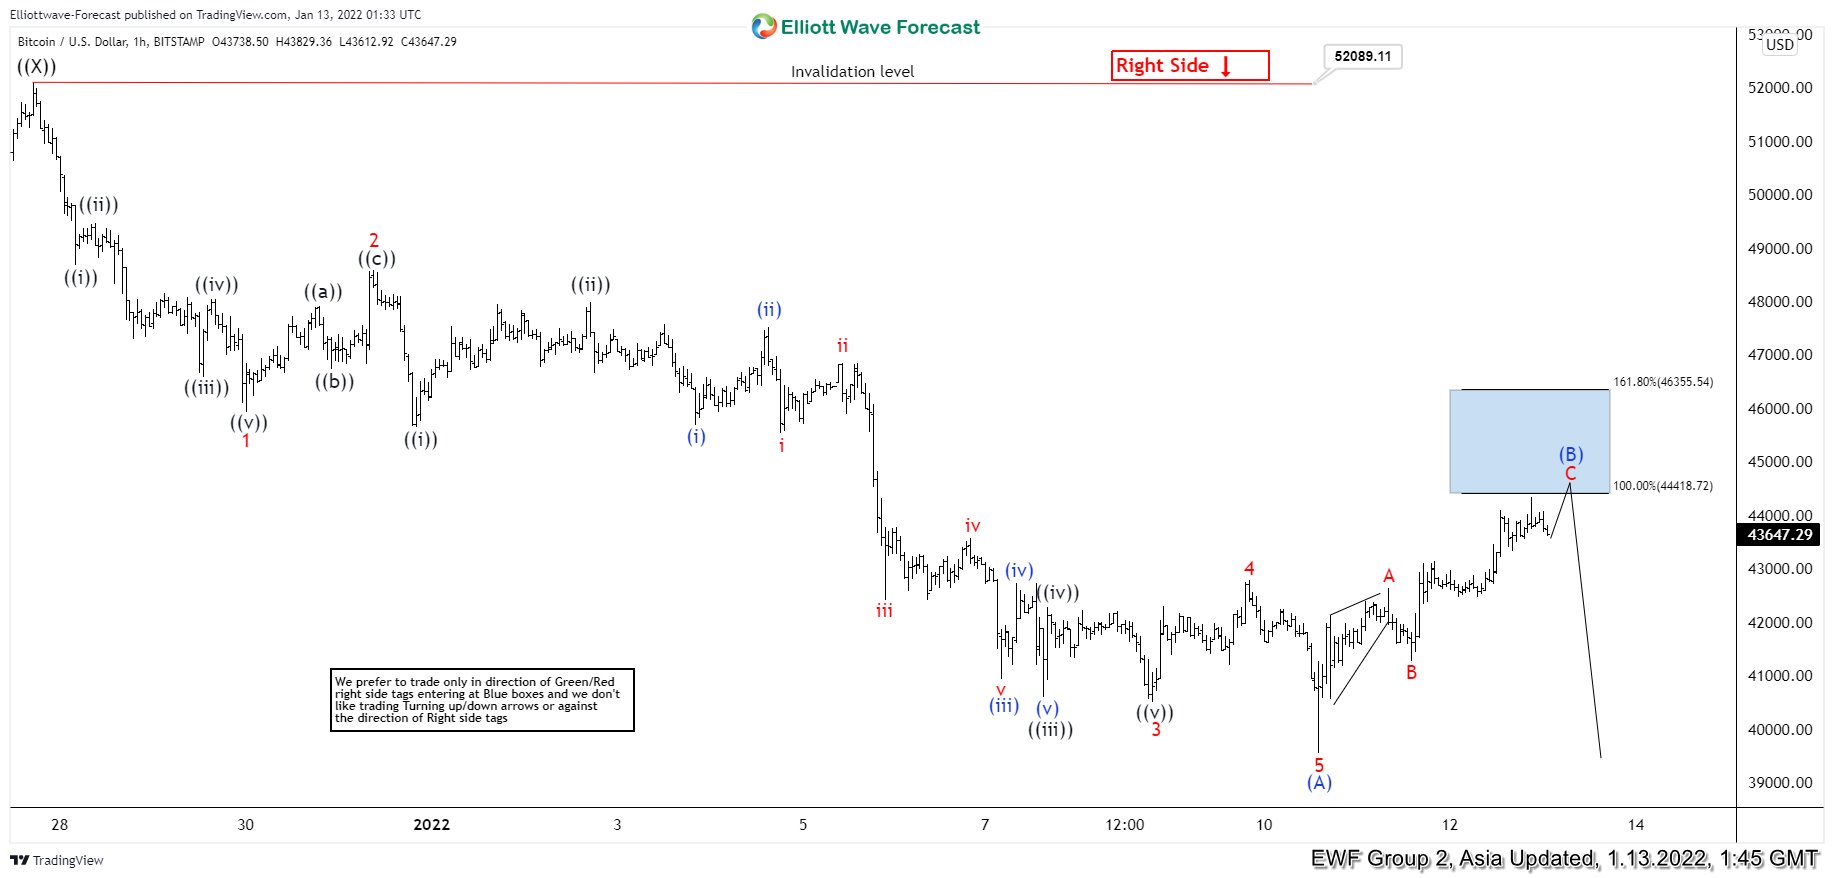
Short Term Elliott Wave View in Bitcoin shows a 5 swing bearish sequence from November 10, 2021 high favoring more downside. Decline from there is unfolding as a double three Elliott Wave structure. Down from November 10, wave (A) ended at 53308.93 and wave (B) ended at 59099.64. The crypto currency then extended lower in wave (C) towards 41967.50 and this completed wave ((W)) in higher degree. Rally in wave ((X)) ended at 52089.1.
Bitcoin extended lower again and it has broken below wave ((W)) confirming that wave ((Y)) has started. Wave ((Y)) lower is unfolding as a zigzag structure. Down from wave ((X)), wave (A) ended at 39558.7 with internal subdivision as a 5 waves impulse. Wave (B) has either completed already or it can see a marginal high towards 44418 – 46355 blue box area before the crypto currency resumes lower. Near term, as far as pivot at 52089.11 high stays intact, expect rally to fail in 3, 7, or 11 swing for further downside. Potential target lower in Bitcoin is 100% – 123.6% Fibonacci extension from November 10, 2021 peak. This area comes at 19061 – 25341 where strong support can be seen.
Bitcoin 60 Minutes Elliott Wave Chart