Sample Category Title
US and Russia Agree to Extend Talks
Market movers today
Today's calendar is rather thin.
In the US, the NFIB small business survey is quite interesting, not least the sub-components, which provide information about the labour market and underlying inflation pressure. We expect the survey will reveal that the labour market remains tight, with many businesses struggling to find qualified workers and expecting higher wage growth. Simultaneously, businesses are likely to report that a majority expects consumer price increases.
The US Senate Banking Committee holds a hearing on Fed Chair Powell's renomination. We expect Powell to be approved without too many problems, as he enjoys overall support from most Democrats and Republicans, despite some criticism from both left-wing Democrats and right-wing Republicans.
Also still focus on rising geopolitical tensions between Russia and US/Europe/NATO.
The 60 second overview
US-Russia talks ended on Monday on a cautiously optimistic tone, sending RUB higher. As expected, no agreement was reached, but both sides agreed to continue talks. The US representative, Deputy Secretary of State Wendy Sherman, said that any major breakthrough would take several weeks if not longer. She also said the US was open to discuss the size and scope of future military exercises as well as the positioning of intermediate-range missile systems in Europe. The US had earlier communicated that Russian demands not to expand NATO further to the east are a non-starter. Russia, however, repeated its demands in this regard while also insisting that NATO should never let Ukraine or other ex-Soviet states join the alliance. Stakes remain high with Russia having deployed more than 100,000 troops at the Ukraine border and the possibility of large-scale economic sanctions against Russia being raised in a response to a potential attack. The focus now turns to Brussels, where Russia is due to meet NATO representatives on Wednesday and to Vienna for consultations under the OSCE framework on Thursday.
Euro Macro: The number of unemployed people in the euro area fell by 220,000 in November, lowering the jobless rate to 7.2%, within a whisker of its record low in March 2020 when the pandemic hit. Although the labour market recovery remains a bright spot, the triple headwinds of new COVID-19 restrictions, ongoing supply bottlenecks and real household income erosion are increasingly weighing on the euro area macro momentum, as we discuss in Euro Area Macro Monitor - Triple headwinds, 10 January.
FI: Modest movements in yields and spreads yesterday after the sell-off that began in mid-December. Since mid-December 10Y US Treasuries and 10Y Bunds have risen approx. 35bp. The German and US curves have steepened between 2Y and 10Y, while 10-30Y flattened in the US and the German curve was more or less unchanged from mid-December. The long trend is still for flatter curves as central banks tighten monetary policy.
FX: USD, JPY and GBP rose yesterday vis-à-vis Scandies and CHF. There were big moves on Monday with EUR/USD taking a brief dip below 1.13 as one of the main highlights.
Credit: Spreads in the secondary markets continued their widening trend yesterday. We see this as being the result of the continuation of rising rates, but also being due to an aggressive start to the primary printing season. Yesterday the market saw a flurry of new deal announcements, including hybrid bonds from TotalEnergies (i.e. 5.25 years to first call which fixed at 2%). This focus on the primary market drew liquidity away from the secondary market causing iTraxx Main to widen 1.2bp to 51.6bp and Xover to widen 4.5bp to 254.4bp. In cash, the move was more muted with IG widening 0.5bp and HY widening 1.9bp.
Nordic macro
The Swedish Debt Office (SNDO) will present their monthly report on the net outcome of the central government's revenues and payments (the net borrowing requirement) for the month of December. The forecast is for positive borrowing requirement (budget deficit) of SEK 91.5bn. However, the two months since the latest forecast (October) have yielded an aggregate surplus (compared to said forecast) of approximately SEK 40bn, and for the whole year the figure is even greater, so we would not be surprised to see today's figure follow that trend.
USD/CHF Daily Outlook
Daily Pivots: (S1) 0.9214; (P) 0.9244; (R1) 0.9303; More....
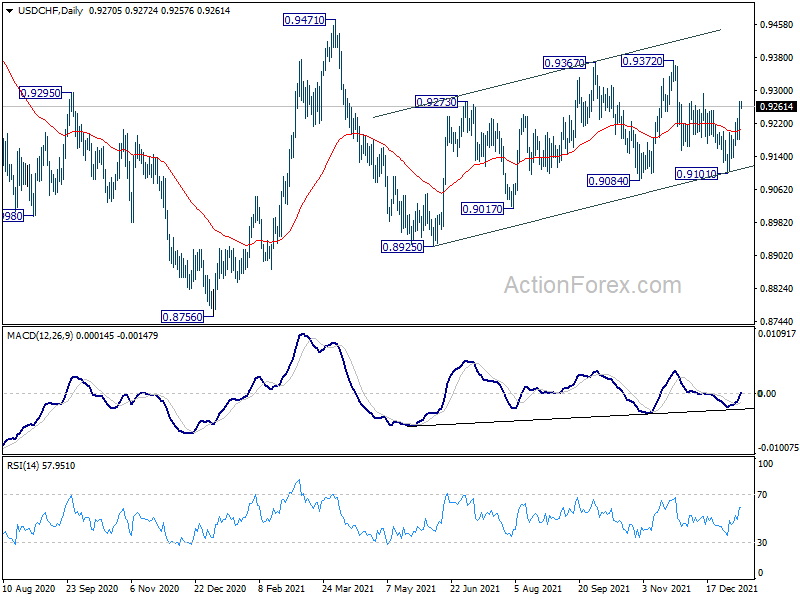
Intraday bias in USD/CHF remains on the upside for 0.9293 resistance first. As noted before, with 0.9084 support intact, choppy rise from 0.8925 could still extend higher. Break of 0.9293 should target 0.9372 resistance and above. On the downside, break of 0.9199 minor support will turn intraday bias neutral first.
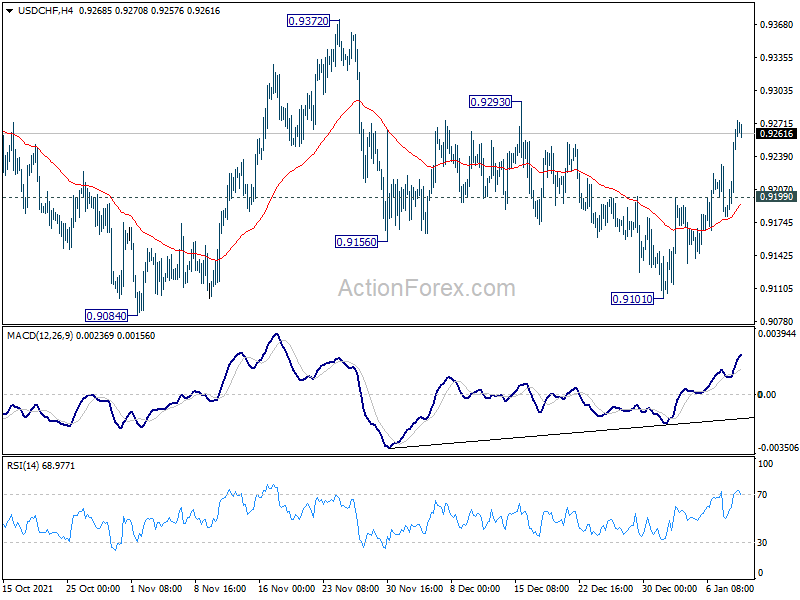
In the bigger picture, the corrective structure of the rebound from 0.8925 argues that fall from 0.9471 is not complete yet. It could either be the second leg of pattern from 0.8756 (2021 low), or resuming larger down trend from 1.0237 (2018 high). We'd pay attention to the downside momentum and assess the odds later. But for now, medium term outlook will be neutral at best as long as 0.9471 resistance holds.
Swiss Franc Down Broadly, Focus Turns to Fed Powell
Overall market sentiment is rather mixed for the moment. Despite the initial steep selloff overnight, major US indexes staged an impressive come back towards the end of the session. NASDAQ even eked out a slight gain. Gold is back above 1800 handle while Bitcoin appears to be supports by 40k for now. Investors are probably still holding their bets before Fed Chair Jerome Powell's testimony today, and US CPI tomorrow. In the currency markets, Yen is staying in near term recovery for now. Selling focus has apparently turned to Swiss Franc. Commodity currencies are recovery while Sterling appears to be ready to extend recent rally.
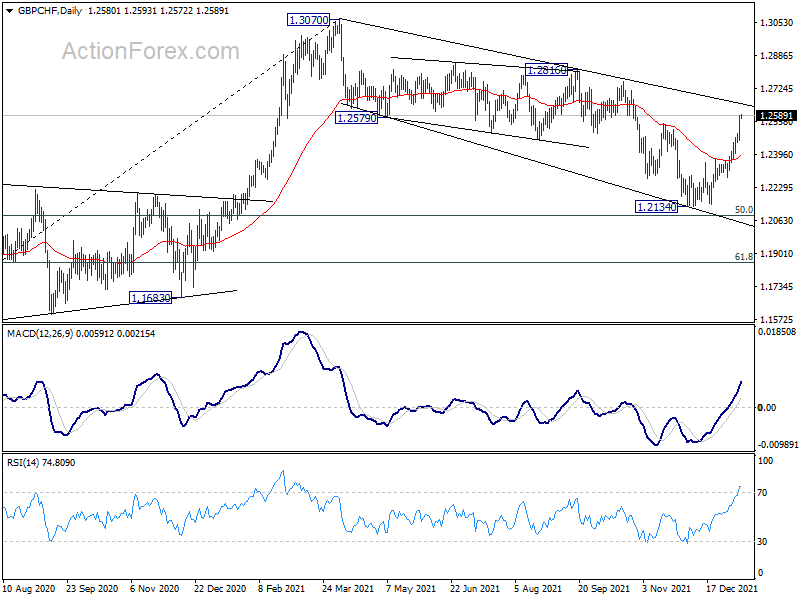
Technically, GBP/CHF's strong rally yesterday, and break of 1.2549 resistance argues that the corrective fall from 1.3070 might have completed at 1.2134 already. Immediate focus is now on trend line resistance at 1.2652. Sustained break there will add to this bullish case and send GBP/CHF through 1.2816 resistance back to 1.3070 high. We'll monitor USD/CHF's reaction to 0.9293 resistance and at the same time.
In Asia, at the time of writing, Nikkei is down -0.90%. Hong Kong HSI is up 0.20%. China Shanghai SSE is down -0.46%. Singapore Strait Times is up 0.44%. Japan 10-year JGB yield is up 0.0161 at 0.151. Overnight, DOW dropped -0.45%. S&P 500 dropped -0.14%. NASDAQ rose 0.05%. 10-year yield rose 0.009 to 1.780, after hitting 1.808.
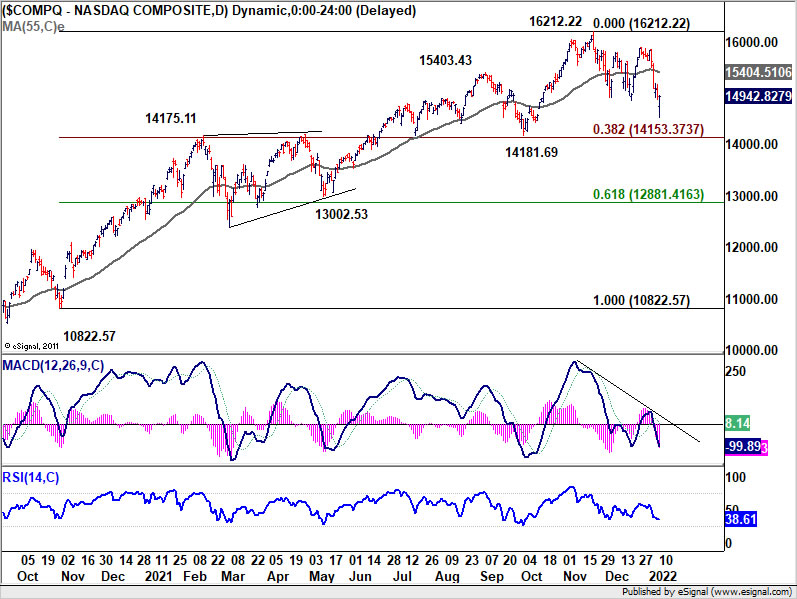
NASDAQ staged strong rebound after initial dive
NASDAQ initially dived sharply to as low as 14530.22 overnight, but staged a strong rebound to close up 0.05% at 14942.82. Technically, we're seeing NASDAQ as in correction to the move from 10822.57 to 16212.22. It's envisaged as a range pattern that could last for a while.
Nevertheless, 14100/14200 zone should provide enough support to floor any decline attempt. We're talking about a cluster of support levels there, including 14175.11 resistance turned support, 14181.69 support, and 38.2% retracement of 10822.57 to 16212.22 at 14153.37.
However, it should be noted that a firm break of 14181.69 structural level, which is unlikely, would indicate that NASDAQ could be in a larger scale correction.
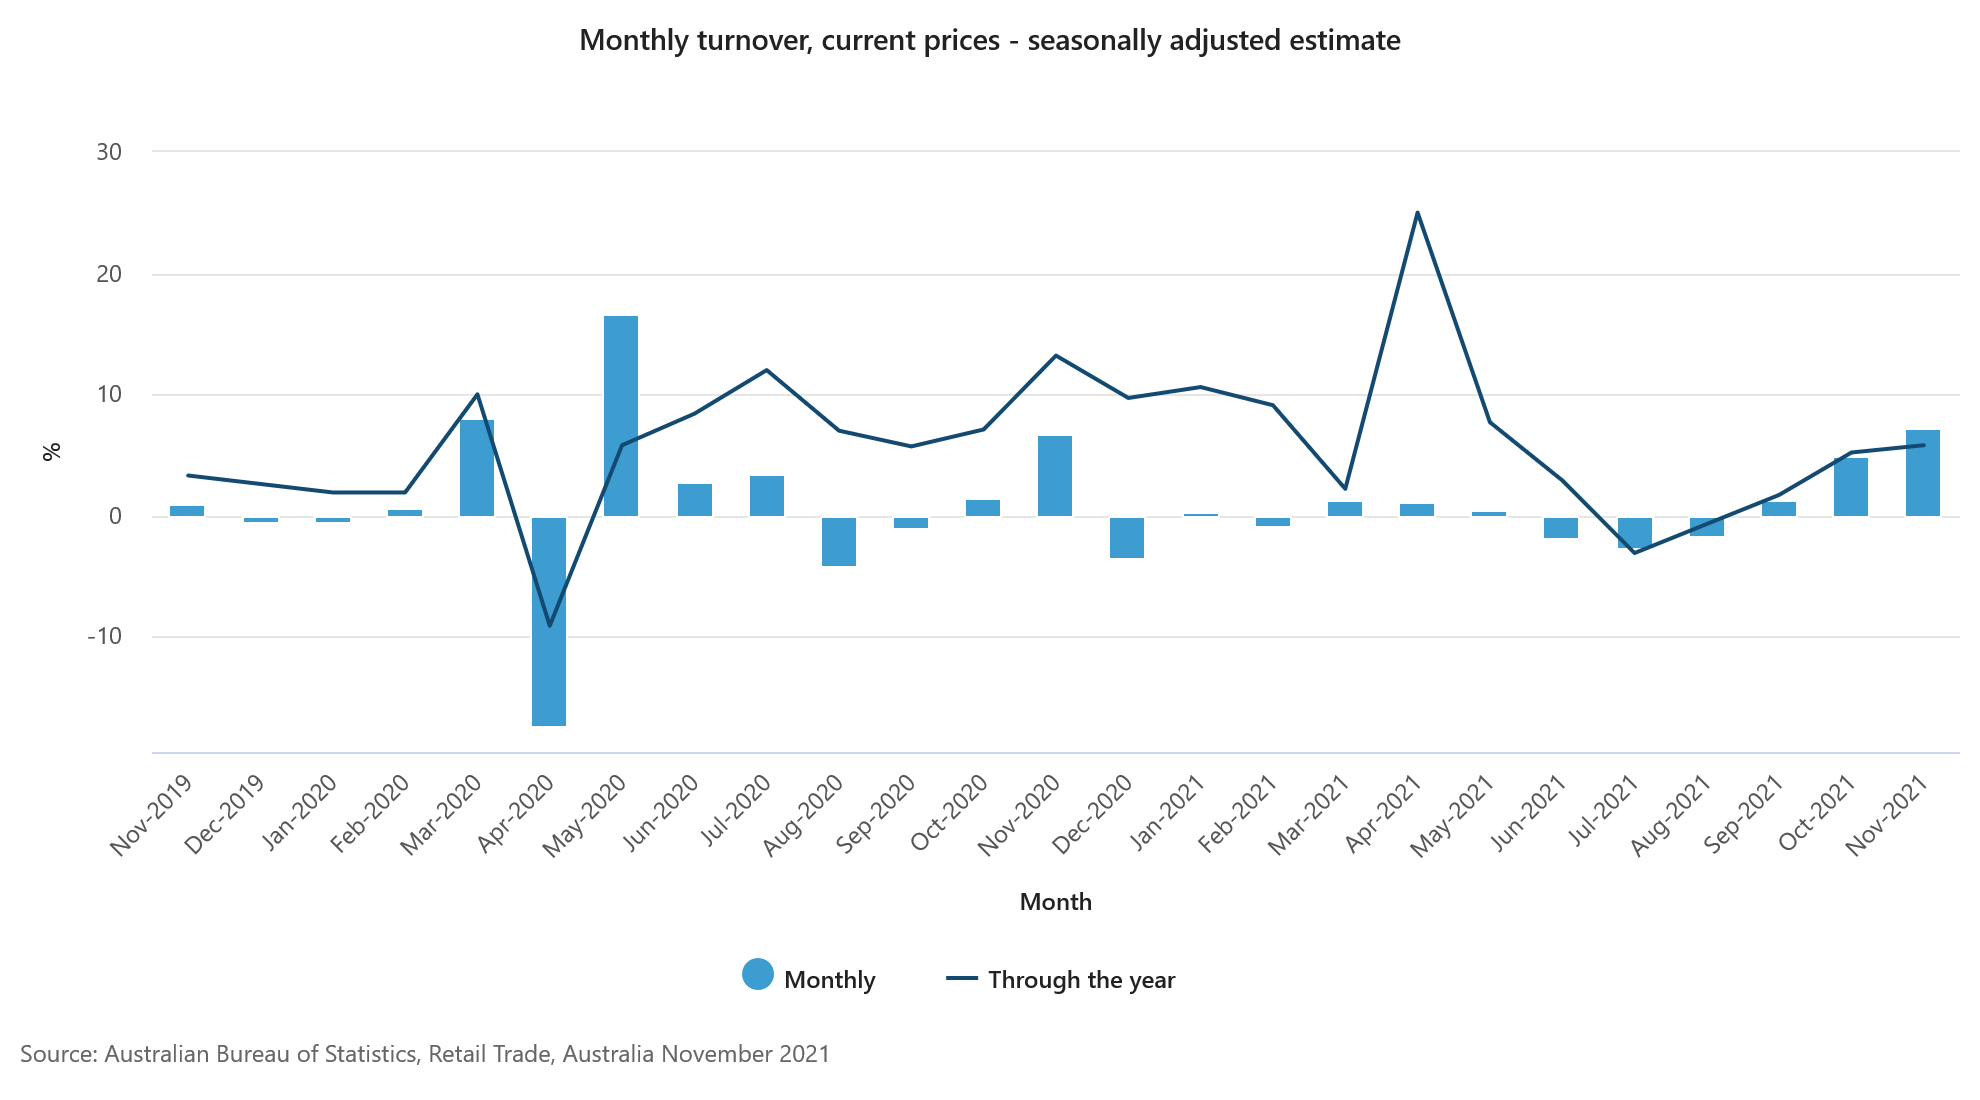
Australia retail sales rose 7.3% mom in Nov as restrictions eased
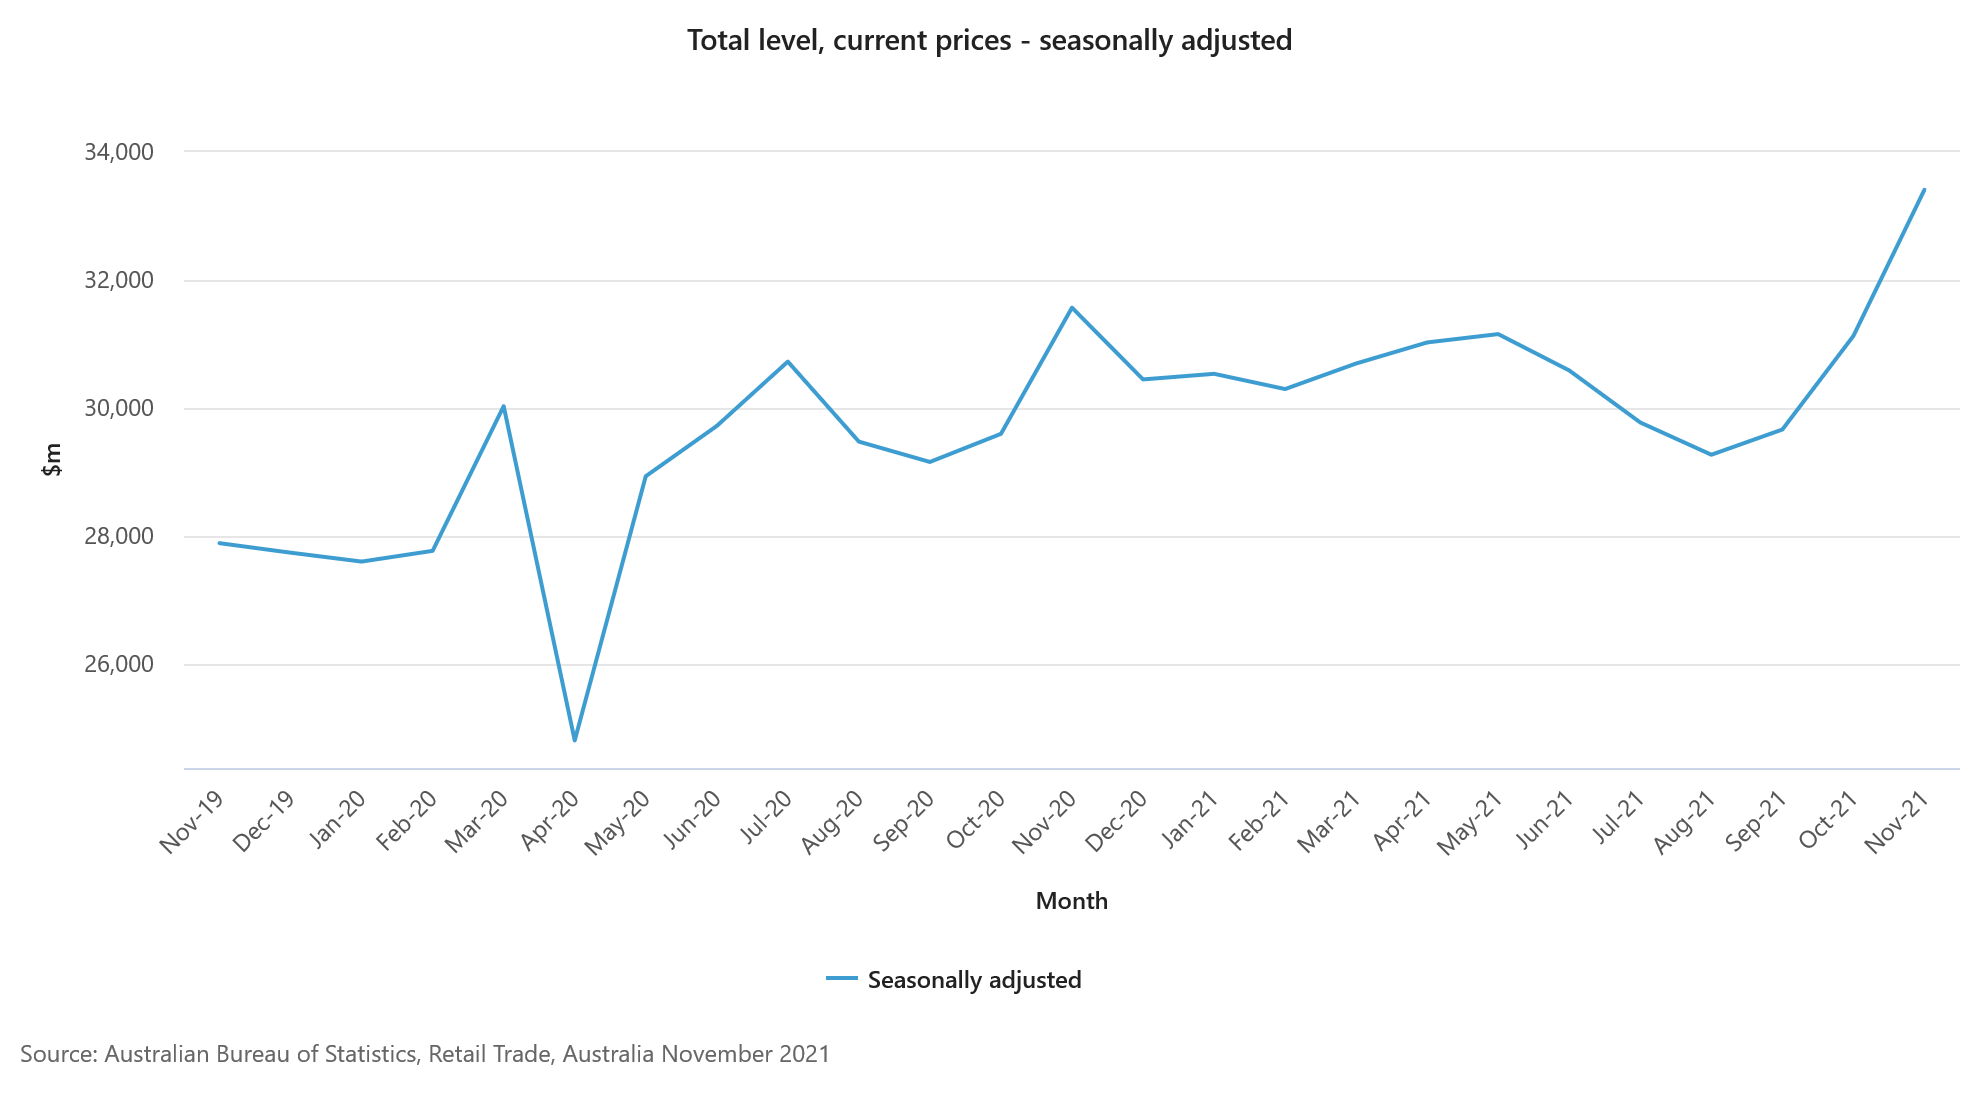
Australia retail sales rose 7.3% mom in November, well above expectation of 4.0% mom. That's also the fourth strongest monthly rise on record. Total turnover at current prices hit a record AUD 33.4B.
"Further easing of COVID-19 restrictions in the South-Eastern states and territories has seen the retail industry recover all lost momentum caused by the Delta outbreak," Ben James, Director of Quarterly Economy Wide Statistics, said. "Victoria recorded the largest state rise, up 20.0 per cent, reaching its highest level of the series. This follows the state's lockdown ending in late October."
"Continued easing of COVID-19 restrictions, including less strict density and capacity limits, in New South Wales (5.1 per cent) and the Australian Capital Territory (19.2 per cent) led to rises in turnover to record levels."
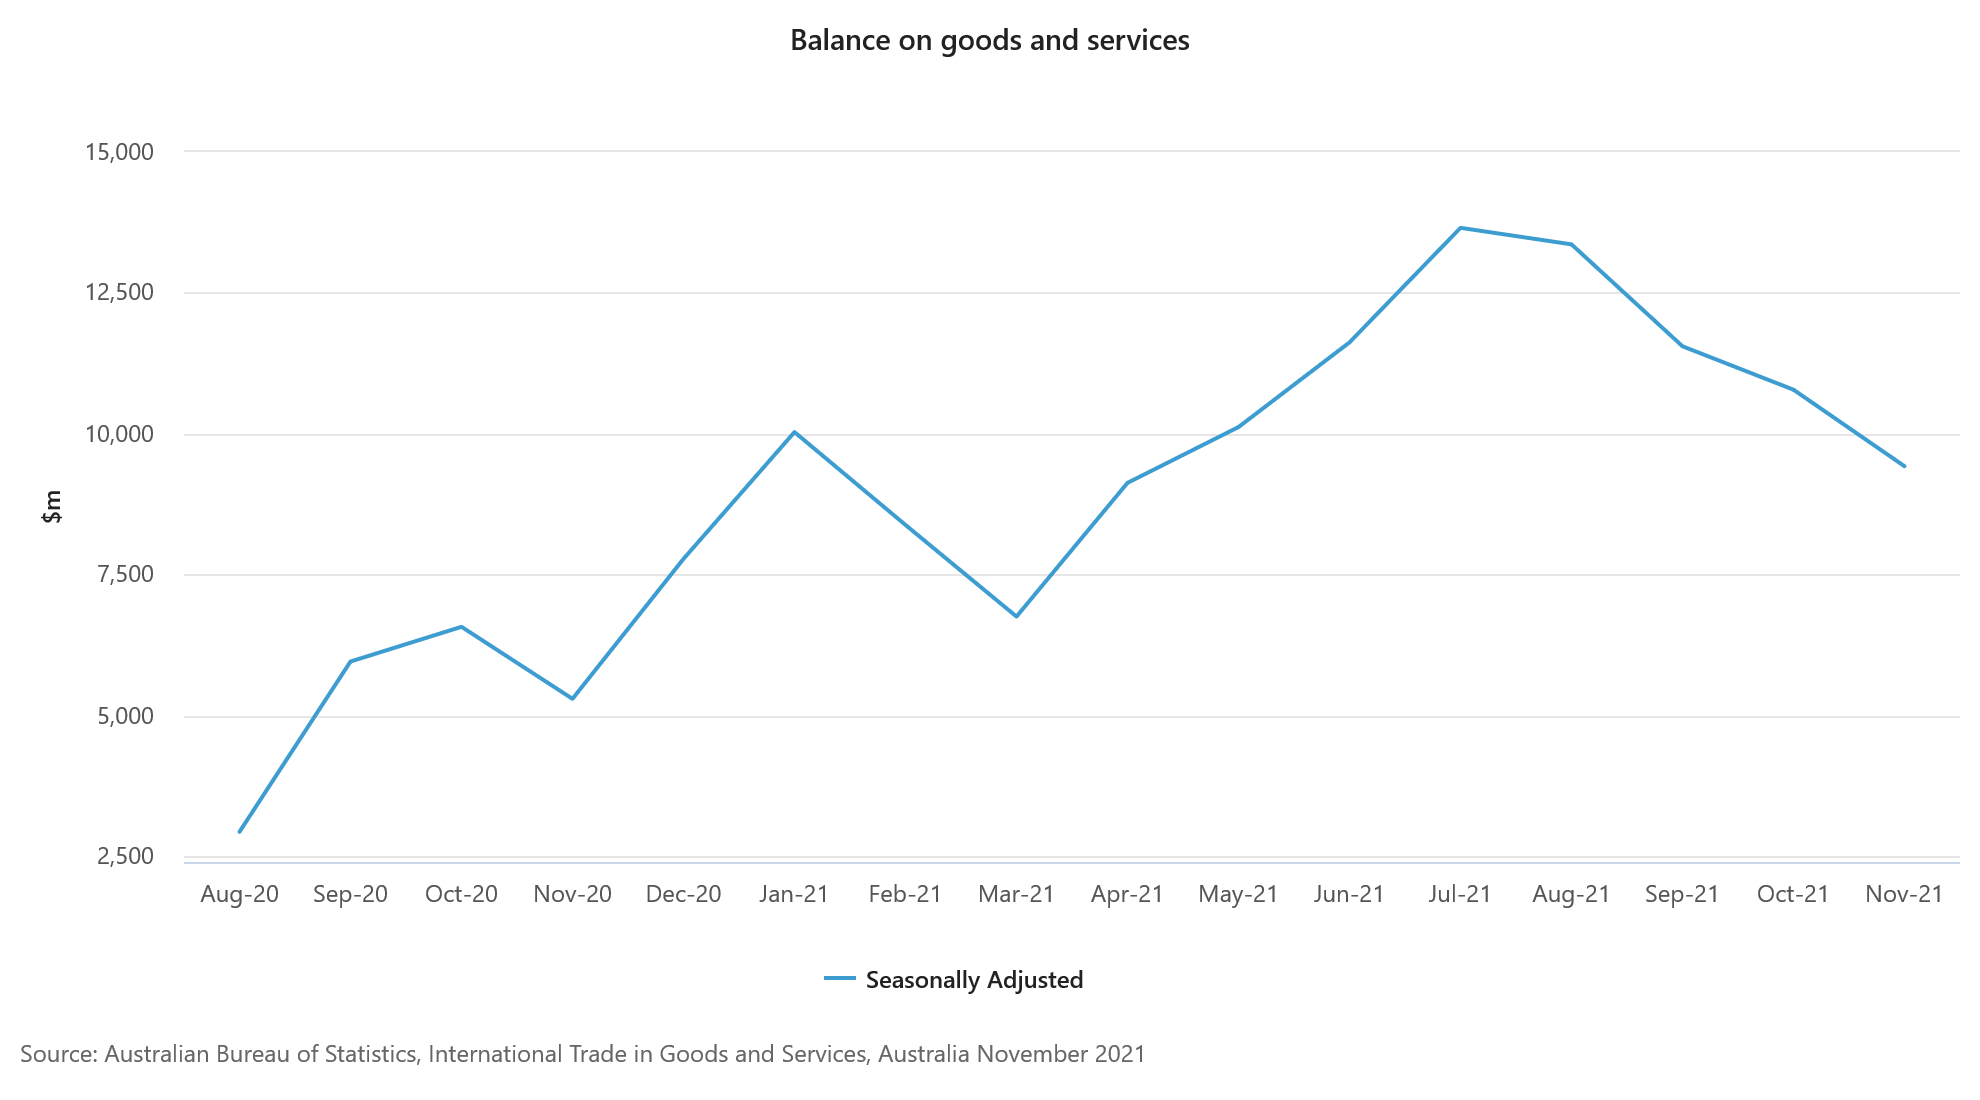
Australia exports rose 2% in Nov, imports rose 6%
Australia goods and services exports rose 2.% mom or AUD 691m to AUD 43.86B in November. Goods and services imports rose 6% mom or AUD 2049m to AUD 34.44B. Trade surplus came in at 9.42B, below expectation of AUD 10.75B.
Fed Powell committed to prevent higher inflation from becoming entrenched
In the prepared remarks for the nomination hearing before Senate Banking Committee, Fed Chair Jerome Powell said, "today the economy is expanding at its fastest pace in many years, and the labor market is strong."
After the initial shutdown and the subsequent reopening, "the economy has rapidly gained strength despite the ongoing pandemic, giving rise to persistent supply and demand imbalances and bottlenecks, and thus to elevated inflation."
"We are strongly committed to achieving our statutory goals of maximum employment and price stability," Powell said. "We will use our tools to support the economy and a strong labor market and to prevent higher inflation from becoming entrenched."
Looking ahead
Fed Chair Jerome Powell's testimony is the main focus for today. Italy will release retail sales while US will release NFIB business optimism index.
USD/CHF Daily Outlook
Daily Pivots: (S1) 0.9214; (P) 0.9244; (R1) 0.9303; More....
Intraday bias in USD/CHF remains on the upside for 0.9293 resistance first. As noted before, with 0.9084 support intact, choppy rise from 0.8925 could still extend higher. Break of 0.9293 should target 0.9372 resistance and above. On the downside, break of 0.9199 minor support will turn intraday bias neutral first.
In the bigger picture, the corrective structure of the rebound from 0.8925 argues that fall from 0.9471 is not complete yet. It could either be the second leg of pattern from 0.8756 (2021 low), or resuming larger down trend from 1.0237 (2018 high). We'd pay attention to the downside momentum and assess the odds later. But for now, medium term outlook will be neutral at best as long as 0.9471 resistance holds.
Economic Indicators Update
| GMT | Ccy | Events | Actual | Forecast | Previous | Revised |
|---|---|---|---|---|---|---|
| 00:01 | GBP | BRC Like-For-Like Retail Sales Y/Y Dec | 0.60% | 1.80% | ||
| 00:30 | AUD | Retail Sales M/M Nov | 7.30% | 4.00% | 4.90% | |
| 00:30 | AUD | Trade Balance (AUD) Nov | 9.42B | 10.75B | 11.22B | 10.78B |
| 05:00 | JPY | Leading Economic Index Nov P | 102.90% | 101.50% | ||
| 09:00 | EUR | Italy Retail Sales M/M Nov | 0.60% | 0.10% | ||
| 11:00 | USD | NFIB Business Optimism Index Dec | 98.6 | 98.4 |
NASDAQ staged strong rebound after initial dive
NASDAQ initially dived sharply to as low as 14530.22 overnight, but staged a strong rebound to close up 0.05% at 14942.82. Technically, we're seeing NASDAQ as in correction to the move from 10822.57 to 16212.22. It's envisaged as a range pattern that could last for a while.
Nevertheless, 14100/14200 zone should provide enough support to floor any decline attempt. We're talking about a cluster of support levels there, including 14175.11 resistance turned support, 14181.69 support, and 38.2% retracement of 10822.57 to 16212.22 at 14153.37.
However, it should be noted that a firm break of 14181.69 structural level, which is unlikely, would indicate that NASDAQ could be in a larger scale correction.
Australia exports rose 2% in Nov, imports rose 6%
Australia goods and services exports rose 2% mom or AUD 691m to AUD 43.86B in November. Goods and services imports rose 6% mom or AUD 2049m to AUD 34.44B. Trade surplus came in at 9.42B, below expectation of AUD 10.75B.
Australia retail sales rose 7.3% mom in Nov as restrictions eased
Australia retail sales rose 7.3% mom in November, well above expectation of 4.0% mom. That's also the fourth strongest monthly rise on record. Total turnover at current prices hit a record AUD 33.4B.
"Further easing of COVID-19 restrictions in the South-Eastern states and territories has seen the retail industry recover all lost momentum caused by the Delta outbreak," Ben James, Director of Quarterly Economy Wide Statistics, said. "Victoria recorded the largest state rise, up 20.0 per cent, reaching its highest level of the series. This follows the state's lockdown ending in late October."
"Continued easing of COVID-19 restrictions, including less strict density and capacity limits, in New South Wales (5.1 per cent) and the Australian Capital Territory (19.2 per cent) led to rises in turnover to record levels."
Fed Powell committed to prevent higher inflation from becoming entrenched
In the prepared remarks for the nomination hearing before Senate Banking Committee, Fed Chair Jerome Powell said, "today the economy is expanding at its fastest pace in many years, and the labor market is strong."
After the initial shutdown and the subsequent reopening, "the economy has rapidly gained strength despite the ongoing pandemic, giving rise to persistent supply and demand imbalances and bottlenecks, and thus to elevated inflation."
"We are strongly committed to achieving our statutory goals of maximum employment and price stability," Powell said. "We will use our tools to support the economy and a strong labor market and to prevent higher inflation from becoming entrenched."
Technical Outlook and Review
DXY:
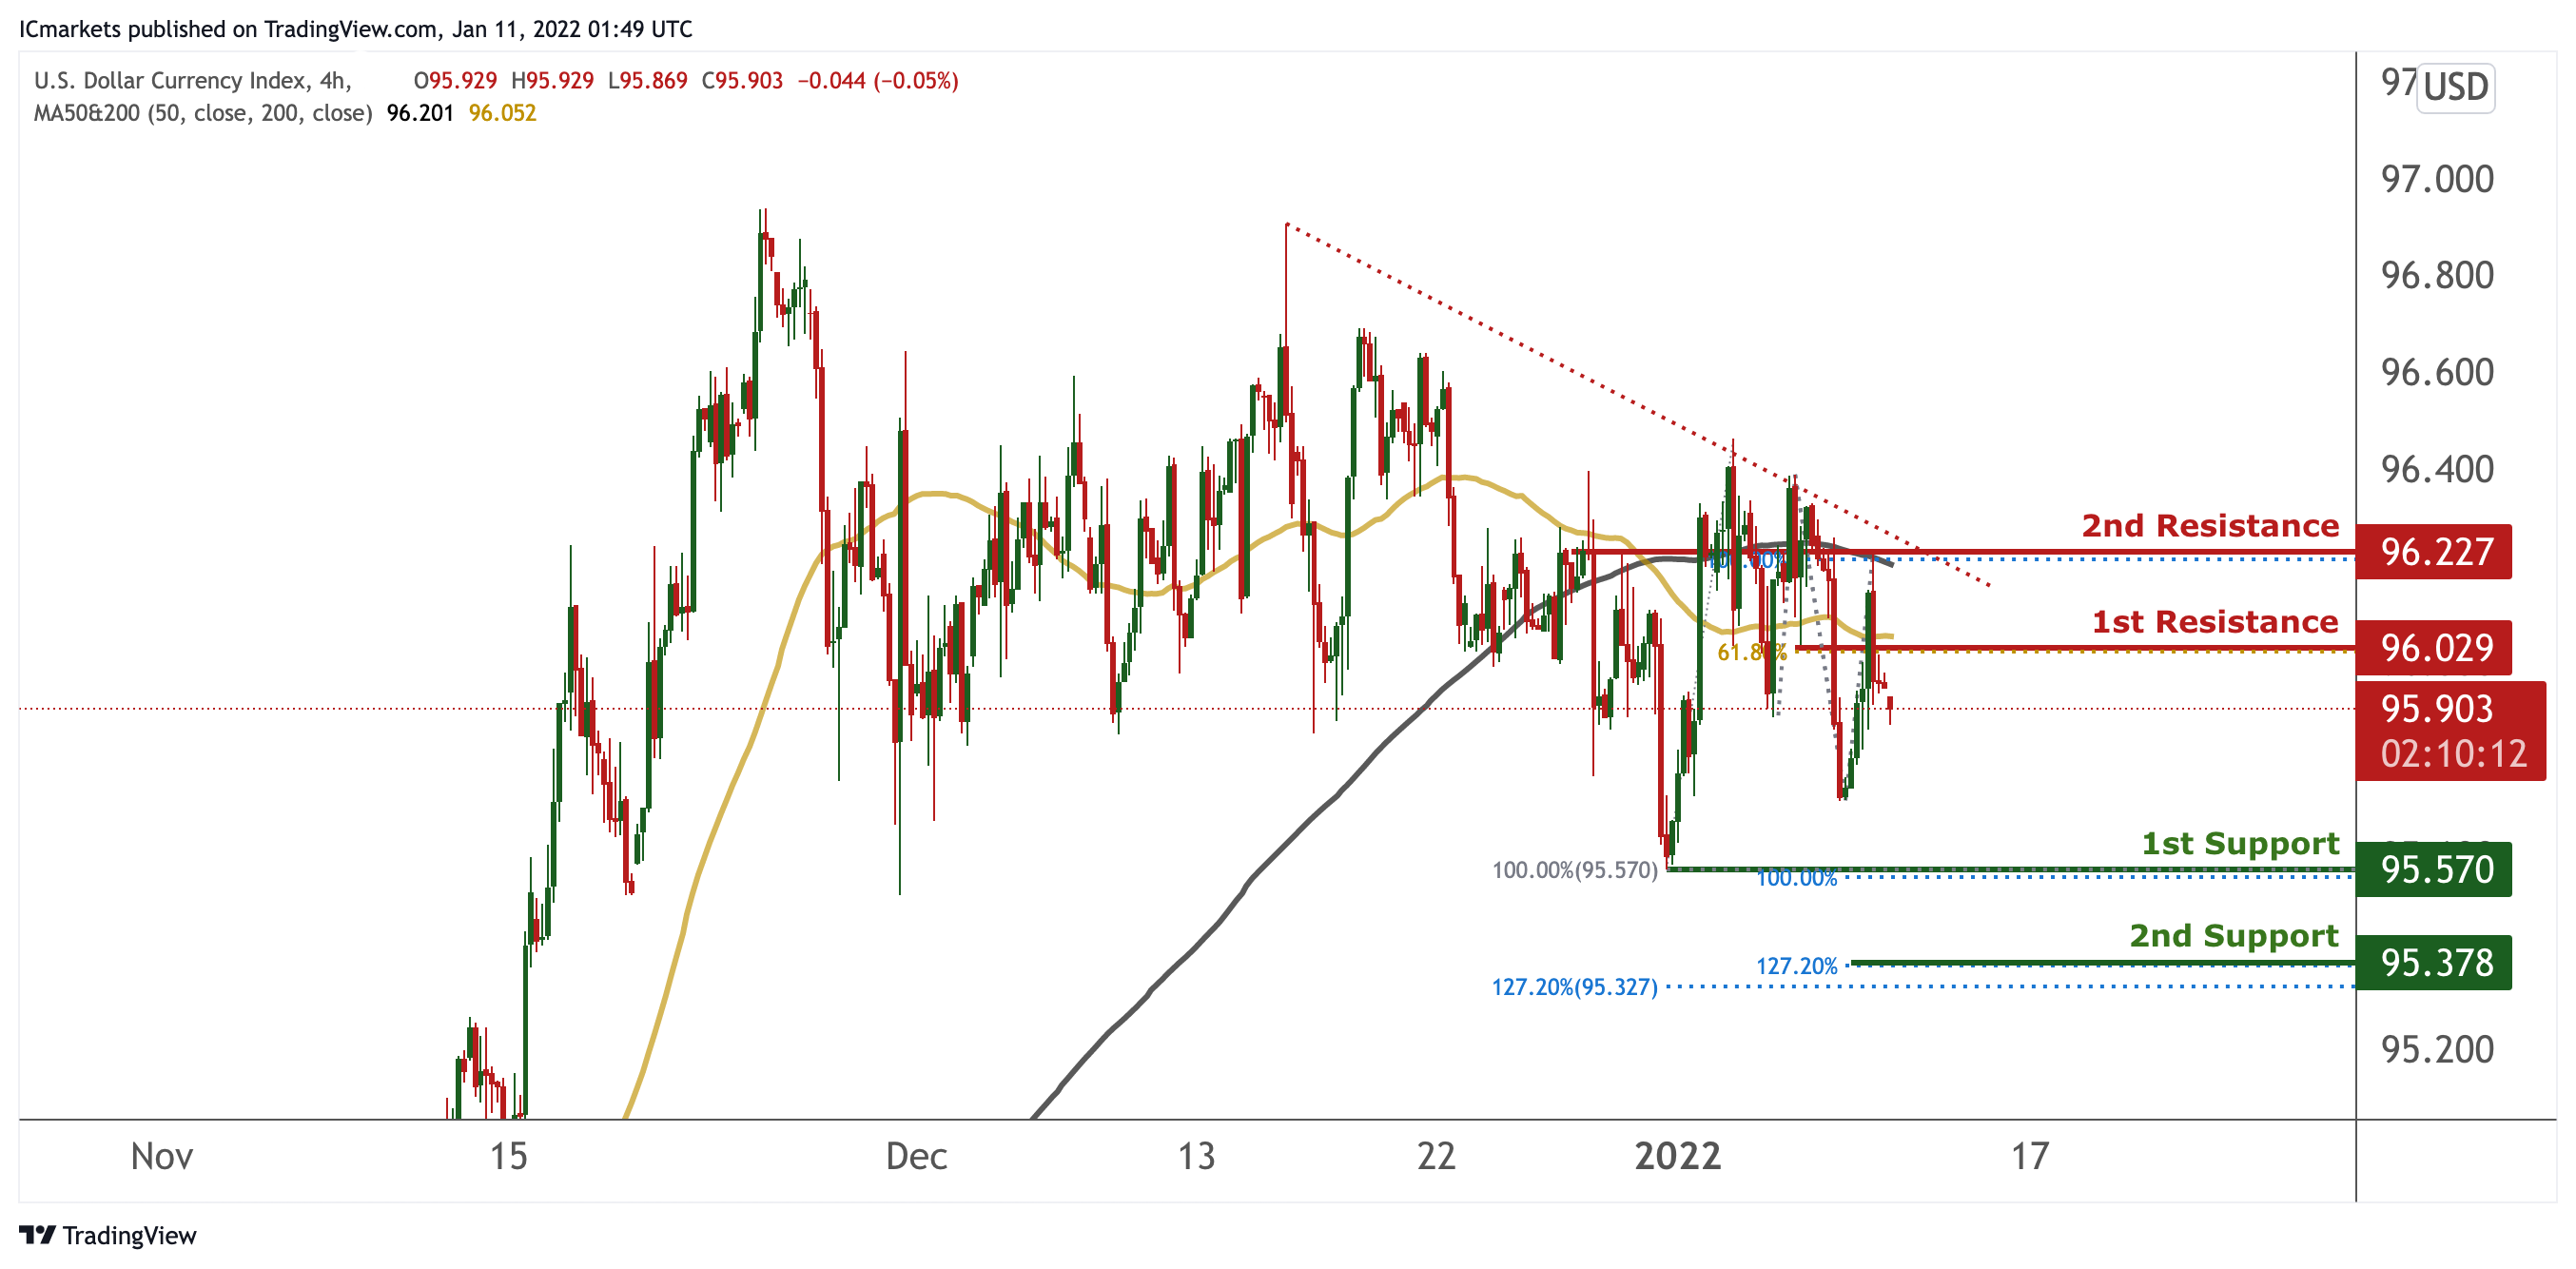
On the H4 timeframe, prices are on bearish momentum and abiding to our bearish trendline. We would expect further bearish continuation from our 1st resistance at 96.029 in line with 61.8% Fibonacci extension towards our 1st support at 95.570 in line with 100% Fibonacci extension and 100% Fibonacci retracement. Our bearish bias is further supported by MA 50 and 200 forming a death cross.
Areas of consideration:
- H4 time frame, 1st resistance at 96.029
- H4 time frame, 1st support at 95.570
XAU/USD (GOLD):
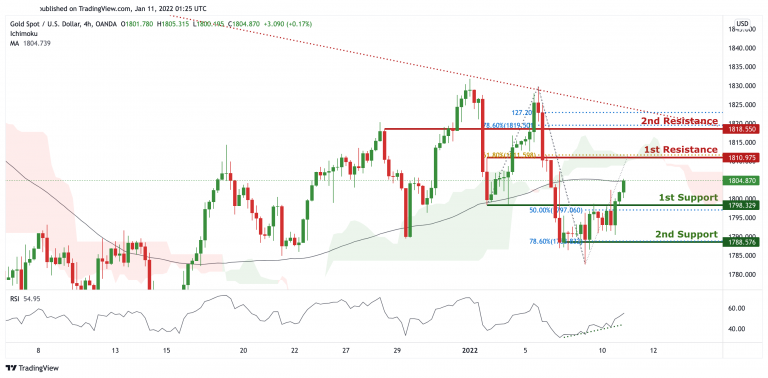
On the H4 chart, prices are consolidating sideways and hovering in between our 1st support and 1st resistance. We see the potential for further bullish movement towards our 1st resistance at 1810.975 in line with 61.8% Fibonacci extension. RSI is also portraying bullish momentum and prices are surpassing our MA, further supporting our hypothesis. Alternatively, breaking our 1st support will find prices dipping towards our 2nd support at 1788.576 in line with 78.6% Fibonacci retracement.
Areas of consideration:
- H4 1st support at 1798.329
- H4 1st resistance at 1810.945
GBP/USD
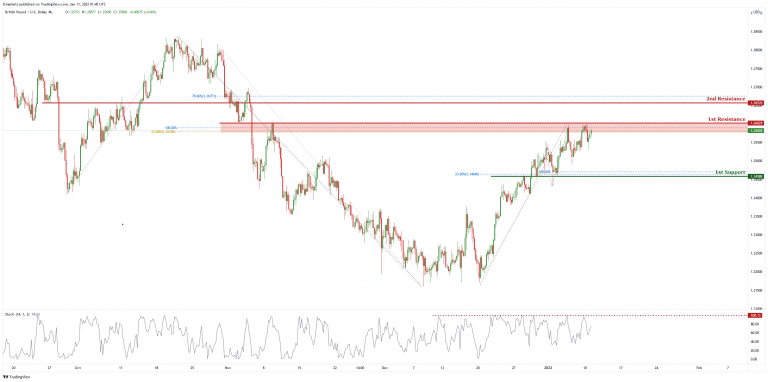
On the H4 chart, price is at the first resistance level of 1.36029 which is also 100% Fibonacci projection and 61.8% Fibonacci retracement. Price can potentially dip to the 1st support level of 1.34588 which is also 23.6% Fibonacci retracement and 100% Fibonacci projection. Our bearish bias is supported by the stochastic indicator as it is near resistance level.
Areas of consideration:
- H4 1st resistance at 1.36029
- H4 1st support 1.34588
USD/CHF
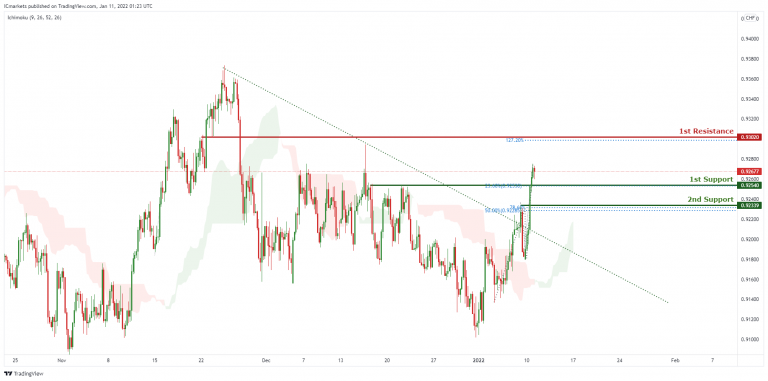
On the H4 timeframe, price recently broke out of the descending trendline resistance, signifying an overall bullish momentum. We can expect price to bounce from the 1st Support level in line with 23.6% Fibonacci retracement towards the 1st Resistance in line with 127.2% Fibonacci projection. Our bullish bias is further supported by the Ichimoku cloud indicator where the price is holding above it.
Areas of consideration:
- Watch 1st Support at 0.92540
- Watch 1st Resistance at 0.93020
EUR/USD :
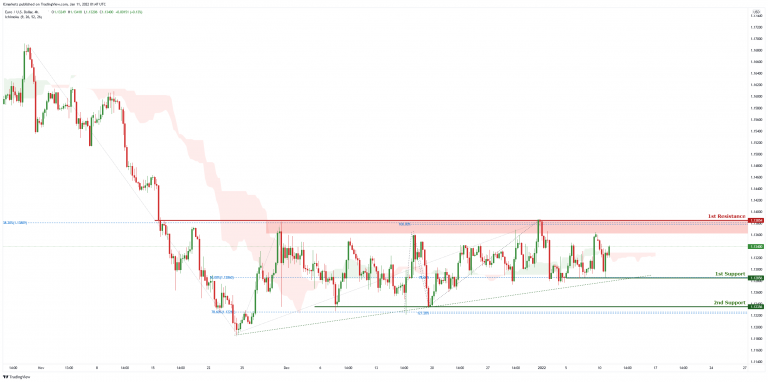
On the H4 chart, price is abiding by an ascending trendline and is heading to the 1st resistance level of 1.13854 which is also 100% Fibonacci projection and 38.2% Fibonacci retracement. Price can potentially dip to the 1st support level of 1.12783 which is also 50% Fibonacci retracement and 78.6% Fibonacci projection. Our bearish bias is supported by the ichimoku cloud indicator
Areas of consideration :
- H4 1st support at 1.12783
- H4 1st resistance at 1.13854
USD/JPY:
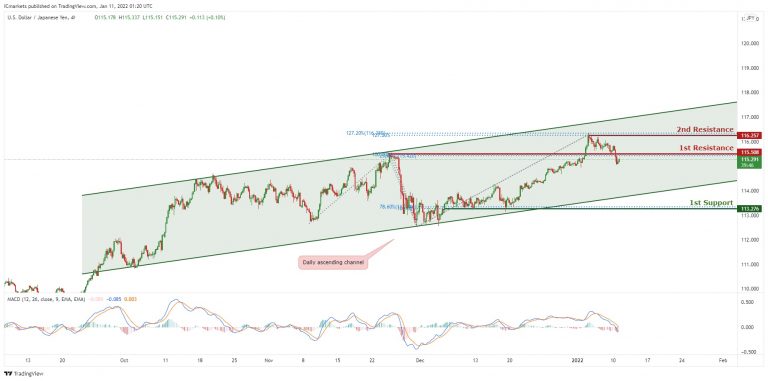
In reference to yesterday’s analysis, price is moving down nicely towards the 1st Support. On the H4 timeframe, is abiding to the ascending channel on the daily, signifying an overall bullish momentum. However, we can expect price to make a short-term bearish drop from 1st Resistance in line with 100% Fibonacci projection and 23.6% Fibonacci Retracement towards 1st Support in line with 78.6% Fibonacci retracement. Our short-term bearish bias is further supported by the MACD indicator where the signal line is above the MACD line.
Areas of consideration:
- H4 1st resistance level 115.508
- H4 1st support level 113.276
AUD/USD:
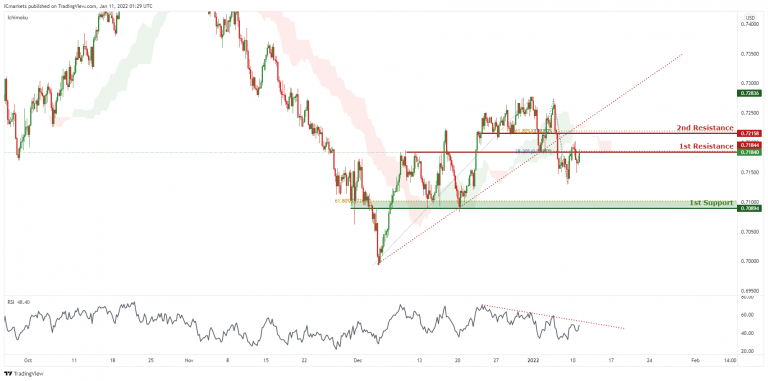
On the H4, price broke out of the ascending trendline support, signifying a bearish momentum. We can expect price to drop from 1st Resistance in line with 38.2% Fibonacci retracement and 61.8% Fibonacci projection towards 1st Support in line with 61.8% Fibonacci retracement. Our bearish bias is further supported by the price holding below the Ichimoku cloud and RSI indicator where it is abiding to the descending trendline resistance.
Areas of consideration:
- H4 1st Support level 0.70894
- H4 1st resistance level 0.71844
NZD/USD:
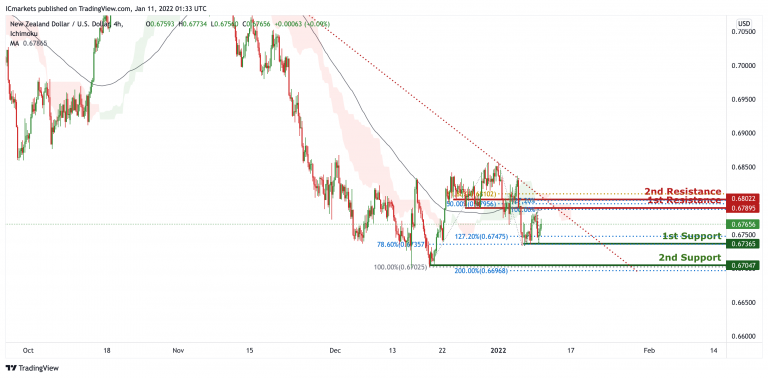
On the H4 timeframe, prices are on bearish momentum and abiding to our bearish trendline. We see potential for prices to dip further from our 1st resistance at 0.67895 in line with 100% Fibonacci extension and 50% Fibonacci retracement towards our 1st support at 0.67365 in line with 78.6% Fibonacci retracements and 127.2% Fibonacci extension. Our bias is further supported by ichimoku clouds forecasting the dip and also prices trading below our MA. If prices break our 1st support, prices can potentially dip towards our 2nd support at 0.67047 in line with 200% Fibonacci projection and 100% Fibonacci retracement.
Areas of consideration:
- H4 time frame, 1st resistance at 0.67895
- H4 time frame, 1st support at 0.67365
USD/CAD:
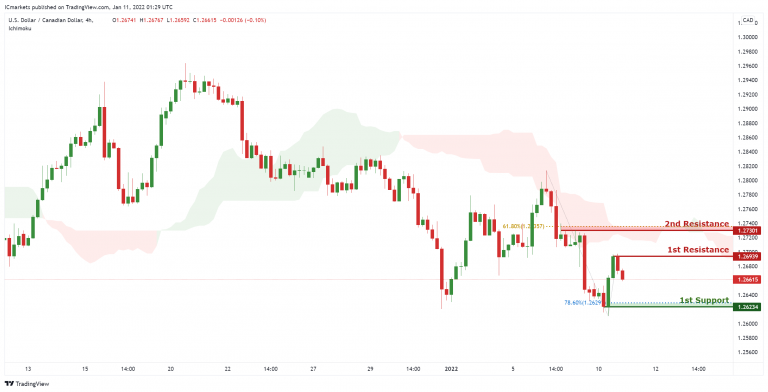
On the H4, with price moving below the ichimoku cloud, we have a bearish bias that price will drop from our 1st resistance at 1.26939 which is in line with horizontal swing high resistance to 1st support at 1.26234, which is in line with horizontal swing low support and 78.6% fibonacci retracement. Alternatively, price may break 1st resistance structure and head for 2nd resistance at 1.27301, which coincides with horizontal swing high resistance and 61.8% Fibonacci retracement.
Areas of consideration:
- H4 time frame, 1st support at 1.26234
- H4 time frame, 1st resistance at 1.26939
OIL:
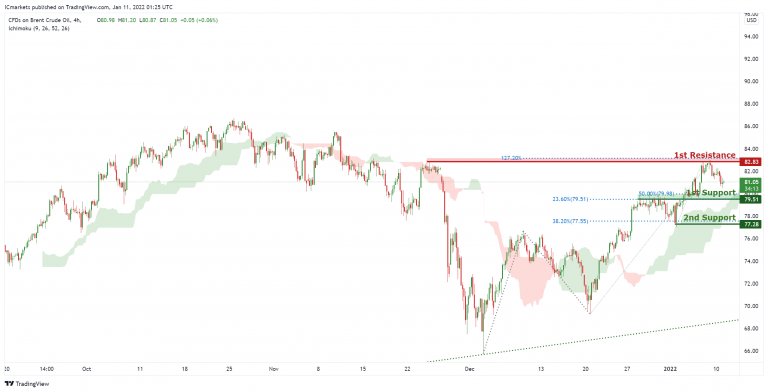
On the H4, with price moving above the ichimoku cloud, we have a bullish bias that price will rise to our 1st resistance at 82.83 which is in line with horizontal swing high resistance and 127.2% Fibonacci extension from 1st support at 79.51, which is in line with horizontal overlap support and 23.6% and 50% Fibonacci retracement level. Alternatively, price may break 1st support structure and head for 2nd support at 77.28, which coincides with horizontal overlap support and 61.8% Fibonacci retracement level .
Areas of consideration:
- H4 time frame, 1st resistance of 82.83
- H4 time frame, 1st support of 79.51
Dow Jones Industrial Average:
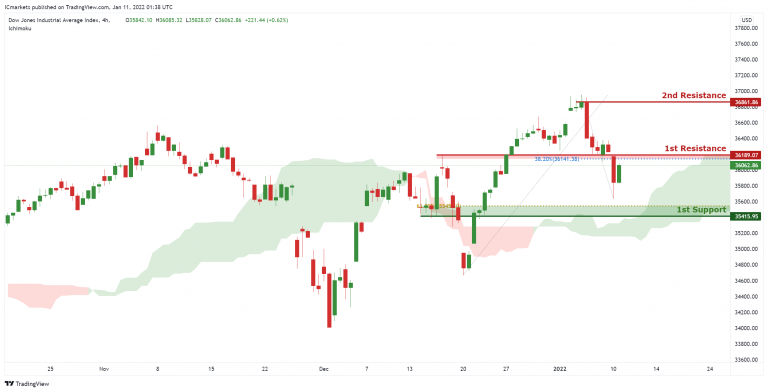
On the H4, with price moving below the ichimoku cloud, we have a bearish bias that price will drop from our 1st resistance at 36189 which is in line with horizontal swing overlap resistance to 1st support at 35415, which is in line with horizontal overlap support and 61.8% fibonacci retracement. Alternatively, price may break 1st resistance structure and head for 2nd resistance at 36861, which coincides with horizontal swing high resistance.
Areas of consideration:
- H4 time frame, 1st resistance of 36189
- H4 time frame, 1st support of 35415
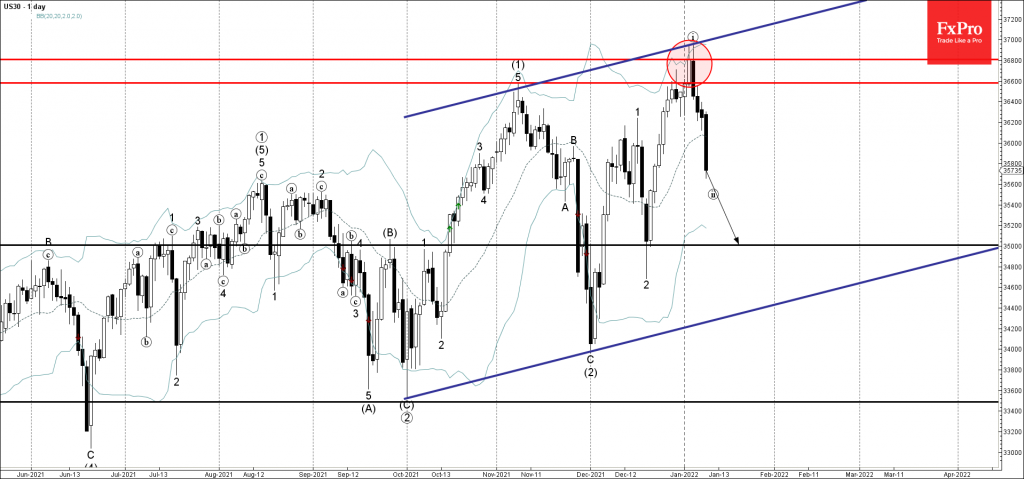
Dow Jones Wave Analysis
- Dow Jones reversed from resistance level 36800.00
- Likely to fall to support level 35000.00
Dow Jones index recently reversed down with the daily bearish Engulfing from the resistance level 36800.00, intersecting with the upper daily Bollinger Band and the weekly up channel from September.
The downward reversal from the resistance level 36800.00 started the active short-term corrective wave (ii).
Dow Jones index can be expected to fall further toward the next key support level 35000.00 (which reversed the price in December).
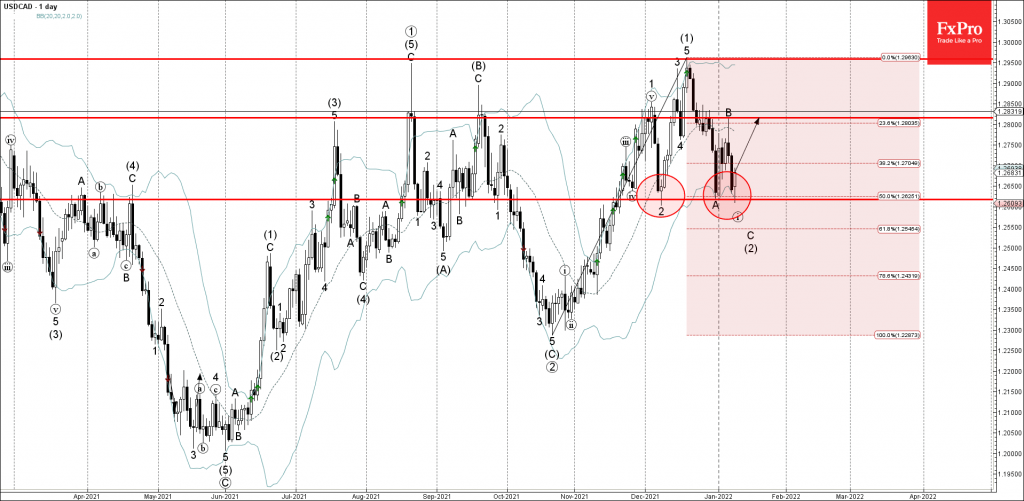
USDCAD Wave Analysis
- USDCAD reversed from support level 1.2615
- Likely to rise to resistance level 1.2800
USDCAD currency pair recently reversed up from the key support level 1.2615 (which has been reversing the price from the start of December), intersecting with the lower daily Bollinger Band and the 50% Fibonacci correction of the upward impulse (1) from October.
The upward reversal from the support level 1.2615 stopped the earlier short-term impulse waves C.
Given the rising US dollar bullishness seen today – USDCAD currency pair can be expected to rise further toward the next resistance level 1.2800 (top of the previous wave B).