Sample Category Title
Fed Hawks Take the Lead
Yesterday has been a deep red day for the US equities, as the FOMC minutes hinted at earlier and a faster rate normalization path, and the reduction of the Fed’s balance sheet soon after the first rate hike. The extra hawkish element hammered the sentiment sending the US yields higher and the equities lower. The better-than-expected ADP data certainly gave an extra support to the Fed hawks.
The ADP data revealed that the US economy added more 800K new private jobs in December, twice the 400K expected by analysts, and as strong as the figures we used to see at the heart of the post-pandemic recovery last year. But helas, the strong data added to the hawkish Fed expectations, as it reinforced the Fed’s view that the US economy is close to a full employment and it’s time to move on.
We are now stepping into a period where good data is bad as it fuels the Fed hawks, and bad data is bad, as well, because it can’t fuel the Fed doves.
The US 2-year yield spiked above the 0.85%, as the 10-year yield advanced past the 1.70%, yet there is room for a further hawkish pricing on both ends, hence risk assets should fasten their seatbelts as the hawkish Fed becomes the major catalyzer of broad market pricing.
Nasdaq fell more than 3%, the S&P 500 retreated near 2% and the Dow gave back slightly more than 1%. The selloff continued in the US equity futures overnight and the ranking of the biggest losers confirms that the price action is obviously dominated by the hawkish Fed expectations and the fear of earlier and steeper rate normalization.
The steep rise in the US yields hit the appetite in gold, and the broader market selloff couldn’t bring investors on board for safety, and Bitcoin broke the December support line to the downside and tanked to $42K mark, also breaking another important Fibonacci support, the major 61.8% level on July – November rally. Doing so has been a stronger technical confirmation of the actual bearish trend, where the downside correction could $35-37K band.
Due today, the US unemployment claims should print another number near the pandemic lows, while the ISM services index should show a certain slowdown in December due to the omicron wave, but again, bad news could hardly get the Fed’s tone softer, so the data better be good for an improved mood.
GBP/JPY Daily Outlook
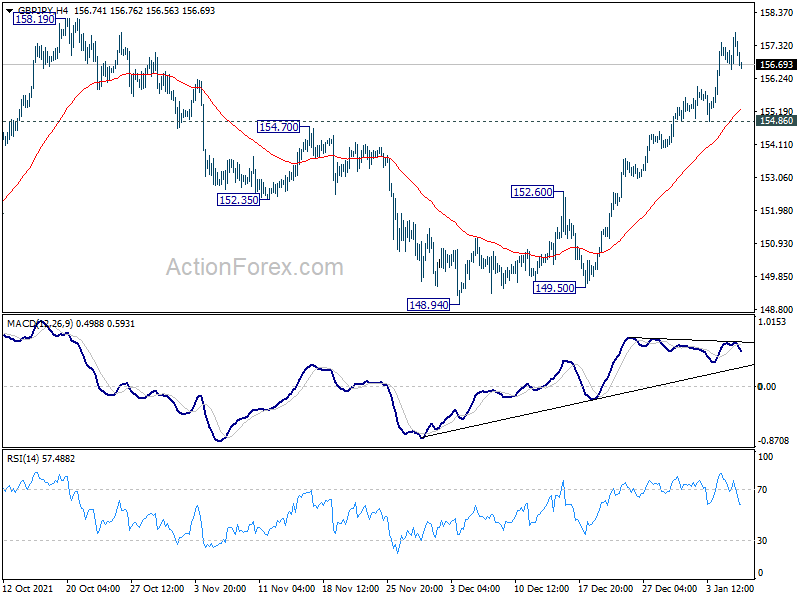
Daily Pivots: (S1) 156.73; (P) 157.25; (R1) 157.92; More...
GBP/JPY is losing some upside momentum but further rise is expected with 154.85 support holds. Further rally should be seen back to retest 158.19. Firm break there will resume larger up trend to 167.93 long term fibonacci level. On the downside, below 154.86 minor support will turn intraday bias back to the downside for deeper pull back.
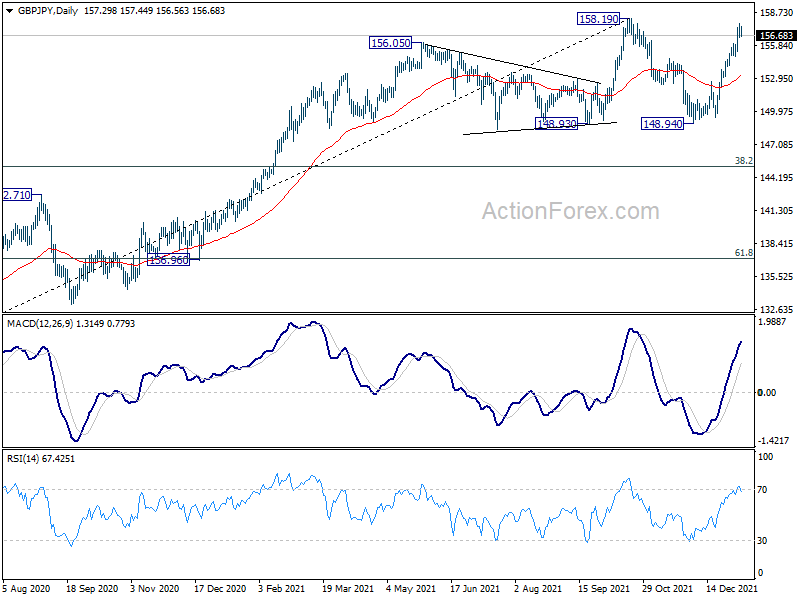
In the bigger picture, strong rebound from 148.93 key structural support will retain medium term bullishness. Firm break of 158.19 high will resume whole up trend from 123.94 (2020 low), to 61.8% retracement of 195.86 to 122.75 at 167.93. Nevertheless, firm break of 148.93 will bring deeper correction to 38.2% retracement of 123.94 to 158.19 at 145.10, and possibly further lower, as a correction to up trend from 123.94 at least
EUR/JPY Daily Outlook
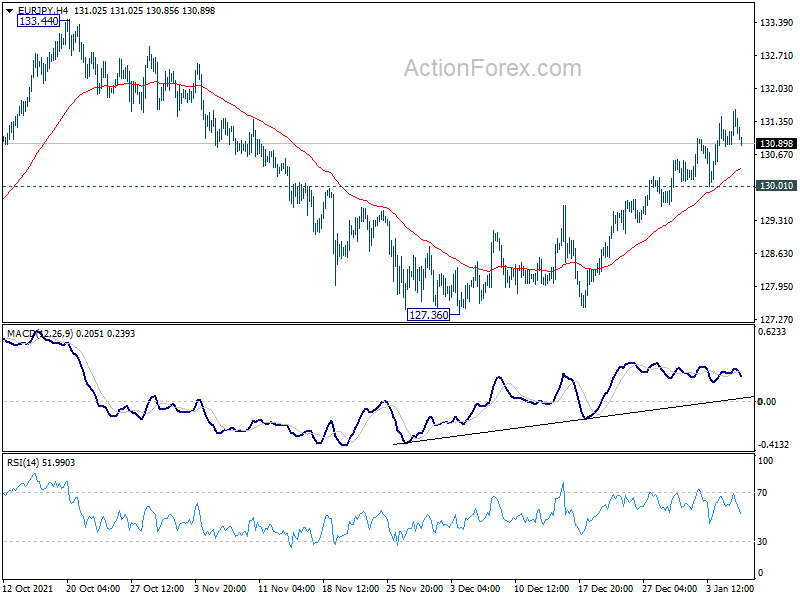
Daily Pivots: (S1) 130.94; (P) 131.27; (R1) 131.69; More....
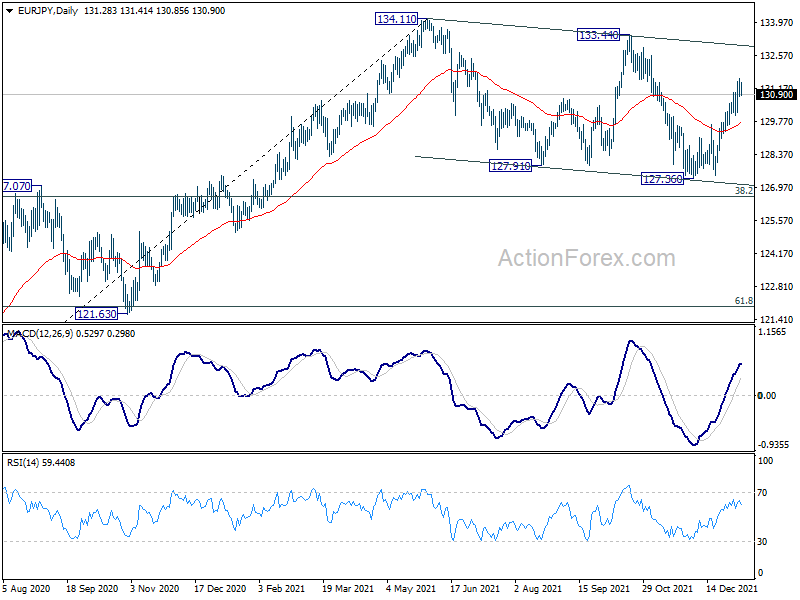
EUR/JPY is losing some upside momentum but further rally is expected as long as 130.01 minor support holds. As noted before, whole consolidation from 134.11 could have completed with three waves down to 127.36, ahead of 126.58 medium term fibonacci level. Further rally should be seen to target a test on 133.44/134.11 resistance zone. On the downside, break of 130.01 minor support will turn bias bias to the downside for retesting 127.36 low instead.
In the bigger picture, as long as 38.2% retracement of 114.42 (2020 low) to 134.11 at 126.58 holds, up trend from 114.42 is still in favor to continue. Break of 134.11 will target long term resistance at 137.49 (2018 high). However, sustained break of 126.58 will raise the chance of medium term bearish reversal. In this case, deeper decline would be seen to 61.8% retracement at 121.94, and possibly below.
EUR/GBP Daily Outlook
Daily Pivots: (S1) 0.8330; (P) 0.8351; (R1) 0.8368; More...
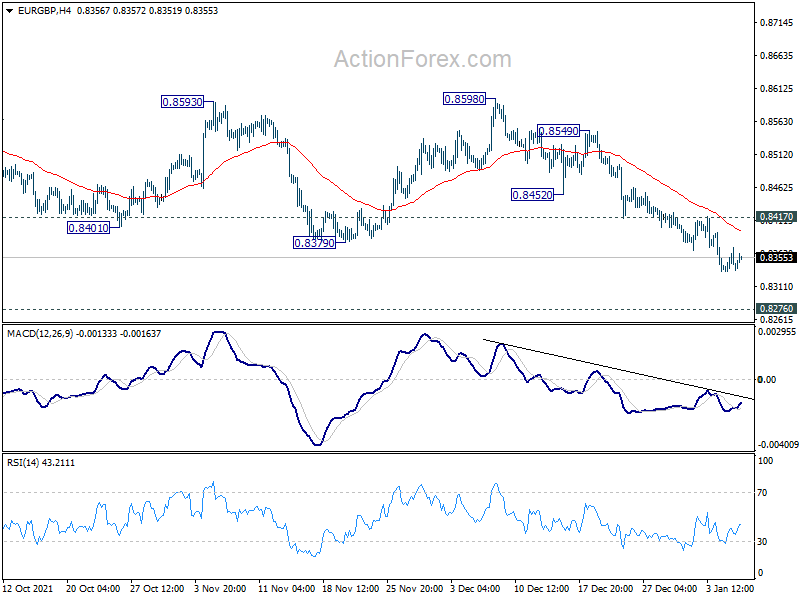
EUR/GBP is losing some downside momentum. But further decline is expected as long as 0.8417 resistance holds. Current fall is part of the larger down trend from 0.9499. Further decline would be seen to 0.8276 key long term support. On the upside, above 0.8417 minor resistance will turn bias back to the upside for stronger rebound.
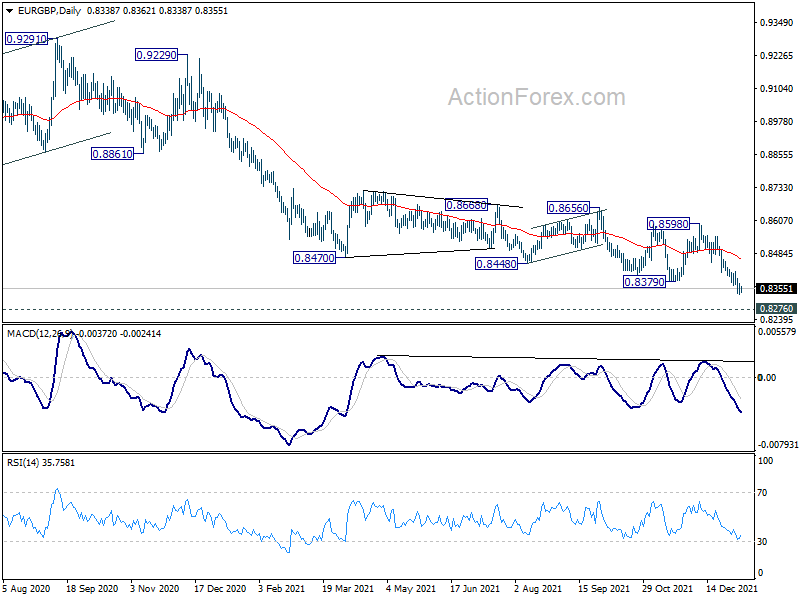
In the bigger picture, price actions from 0.9499 (2020 high) are still seen as developing into a corrective pattern. Deeper fall could be seen as long as 0.8598 resistance holds, towards long term support at 0.8276. We'd look for bottoming signal around there to bring reversal. Meanwhile, firm break of 0.8598 will now be an early sign of medium term bottoming and bring stronger rebound. However, sustained break of 0.8276 will argue that the long term trend has reversed.
EUR/AUD Daily Outlook
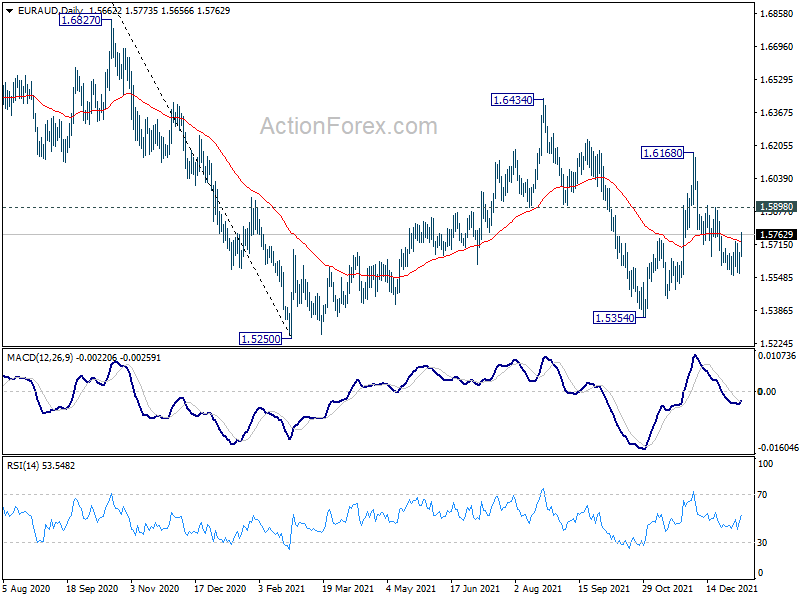
Daily Pivots: (S1) 1.5537; (P) 1.5629; (R1) 1.5680; More...
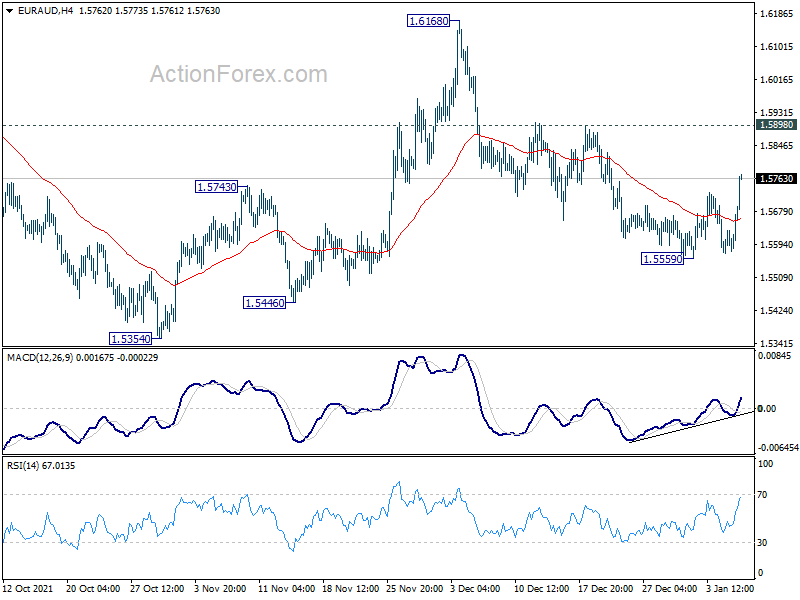
Intraday bias in EUR/AUD remains neutral first. Further fall is expected as long as 1.5898 resistance holds. On the downside, break of 1.5559 will resume the fall from 1.6168 to retest 1.5354 low. However, break of 1.5898 will turn bias back to the upside for 1.6168 resistance instead.
In the bigger picture, medium term outlook remains neutral for the moment. Rise from 1.5354 is seen as the third leg of the corrective pattern from 1.5250 low. Further rise cannot be ruled out, but even in that case, strong resistance should be seen at 38.2% retracement of 1.9799 to 1.5250 at 1.6988. Larger down trend from 1.9799 is in favor to extend through 1.5250 at a later stage.
EUR/CHF Daily Outlook
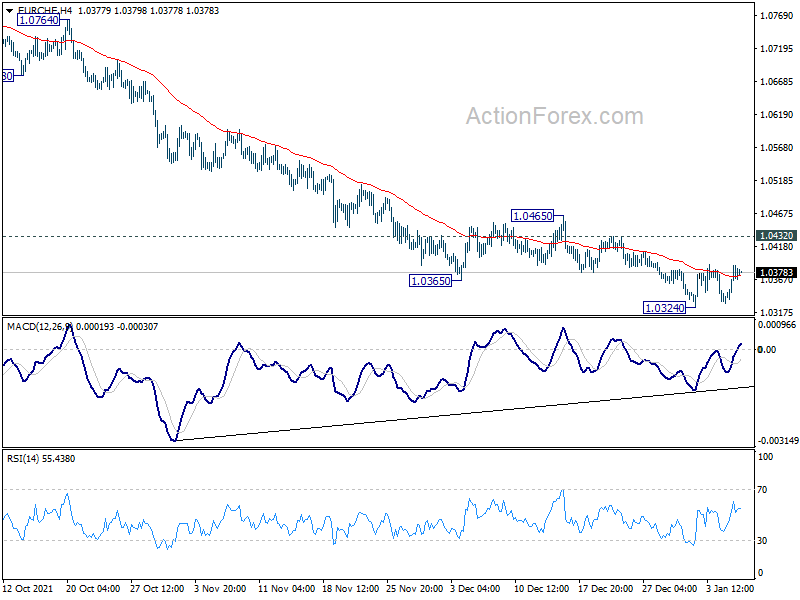
Daily Pivots: (S1) 1.0346; (P) 1.0368; (R1) 1.0400; More....
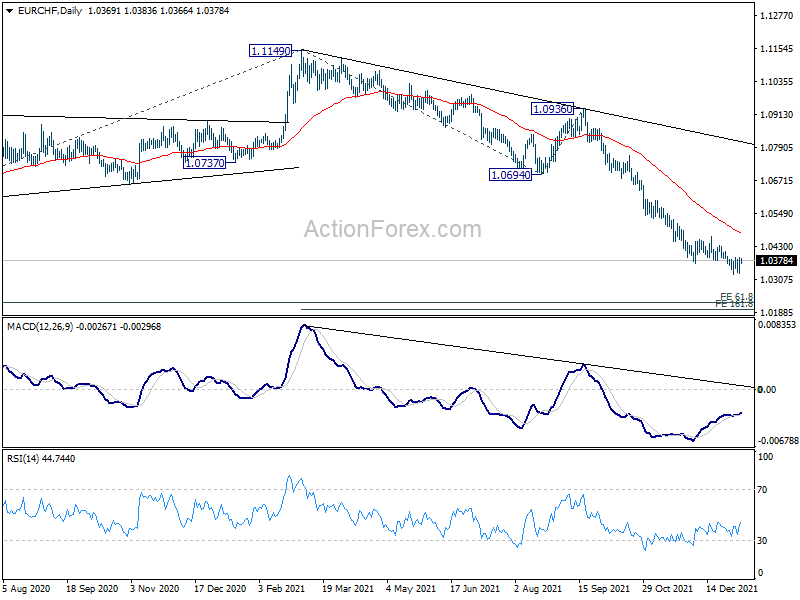
EUR/CHF is staying in consolidation from 1.0324 and intraday bias remains neutral first. Outlook stays bearish as long as 1.0432 resistance holds. Break of 1.0324 will resume larger down trend from 1.1149 to 161.8% projection of 1.1149 to 1.0694 from 1.0936 at 1.0200 next. On the upside, however, break of 1.0432 minor resistance will indicate short term bottoming, and turn bias back to the upside for 1.0465 resistance and above.
In the bigger picture, long term down trend from 1.2004 (2018 high) is now extending. Next target is 61.8% projection of 1.2004 to 1.0505 to 1.1149 at 1.0223. On the upside, break of 1.0505 support turned resistance is needed to be the first sign of medium term bottoming. Otherwise, outlook will remain bearish even in case of rebound.
EUR/USD Daily Outlook
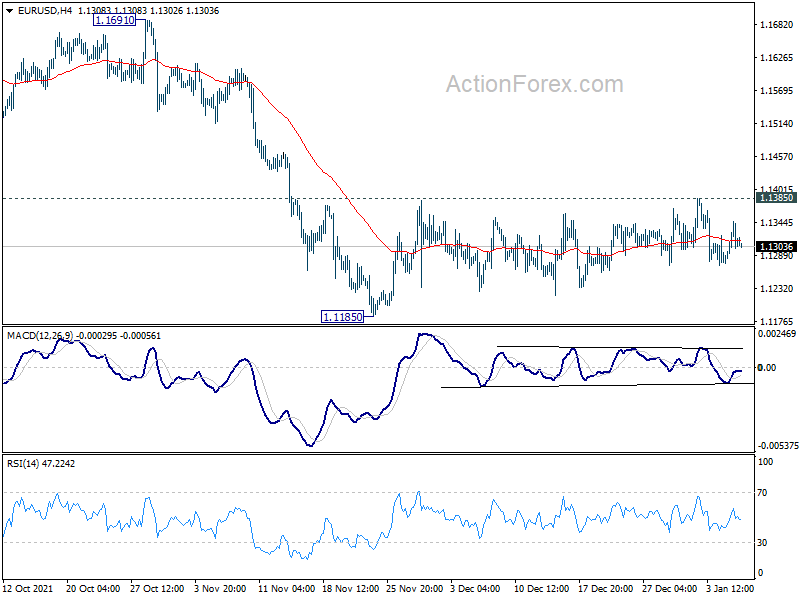
Daily Pivots: (S1) 1.1278; (P) 1.1312; (R1) 1.1348; More...
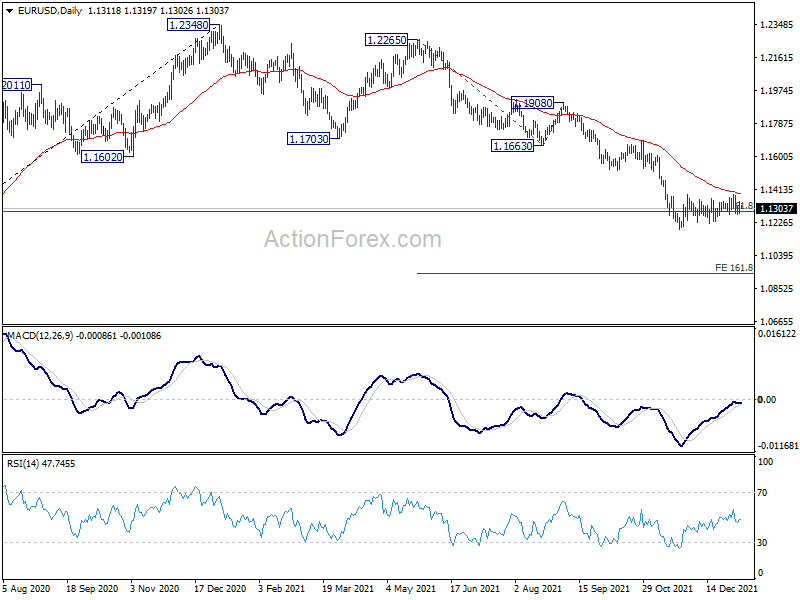
EUR/USD is still bounded in sideway range trading and intraday bias remains neutral. On the upside, firm break of 1.1385 resistance will resume the rebound from 1.1186. Sustained trading above 55 day EMA (now at 1.1392) will bring stronger rise back to 1.1663 support turned resistance. On the downside, break of 1.1185 will resume larger decline from 1.2348. Next target is 161.8% projection of 1.2265 to 1.1663 from 1.1908 at 1.0934.
In the bigger picture, there are various ways of interpreting the fall from 1.2348 (2021 high). It could be a correction to rise from 1.0635 (2020 low), the fourth leg of a sideway pattern from 1.0339 (2017 low), or resuming long term down trend. In any case, outlook will now stay bearish as long as 1.1703 support turned resistance holds. Sustained break of 61.8% retracement of 1.0635 to 1.2348 at 1.1289 would pave the way back to 1.0635.
USD/CHF Daily Outlook
Daily Pivots: (S1) 0.9149; (P) 0.9166; (R1) 0.9192; More....
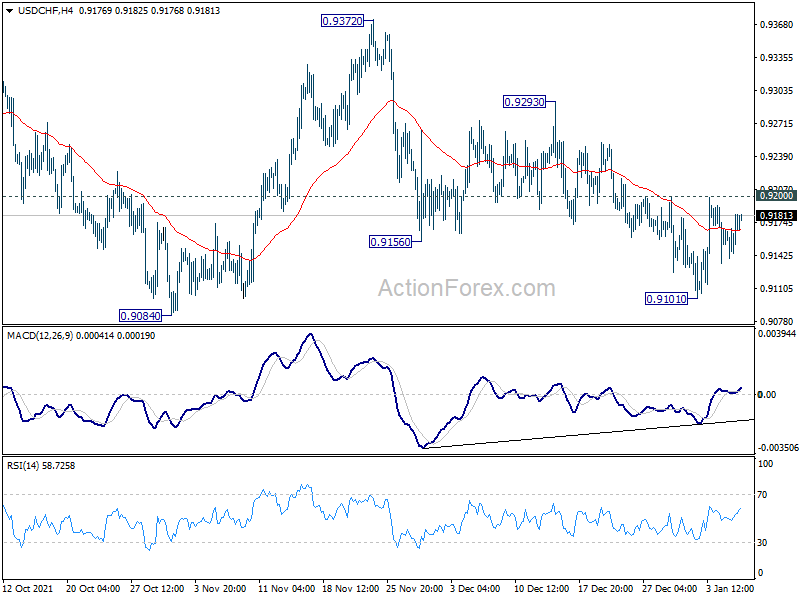
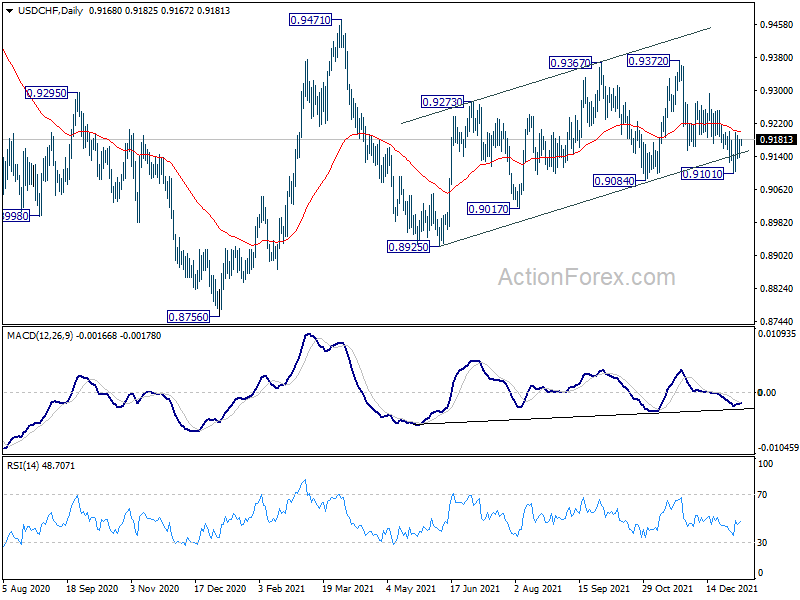
Outlook in USD/CHF is unchanged and intraday bias remains neutral first. On the upside, break of 0.9200 resistance will argue that fall from 0.9372 has completed with three waves down to 0.9101. Intraday bias will be back on the upside for 0.9372 resistance. On the downside, sustained break of 0.9084 support should confirm that choppy rise from 0.8925 has completed, and suggests that fall from 0.9471 is resuming. Deeper decline would be seen through 0.8925.
In the bigger picture, the corrective structure of the rebound from 0.8925 argues that fall from 0.9471 is not complete yet. It could either be the second leg of pattern from 0.8756 (2021 low), or resuming larger down trend from 1.0237 (2018 high). We'd pay attention to the downside momentum and assess the odds later. But for now, medium term outlook will be neutral at best as long as 0.9471 resistance holds.
GBP/USD Daily Outlook
Daily Pivots: (S1) 1.3520; (P) 1.3559; (R1) 1.3596; More...
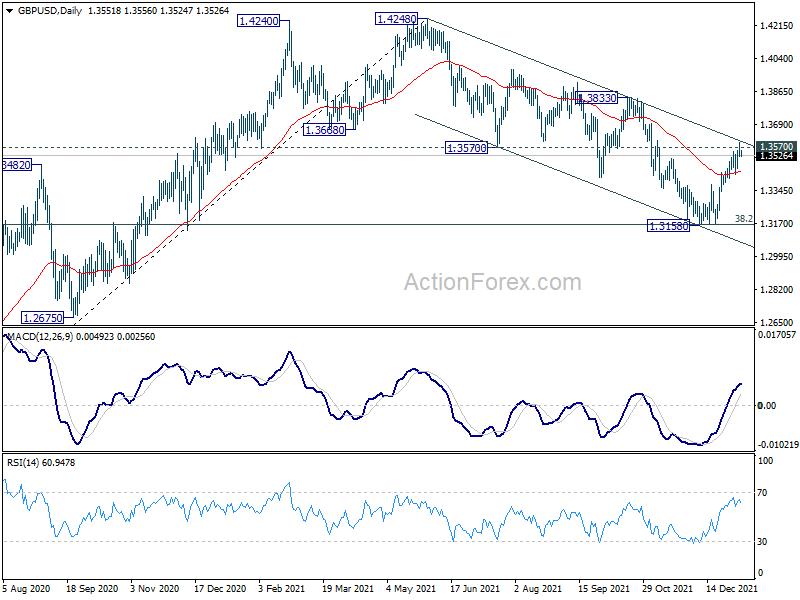
GBP/USD lost some upside momentum after breaching 1.3570 support turned resistance and intraday bias is turned neutral first. Further rally is still expected as long as 1.3430 support holds. We're seeing corrective fall from 1.4248 as complete with three waves down to 1.3158, after hitting 1.3164 medium term fibonacci level. . Sustained break of 1.3570 resistance will further affirm this bullish case and target 1.3833 resistance next. However, break of 1.3375 will turn bias back to the downside for 1.3158 low again.
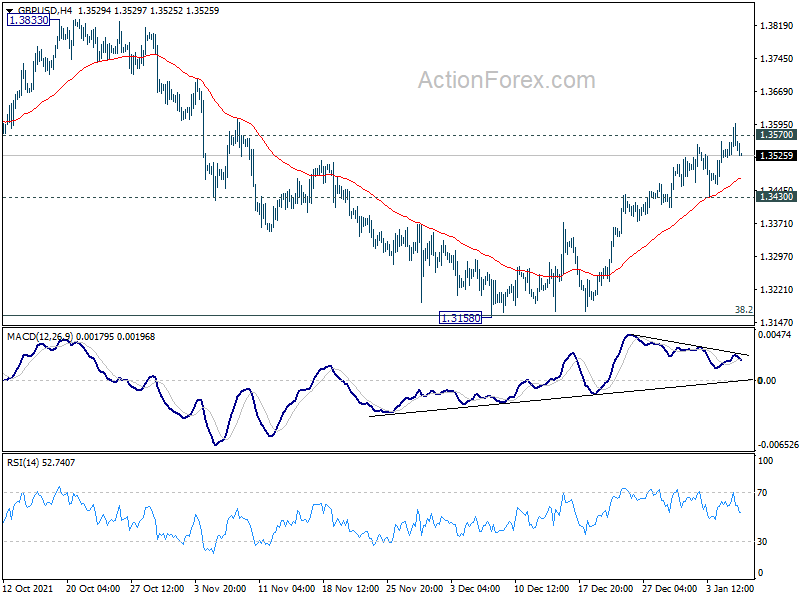
In the bigger picture, focus remains on 38.2% retracement of 1.1409 to 1.4248 at 1.3164. Sustained break there will argue that whole rise from 1.1409 has completed at 1.4248, after rejection by 1.4376 long term resistance. That will revive some medium term bearishness and and target 61.8% retracement at 1.2493. However, strong rebound from current level will revive argue that up trend from 1.1409 is still in progress, and probably ready to resume.
USD/JPY Daily Outlook
Daily Pivots: (S1) 115.74; (P) 115.99; (R1) 116.36; More...
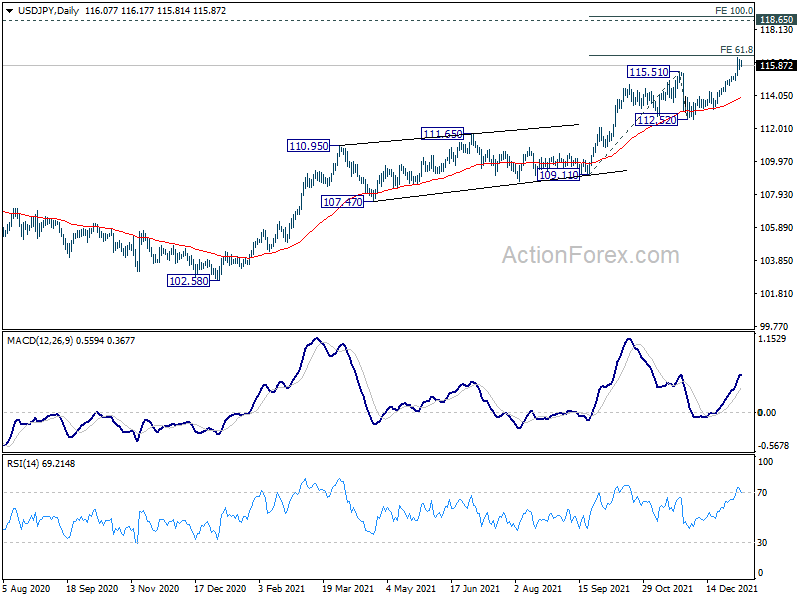
Intraday bias in USD/JPY remains neutral for consolidation below 116.34 temporary top. Some consolidations could be seen but downside should be contained well above 114.26 support turned resistance to bring another rally. On the upside, sustained break of 61.8% projection of 109.11 to 115.51 from 112.52 at 116.47 will pave the way to 100% projection at 118.90, which is close to 118.65 long term resistance.
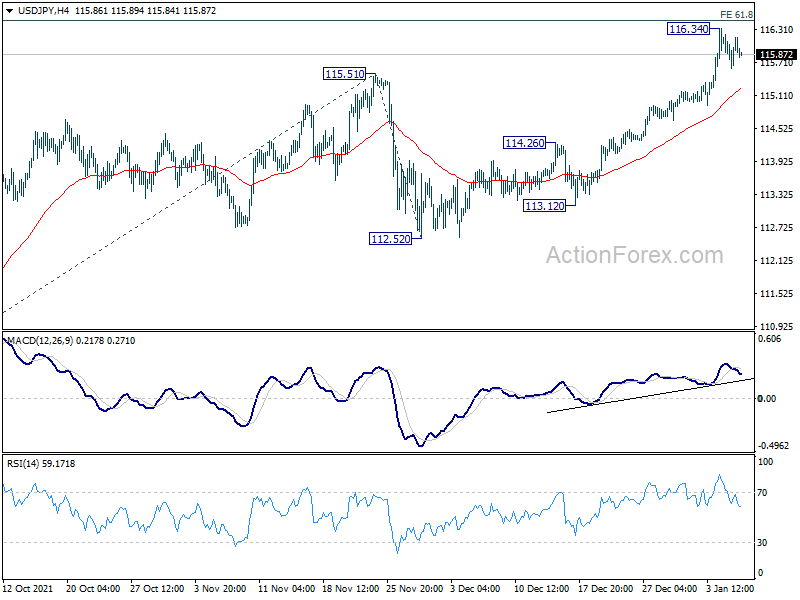
In the bigger picture, no change in the view that rise from 102.58 is the third leg of the up trend from 101.18 (2020 low). Such rally should target a test on 118.65 (2016 high). Sustained break there will pave the way to 120.85 (2015 high) and raise the chance of long term up trend resumption. For now, this will remain the favored case as long as 112.52 support holds, in case of deep pull back.