

Sample Category Title
EUR/USD Remains Sideways: Elliott Wave Analysis
Markets can remain slow, especially today when some countries still have a day off. Stocks are higher, and it looks like a nice risk-on move but there is a threat for a potential pullback as coronavirus seems to be spreading really fast.
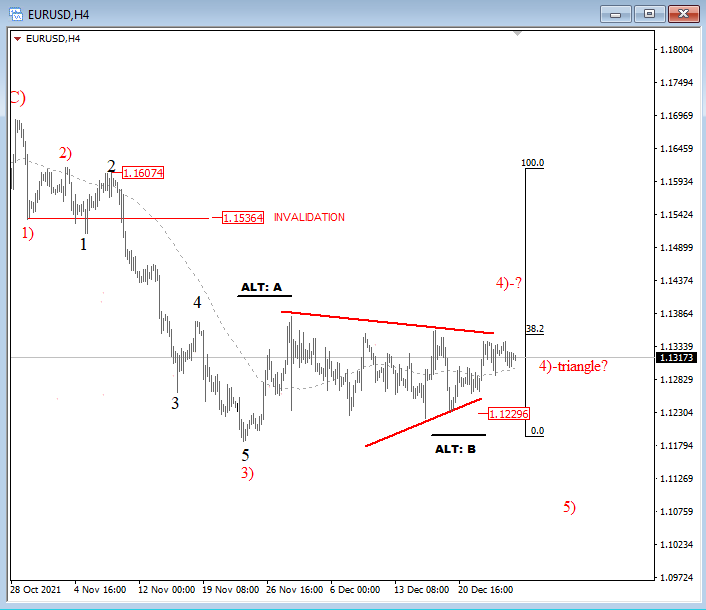
For now, however, the USD is weak while commodity currencies dominate between the currencies as metals and energy trade higher. EURUSD however is sideways, ideally forming a triangle which can be in wave 4, or in b of 4, so we will have to wait on more price data before one of the counts can be confirmed.
EUR/USD 4h Elliott Wave analysis
Gold Price Correcting Lower and Trading Below $1810
Gold price found support near $1,785 and started an upside correction against the US Dollar. The price broke the $1,800 level to move into a short-term positive zone.
Besides, there was a break above the $1,805 level and the 50 hourly simple moving average. However, the price is struggling to clear the $1,812 zone. It is now correcting lower and trading below $1,810 on FXOpen.
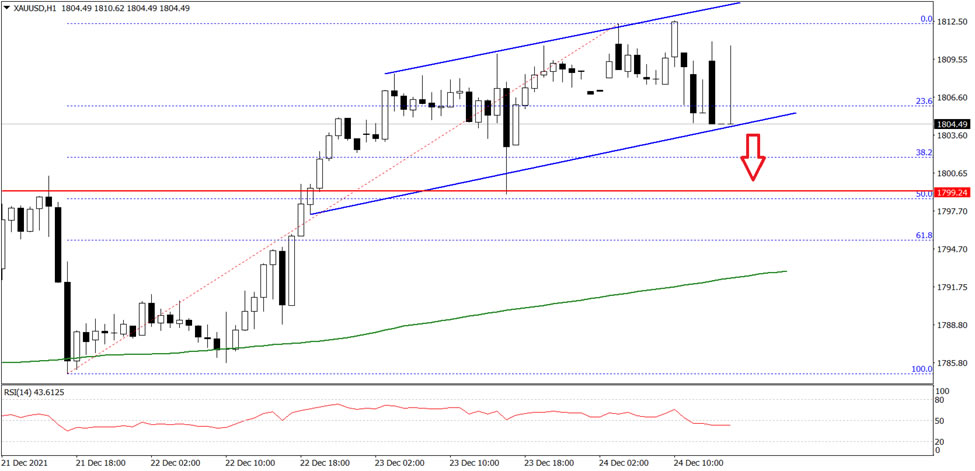
The price is testing a key bullish trend line at $1,804 on the hourly chart. The first key support on the downside is near the $1,800 level, below which there is a risk of more downsides. In the stated case, the price could test $1,780.
On the upside, the price is facing resistance near the $1,810 level. The next main resistance could be near the $1,812 level, above which the price could rise towards the $1,820 level.
EURUSD’s 6-Month Decline Oscillates around 1.13 Mark
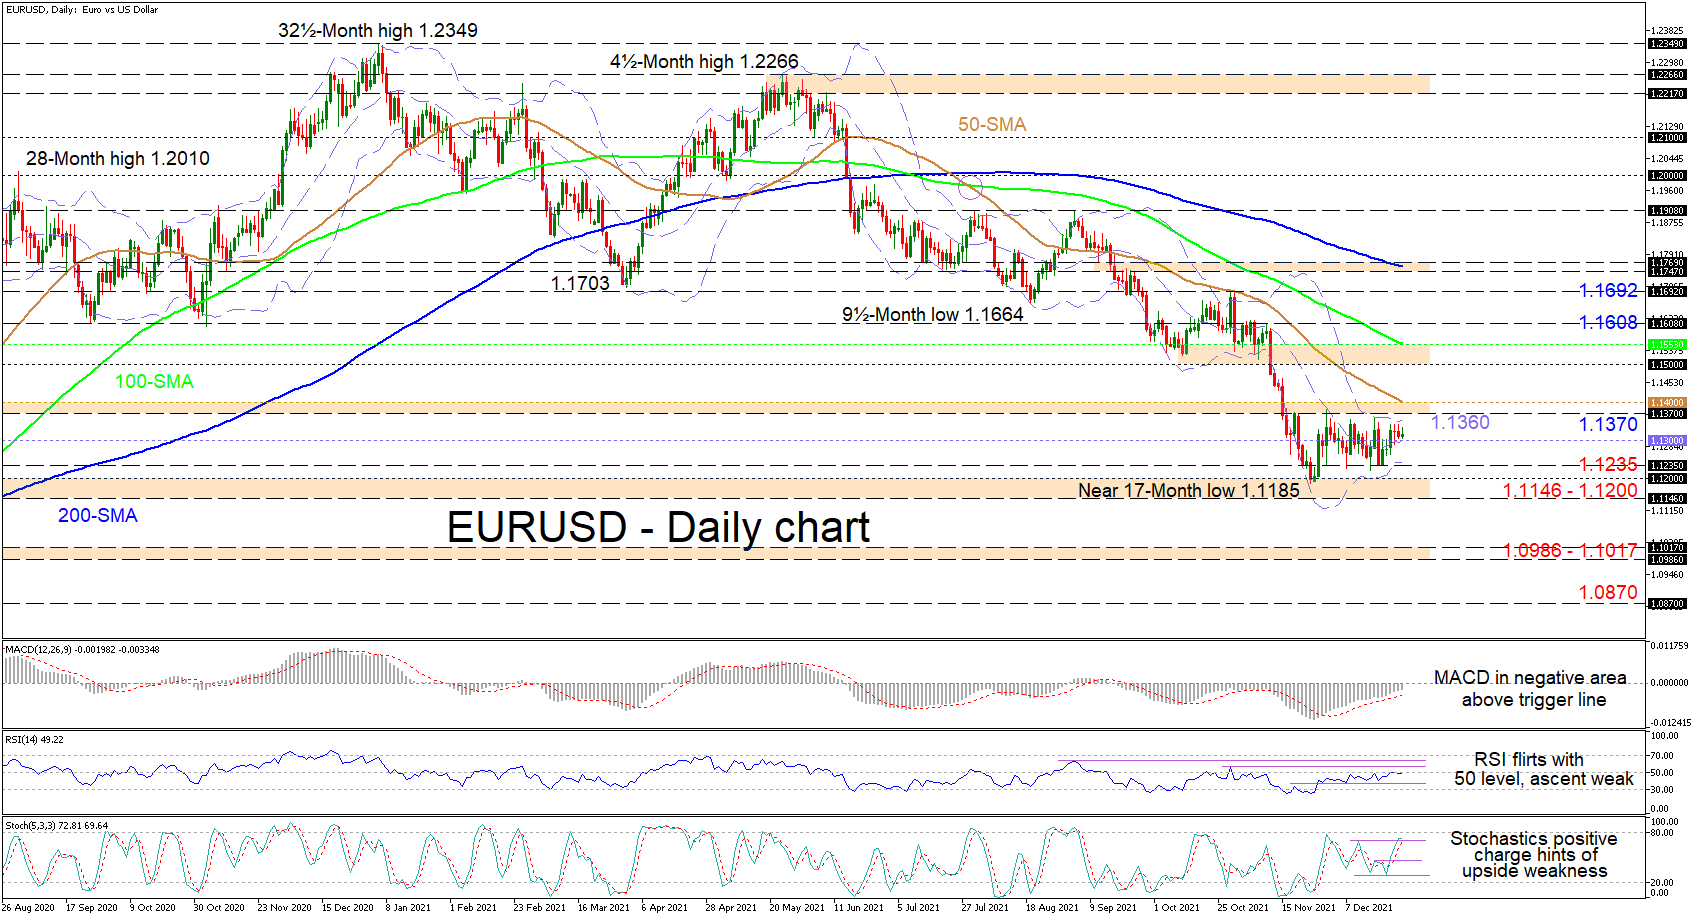
EURUSD is slightly above the mid-Bollinger band and appears set to continue its one-month consolidation in the vicinity of the 1.1300 handle. That said, downside risks remain, something also being mirrored in the falling simple moving averages (SMAs), which are defending the bearish bearing.
The short-term oscillators are indicating that negative momentum has softened. The MACD is rising above its red trigger line closing in on the zero mark, while the RSI is toying with the 50 neutral threshold, showing that bullish drive is vulnerable. Moreover, the positively charged stochastic oscillator is hinting that buying power is starting to fade.
Noteworthy is the squeeze in the Bollinger bands, which is signalling that a surge in volatility is expected, which suggests a larger directional move may evolve.
If the pair’s positive pressures diminish further and the price slides underneath the mid-Bollinger band at 1.1300, sellers could face initial downside constraints around the 1.1235 barrier, where the lower Bollinger band also resides. In order for the decline to resume, sellers would need to break below the 1.1146-1.1200 support border, reinforced by the lows of June 2020 and the near 17-month trough of 1.1185. Should this floor of the fresh range happen to give way, sellers could target the 1.0986-1.1017 region, formed over the mid-April to mid-May 2020 period. If selling forces dominate, the bears could then aim for the trough of 1.0870, identified in May 2020.
Alternatively, in order to underpin buyers’ confidence, the price would need to surpass the upper Bollinger band at 1.1360 and the adjacent 1.1370-1.1400 resistance boundary. Climbing from here, the 1.1500-1.1553 resistance section may attempt to impede buyers from gaining ground towards the 1.1608 and 1.1692 highs respectively.
Summarizing, even though EURUSD is lacking strong directional momentum, bearish risks endure as the price persists beneath the SMAs and the 1.1400 handle.
US Stock Futures Rise amid Christmas Holiday Travel Chaos
The British pound held steady on Monday morning amid a low-volume environment. The currency has been rising as investors adjust their expectations of the Omicron variant. While the number of Covid-19 cases in the country has been rising, evidence shows that the number of deaths has not increased dramatically. This is in line with two reports published last month that showed the Omicron variant is milder than Delta. Therefore, investors believe that the Bank of England (BOE) will embrace a relatively hawkish tone in the coming year.
American futures tilted higher on Monday, even after the latest flight cancellation numbers. During the Christmas weekend, it was reported that more than 6,000 flights were cancelled globally. This happened as more employees in airlines called in sick amid a surge in Covid-19 cases. Some of the companies that cancelled flights were Delta, Southwest, United, and American. Other leading global airlines that cancelled flights were China Eastern and Air India. These cancellations will most definitely affect company results.
The economic calendar will have no major events today as most investors remain at home with their families. Some countries like the UK, Australia, Canada, and New Zealand will also be on holiday today. Therefore, the volume will be significantly low. Still, investors will be focusing on the cryptocurrency industry today. Most coins like Bitcoin, Ethereum, and Litecoin made a bullish breakout on Friday, although the upward trend has slowed.
GBPUSD
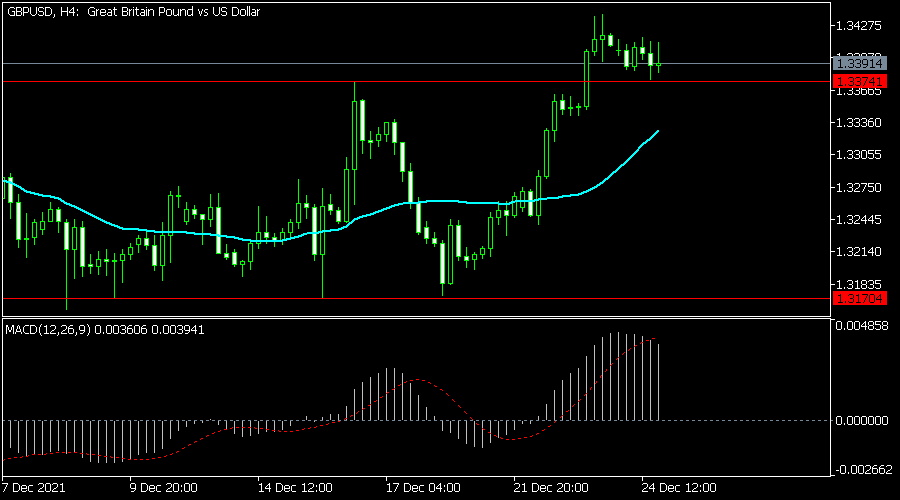
The GBPUSD pair has been in a strong bullish trend in the past few days. It is trading at 1.3391, which is a few points below last week’s high of 1.3437. On the four-hour chart, the pair has formed a break and retest pattern, since it is currently at the key support at 1.3391. This price was the highest level on December 16. It is also slightly above the 25-day and 50-day moving averages. Therefore, there is a likelihood that the pair will keep rising today.
EURUSD
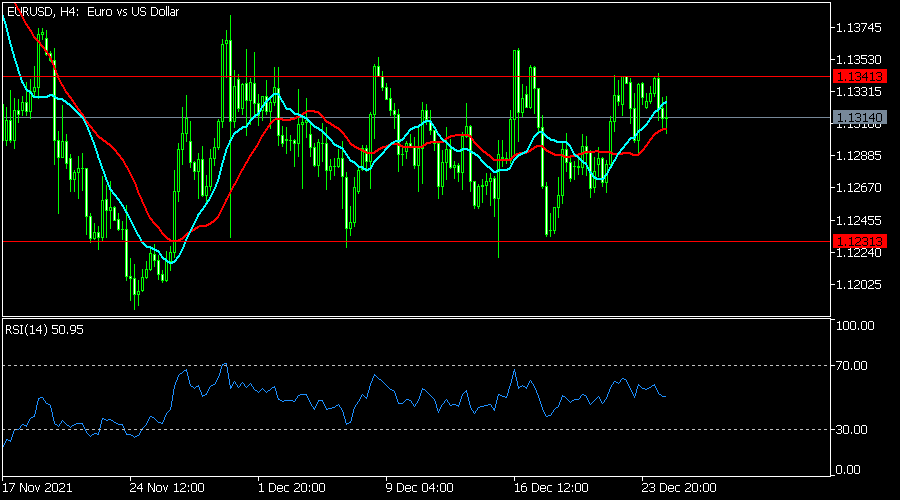
The EURUSD pair is in a tight range as investors focus on the Covid situation in Europe and the US. The pair is trading at 1.1315, where it has been in the past few days. It is slightly below the 25-day and 50-day moving averages. It has moved between the horizontal channel shown in red, while the Relative Strength Index (RSI) is at the neutral level. Therefore, the pair will likely remain in this range for a while.
XBRUSD
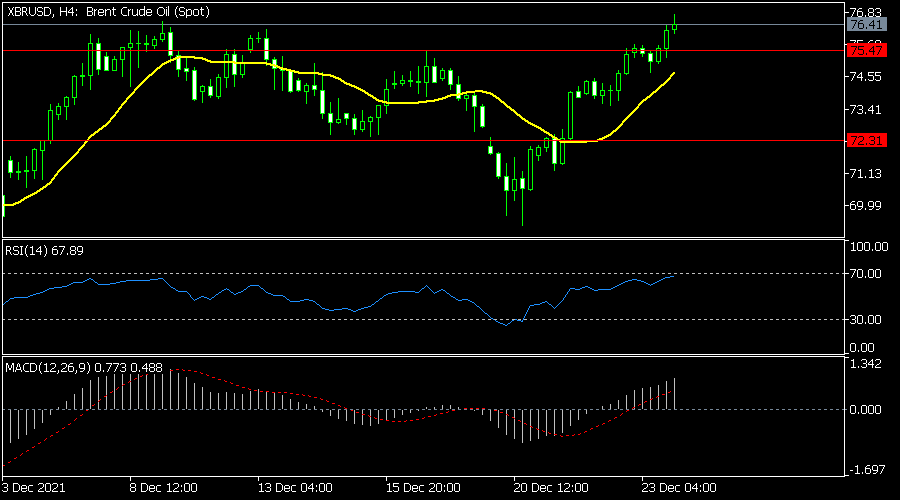
The XBRUSD pair has been in a strong bullish trend in the past few days. It is trading at 76.40, which is the highest it has been since December 9. It has even moved above the key resistance level at 76.0 and the 25-day moving average. The RSI and the MACD have also been rising. Therefore, the pair will likely keep rising as bulls target the key resistance level at 77.
Technical Outlook and Review
DXY:
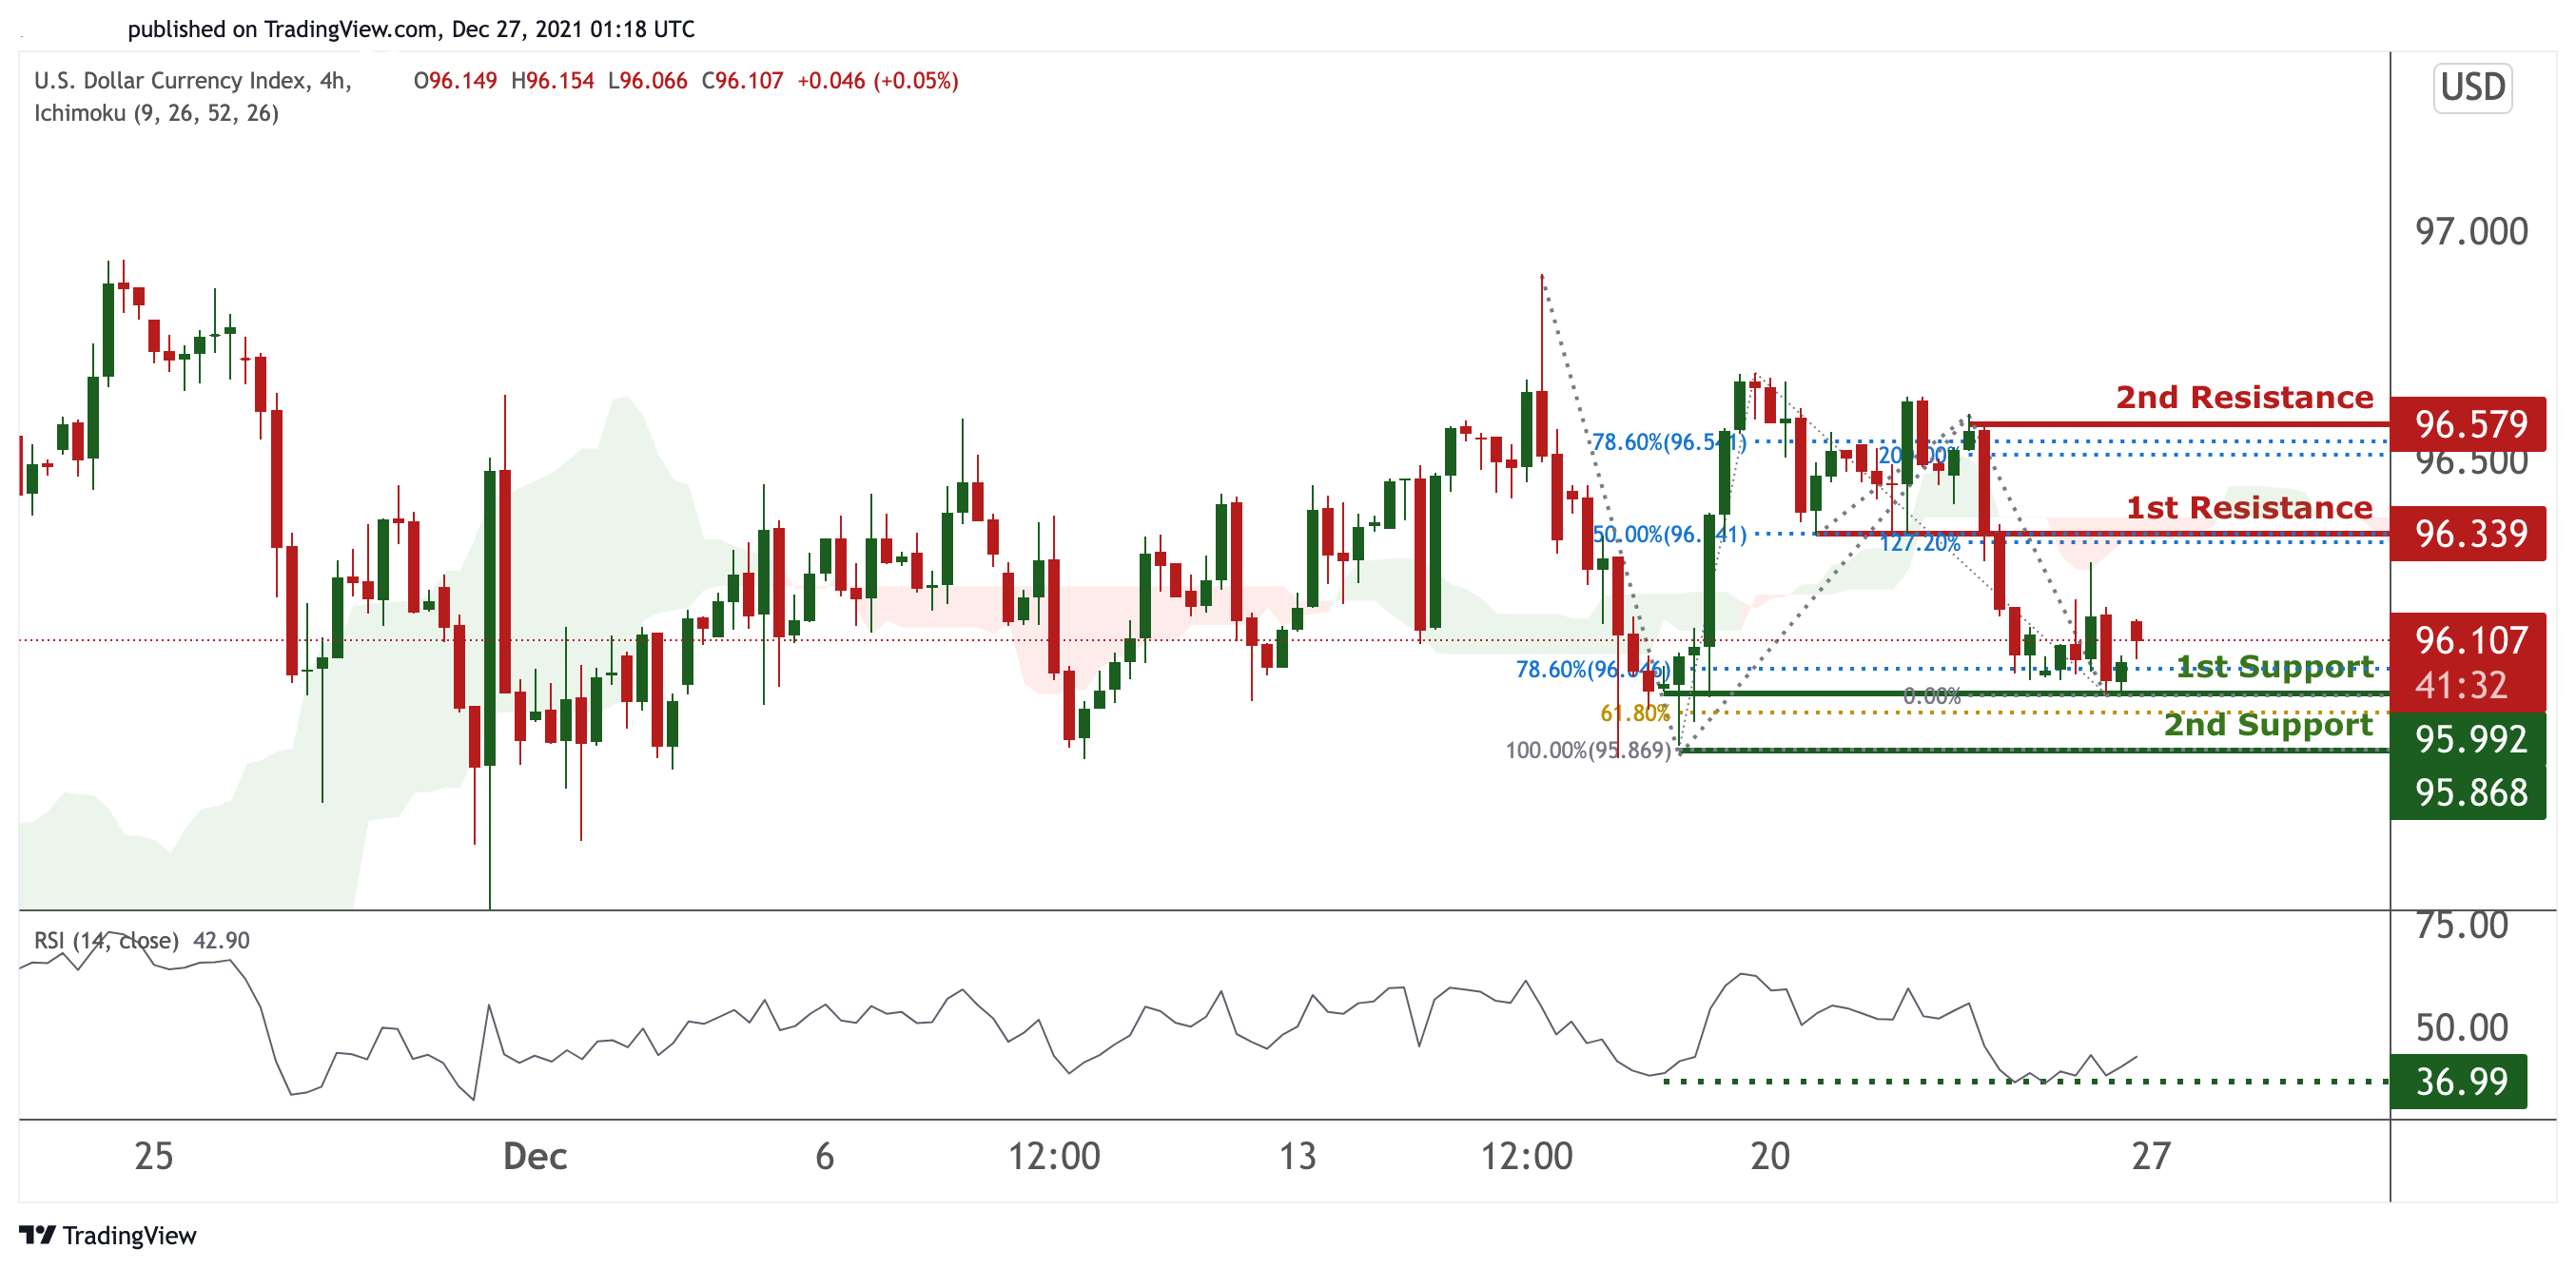
On the H4 timeframe, prices have reached a pivot which is a graphical swing low. We would expect a bounce from our 1st support at 95.992 in line with 78.6% Fibonacci retracement towards our 1st resistance at 96.339 in line with 127.2% Fibonacci extension and 50% Fibonacci retracement. RSI is at a level where bounces previously occurred and also ichimoku clouds are showing bullish momentum.
Areas of consideration:
- H4 time frame, 1st resistance at 96.339
- H4 time frame, 1st support at 95.992
XAU/USD (GOLD):
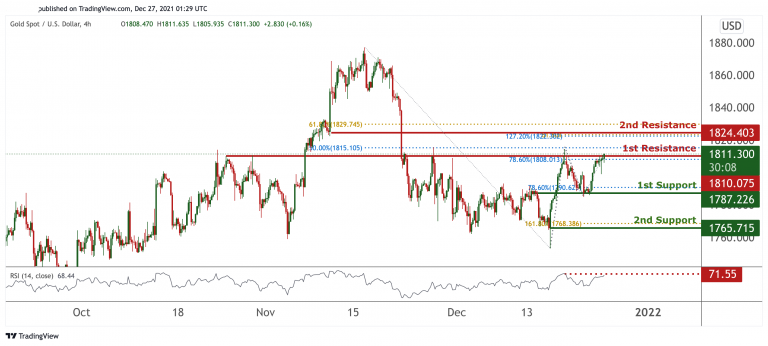
On the H4 chart, prices are at a graphical strong overlap resistance. We see potential for prices to dip from our 1st resistance at 1810.075 in line with 78.6% Fibonacci extension and 50% Fibonacci retracement towards our 1st support at 1787.226 in line with 78.6% Fibonacci retracement. RSI is at a level where dips previously occurred. Alternatively, breaking our 1st resistance will find prices climbing further towards our 2nd resistance at 1824.403 in line with 127.2% and 61.8% Fibonacci extension and 61.8% Fibonacci retracement.
Areas of consideration:
- 4h 1st support at 1787.226
- 4h 1st resistance at 1810.075
GBP/USD
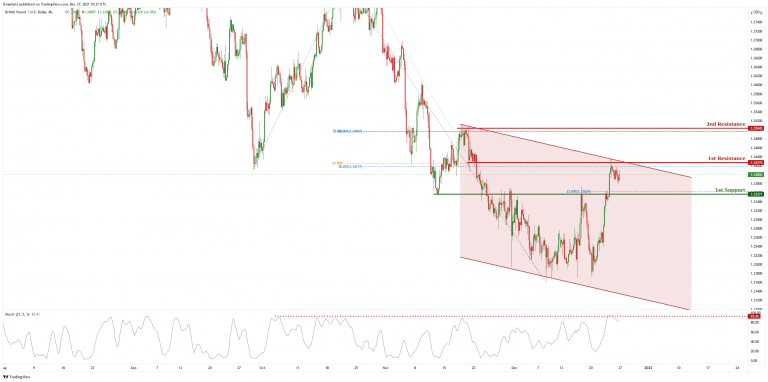
On the H4 chart, price is trading in a descending channel and near 1st resistance level of 1.34726 which is also 38.2% Fibonacci retracement and 61.8% Fibonacci projection. Price can potentially dip to the 1st support level of 1.33751 which is also the graphical overlap support and 23.6% Fibonacci retracement. Our bearish bias is supported by a stochastic indicator as it is near the resistance level.
Areas of consideration :
- H4 1st resistance at 1.34276
- H4 1st support 1.33571
USD/CHF
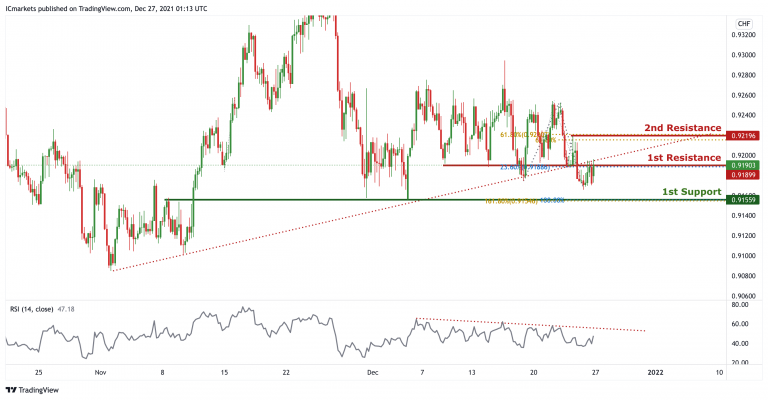
On the H4 timeframe, price broke out of the ascending trendline support, signifying potential bearish momentum. We can expect price to drop from 1st Resistance in line with 23.6% fibonacci retracement and graphical overlap resistance towards 1st Support in line with graphical overlap support, 100% Fibonacci projection and 161.8% Fibonacci extension. Our bearish bias is further supported by the RSI indicator abiding to the descending trendline resistance.
Areas of consideration:
- Watch 1st Support at 0.91559
- Watch 1st Resistance at 0.91899
EUR/USD :
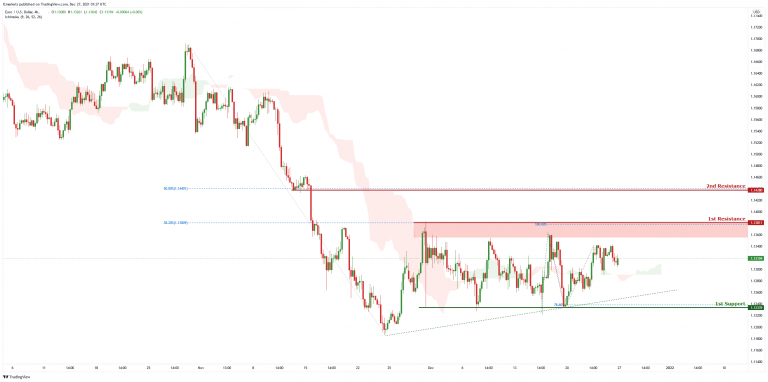
On the H4 chart, price is abiding by the ascending trendline and near the first resistance level of 1.13811 which is also 100% Fibonacci projection and 38.2% Fibonacci retracement. Price can potentially dip to the 1st support level of 1.12339 which is also 78.6% Fibonacci projection. Our bearish bias is supported by the ichimoku cloud indicator as price is trading under the cloud
Areas of consideration :
- H4 1st resistance at 1.13811
- H4 1st support at 1.12339
USD/JPY:
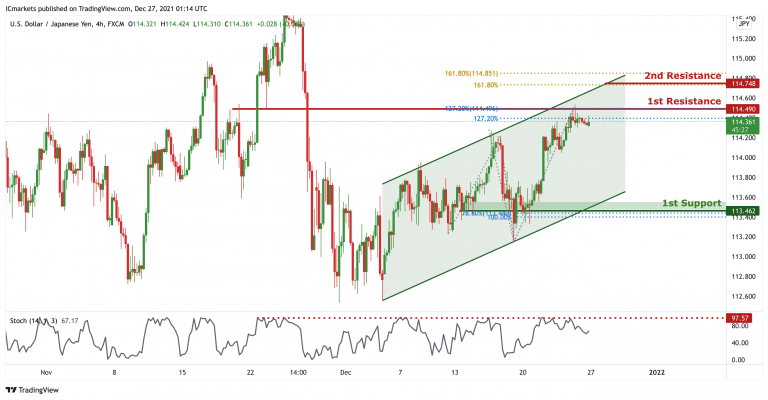
On the H4 timeframe, price is abiding to the ascending channel, showing an overall bullish momentum. However, we can expect a short term bearish momentum and drop from 1st resistance in line with previous high ,127.2% Fibonacci projection and 127.2% Fibonacci retracement towards 1st Support in line with horizontal support, 100% Fibonacci projection and 78.6% Fibonacci retracement. Our bearish bias is further supported by stochastic where the %K line dropped from the resistance.
Areas of consideration:
- H4 1st resistance level 114.490
- H4 1st support level 113.462
AUD/USD:
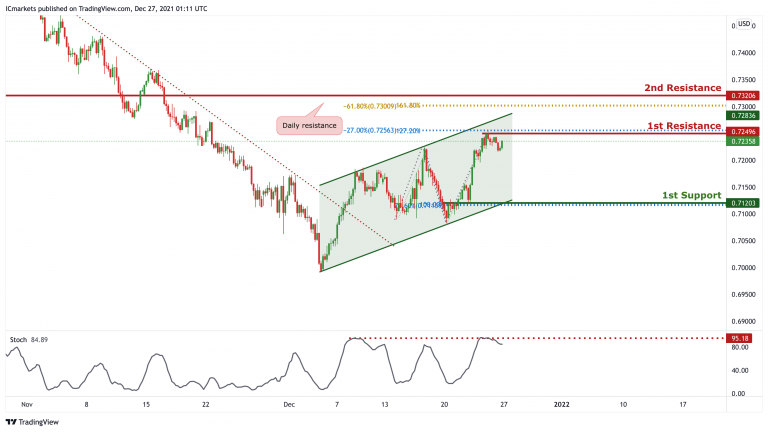
On the H4, price is reacting in an ascending channel, signifying bullish momentum. However, price is currently at a resistance, we can expect price to drop from 1st Resistance in line with 127.2% Fibonacci projection and -27.2% Fibonacci Extension towards 1st Support in line with 100% Fibonacci projection and 78.6% Fibonacci retracement. Our short-term bearish bias is further supported by the stochastic indicator where the %K line is at the resistance level. Areas of consideration:
- H4 1st Support level 0.71203
- H4 1st resistance level 0.72496
NZD/USD:
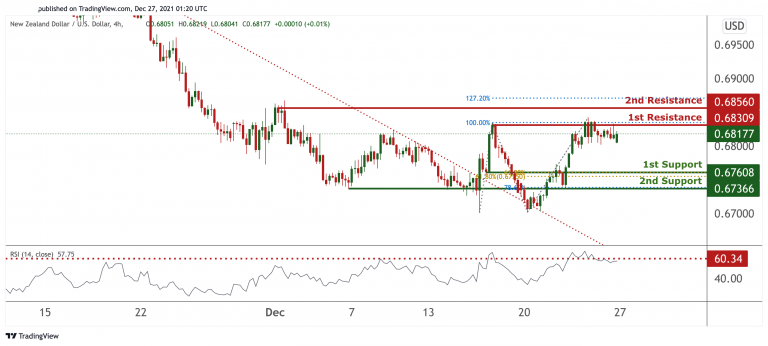
On the H4 timeframe, prices are at a graphical swing high and are experiencing a squeeze. We see potential for prices to dip from our 1st resistance at 0.68309 in line with 100% Fibonacci extension towards our 1st support at 0.67608 which is an area of Fibonacci confluences. RSI at a level where dips usually occur. If prices break our 1st resistance, we can potentially find prices climbing higher towards our 2nd resistance at 0.68560 in line with 127.2% Fibonacci extension.
Areas of consideration:
- H4 time frame, 1st resistance at 0.68309
- H4 time frame, 1st support at 0.67609
USD/CAD:
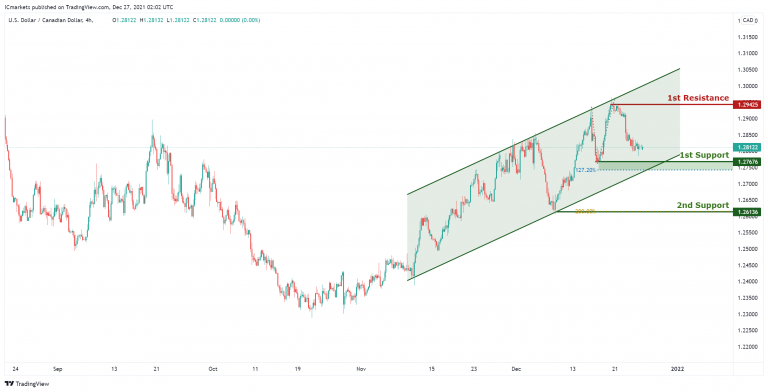
On the H4 timeframe,with price moving in the ascending channel, we have a bullish bias that price will rise from 1st support at 1.27676 in line with the graphical swing low support and 127.2% Fibonacci extension to 1st resistance at 1.29425 in line with the graphical swing high resistance. Alternatively, we may see price break 1st support and head for 2nd support at 1.26136 in line with the horizontal swing low support and 200% Fibonacci projection.
Areas of consideration:
- H4 time frame, support at 1.27676
- H4 time frame, resistance at 1.29425
OIL:
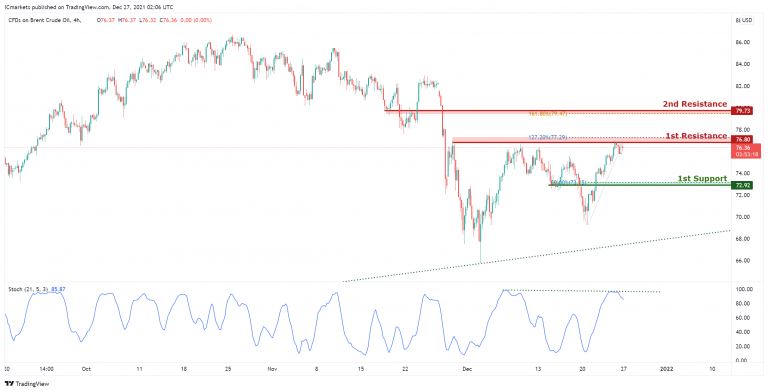
On the H4 timeframe,with price approaching the resistance of the stochastics indicator, we have a bearish bias that price will drop to 1st support at 74.92 in line with the graphical overlap support and 50% Fibonacci retracement from 1st resistance at 76.80 in line with the 127.2% Fibonacci projection and graphical swing high resistance. Alternatively, we may see price break 1st resistance and head for 2nd resistance at 79.73 in line with the horizontal swing high resistance and 161.8% Fibonaccai extension.
Areas of consideration:
- H4 time frame, 1st resistance of 80
- H4 time frame, 1st support of 92
Dow Jones Industrial Average:
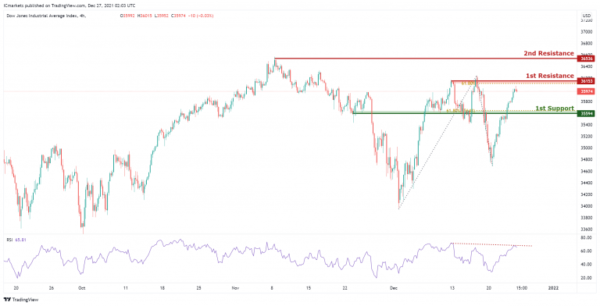
On the H4 timeframe,with price approaching the resistance of the stochastics indicator, we have a bearish bias that price will drop to 1st support at 35594 in line with the graphical overlap support and 61.8% Fibonacci retracement from 1st resistance at 36153 in line with the 61.8% Fibonacci retracement and graphical swing high resistance. Alternatively, we may see price break 1st resistance and head for 2nd resistance at 36536 in line with the horizontal swing high resistance.
Area of consideration:
- 4H resistance at 36153
- 4H support at 35594
NZDUSD Bearish Sequence Favors More Downside
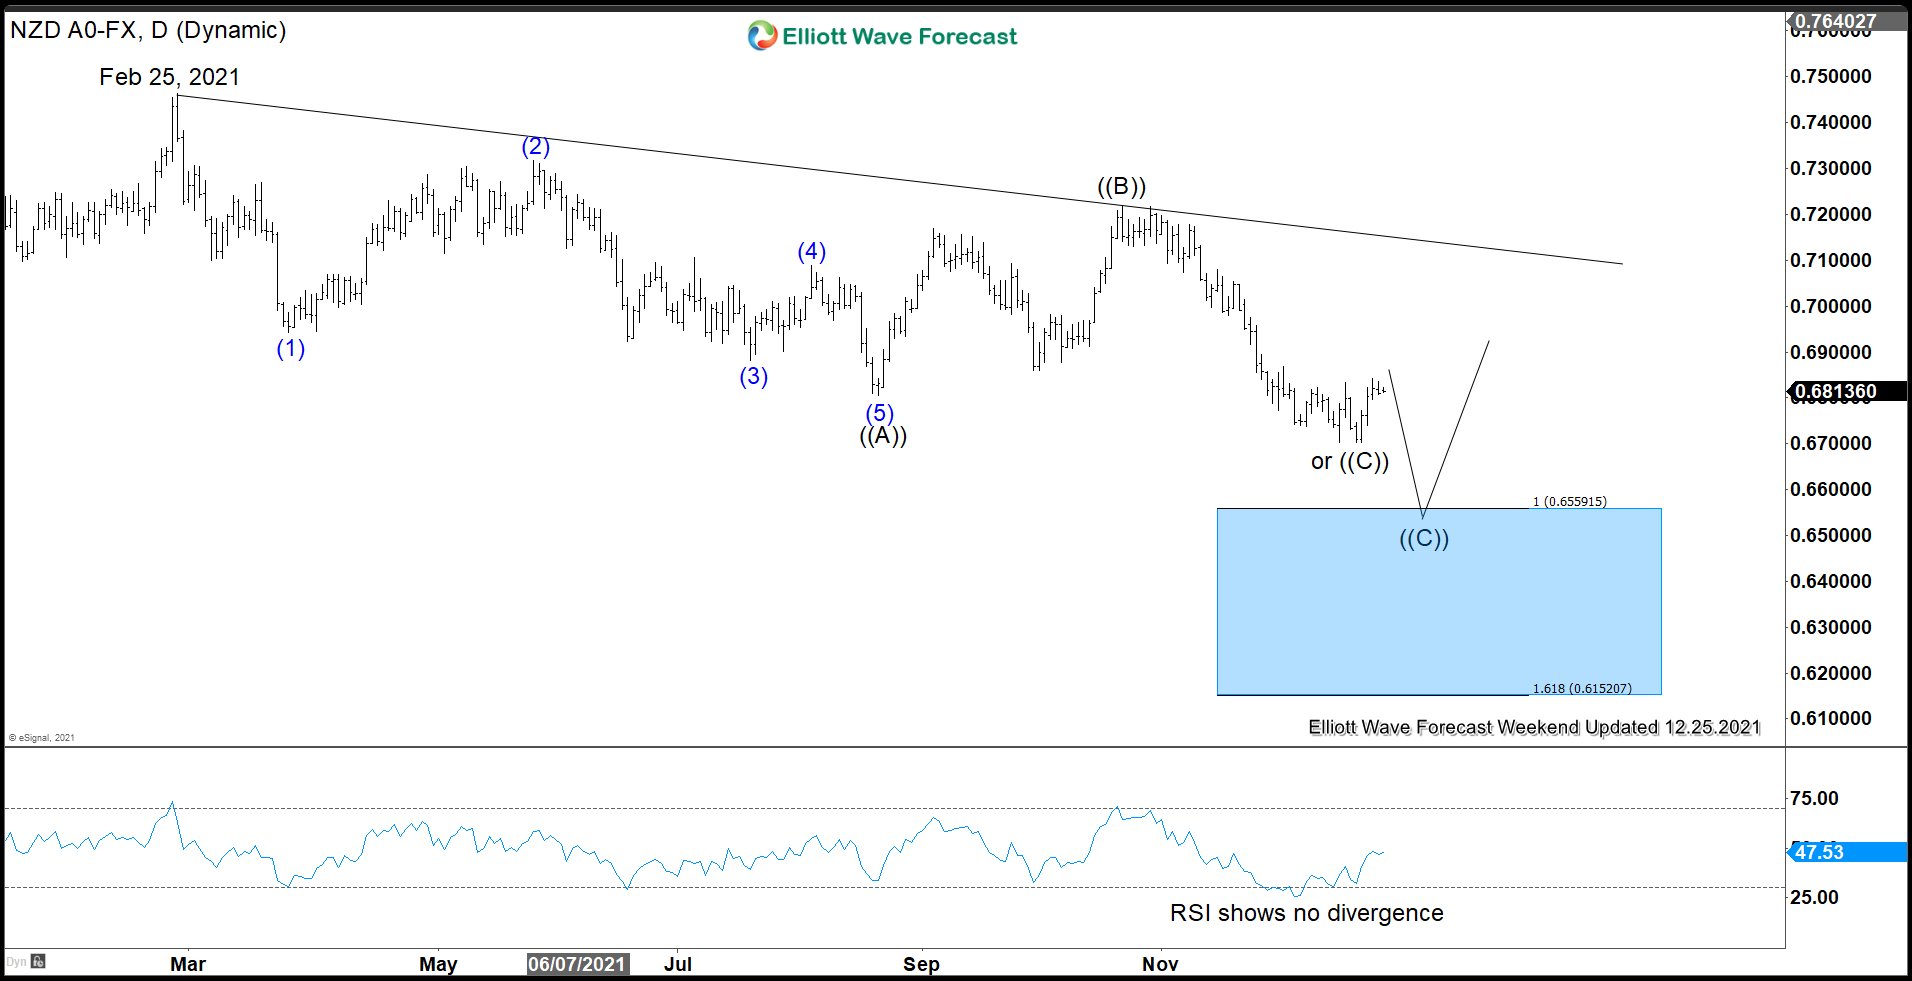
NZDUSD shows incomplete lower low sequence from February 25, 2021 peak favoring more downside. Below is the daily chart of NZDUSD showing the incomplete bearish sequence
NZDUSD Daily Elliott Wave Chart
The Daily Chart of NZDUSD above shows a possible 100% – 161.8% Fibonacci extension target from February 25, 2021 peak towards 0.615 – 0.656. The short term rally is expected to fail in the sequence of 3, 7, or 11 swing for further downside as the primary view. The alternate view suggests a truncated zigzag from February 25, 2021 high. The truncated view is also a possibility although it’s not the primary view. The current RSI shows no momentum divergence suggesting that it’s possible wave ((C)) truncates without reaching the 100%.
NZDUSD 1 Hour Elliott Wave Chart
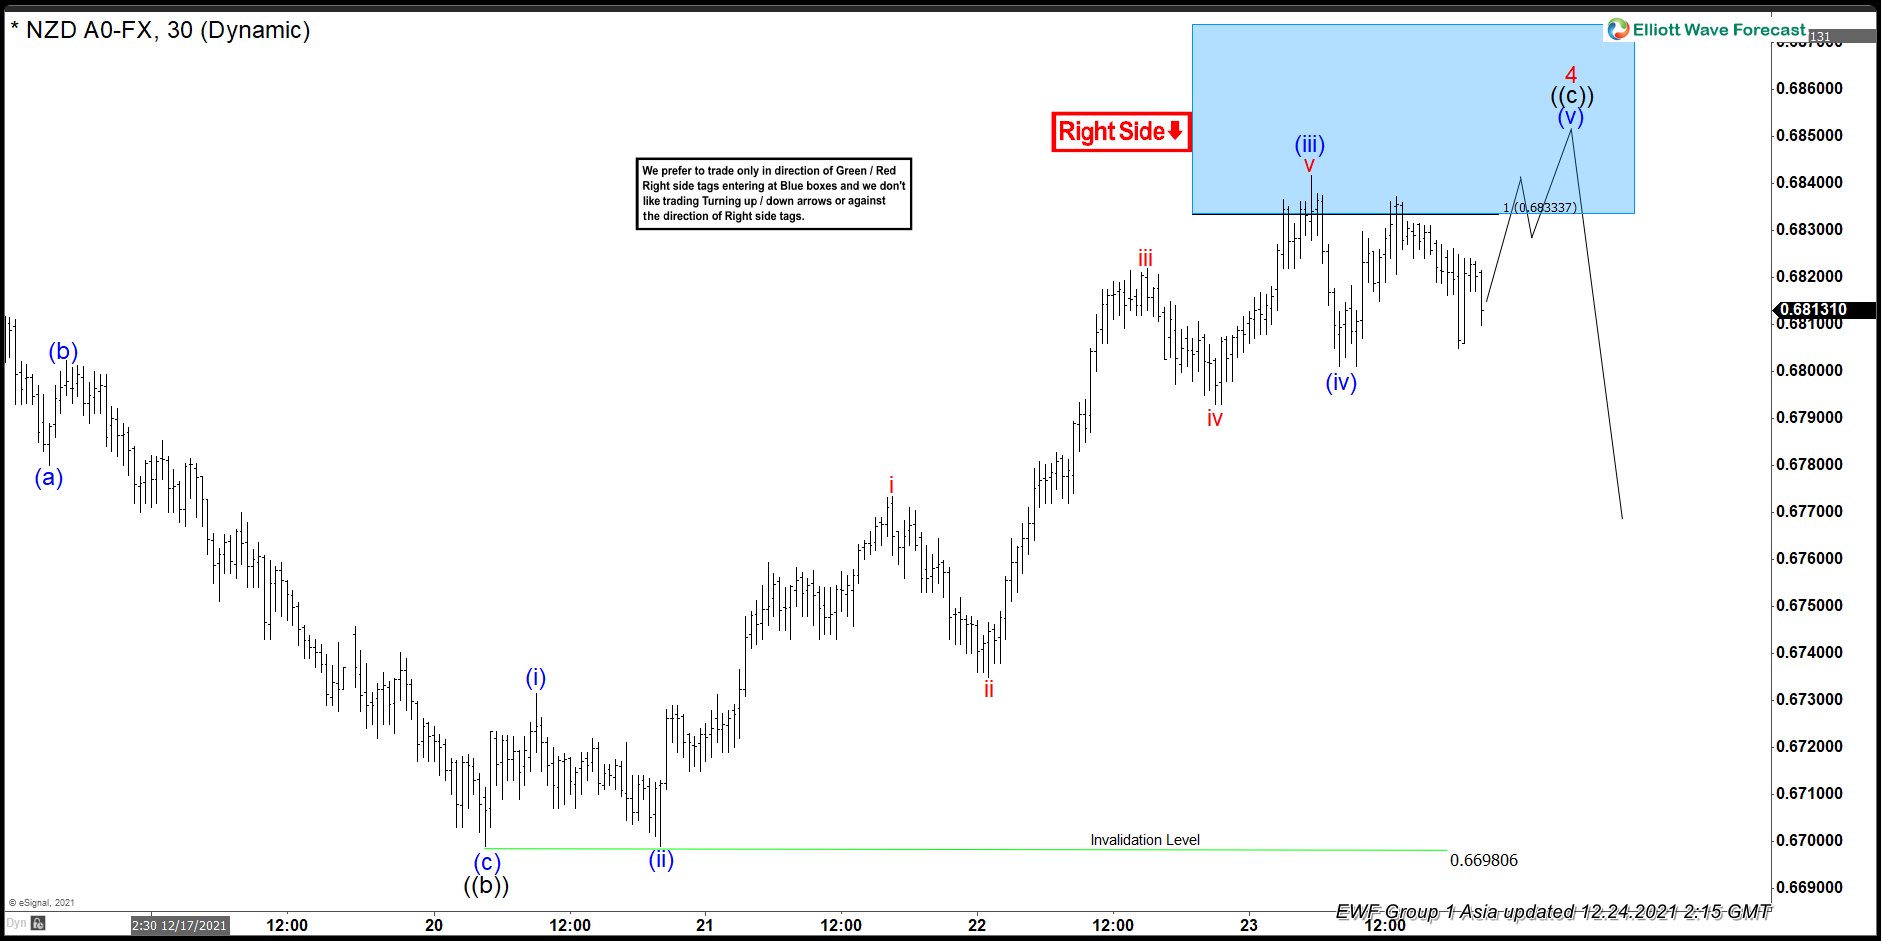
The 1 hour chart per 24 December suggests that rally is expected to fail at 0.633 – 0.686 area. This is the 100% – 123.6% Fibonacci extension from December 16, 2021 low. From the blue box area, pair can then either resumes lower or pullback in 3 waves at least. The view is valid as long as it doesn’t extend to 161.8% extension at 0.691. If the rally continues to extend to 0.691, the entire rally can becomes an impulse.
2022:Q1 Global Market Outlook
1. Q4 Recap and Overview of Key Drivers for Q1
By Fawad Razaqzada
The global stock markets traded mixed in Q4 2021, with the major indices in US and Europe managing to claw back some of their losses suffered in the third quarter. The fourth quarter itself was quite volatile. October was generally a positive month, while November and start of December saw investors abandon risk as concerns over the economic impact of omicron variant of Covid, surging inflationary pressures and monetary tightening from major central banks all weighed on sentiment. But as we went to press in the final week of the month before Christmas, the markets managed to claw back their losses suffered earlier in the month. Investors were relieved by scientific evidence that although more infectious, there were not as many severe illnesses caused by Omicron as the Delta variant. This left the major indices on track to end the year with solid gains:
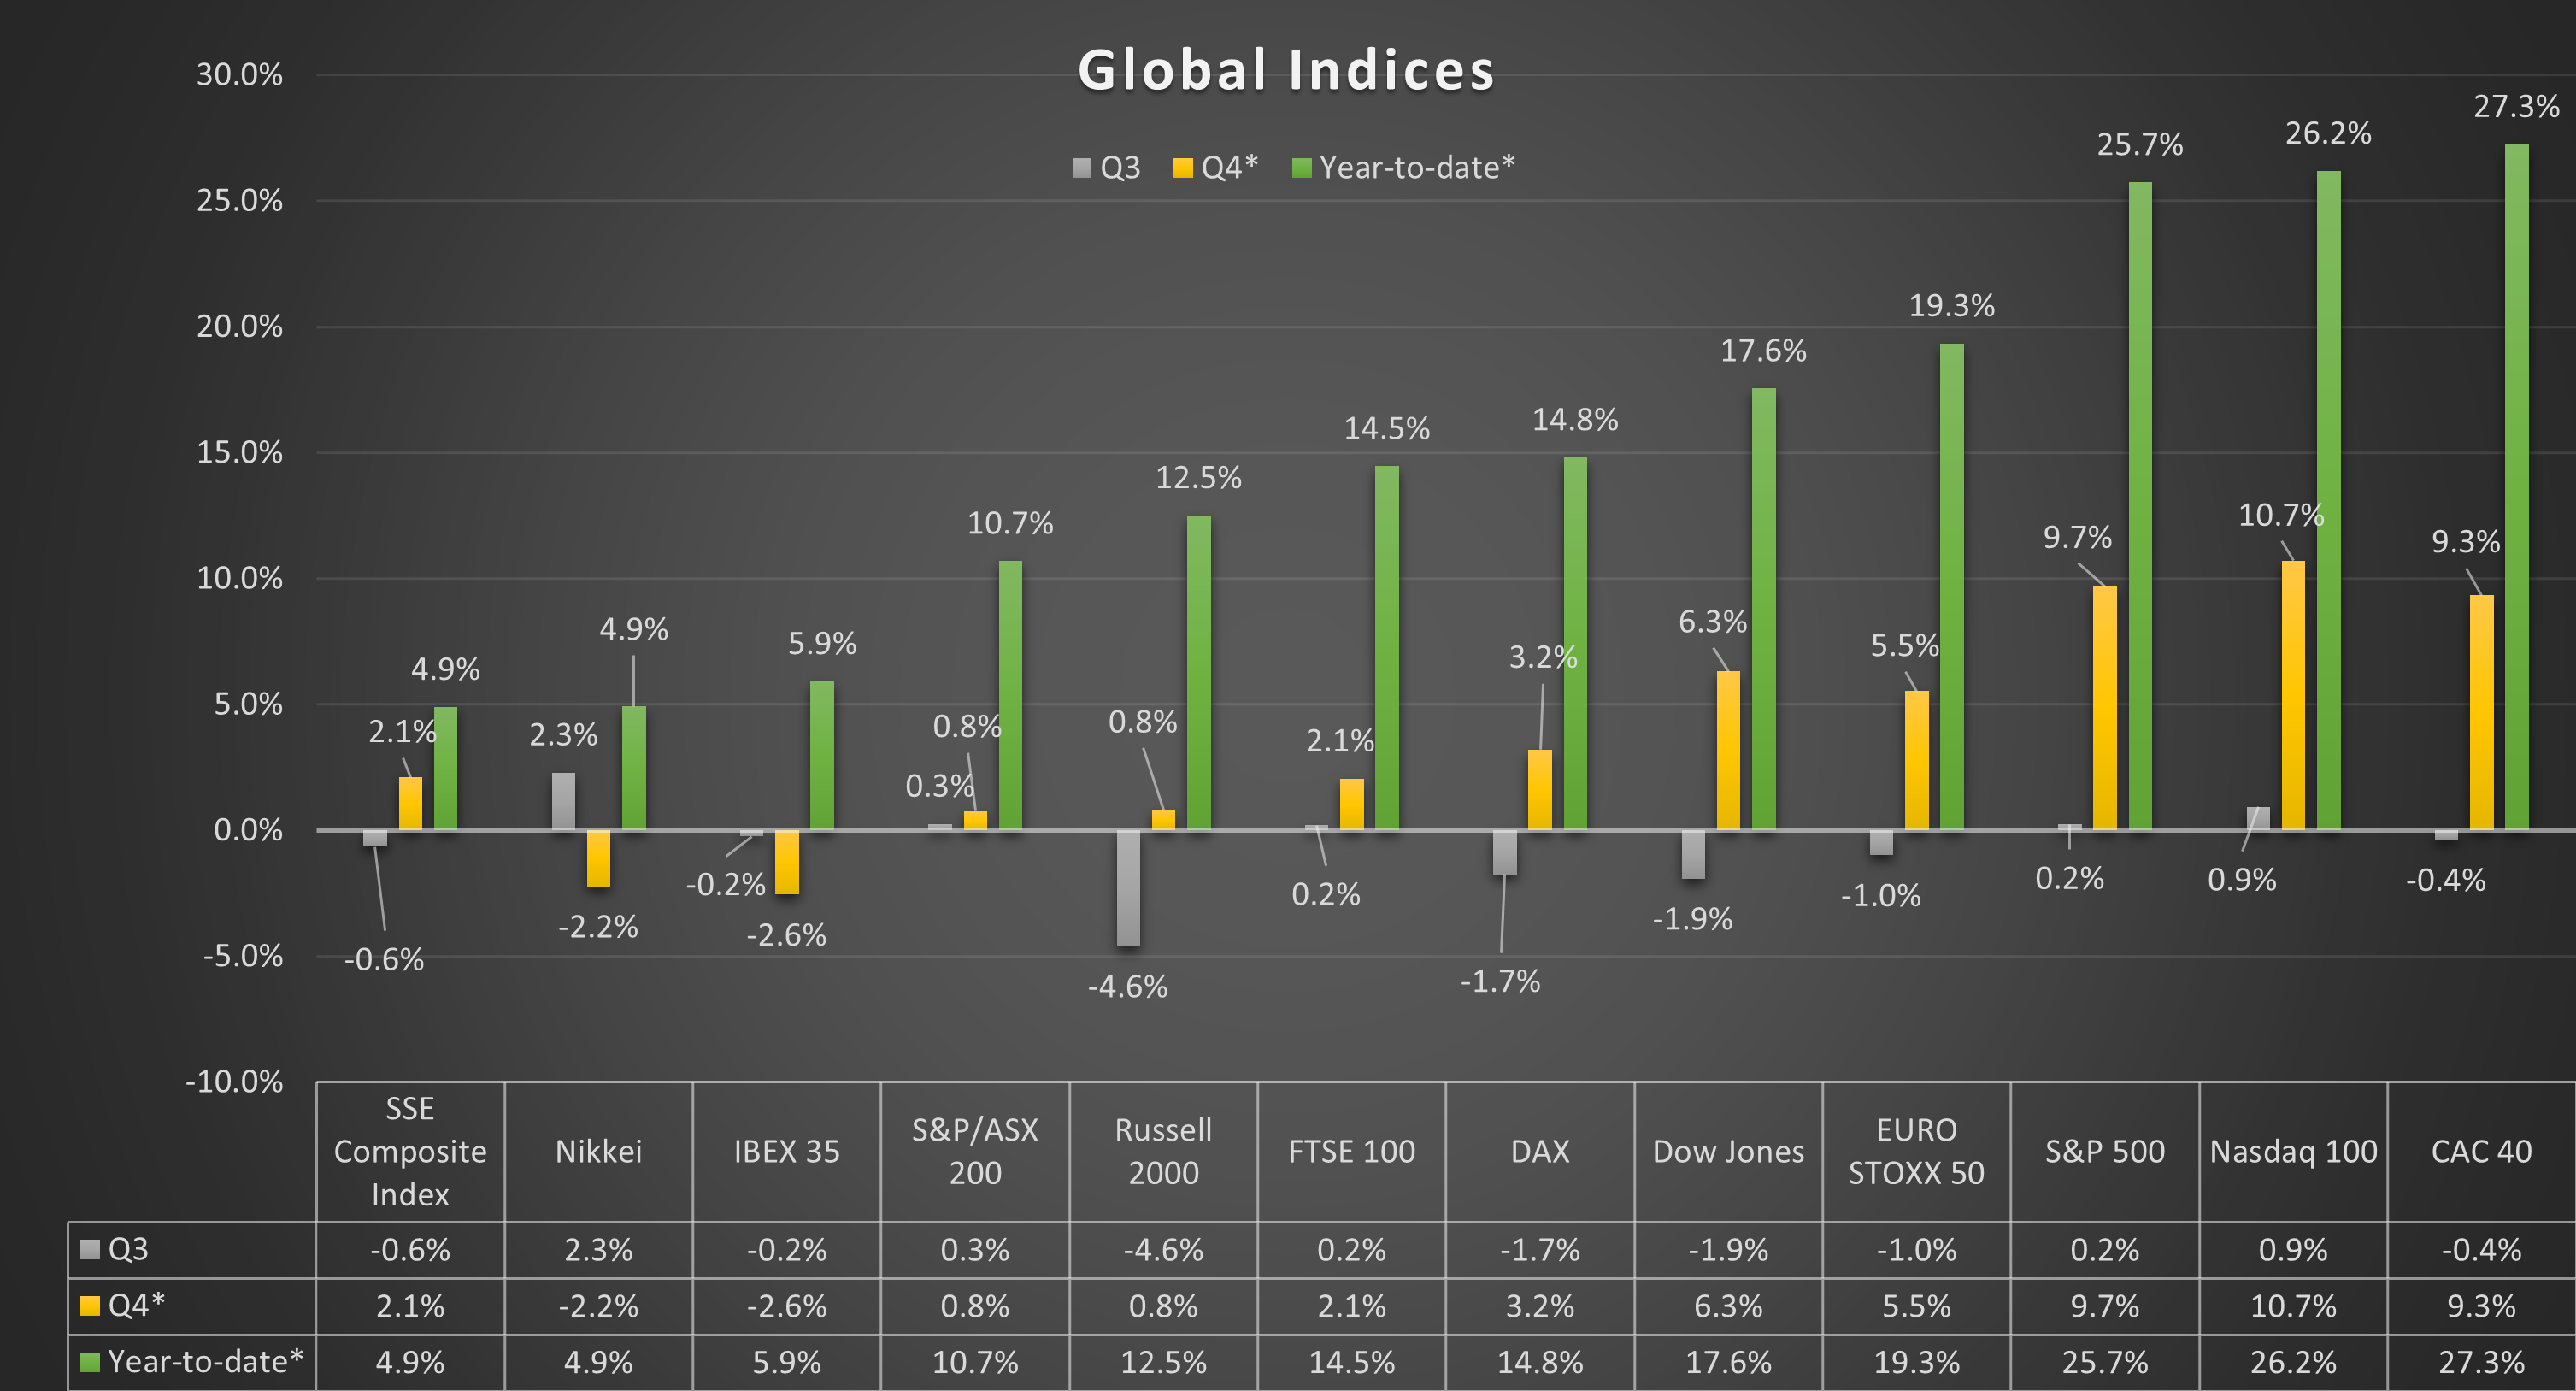
Source: ThinkMarkets; *prices and index levels correct as of 23 December 2021
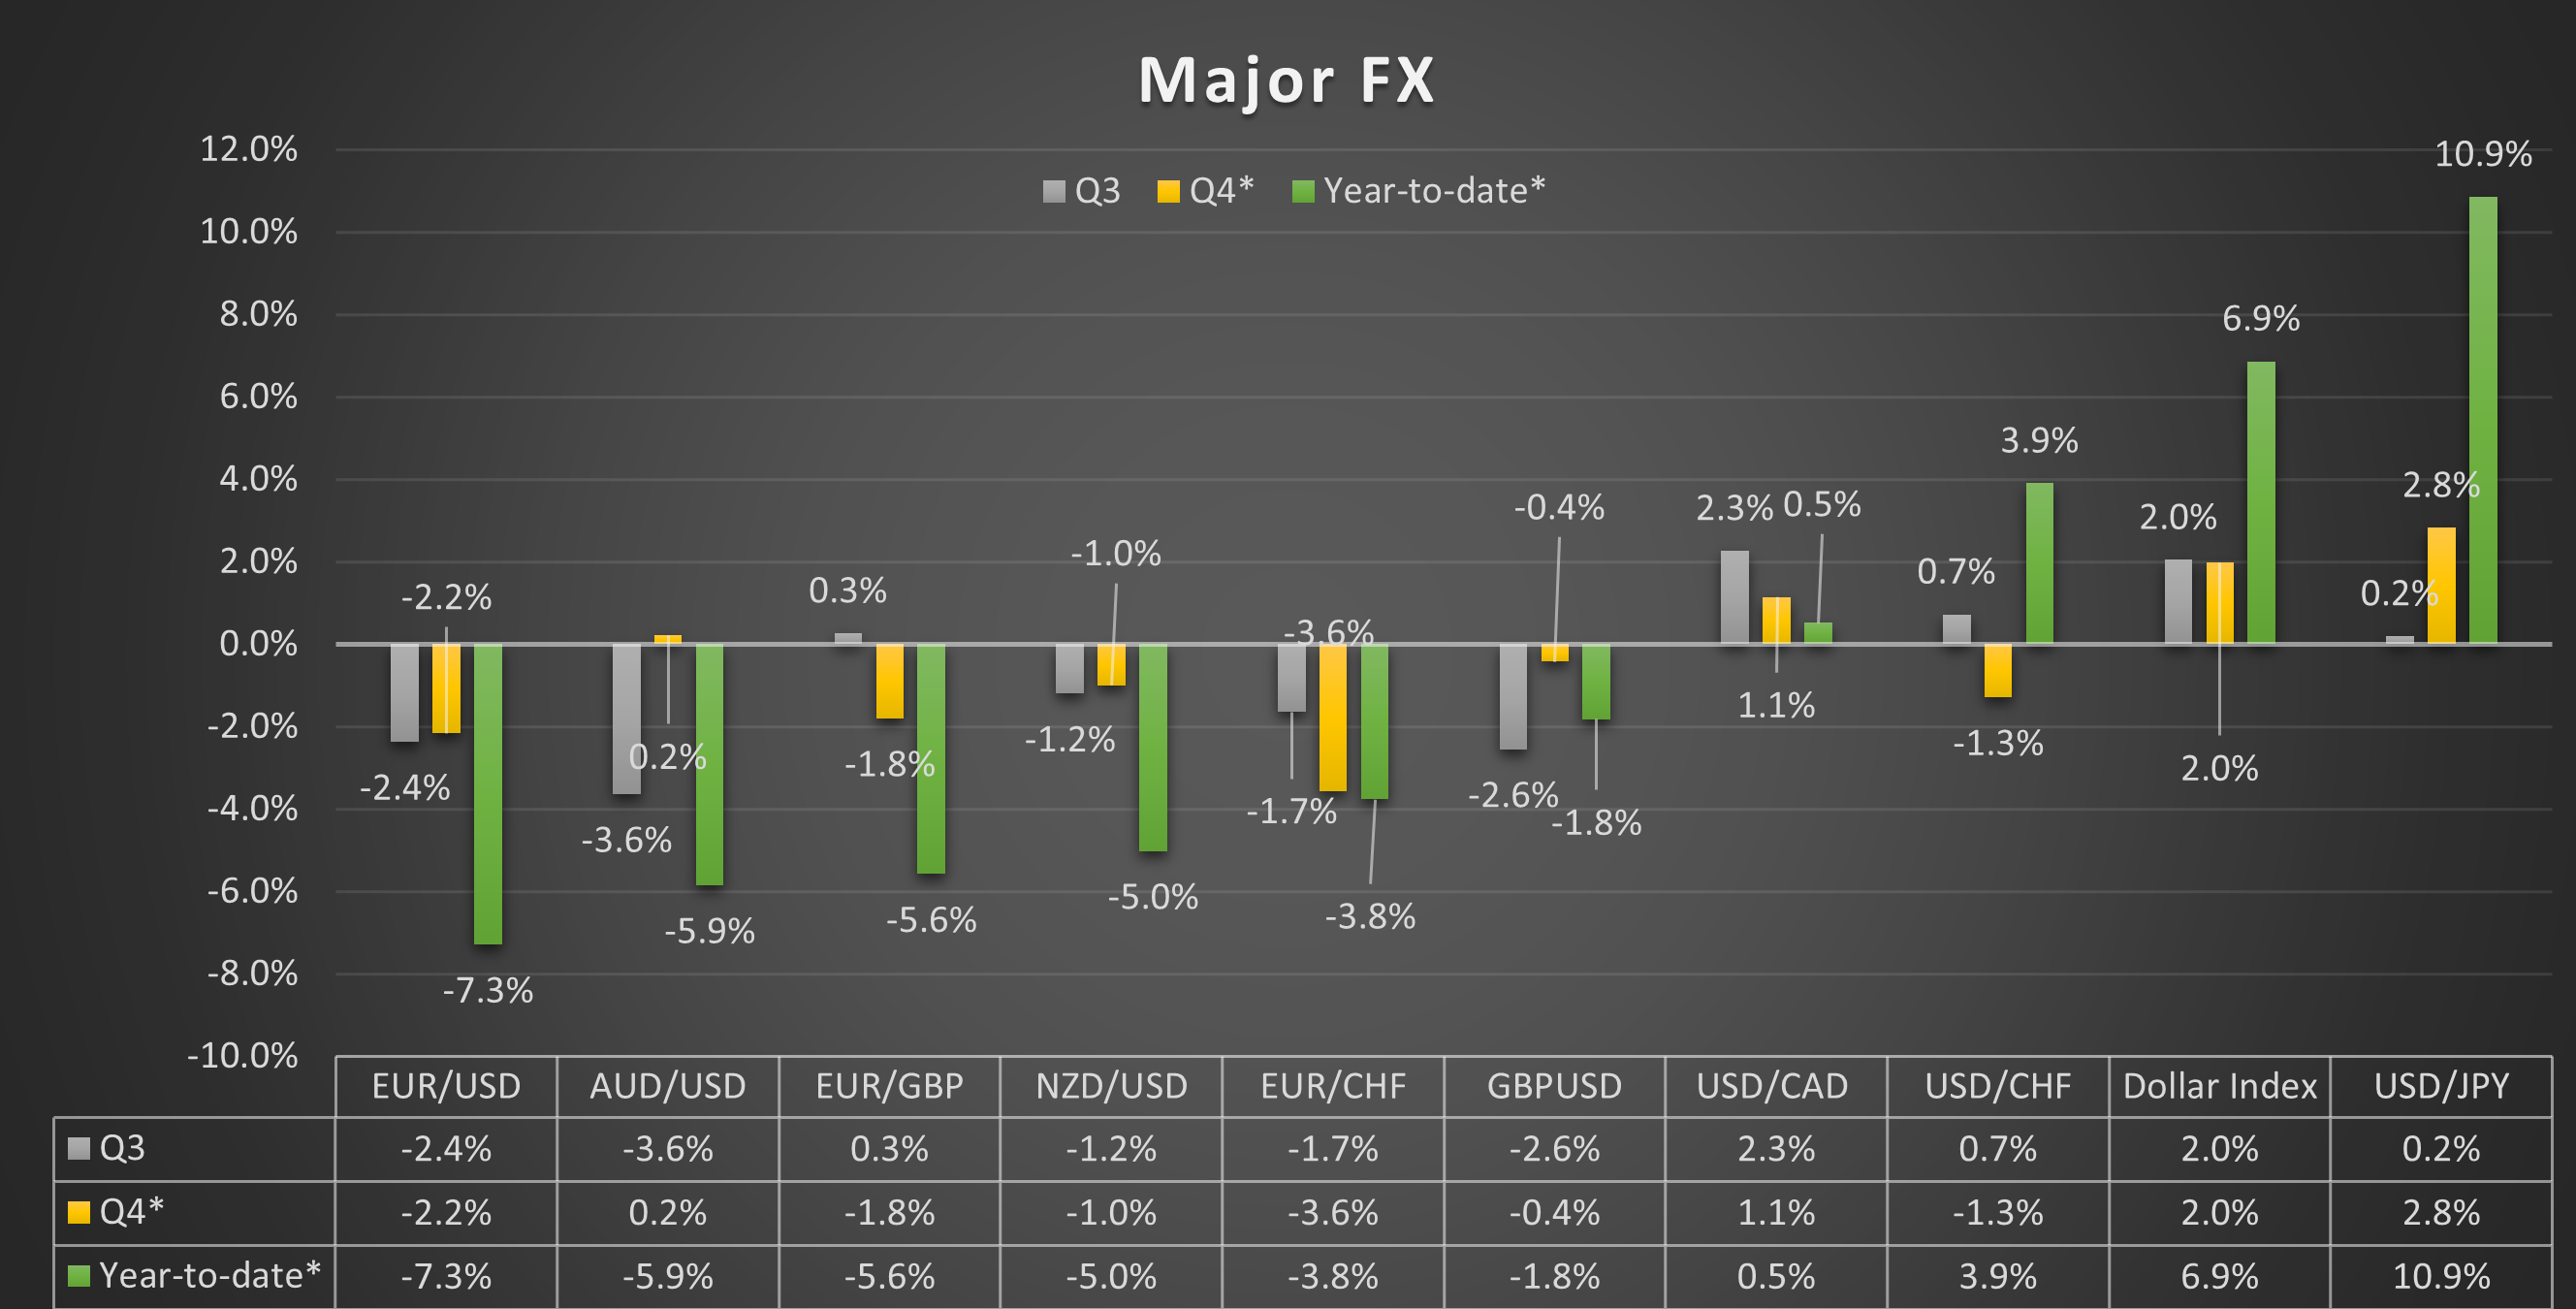
The FX markets were fairly contained in Q4, with the US dollar remaining bid against all the major currencies owing to a more hawkish central bank. The Fed announced in December that – because of NOT transitory inflation – it was speeding up tapering of its QE purchases and end the programme by March 2022, while the median FOMC projections pointed to three rate increases in the year ahead. This was in sharp contrast to the European Central Bank and Bank of Japan’s monetary policy updates, keeping their respective currencies under pressure. The ECB did however turn a bit hawkish as inflation surged higher in Eurozone too, driven by an energy crunch. Rising prices of oil and gas weighed on currencies of oil consumer nations like Japan, while supporting producer nations’ currencies such as the Canadian dollar. The Bank of England finally raised interest rates by 25 basis points, providing only moderate support to the pound, with sterling being held back by concerns that the economy would weaken as Omicron variant triggered a fresh wave of restrictions in the country. At the time of writing, in the last week before Christmas, the dollar remained head and shoulders above the rest:
Source: ThinkMarkets; *prices correct as of 23 December 2021
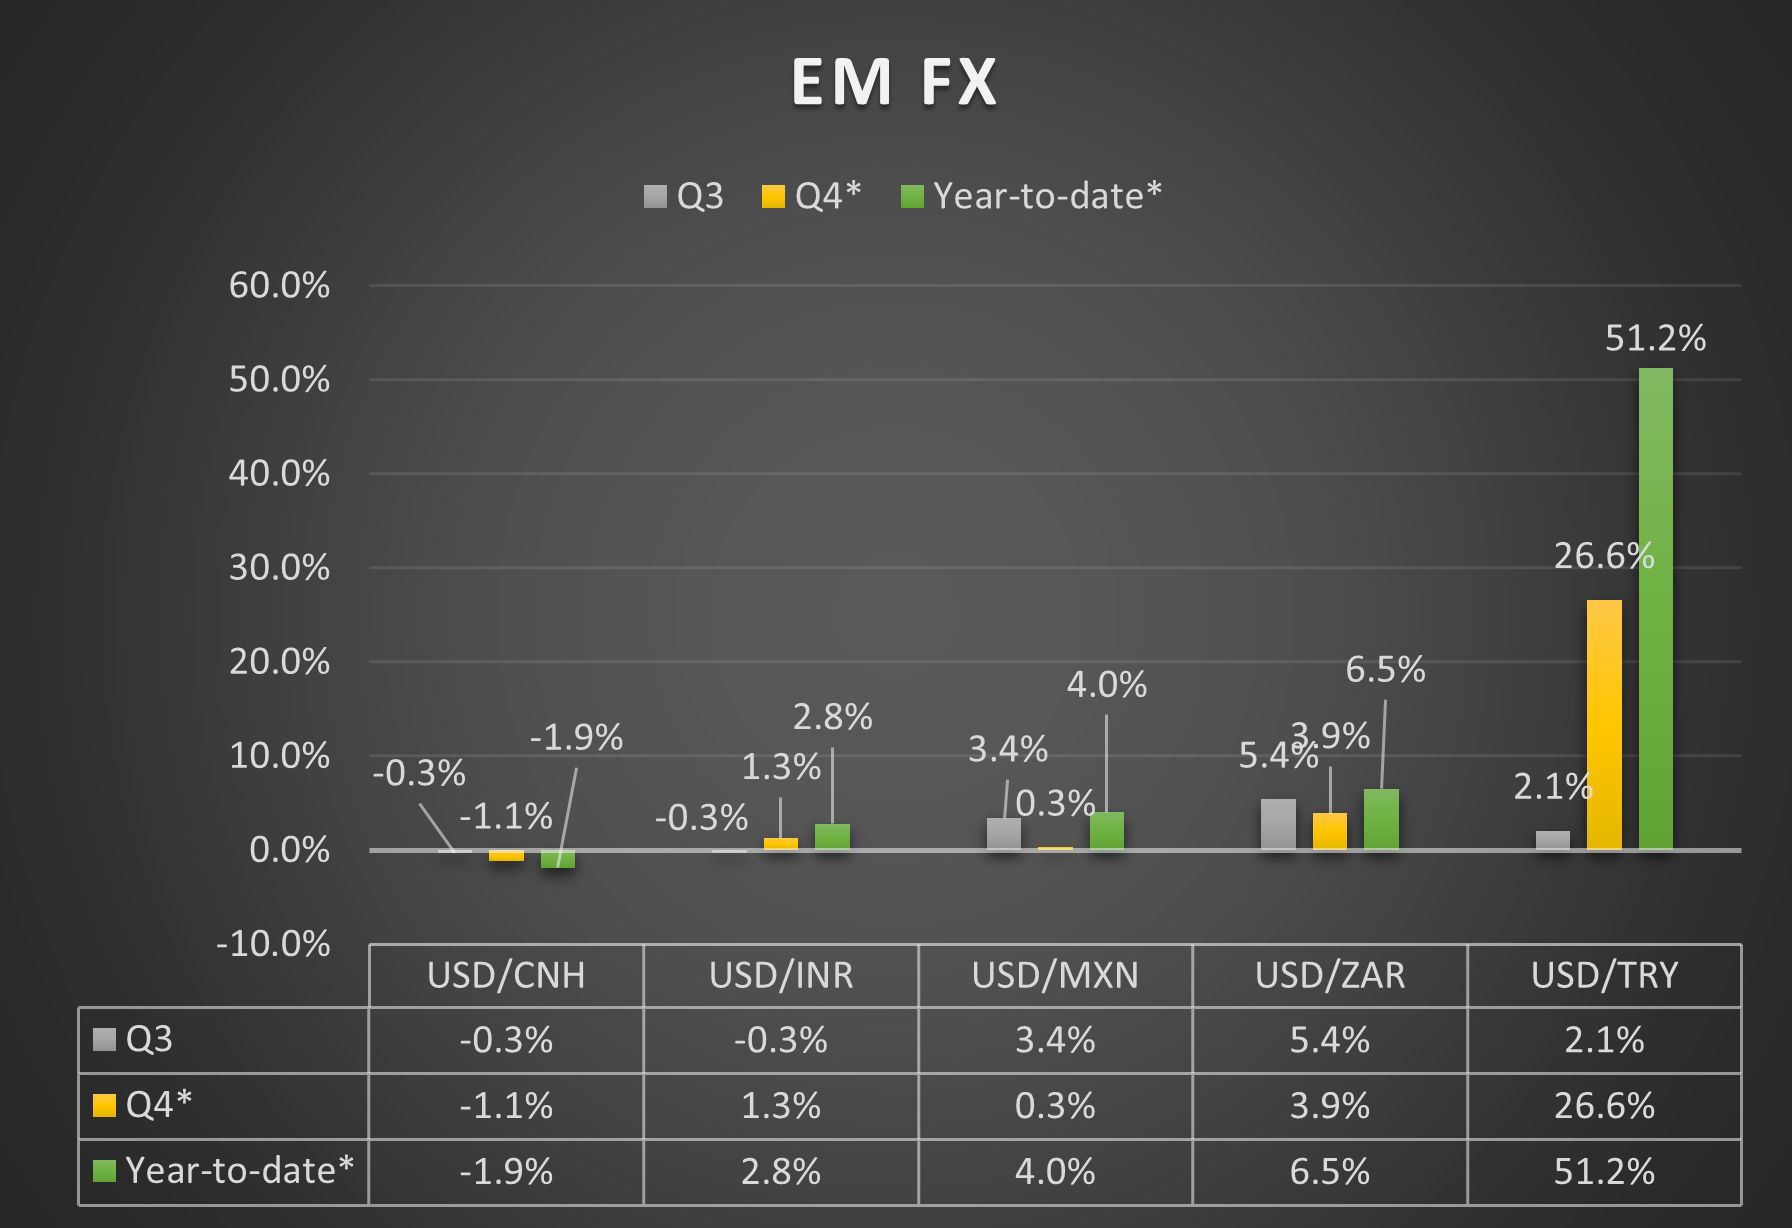
The greenback rose more profoundly against emerging market currencies, most notably the lira. The beleaguered Turkish currency slumped to repeated record lows, as despite high levels of inflation the country’s President Recep Tayyip Erdoğan ordered the CBRT to keep cutting interest rates. Some of the other EM currencies fared slightly better, with the Chinese yuan completely bucking the trend. Overall, though, it hasn’t been a good quarter or indeed a year for EM currencies as a whole:
Source: ThinkMarkets; *prices correct as of 23 December 2021
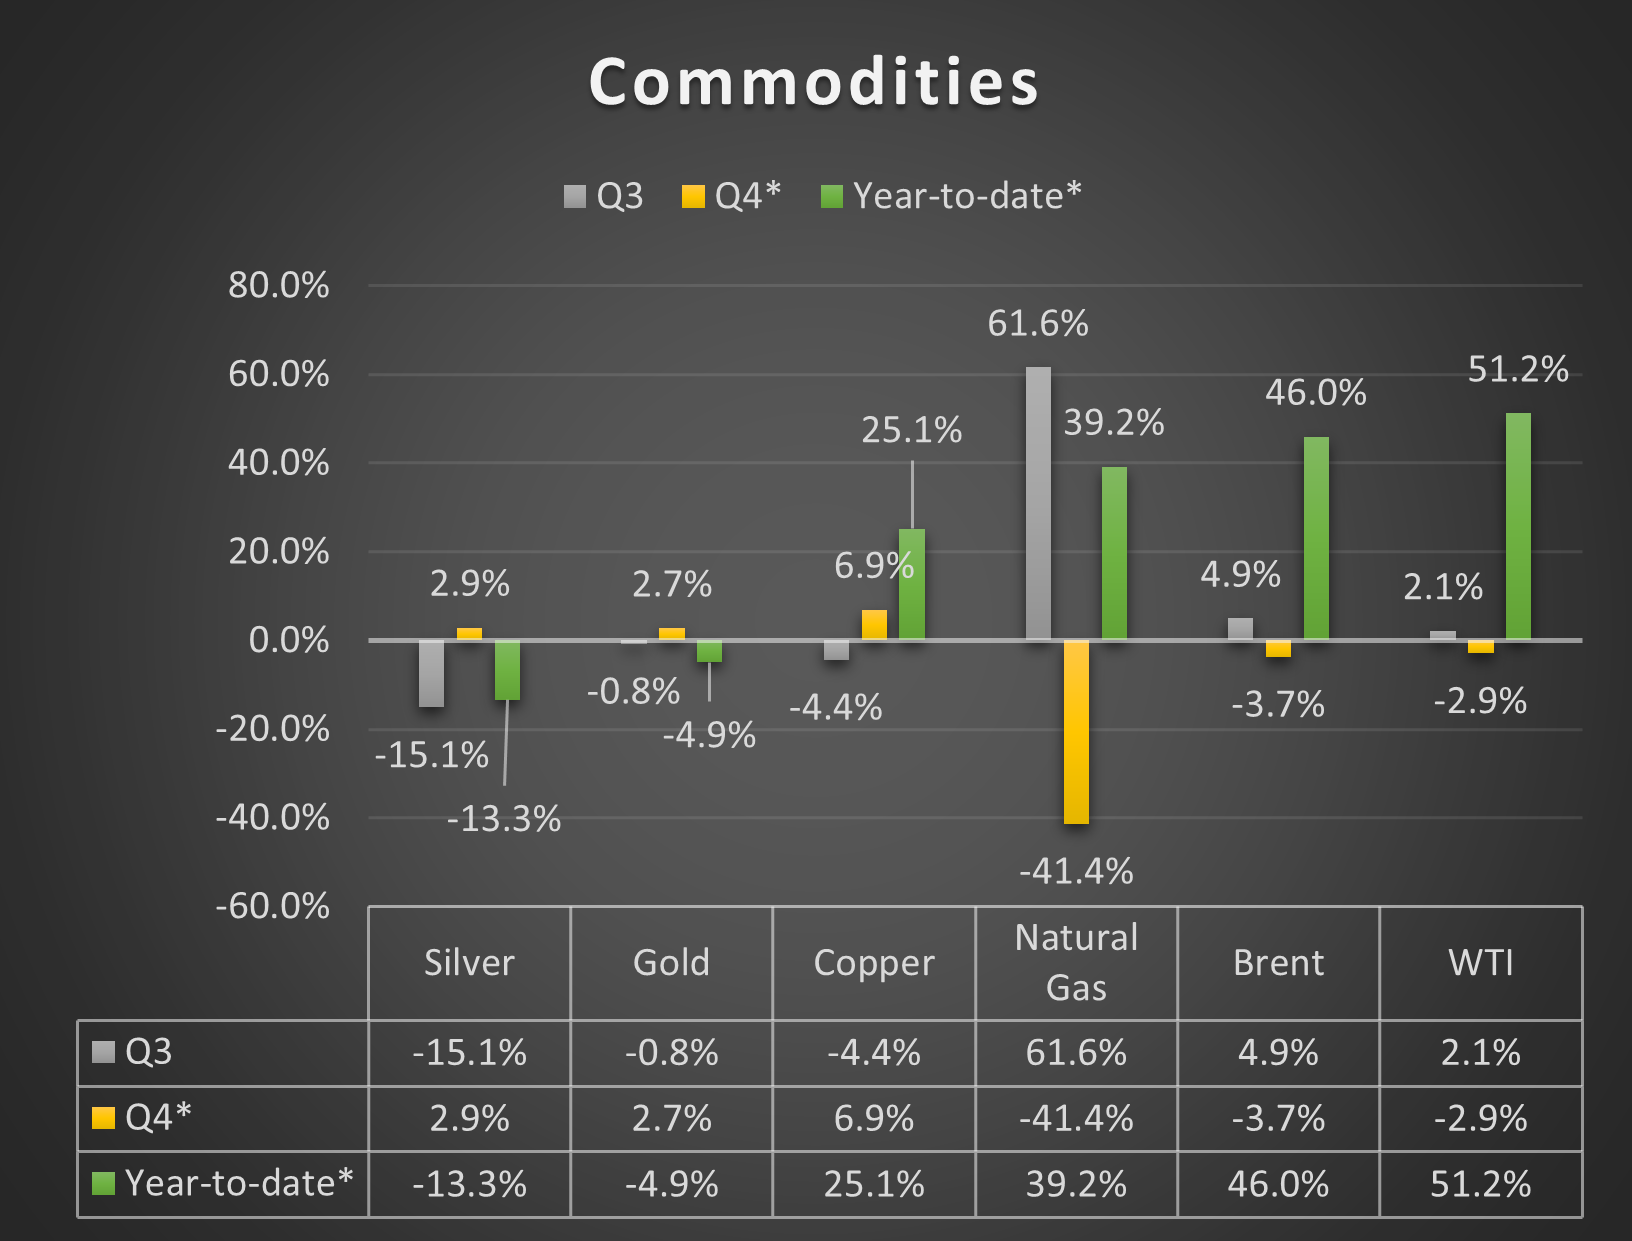
The key drivers behind the currency and equity markets have been inflation, due in part to surging commodity prices and supply chain issues. In the fourth quarter, however, energy prices came back down, and this helped to reduce the overall yearly gains. Precious metal prices have been under pressure all year long due to elevated bond yields and a stronger US dollar, with investors not too keen to buy gold as a hedge against soaring inflation.
Source: ThinkMarkets; *prices correct as of 23 December 2021
Apart from the fact that both the US dollar and global bond yields both rose, the only other reason why gold was disliked was probably due to this:
Source: ThinkMarkets; *prices correct as of 23 December 2021
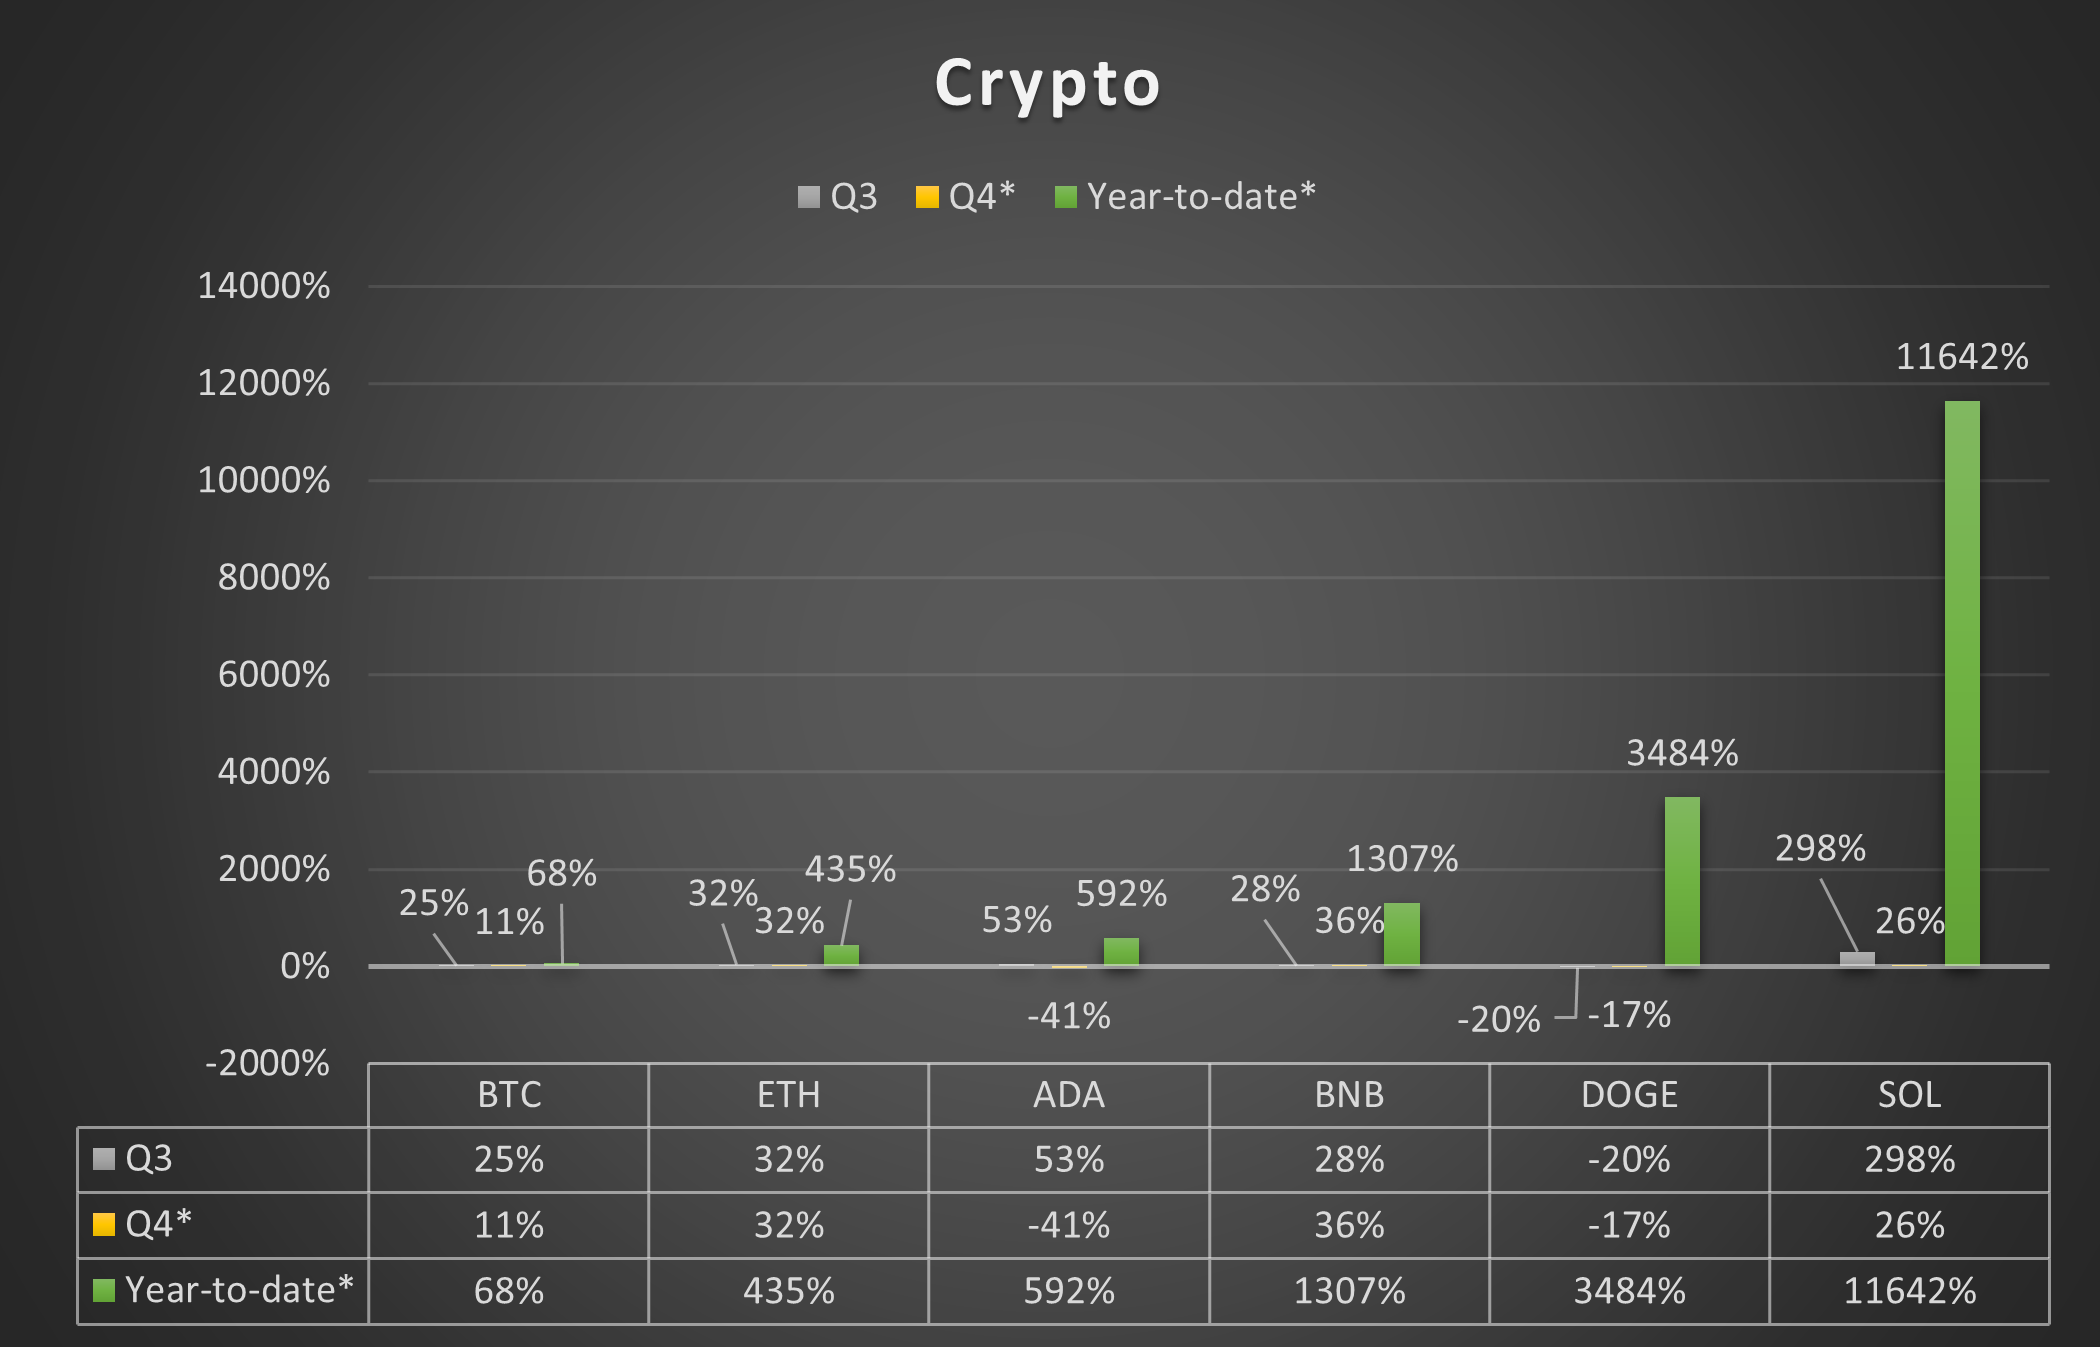
Bitcoin and Etheruem added more to their 2021 gains in Q4, while some cryptos consolidated their gains. Investor appetite remained insatiable for most of the year, although November and December weren’t great months for crypto as risk assets suffered across the board.
Q1 Outlook Overview: Key Drivers
Heading into the first quarter of 2022, concerns over the economic impact of the coronavirus and high levels of inflation will continue to dictate market and policy direction alike. Investors will want to know what steps governments and central banks might take to stem price pressures, and at the same time, keep their respective economies ticking over as the latest covid-linked restrictions weigh on activity. With governments around the world sharply increasing fiscal spending during the pandemic, introducing further stimulus measures without raising taxes will be politically very difficult. Likewise, central banks have pushed themselves into a corner. Surely, they will be less keen to ramp up bond purchases again, with inflation being so high. If anything, the Fed may not even wait until the middle of next year to raise interest rates and could also wrap up bond purchases sooner, if inflation heats up even more in the next couple of months. What the Fed decides will also have big ramifications for the dollar and commodities like gold and silver. Will gold finally respond to inflation, or will the dollar again prove too hot for the precious metal? Elsewhere in commodities, the OPEC+ has a tough decision to make. While oil prices have fallen back a tad, they still remain quite high. The group is set to boost its oil output by another 400K barrels per day in January, but the latest covid-linked travel restrictions could mean a pause in future output hikes. And what about crypto – more of the same or a year of consolidation?
2. Q1 FX & Gold Outlook
By Victor Golovtchenko
The outlook for the first quarter of 2022, is primarily contingent on the actions of the US Federal Reserve, as well as Covid.
How Far Can the Fed Tighten Before Breaking Something?
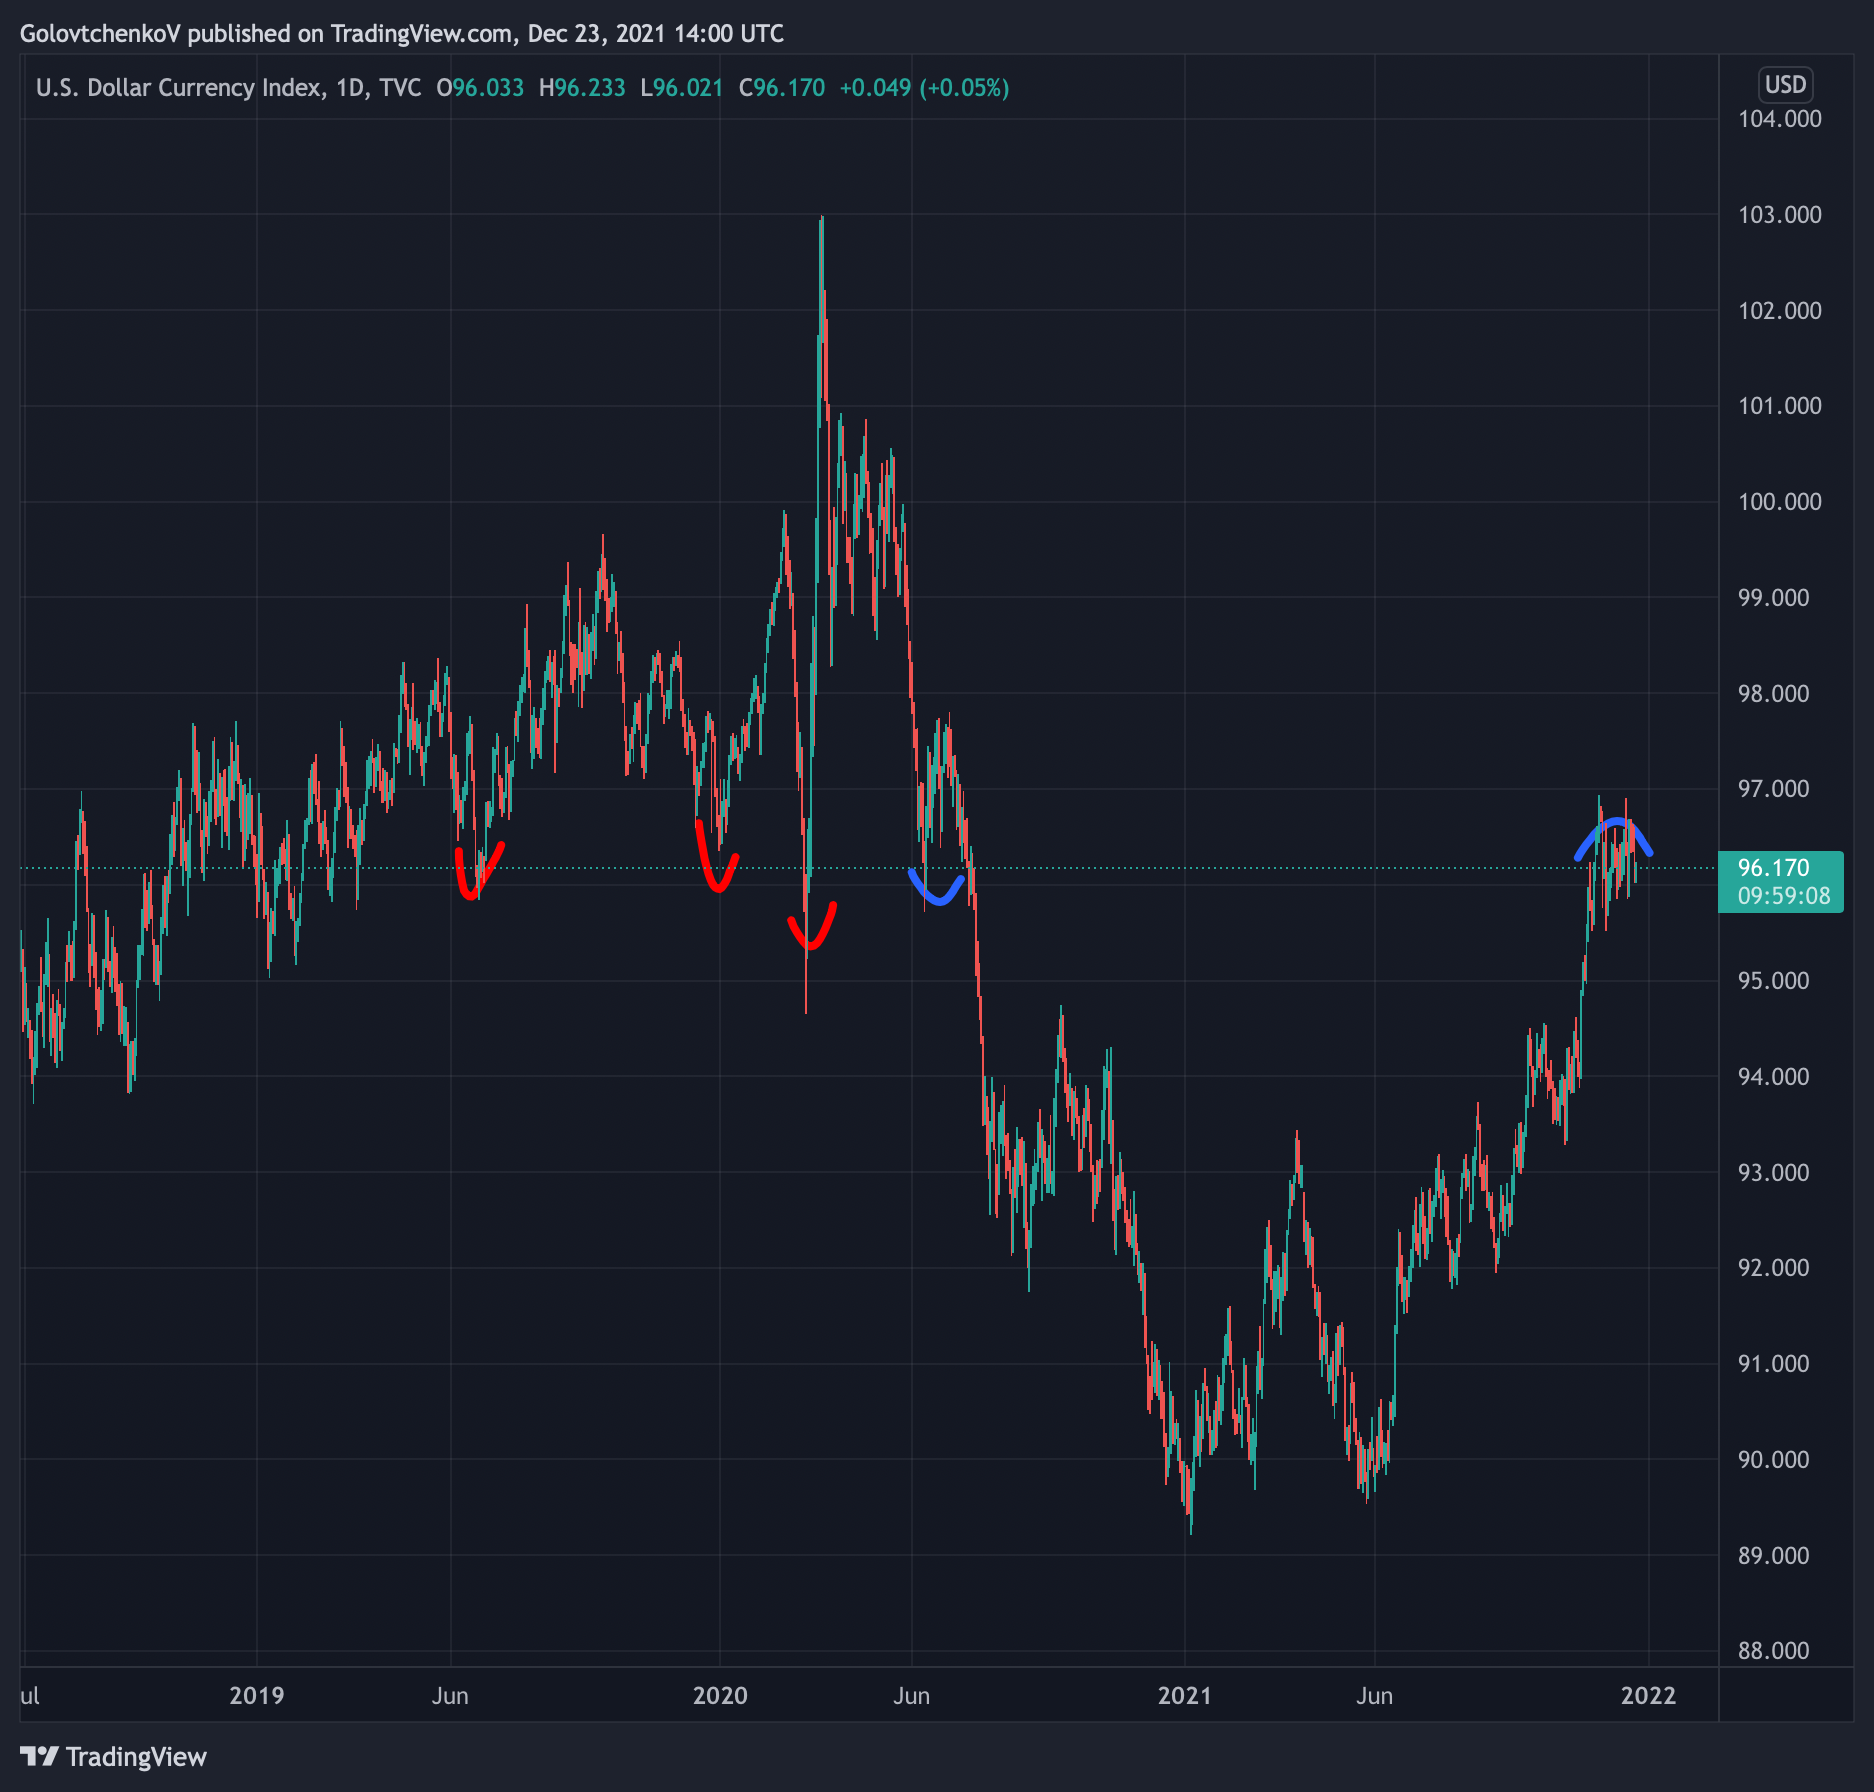
With the USD rally lasting through 2021, the positive news for the greenback appears to have reached a plateau, with more hawkish talk from Fed officials not translating into an even higher exchange rate. Our team considers the best days for the US currency during this cycle to be behind us, though assuming strong macroeconomic data in Q1, we might see another stab higher in the USD index, currently trading around 96.00. The level has proven to be crucial over the past 3 years, and the market is taking a breath of fresh air before attempting a more decisive move above (or below) this strong resistance area.
Dollar index daily chart:
Source: ThinkMarkets and TradingView.com
BoE hikes and UK government provides more support
The first major central bank to hike rates was in fact the Bank of England and while it took a couple of days, the GBP rallied across the board, torpedoing the rest of the FX market into a defensive stance. The continuously evolving coronavirus is still the main concern for the UK economy, though fiscal measures targeting businesses affected most by the latest pandemic developments, were unveiled by Chancellor the Exchequer, Rishi Sunak, last week. The announcement coincided with the lows for the GBP, which gave back all of its rate hike-related gains in the two subsequent sessions.
ECB reluctantly turns slightly hawkish
The euro appears to be on the defensive against most major FX counterparts, and rangebound against the USD. ECB and BOJ policymakers have been reluctant to shift their tone to a more hawkish one, remaining the only major central banks to stay pat in the face continuously rising inflation pressures. Mrs Lagarde will have to continue walking a tight rope, as the health of the European banking system is much different when compared to across the Atlantic. Her dovish stance was recently reinforced, but the appointments of a new Head of the Bundesbank who’s expected to be quite hawkish, provided some temporary relief for the EUR bulls in recent sessions.
Commodity FX vulnerable
Commodity currencies appear to have bottomed out for now, as the market awaits more macroeconomic cues that could influence commodities markets. With almost all of the major central banks on their way to tighten monetary policy, a risk-off episode could still supply some upside for the USD, and pressure commodities and antipodean currencies (AUD, CAD, NZD). Stocks continue trading near all-time highs both in terms of nominal value, and valuations.
Gold outlook remains murky
Gold continues to trade in tight ranges, and in anticipating that the Fed will sooner or later “break” the liquidity pipeline, any selloffs are met with swift demand. While the majority of market players remain bullish on precious metals, a liquidity-driven selloff could also briefly impact this sector of the market. That said, gold bulls couldn’t have prayed for a better scenario for a multi-year bullish breakout, yet the current macro environment is still not yielding a decisive breakout above $2000. Ultimately it will all come down to monetary policy once again.
Damned if they do, damned if they don’t
The US Federal Reserve is in the unenviable position to choose between persistently high inflation numbers, and persistently overvalued financial markets that support the economy. The fiscal impulse appears to be waning and inflationary pressures in 2022 are unlikely to match the ones we’ve seen over the past two years. Even without monetary tightening, the fiscal side of policy is already enough to slow growth materially in the first half of the coming year. Chair Powell has been persistent in communicating to the market that policy is about to tighten, and some market players are forecasting the first hike as early as March.
Financial markets are currently pricing in three hikes for next year - March, June and Dec. A fourth hike in the beginning of 2023 is also on the cards. All of this while the midterm elections are incoming next year, and the democrats are likely to lose the House and get pressured hard in the Senate. Should this scenario unfold, the fiscal impulse until 2024 is unlikely to be positive for the stock market - yet another nail in the coffin of risk sentiment.
Keeping a close eye on the yield curve, and an inversion that usually signals that the Fed has indeed overtightened - usually just the time when the USD starts turning. To sum up - the key for the outlook for the USD during the first months of 2021 is how far can the Fed really tighten before breaking something. As the economic cycle turns, the last bouts of strength in the greenback will inevitably disappear and a new cycle of weakness could ensue.
3. Q1 Crude Outlook: Risks skewed to downside
By Fawad Razaqzada
In the fourth quarter, oil prices ended a run of six straight quarters of wins, although managed to rebound sharply in December as preliminary data showed that omicron is comparatively less dangerous than delta. Still, the very rapid spread of the new variant saw governments take measures to slow the spread. Many European countries banned travellers from the UK, while Chinese authorities locked down a city of 13 million people. There has been some resistance to more severe curbs in the US and Europe. Whether that resistance holds or folds, will depend on how the virus situation will evolve in the coming weeks.
Demand for oil has likely weakened somewhat already due to the travel restrictions, while supplies have continued to grow. This means that the pressure on oil prices are likely to ease back if the OPEC+ goes ahead with its planned output hike of 400K barrels per day of oil in January.
Beyond the immediate outlook, I cannot see how crude oil prices will rise significantly further. The OPEC+ remains committed to gradually release more oil to the market in 2022, for as long as the worst-case scenario from the pandemic does not play out.
Growth in demand could also slow because of (1) EM currency crisis in several oil-importing nations as USD extends its rally and (2) supply bottlenecks and the return of lockdowns could undermine the economic recovery in more developed economies, at a time when fiscal and monetary polices have already been – or nearly – exhausted. Meanwhile, US oil supply is on the rise again. The crude oil market is thus unlikely to remain tight, meaning prices could weaken somewhat.
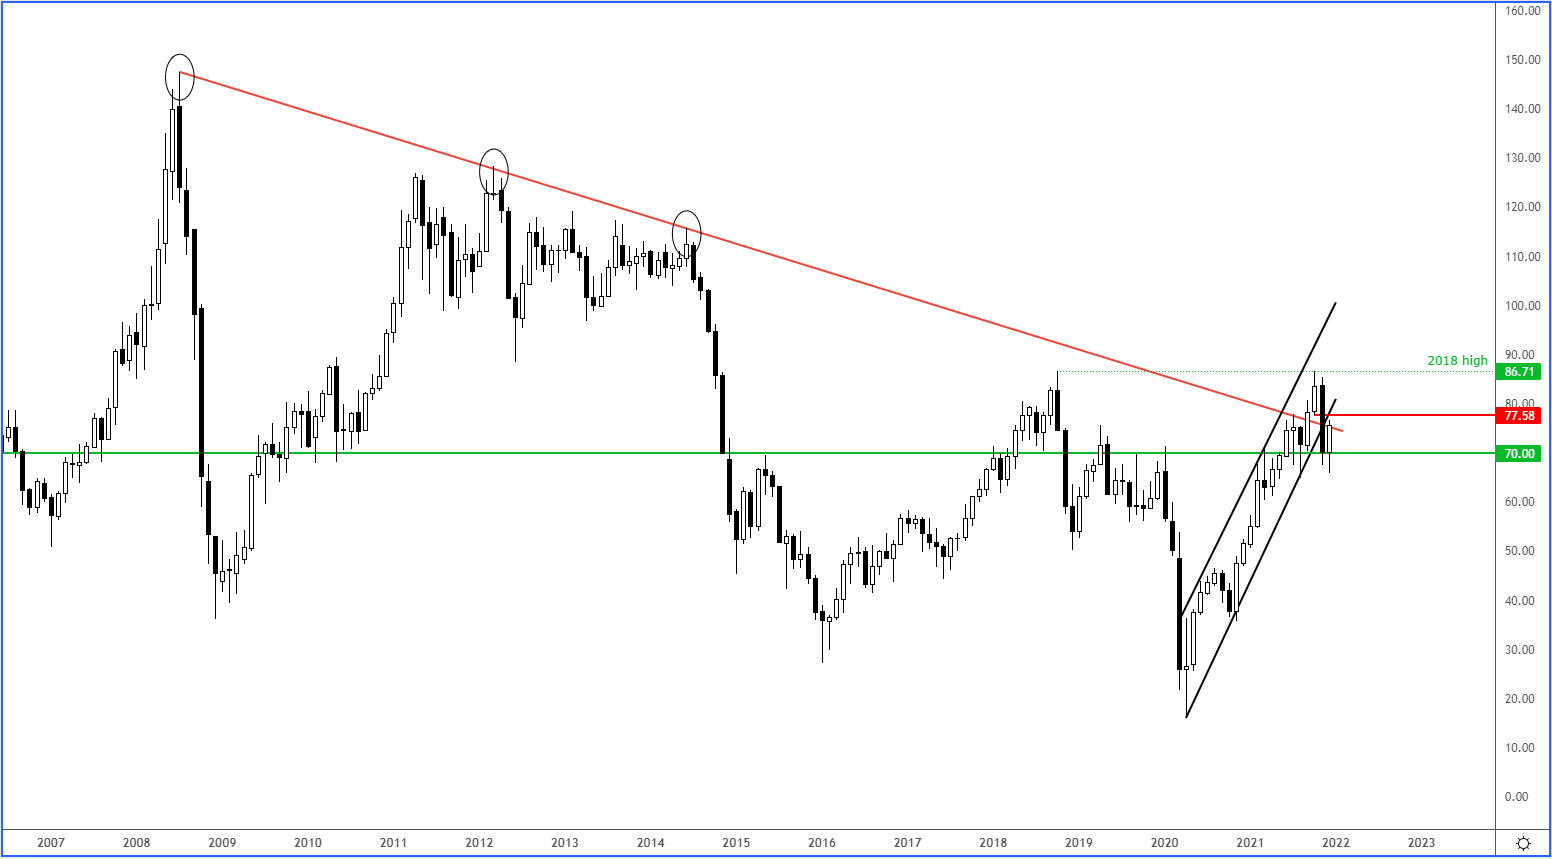
From a technical point of view, the $70 support is going to be pivotal for Brent oil prices. However, Brent’s long-term bearish trend line has been reclaimed by the bears, which means short-term rallies could get sold into as you can see on this monthly chart:
Source: ThinkMarkets and TradingView.com
4. Q 1 Global Stock Market Outlook
By Kearabilwe Nonyana
In the beginning of Q4, global markets were on a positive ground as US earnings for global tech companies were predicted to increase and show robust growth. What was revealed was even better, as US tech giants surprised with their third quarter results, spurring on US indices to hit fresh high and helped to keep sentiment supported for global markets. Apart from surging inflation, the other most common theme in the last quarter of 2021 was the market’s fascination with what the FOMC implied with its rhetoric on monetary policy and the path of future interest rates. The Fed has alluded that it will taper bond buying, although this does not necessarily mean the taps on bond buying will be shut completely. I expect high levels of liquidity to still impact the performance of the equity capital markets across the globe, as the search for inflation-beating returns are sought after by investors.
Looking ahead to Q1
Below, I have discussed some of the important themes which could impact the stock markets in Q1 2022, and potentially beyond.
Inflation outlook
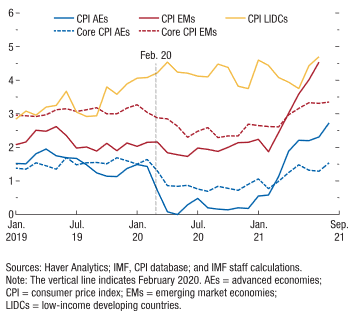
In recent months, inflation has increased sharply in advanced as well as emerging market economies. Price pressures have been driven largely by (1) strong demand as economies re-opened, (2) supply chain shortages and (3) rapidly rising commodity prices. Many market participants have been at loggerheads as to how to interpret the hotter-than-expected global inflation on monetary policy and in turn stock markets. There have been extensive debates as to the nature of the inflation – is it structural and long-term, or is it short-term and transitory? In my opinion, longer term inflation expectations are anchored and do not pose any threat to price stability. That said, the shorter-term movements of risk assets will be largely dependent on how changes in monetary and fiscal policies are communicated to the market. The problem which I have observed is that central banks and governments are finding it difficult to communicate effectively with the market as to how they are seeing inflation and how they will react.
CPI data for various country groups as given by the IMF:
Bond yield attractiveness
In the search for yield in the past 2 years, the equity market has had very little competition. Bond yields were at all-time lows as open market operation pushed them to near- or sub-zero; accommodative monetary policy led to different asset classes such as cryptos being the only competition for equities. With central bankers alluding to tightening monetary policy, this makes bonds attractive for yield-seekers. As yields rise, equities will become increasingly risky given their extremely high valuations. Some investors will start preferring the relative safety of bonds given that they are now providing an attractive alternative in terms of yields compared to, for example, the US technology sector. However, not all sectors will be negatively impacted by rising yields. Banks and financial stocks tend to do well when bond yields are on the rise.
Trend is your friend
Global equity markets are still in an upward trend even though many indices around the world have reached all-time highs. The threats to global supply chains still linger in the forefront to any positive gains in the first quarter and threats of the contagion effect of the spread of the Omicron variant. But looking at consensus forecasts of earnings being on the upside, the market will take favourably to corporates performing well and reward the ratings on the stocks that do well.
Volatility
The spread between the cash VIX and longest dated, most active, futures contract which is dated for end of February has shown a larger than expected divergence recently. This is usually an indicator of higher expected volatility or change in sentiment. The VIX is still very far off its highs at the beginning of the pandemic but is edging higher, so expect a spike in short term volatility in Q1. Even so, I still anticipate that global markets remain at elevated levels and positive returns on global stocks will be seen in 2022.
Overbought
From a technical point of view, all the major indices appear overbought on their longer-term chart. For example, take a look at the RSI on the monthly chart of US30, which it is reaching technically overbought territory of around 70:
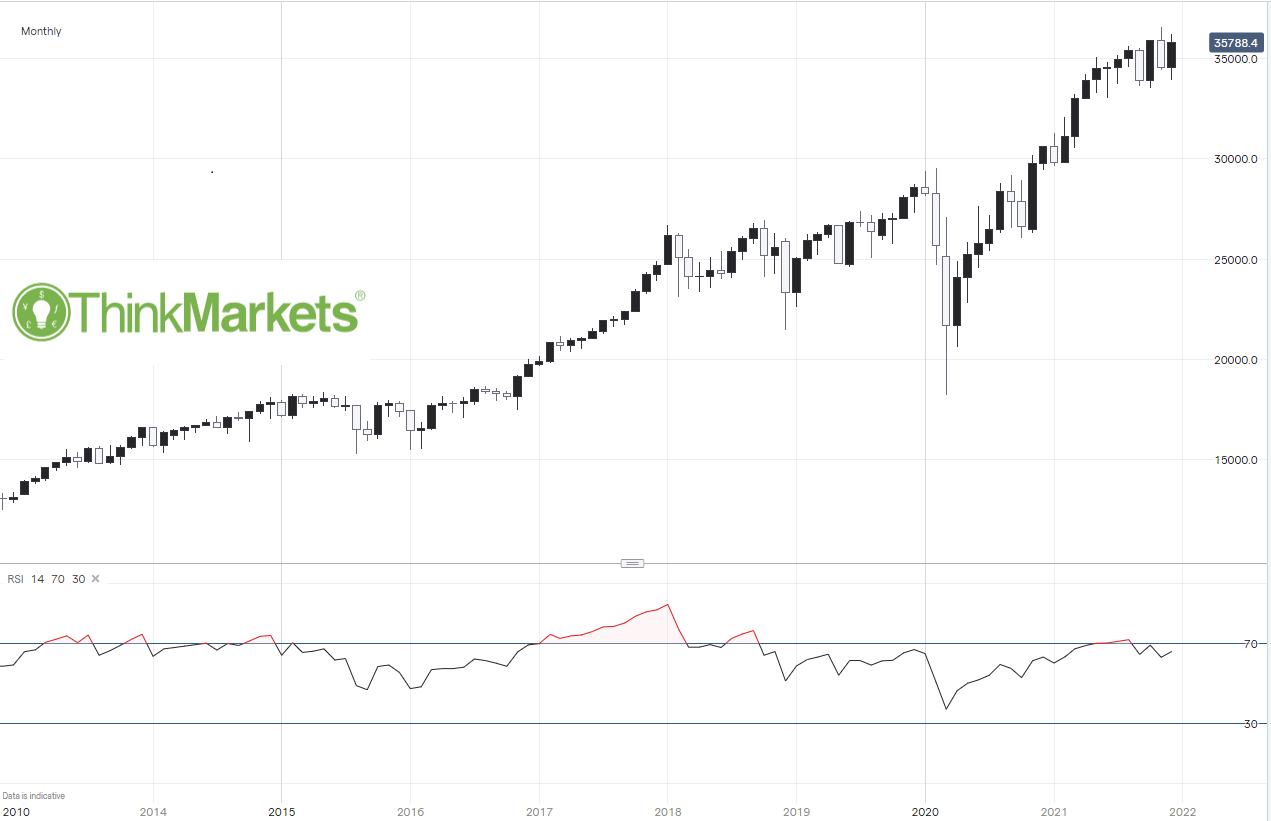
Though it has had a correction in the past month as fears of the omicron variant threatened to slow down economic growth, it remains to be seen whether we will see some further short-term weakness. With that correction, the market already took some opportunity to come back and buy the dips.
5. Q1 Crypto Outlook
By Carl Capolingua
Quite a bit has happened since our last quarterly crypto update, but activity and volatility is what we have come to expect from this exciting asset class! Here are the key developments from the last three months, and then we'll conclude with a look ahead to the factors that may impact cryptocurrencies in the first quarter of 2022.
Finally, a Bitcoin ETF, but spot-based product is elusive
The first bitcoin-based ETF commenced trading on the New York Stock Exchange on October 18. The ProShares Bitcoin Strategy ETF tracks the movement of a number of Bitcoin futures contracts. Whilst Bitcoin prices saw a strong run-up in anticipation of the launch, the lack approval of a spot-based Bitcoin ETF was seen as a disappointment by many, and potentially acted as a catalyst for the subsequent correction in Bitcoin prices.
As of now, there are three bitcoin ETFs trading in the U.S. with at least two spot-based products under consideration by the SEC (they have rejected two spot bitcoin ETF proposals in recent weeks, one from Wisdom Tree, and one from Van Eck). The rejects will no doubt end up back on the SEC's desk before too long and will join other spot-based hopefuls Grayscale's Bitcoin Trust and Bitwise's Bitcoin ETP which have decisions pending in early February 2022.
Take me down to Bitcoin City…
After its official adoption of Bitcoin as legal tender in Q3, El-Salvador kept buying the dip trough Q4. President Nayib Bukele tweeted multiple times over the last couple of months that his country continued to build its Bitcoin reserves on price weakness. Interestingly, as the price of Bitcoin has settled firmly in the doldrums below the psychological US$50k mark, it appears the dip buying has stopped for now.
In other ES developments, Bukele proposed in late-November his country would build a new city dedicated to Bitcoin mining. The mining would be powered by volcanic energy as the city, dubbed "Bitcoin City", would sit at the base of one of El-Salvador's active volcanos. Citizens of Bitcoin City would be free of income, property, and capital gains taxes. El-Salvador intends to issue $US1billion of "volcano bonds" to pay for building the city, of which half would be directed to buying Bitcoin.
JP flips, crypto dips
Bitcoin started Q4 with a rocket underneath it as it as many investors began to assume US$100k by years' end. Typically, when the market gets that confident, a correction is generally in the cards, and this time was no exception. Whilst it did take out its April all-time-highs, Bitcoin faltered just under US$70k and has since steadily declined into the mid-US$40k's. Looking forward, investors can look elsewhere until Bitcoin breaks back above at least US$51k.
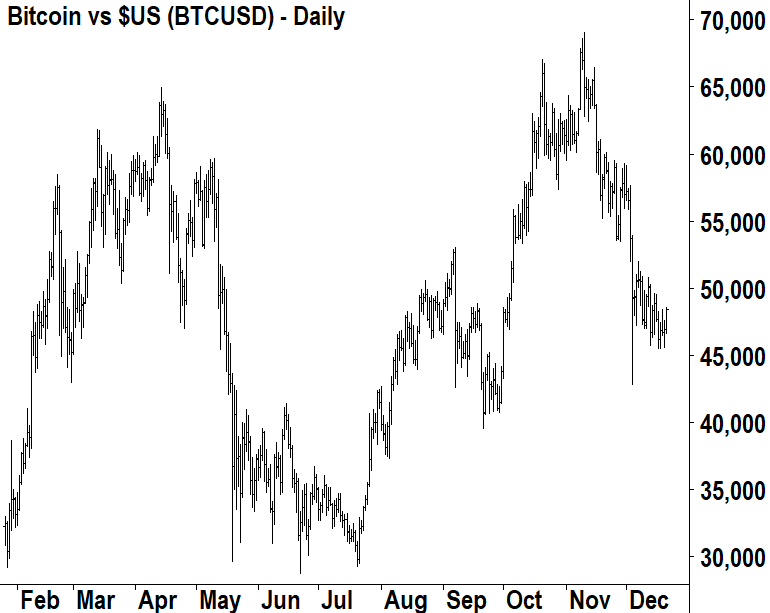
Working against Bitcoin and the broader cryptocurrency universe was a major hawkish tilt by US Federal Reserve Chairman Jerome Powell. The flip followed significantly worse than expected inflation data throughout the quarter, and perhaps not coincidentally, his reappointment as Fed chairman for another 4-year term. Bitcoin, and indeed cryptocurrency as an asset class, remains a confidence and liquidity game. As the Fed looks to remove liquidity from the financial system, this is expected to have a negative impact on the availability of hot money that has sought out these highly volatile assets throughout 2021.
Fed policy will no doubt be a major stumbling block for crypto in 2022, and crypto investors will have to be on their toes watching for signs liquidity is going to be removed from the system faster than originally expected. The next Federal Open Market Committee (FOMC) meeting, and therefore catalyst for further crypto volatility, is tentatively set for January 25-26 2022.
ADA, DOT, LINK slip, AVAX, LUNA gain on DeFi
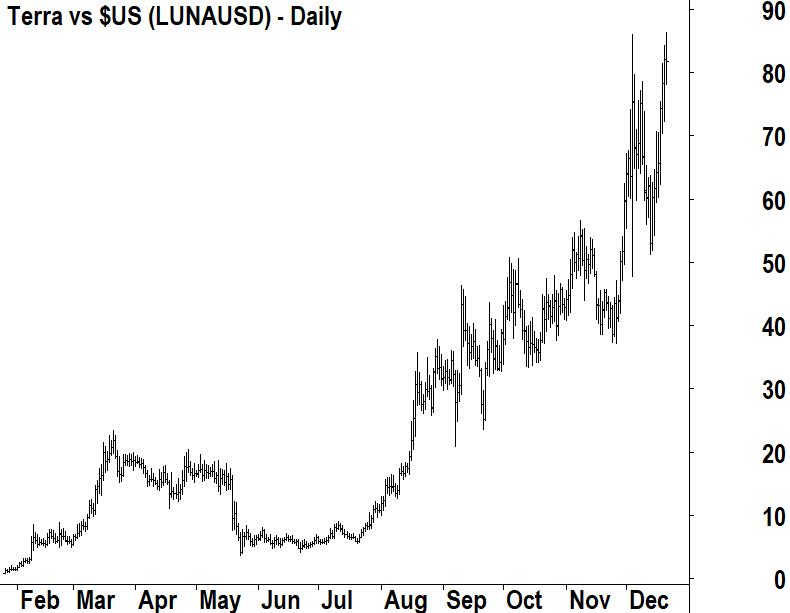
The vast majority of altcoins suffered fates far worse than Bitcoin approximate 30% fall during Q4. In the Top 20, Cardano's ADA (-44%), Polkadot's DOT (-60%), and Chainlink's LINK (-50%) were the worst performers. Two altcoins that prospered however, were Avalanche's AVAX (+77%) and Terra's LUNA (+113%). Each saw a steady increase in the amount of DeFi activity appearing on their blockchains.
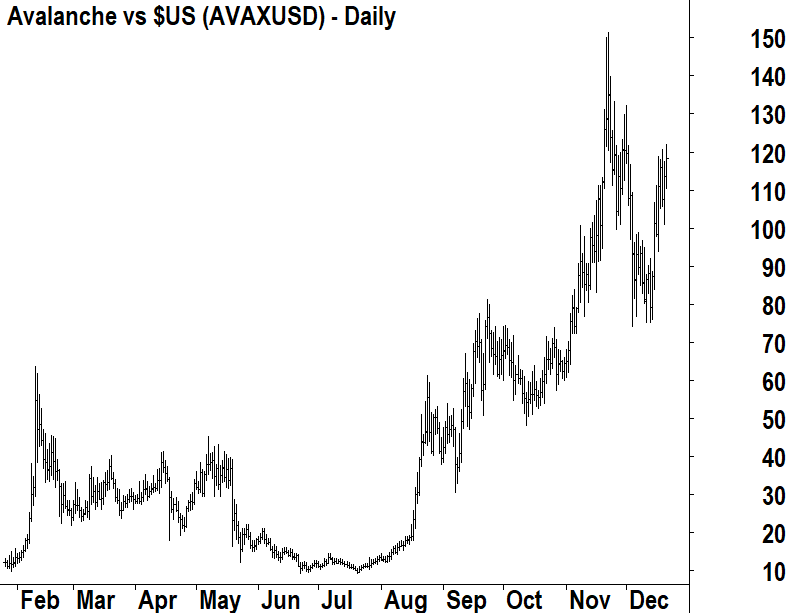
One of the most commonly used metrics for measuring DeFi adoption on a particular blockchain is "Total Value Locked" or TVL. Avalanche's TVL rose from 2.1% at the end of Q3 to just over 5% at the time of writing, while Terra's TVL increased from 4.9% to 7.5%. Both blockchains took market share from DeFi juggernaut Ethereum, which saw its share of the TVL pie fall by around 4% over the quarter. Both the technicals, and the TVL trends for AVAX and LUNA remain strong, so crypto investors may wish to pay closer attention to them in Q1 2022.
2022 is going to be all about the 'R' word
It's perhaps inevitable (famous last words!) that we'll see a spot-based Bitcoin ETF in 2022, and all eyes will be on the SEC's decisions for Grayscale's and Bitwise's offerings on Feb 6 and Feb 1 respectively.
More broadly, the SEC has taken an increasingly tougher stance on cryptocurrencies and cryptocurrency businesses over the course of Q4. This is likely to continue into 2022 as Chair Gary Gensler has indicated that he wants extra layers of protection put in place for crypto investors. At the Yahoo.com All Markets Summit held in late October, he said: "Investors aren't protected the way they are [in the] the stock or bonds markets that we've overseen so long. Without that, I think it really is…a bit of the Wild West."
Elsewhere, Russia's stance towards its citizens holding crypto assets appears to be hardening with rumours the Central Bank of Russia is considering a total ban on the acquisition of crypto assets. But, in Australia, Federal Treasurer Josh Friedenberg a mooted a "comprehensive payments and crypto-asset reform plan" which could be finalised by the end of 2022.
Clearly the crypto market needs more regulation to protect investors and provide safeguards in the event of nefarious activity. It is an important step towards the widespread adoption of crypto as an asset class. We expect 2022 is going to be a defining year in crypto regulation as a number of governments move closer to backing up their rhetoric with legislation.
Quiet Equity Trading Session Seen Amid Holidays and Dearth of Major Weekend News
General trend
- 2-yr UST yield trades slightly higher following holiday, 10-yr yield moves slightly lower.
- Modest decline seen for WTI Crude FUTs.
- US Natural Gas FUTs rise by >4.5%.
- US equity FUTS have remained slightly higher.
- Nikkei 225 eased after opening flat; index heavyweights decline [Fast Retailing, Softbank Group].
- Shanghai Composite erases slight advance.
- AU and NZ markets resume trading on Wed (Dec 29th).
Headlines/Economic Data
Australia/New Zealand.
- ASX 200 closed for holiday.
- (AU) South Australia reimposing some COVID restrictions, with record COVID cases over Christmas break.
Japan
- Nikkei 225 opened 0.0%.
- (JP) Bank of Japan (BOJ) Summary of Opinions for Dec Meeting: Sees CPI rising moderately into positive territory in the short run due to rise in energy prices.
- (JP) Japan PM Kishida cabinet approval rating +4ppt to 65% - Nikkei.
- 6503.JP Japan Defense Ministry: Cyberattack in January last year included data files that may impact Japan's national security – press.
- (JP) JAPAN NOV RETAIL SALES M/M: 1.2% V 1.3%E; Y/Y: 1.9% V 1.7%E (3rd consecutive increase); ex-fuel -0.5% y/y.
- 9843.JP Reports 9M Net ¥75.7B v ¥76.7B y/y, Op ¥108.0B v ¥118.5B, Rev ¥606.2B v ¥540.2B y/y (reported Friday, shares down -9.5%).
- (JP) Japan MOF sells ¥3.0T v ¥3.0T indicated in 0.00% 2-year JGBs: Avg Yield: -0.093% v -0.121% prior; bid-to-cover: 4.25x v 4.05x prior.
- (JP) Japan Industry Ministry: To hold auction on Feb 9th to sell 100K kilolitres of oil from national reserve.
Korea
- Kospi opened +0.1%.
- (KR) South Korea Fin Min Hong: Seeking to submit application for Comprehensive and Progressive Agreement for Trans-Pacific Partnership (CPTPP) in April.
- (KR) South Korea President Moon calls on companies like Samsung to quicken the rate of youth employment.
China/Hong Kong
- Hang Seng closed for holiday; Shanghai Composite opened -0.1%.
- (CN) China PBoC quarterly meeting: Pledges more support for the real economy along with more "proactive" use of policy tools, which is more targeted and autonomous; reiterates prudent policy to be flexible and appropriate.
- 2382.HK Sunny Zhejiang Optics and others subscribe for capital of CNY22B by way of capital injection into Sunny Optical Technology.
- (CN) China Nov Industrial Profits Y/Y: 9.0% v 24.6% prior.
- 3333.HK Chairman Yann: Will deliver 39K units of properties in Dec v less than 10K from the last 3 months combined.
- (CN) China PBOC sets Yuan reference rate: 6.3686 v 6.3692 prior.
- (CN) China PBOC Open Market Operation (OMO): Sells CNY50B in 7-day reverse repos v CNY10B prior; Net inject: CNY40B v CNY10B prior.
- (CN) China approved 3 new IPOs for ChiNext board - Xinhua.
- (CN) China said to be considering to cut 2022 GDP Growth target to 5.5-6.0% - Nikkei (Friday after the close).
- (HK) Authorities removed a part of the "Pillar of Shame" statue by Danish sculptor Jens Galschiot which paid tribute to the victims of the Tiananmen Square crackdown in Beijing, at the University of Hong Kong, the remainder of the statue was covered – press.
- (CN) China CSRC (securities regulator) issues market consultation on overseas listing rules: qualified VIE structures will be eligible for listing.
- (CN) China Ministry of Finance (MOF): To implement bigger tax, fee cuts in 2022, fiscal spending to be more targeted in 2022.
Other
- (TR) Turkey President Erdogan said to have told his economists Turkish lira (TRY) to appreciate slowly – press.
North America
- (US) US airlines have cancelled additional 1,000 flights Sunday due to COVID infections impacting staffing.
- MA Reports holiday shopping sales from Nov 1 to Dec 24th +8.5% y/y.
- REGN US has halted the distribution of Regeneron and Eli Lilly COVID antibody treatments, cited omicron efficacy concerns - US financial press.
Europe
- ROG.CH COVID-19 At-Home Test granted FDA Emergency Use Authorization to expand access to rapid self-testing solutions in the United States.
- (RU) According to Germany's Gascade, on Dec 26th Yamal-Europe pipeline (delivers Russian gas to Western Europe) was sending the fuel back to Poland for 6th consecutive day – press.
- (RU) Russia President Putin: Efforts to contain inflation must be continued; European Union can only blame its own policies for record gas prices as some of its members resell cheap Russian gas at much higher prices within the bloc.
Levels as of 00:15ET
- Hang Seng closed for holiday; Shanghai Composite -0.2%; Kospi -0.4%; Nikkei225 -0.4%; ASX 200 closed for holiday.
- Equity Futures: S&P500 +0.1%; Nasdaq100 +0.2%, Dax -0.1%; FTSE100 +0.1%.
- EUR 1.1326-1.1311; JPY 114.47-114.31; AUD 0.7242-0.7222; NZD 0.6828-0.6801.
- Commodity Futures: Gold -0.1% at $1,810/oz; Crude Oil -0.9% at $73.16/brl; Copper -0.7% at $4.37/lb.
Festive Season Dominates Asian Markets
With Hong Kong and Australia closed today, along with the UK this afternoon, and a number of secondary locations, it is hardly a surprise that Asian markets are quiet today. The weekend headline newsreel was relatively quiet. Omicron cases are surging in the US and Europe, and although markets have well and truly priced in a less virulent strain, the disruption to goods and services from isolating workers, notably air travel, seems to be the main fallout so far. That is only likely to cause short-term nerves, with the global recovery story for 2022 still on track. The divergence between Brent and WTI this morning can likely be laid at that door.
In China, Industrial Profits rose by a healthy 38% (YTD) YoY Nov versus 42% for October, but well above the forecast 34%. Uncertainty in the property sector continued to be a drag in otherwise broadly strong data sector-wise. On that note, the PBOC on Saturday said that they would safeguard the legal rights of home buyers and provide greater support for the real economy. The targeted stimulus is a theme in recent times from China, as opposed to previous Stimulus strategies. Reuters also reported that Evergrande had made progress restarting home construction and that its Chairman said it would deliver 39,000 units in December. That batch of positive news, though, is being offset by increasing omicron cases in China, leaving markets in a holding pattern.
The data calendar globally, is unsurprisingly, fairly thin this week, especially for tier-1 releases. Headlines will continue to dominate intraday moves in thin trading. For Asia, the highlight will be on Friday when China releases official Manufacturing and Non-Manufacturing PMIs. The recent fall in industrial commodity prices should boost Manufacturing, while Non0-Manufacturing looks vulnerable to downside risks around consumer sentiment and virus restrictions.
Otherwise, experience tells me this week will be a feast or a famine, with little in between. Either the headline reel will spur ugly intraday moves on holiday-thinned liquidity, or volatility will remain so flatline, that if it were an ECG, the doctors and nurses would be yelling code blue. In the meantime, pondering how to make the best use of Christmas leftover food may be a more productive course of action.
On one final note, I would like to acknowledge the passing of Arch Bishop Desmond Tutu over the weekend. I had the privilege of spending a couple of hours with him as part of my MBA in Cape Town in 2014. A formidable intellect, a kind heart, a patriotic South African and a great sense of humour was my overriding impression. I know this as he made me stand in the corner facing a wall for a while for being a Kiwi, as penance for the All Blacks beating the Springboks in rugby. He gave his heart to try to heal South Africa and gave more to society as a whole than he ever took. We need more people like him in the world. R.I.P Archbishop Tutu, it has been an honour.
Asian equities hover between slightly mixed and unchanged
Asian equities are off to a quiet start this week, with little in the way of concrete drivers from the weekend to drive price action, Australia, New Zealand, and Hong Kong markets closed, as well as the UK this afternoon. With volumes holiday-thinned, the Nikkei 225 is 0.25% lower, while the Kospi is down 0.10%.
Mainland China is slightly in the green after positive headlines from Evergrande and the PBOC over the weekend, which is being tempered by rising virus cases. The Shanghai Composite is 0.18% higher, and the CSI 300 has eked out a 0.05% gain.
Regionally, Singapore is unchanged while Kuala Lumpur has gained 0.65% and Bangkok 0.20%. Taipei is 0.86% higher, with Manila down 0.10% and Jakarta up 0,15%. US futures have restarted trading today and are having a quiet session as well. Nasdaq futures gained 0.25%, S&P 500 futures 0.10%, while Dow futures are unchanged. It looks like only bored Minnesota dentists are playing in the space today.
Short of a headline surprise, I expect Europe to follow much the same pattern this afternoon.
US Dollar trades sideways
Currency markets are in holiday mode and will likely remain so until the middle of next week. The dollar index barely changed from Friday at 96.11, marking three days of sideways trading. If anything, the US Dollar looks vulnerable to positive headlines still on the virus front this week with support between 95.80 and 95.85 the important level to monitor. Liquidity is further reduced in Asia due to several regional centre holidays.
Major currencies continue to tread water with EUR/USD at 1.1320, GBP/USD at 1.3410, USD/JPY at 114.40, AUD/USD at 0.7235, NZD/USD at 0.6820 and USD/CAD at 1.2810. None of that has been much different since last Thursday. The return of US markets this afternoon and the gnomes of Wall Street should see volatility pick up slightly this evening.
Asian currencies continue range trading as the Asian interbank market looks to have closed shop for the year now. A stronger Yuan continues to backstop Asian FX from negative sentiment shifts.
USD/TRY fell by nearly 6.0% on Friday as intervention and the central government's effective Lira value guarantee on deposits for retail savers continues to play out. USD/TRY has risen by 3.50% today though and USD/TRY looks to be forming a base ahead of 10.0000 now. The authorities in Turkey may find engineering further Lira rallies harder going from here, and I will be watching their foreign reserve data going forward for more signals of when to re-enter the short Erdogan trade.
Brent crude and WTI stage rare divergence
Oil prices traded sideways on low liquidity and participation on Friday, Brent crude easing slightly to $75.90 a barrel, and WTI easing to $73.20 a barrel. In Asia today, however, we are seeing a rare divergence in pricing direction. Brent crude has risen 0.70% to $76.40, while WTI has fallen by 0.65% to $73.20 a barrel.
I believe two different stories are in play here to explain the price action. CNN reported over the weekend, based on satellite photos, that Saudi Arabia is manufacturing ballistic missiles with Chinese assistance just outside of Riyad. An escalating arms race between Saudi Arabia and Iran is as good a reason to buy Brent crude as any.
In the US, hundreds of flights have been cancelled over the weekend due to staff shortages as airlines employees are forced to isolate themselves due to Covid-19 infection, notably omicron. Lower travel equalling lower economic activity in the US equals lower WTI, the US oil benchmark. Momentum is muted though, and I doubt either story will have a lasting impact on oil prices.
Brent crude has resistance at 77.05 a barrel, its 100-day moving average (DMA). It has support at $75.70. WTI has resistance at $74.10, its 100-DMA, and support at $72.30 a barrel.
Holiday risk-hedging lifts gold
Pre-holidays risk-hedging appears to have lifted gold higher on Friday, rising 0.27% to $1808.50 an ounce. In Asia, volumes are muted, with gold edging another 0.13% higher to $1810.80.
Gold’s attempts to stage a meaningful recovery remain unconvincing, with traders cutting long positions at the very first sign of trouble intra-day. It faces a double top around the $1815.00 region which will present a formidable barrier, ahead of $1840.00. Support lies at $1790.00, followed by $1780.00 an ounce. $1790.00 to $1815.00 continues to be my call for the range for the week.
With the US Dollar looking more vulnerable to positive virus sentiment at the moment, gold could potentially move higher throughout this week, but I wouldn’t put my house on it sustaining those gains.
EUR/USD Continues To Struggle Near 1.1350
Key Highlights
- EUR/USD is facing a major resistance near 1.1350 and 1.1380.
- A key bullish trend line is forming with support at 1.1250 on the 4-hours chart.
- GBP/USD gained pace for a move above the 1.3300 resistance zone.
- Gold price seems to be eyeing an upside break above $1,820.
EUR/USD Technical Analysis
The Euro formed a base above the 1.1200 level against the US Dollar. EUR/USD started a decent recovery wave above the 1.1250 and 1.1280 levels.
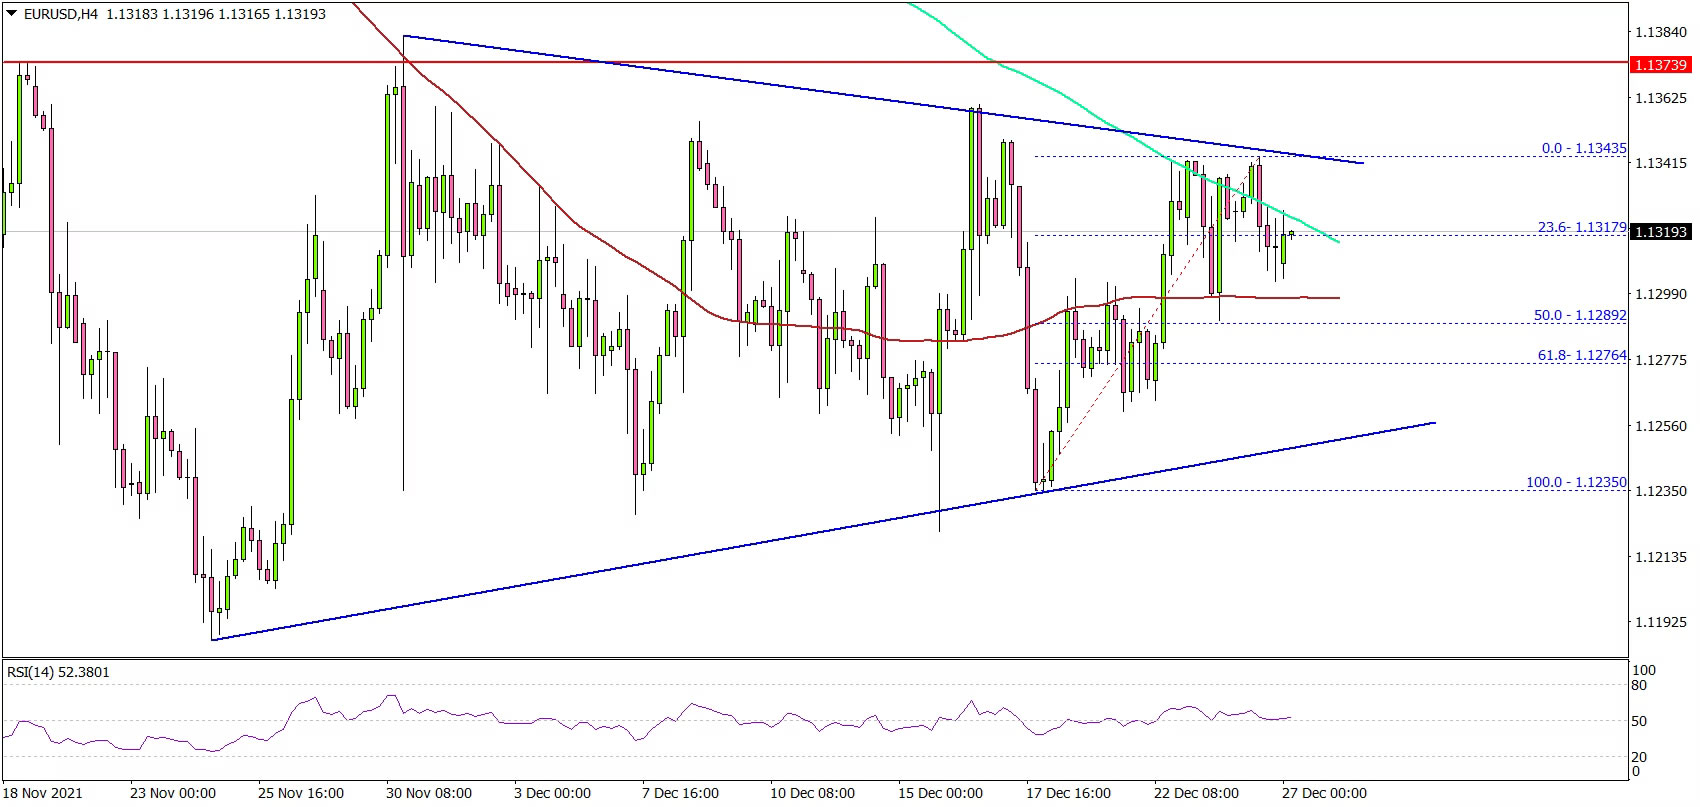
Looking at the 4-hours chart, the pair even broke the 1.1300 level and the 100 simple moving average (red, 4-hours). The pair even spiked above the 200 simple moving average (green, 4-hours), but there was no clear move above the 1.1350 level.
The next major resistance is near the 1.1380 level. A clear move above 1.1350 and 1.1380 could set the pace for a larger increase. The next major resistance is near 1.1450.
On the downside, an immediate support is near the 1.1280 level. There is also a key bullish trend line forming with support at 1.1250 on the same chart. Any more losses might send the pair towards the 1.1200 level.
Looking at GBP/USD, the pair climbed higher nicely above the 1.3300 level and might continue to rise above the 1.3400 level in the near term.
Economic Releases
- Dallas Fed Manufacturing Business Index for Dec 2021 – Forecast 13.2, versus 11.8 previous.