Sample Category Title
Week Ahead – Markets Wind Down, Mind the Liquidity Gap
As the year draws to a close, liquidity could be in short supply next week. This means that sharp market moves are possible without any news behind them. The economic calendar is pretty light, so the spotlight will remain on Omicron developments and President Biden’s spending promises.
Brief look at 2022
We have already published our expectations for the FX market in 2022, which you can view here. In short, the three main forces that will drive currencies are changes in central bank policy, swings in risk sentiment, and politics.
It may be a year of two halves, with the dollar performing well early on but then losing its shine as ‘peak inflation’ in the US dampens expectations for powerful Fed rate increases and the Eurozone recovery finally gets rolling. And with liquidity being withdrawn from the global financial system while asset valuations are so high, volatility episodes could become a more frequent phenomenon.
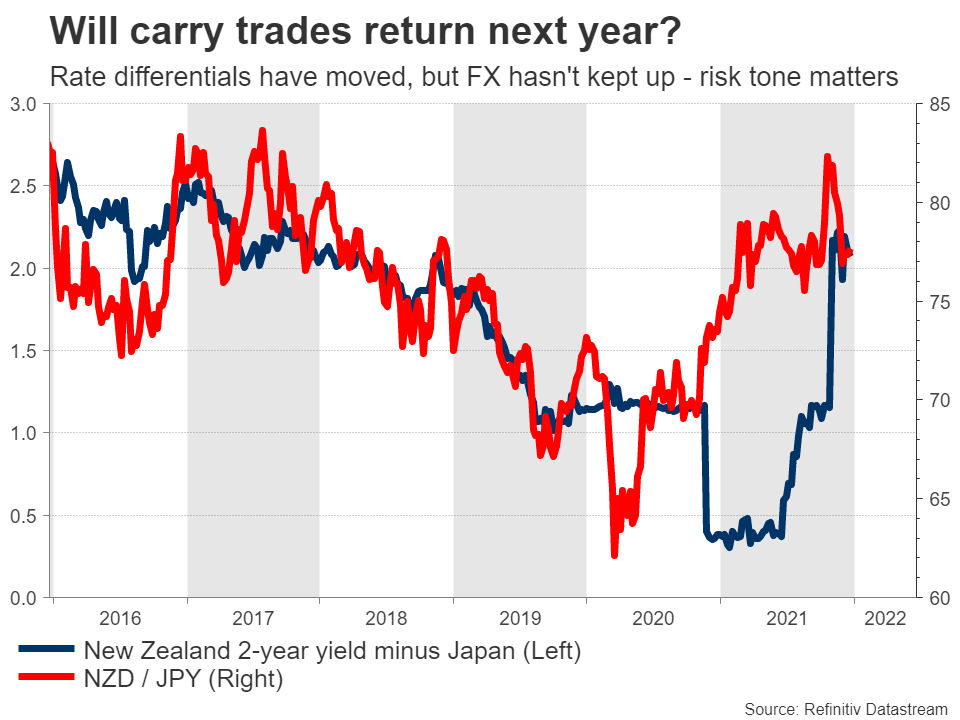
Hence, while rate differentials favor currencies like the Canadian and New Zealand dollars that will likely benefit from carry trades as their central banks raise rates, the ride could be violent. Beyond the global risk tone, politics will also add some spice into the mix, with French presidential elections and the US midterms coming up.
Beware of flash crashes
The upcoming week is exceptionally quiet in terms of data releases. With many big players having closed their books for the year and many others away on holiday, trading volumes will likely be very low.
This is a recipe for all sorts of strange market moves, from sharp spikes without any news behind them to outright flash crashes if any real news hits the wires, particularly during the Asian trading session.
The last time this occurred was on January 3, 2019. That’s when yen pairs got smashed in a few minutes as trading algorithms overreacted to a headline about Apple. Once the yen started moving, separate momentum algos amplified the action, before the entire move retraced in the next hours.
One strategy for taking advantage of such liquidity-driven moves is setting pending orders that are far away from current market prices. In an ideal scenario, the order gets executed at extreme levels, and then the market retraces.
Light calendar
The few data that will be released will come mainly from Japan and China. Things will get going on Monday with Japan’s retail sales for November and the Bank of Japan’s summary of economic opinions. Employment and industrial production stats will hit the markets Tuesday.
As usual though, the yen doesn’t react to economic data or comments from the central bank. The nation has barely escaped deflation and there is absolutely no expectation that rates will rise in the coming years. Hence, the yen remains at the mercy of global risk appetite and what foreign central banks do.
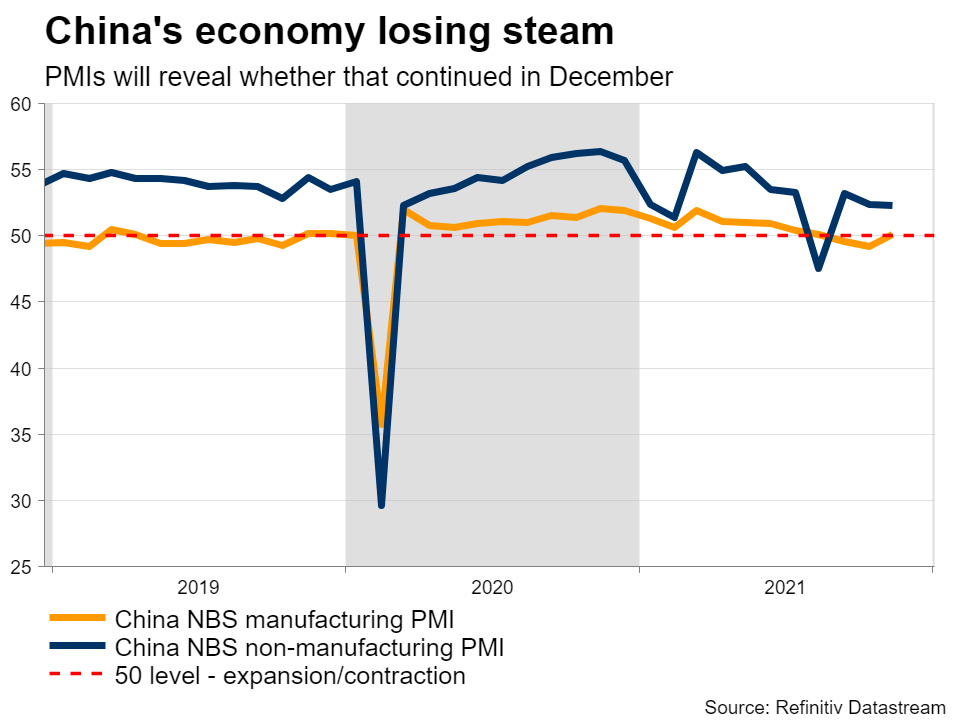
Then on Thursday, the weekly jobless claims from America are due out, ahead of China’s official PMIs for December early on Friday. The PMIs can often be crucial for China-sensitive currencies like the Australian dollar, especially in light of the troubles in the property sector and the slowdown in the economy.
All told, it will probably be a very quiet week. That said, if we do get any real news, the impact could be much greater than usual.
Eco Data 12/24/21
[php_everywhere instance="1"]
WTI Oil Futures Meet December’s Bar; Bullish Bias Still in Play
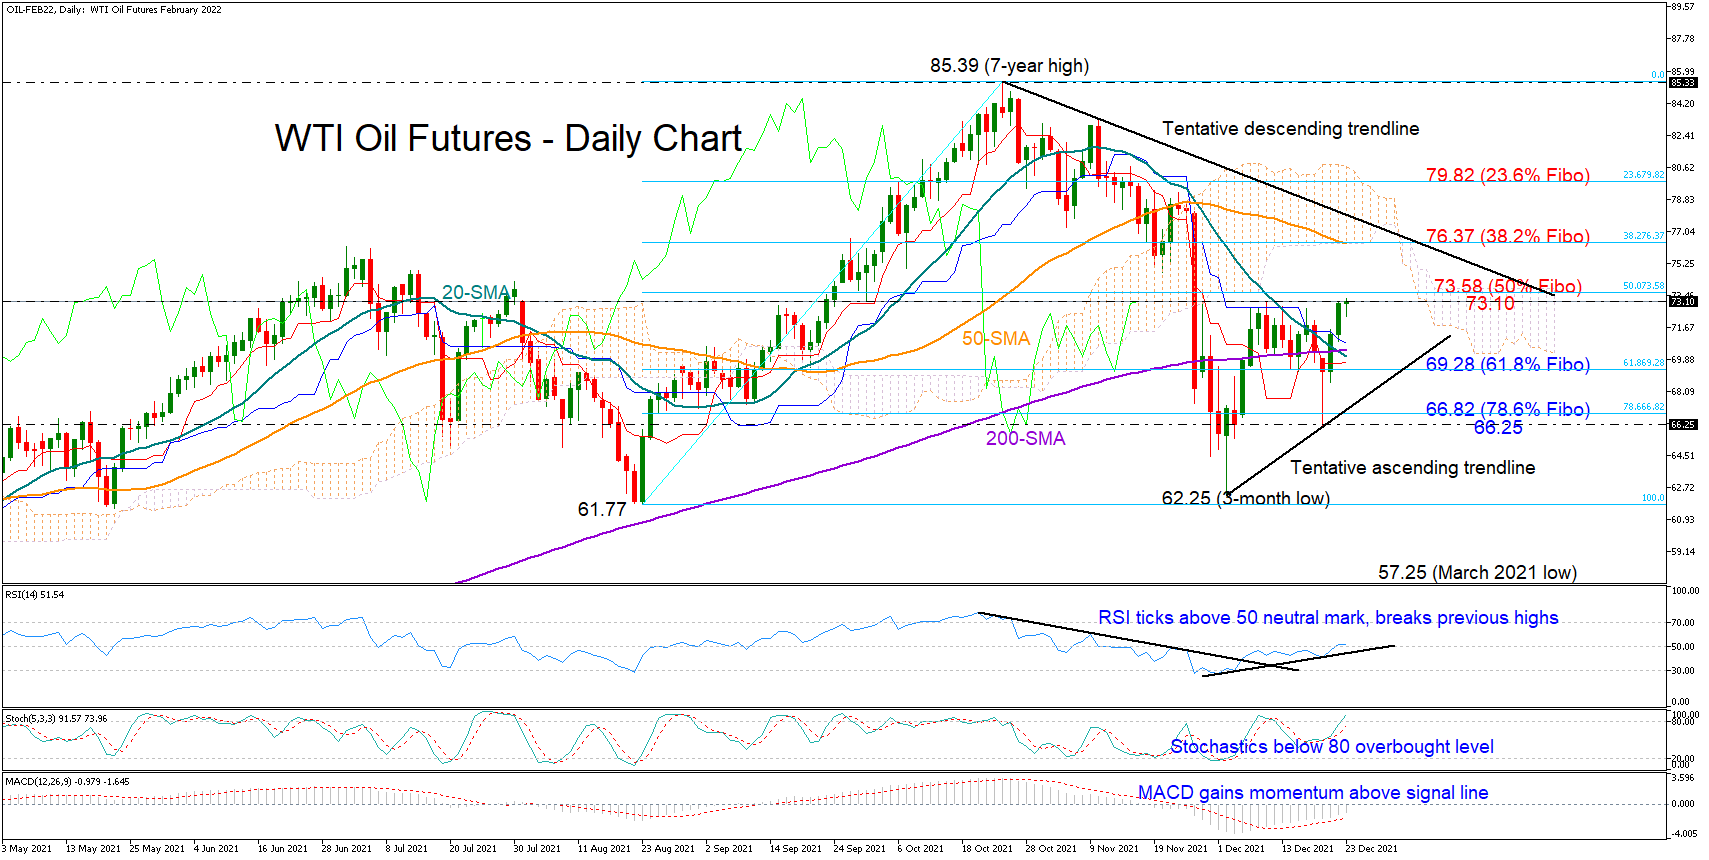
WTI oil futures (February delivery) paused their two-day advance near December’s resistance zone of 73.10. Although some consolidation is likely around that ceiling, the bulls could soon recharge their batteries according to the momentum indicators.
The RSI has breached its previous highs, stretching its uptrend slightly above the 50 neutral mark. The MACD continues to gain ground above its red signal line, while the rising Stochastics have yet to reach their 80 overbought level, all reflecting improving sentiment in the market.
Should the 73.10 bar give way, with the price closing clearly above the 50% Fibonacci of the 61.27 – 85.39 upleg too, the bullish action could pick up steam towards the 38.2% Fibonacci of 76.37. A tentative descending trendline drawn from the seven-year high of 85.39 could add some downside pressures around the same region. However, if it fails to act, the way will clear towards the 23.6% Fibonacci of 79.82.
On the downside, the 61.8% Fibonacci of 69.28 will be on guard for any bearish corrections along with the short-term tentative ascending trendline. A violation at this point could trigger a steeper decline towards the three-month low of 62.25 unless the 66.25 support area manages to calm selling pressures earlier.
Meanwhile in the medium-term picture, the neutral status remains intact as long as the price trades between 61.77 and 85.39.
In brief, despite today’ stabilization, WTI oil futures probably have more bullish fuel in their tank, with the confirmation likely coming above 73.10.
EURJPY’s Ascent Slows, and Neutral Tone Strengthens
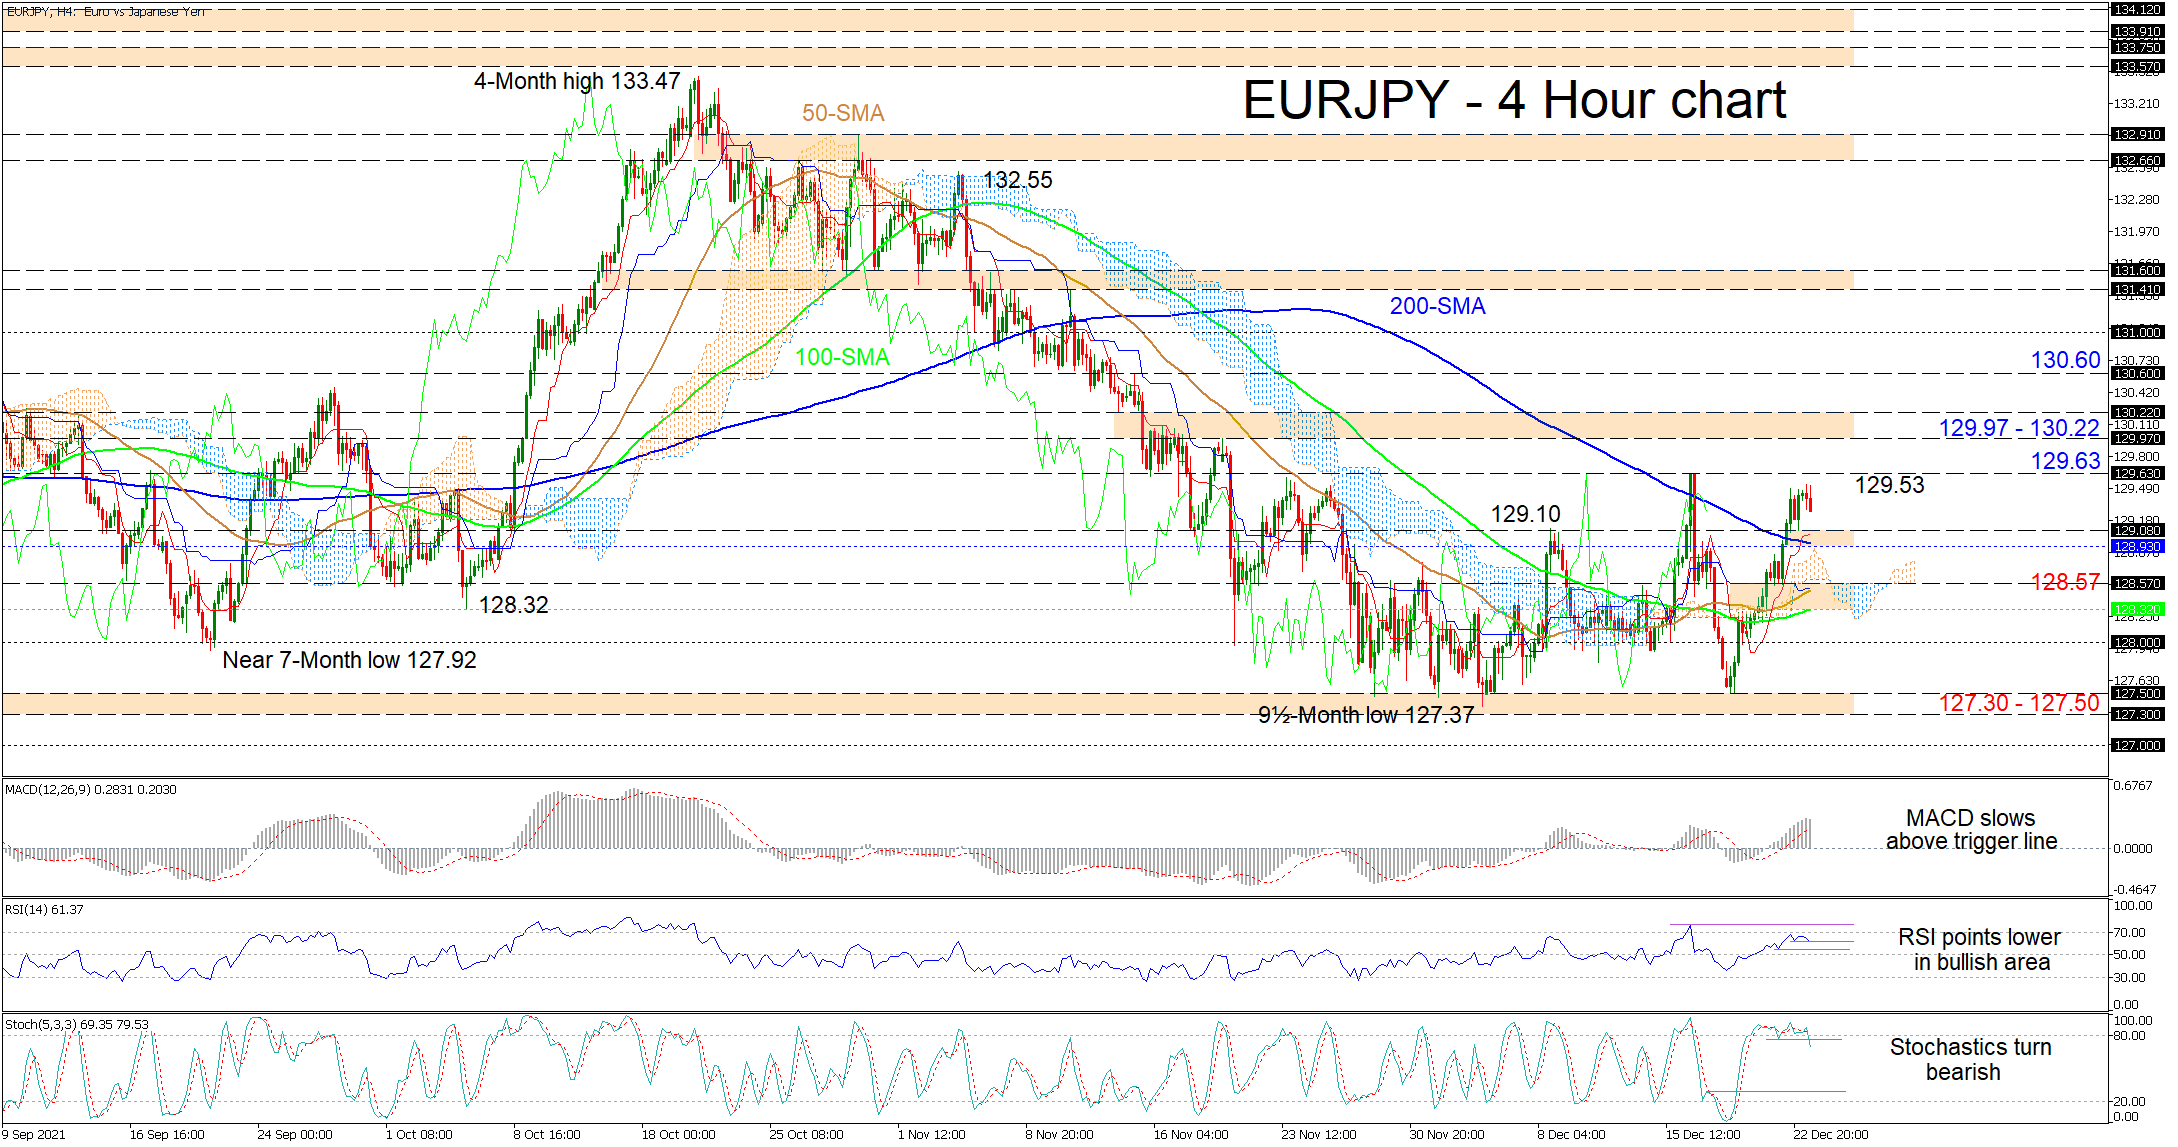
EURJPY is struggling to extend its latest rally, which began around 127.50, beyond the December 16 high of 129.63. The converging simple moving averages (SMAs) are hinting that a more neutral price development may evolve confined now between a lower limit of 127.30-127.50 and an upper limit of 129.53.
The horizontal blue Kijun-sen line and the stalling in the ascent of the red Tenkan-sen line are together signalling feeble upside pressures, while the short-term oscillators are reflecting that buyers are losing command. The MACD, in the positive region, is fading above its red trigger line, while the RSI is dipping in bullish territory. The stochastic oscillator has turned bearish promoting the surge in negative price action.
If selling interest increases, an initial zone from the 129.08 low until the 200-period SMA at 128.93 could prevent the negative trajectory from gaining pace. However, if the price moves lower, a reinforced support area from 128.57 until the 100-period SMA at 128.32 may draw traders’ attention. If sellers manage to steer the pair below this obstacle too, the 128.00 handle could come into focus before sellers target the 127.30-127.50 support boundary.
Alternatively, if bullish forces return, the intraday high of 129.53 could delay the test of the 129.63 high, acting as the fresh ceiling of a near four-week trading range. Conquering this key barrier, the bulls may then challenge the 129.97-130.22 resistance border before eyeing the November 15 high of 130.60.
Summarizing, EURJPY’s bullish tone is diminishing and a price pullback beneath the 200-perod SMA would confirm this. Furthermore, a move like this would endorse an extension of the current trading range.
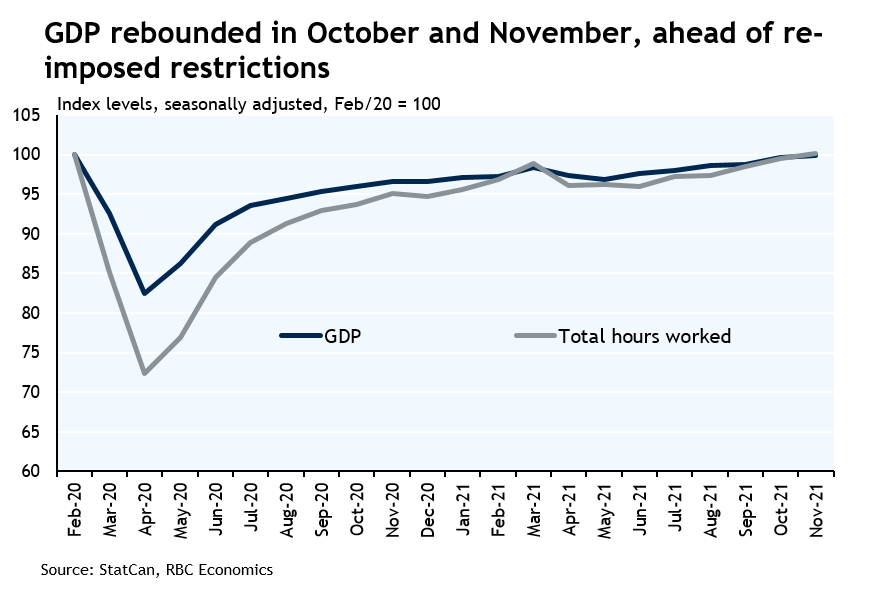
Canadian GDP Rebounded in October and November ahead of Omicron
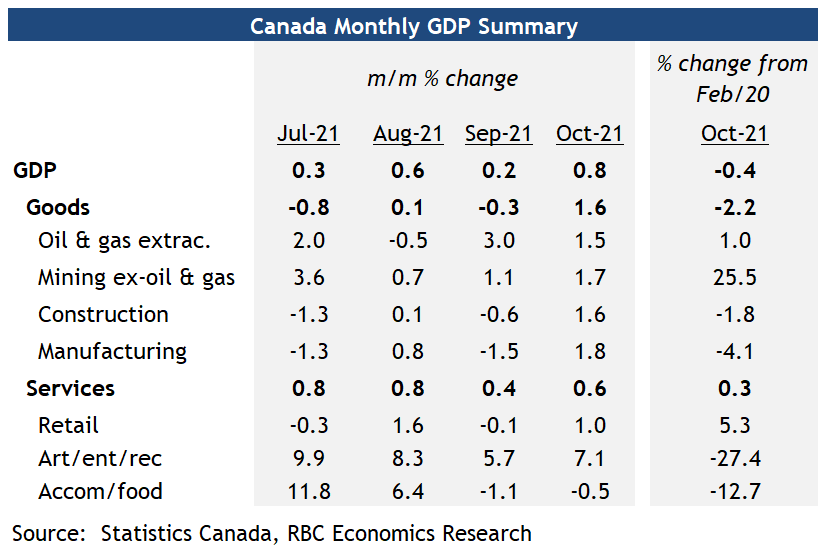
- GDP grew 0.8% in October, backed by a bounce-back in goods-producing industries.
- Preliminary estimate that output grew another 0.3% in November, despite significant disruptions from flooding in BC.
- Omicron threat and re-imposed containment measures adding downside risk near-term, but impact still uncertain.
GDP in Canada rose 0.8% in October as supply chain disruptions eased, at least temporarily. Motor vehicle and parts manufacturing jumped 19% after falling sharply in September, but was still almost a quarter below levels in October a year ago with the global chip shortage restraining output. The same is true for auto-related wholesale and retail activities, both of which declined from July to September but rebounded more substantially in October, albeit to levels still below a year ago. Outside of auto products, oil and gas extraction also rose again in October and has now recovered back to above pre-pandemic levels. Oil prices have ticked lower in recent weeks over worries about travel demand given the spread of the Omicron variant, but remain above pre-pandemic levels. Finally, both residential and commercial building activities also posted solid gains in October, pushing construction output higher by 1.6%.
The preliminary estimate of November output growth was up 0.3% from October, smaller than the 0.7% increase in total hours worked earlier reported. Part of the underperformance could be attributed to significant disruptions to local transportation capacity brought on by flooding in British Columbia, which happened after the labour market survey week. Advance estimates of November retail and wholesale trade in November were higher. And early data’s pointing to another increase in auto production as well. We expect the ebb and flow of global supply chain disruptions to continue to impact output, particularly from the manufacturing sector in coming months.
The impact of the new Omicron variant on the economic outlook remains highly uncertain. The re-imposition of some restrictions to hospitality and travel industries will limit growth in the near-term. And health-related concerns might dampen services demand. But how long these restrictions last and how stringent they become are difficult to predict. Still, high rates of vaccination, extended government benefits and accelerated booster rollouts are all expected to help curb the threat. We continue to expect downward but at this time limited impact to our Q4 GDP growth tracking of 6.5%.
Stocks March Higher as Omicron Jitters Subside
Dollar gains traction after PCE release; Safe havens plummet
Despite its weakness early in the session, the stronger-than-expected PCE inflation print enabled the greenback to pare a significant part of its losses. Specifically, the US annual Core PCE inflation rose to 4.7% in November versus the 4.5% projections, boosting bets for a possible Fed rate hike in March. However, the surging risk appetite in the markets seem to be weighing heavily on the dollar’s prospects, limiting its upside potential.
Moreover, the Swiss franc and Japanese yen are getting hammered today as the improving risk tone poses a threat to their safe haven appeal . On the other hand, commodity-linked currencies saw their early-session gains evaporate after the dollar bounced back.
The British pound is the biggest winner in the forex spectrum today as UK President Boris Johnson ruled out the imposition of any further restrictions in the upcoming holiday period, while the euro is giving up ground as more and more countries in the Eurozone seem ready to adopt further Covid-19-related measures.
Stocks extend their year-end rally amid surging risk appetite
Wall Street is set to open higher and resume this week’s rally as optimism over the pandemic front keeps soaring. More specifically, e-mini futures for the major US indices are trading higher in premarket trade, with Dow Jones and S&P 500 futures being 0.35% up in the session, while Nasdaq futures are trading 0.25% higher. Furthermore, most major European stock markets are also following up yesterday’s rise in today’s session.
Oil slightly higher; gold steadies; natural gas plummets
Oil prices surged earlier today as an increasing number of reports came out suggesting that the Omicron variant is less deadly than Delta, but the black gold’s gains were trimmed later in the session on fears of yet further travel and self-distancing restrictions. In contrast, natural gas futures are getting hammered, with profit-taking probably being the main factor behind this move.
Gold prices remain unchanged today as the precious metal grapples with opposite directional forces. On the one hand, rising Treasury yields alongside improving risk tone in the markets pose a threat to the bullion’s prospects, while the greenback’s broader retreat and inflationary pressures are pushing gold higher.
EUR/GBP Mid-Day Outlook
Daily Pivots: (S1) 0.8472; (P) 0.8491; (R1) 0.8503; More...
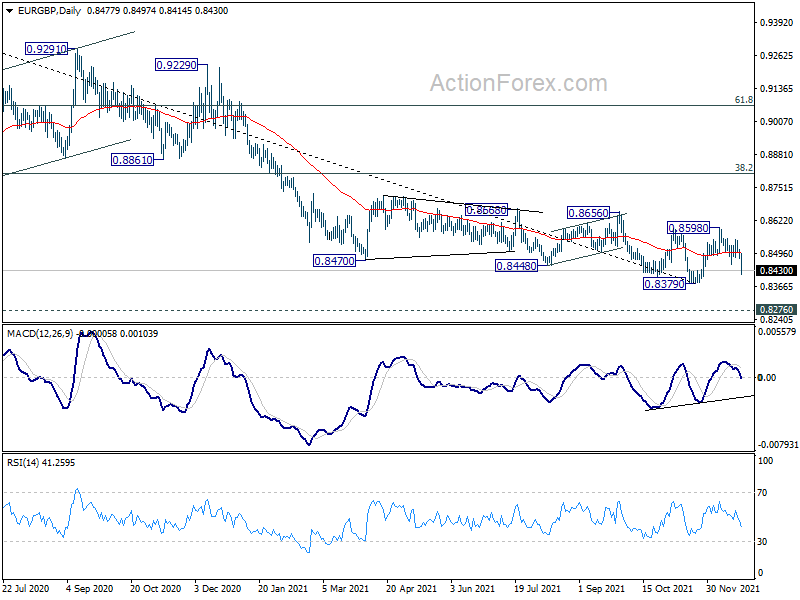
Intraday bias in EUR/GBP is back on the downside with break of 0.8452 support. Fall from 0.8598 will target 0.8379 first. Firm break there will resume larger down trend fro m0.9499 to long term support at 0.8276. For now, deeper decline will remain in favor as long as 0.8549 resistance holds, in case of recovery.
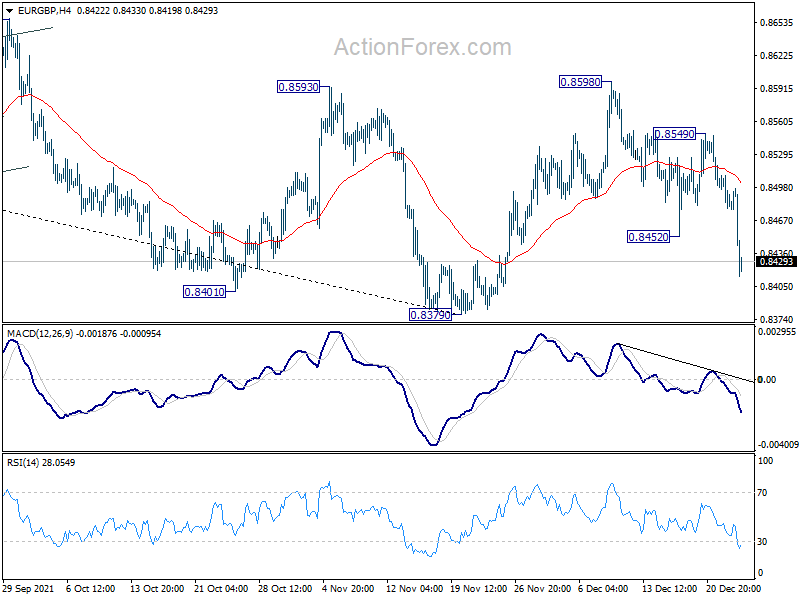
In the bigger picture, price actions from 0.9499 (2020 high) are still seen as developing into a corrective pattern. Deeper fall could be seen as long as 0.8593 resistance holds, towards long term support at 0.8276. We'd look for bottoming signal around there to bring reversal. Meanwhile, firm break of 0.8593 will now be an early sign of medium term bottoming. Further break of 0.8656 will pave the way to 38.2% retracement of 0.9499 to 0.8379 at 0.8807.
EUR/AUD Mid-Day Outlook
Daily Pivots: (S1) 1.5649; (P) 1.5740; (R1) 1.5794; More...
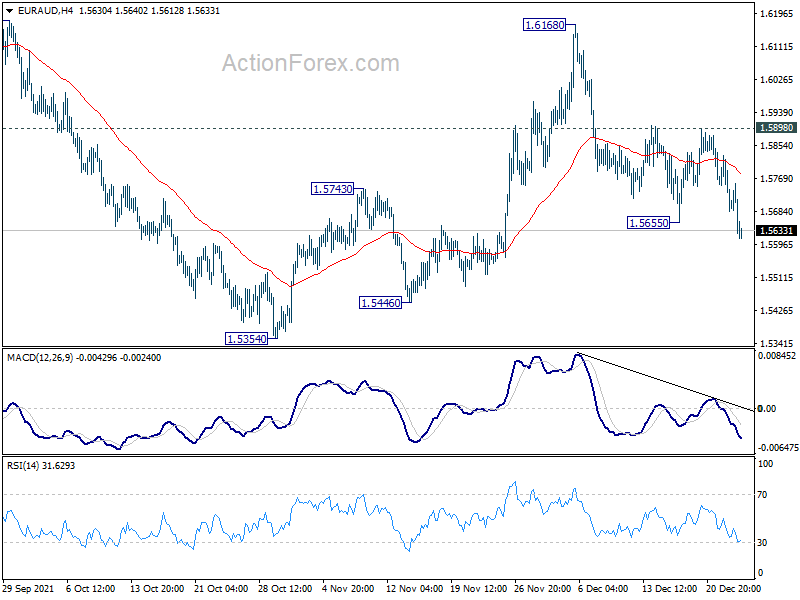
EUR/AUD's fall from 1.6168 resumed by breaking 1.5655. The development affirms the case that recovery from 1.5354 has completed at 1.6168. Intraday bias is back on the downside for retesting 1.5250/5354 support zone. For now, further decline will be in favor as long as 1.5898 resistance holds, in case of recovery.
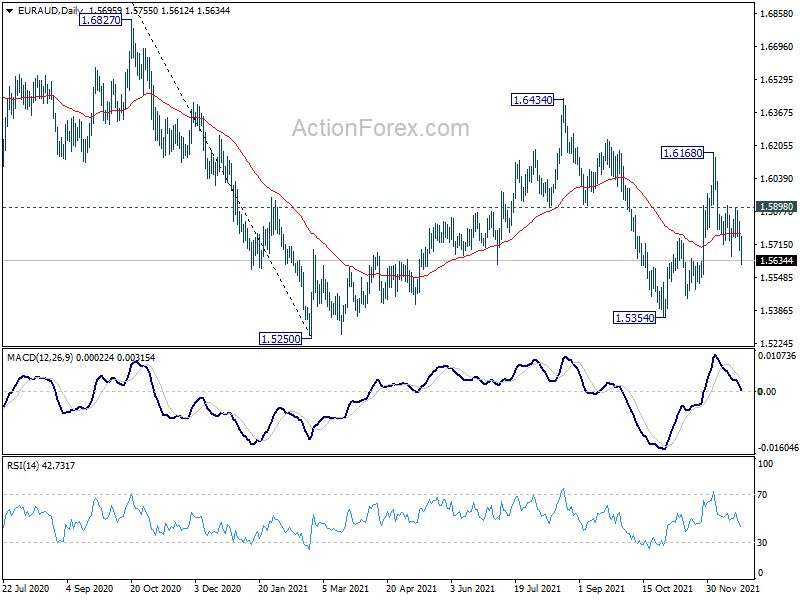
In the bigger picture, medium term outlook remains neutral for the moment. Rise from 1.5354 is seen as the third leg of the corrective pattern from 1.5250 low. Further rise cannot be ruled out, but even in that case, strong resistance should be seen at 38.2% retracement of 1.9799 to 1.5250 at 1.6988. Larger down trend from 1.9799 is in favor to extend through 1.5250 at a later stage.
AUD/USD Mid-Day Report
Daily Pivots: (S1) 0.7150; (P) 0.7185; (R1) 0.7249; More...
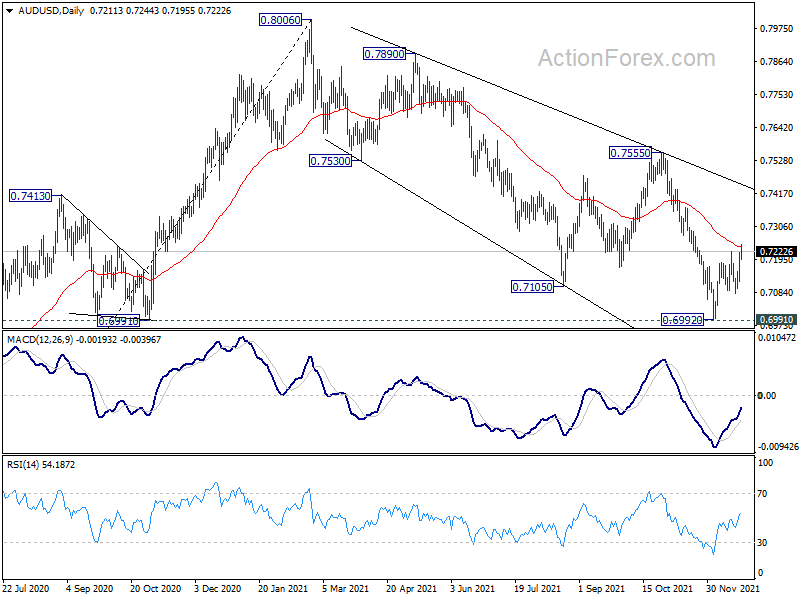
AUD/USD's break of 0.7223 suggests resumption of rebound from 0.6992. Intraday bias is back on the upside. Sustained trading above 55 day EMA (now at 0.7236) will argue that fall from 0.8006 has completed at 0.6992, after defending 0.6991 support. Further rally would be seen to 0.7555 resistance for confirmation. On the downside, break of 0.7081 support will turn focus back to 0.6991/2 support instead.
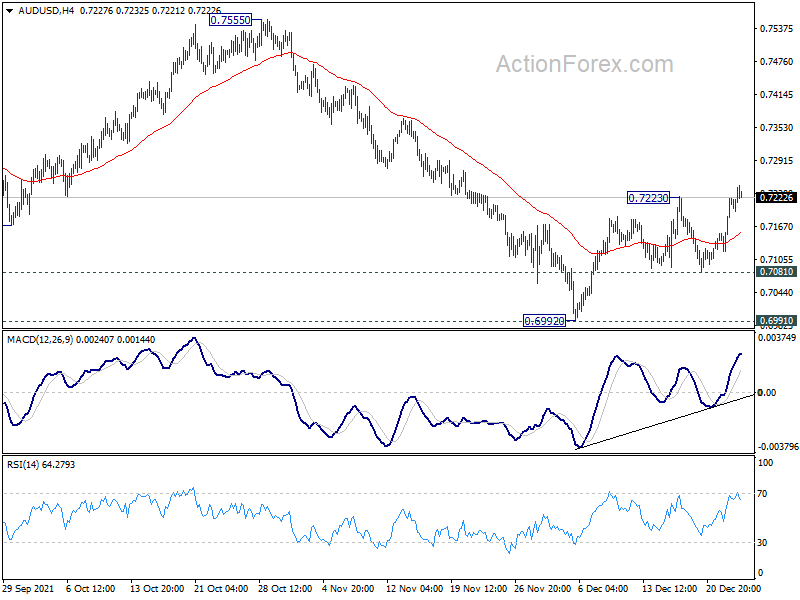
In the bigger picture, strong rebound from 0.6991 key structural support will retain medium term bullishness. That is, whole up trend from 0.5506 is still in progress. Firm break of 0.7555 resistance will target 0.8006 high and above. However, sustained break of 0.6991 will argue that the whole up trend from 0.5506 might be finished at 0.8006, after rejection by 0.8135 long term resistance. Deeper decline would then be seen back to 61.8% retracement of 0.5506 to 0.8006 at 0.6461.
USD/JPY Mid-Day Outlook
Daily Pivots: (S1) 113.69; (P) 113.96; (R1) 114.36; More...
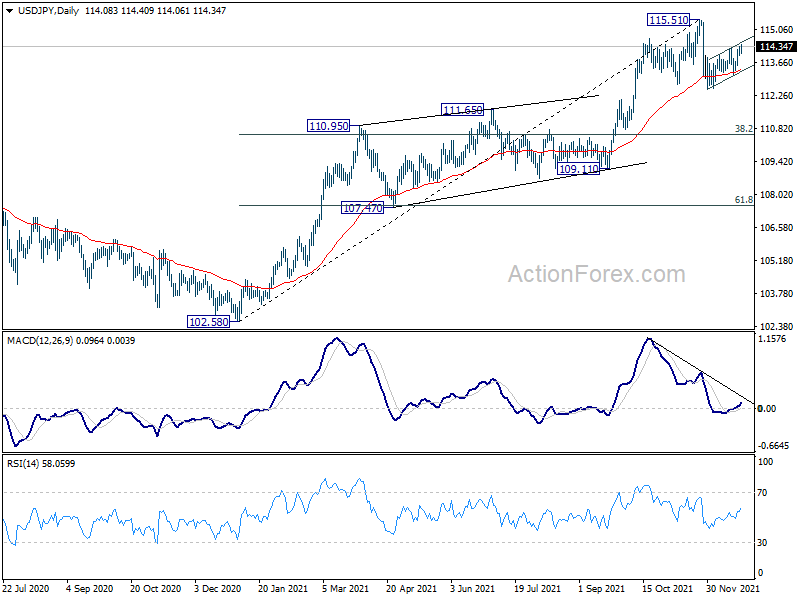
Intraday bias in USD/JPY remains mildly on the upside for the moment. Rebound from 112.52 is in progress, for retesting 115.51 high. However, break of 113.12 support will turn bias to the downside, and resume the correction from 115.51 through 112.52 support.
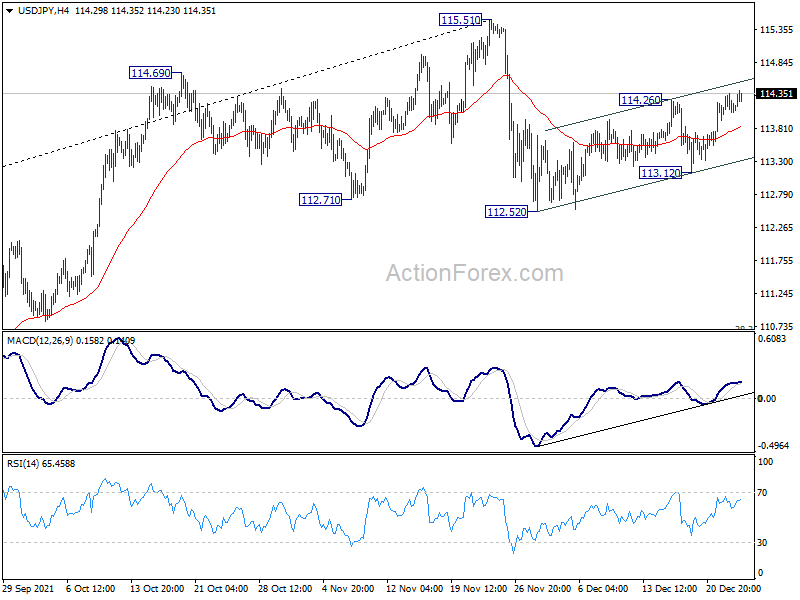
In the bigger picture, no change in the view that rise from 102.58 is the third leg of the up trend from 101.18 (2020 low). Such rally should target a test on 118.65 (2016 high) on resumption. However, firm break of 109.11 structural support will argue that the trend might have reversed and bring deeper fall to 107.47 support and possibly below.