Sample Category Title
Gold Gains Struggle above 1,800 Mark
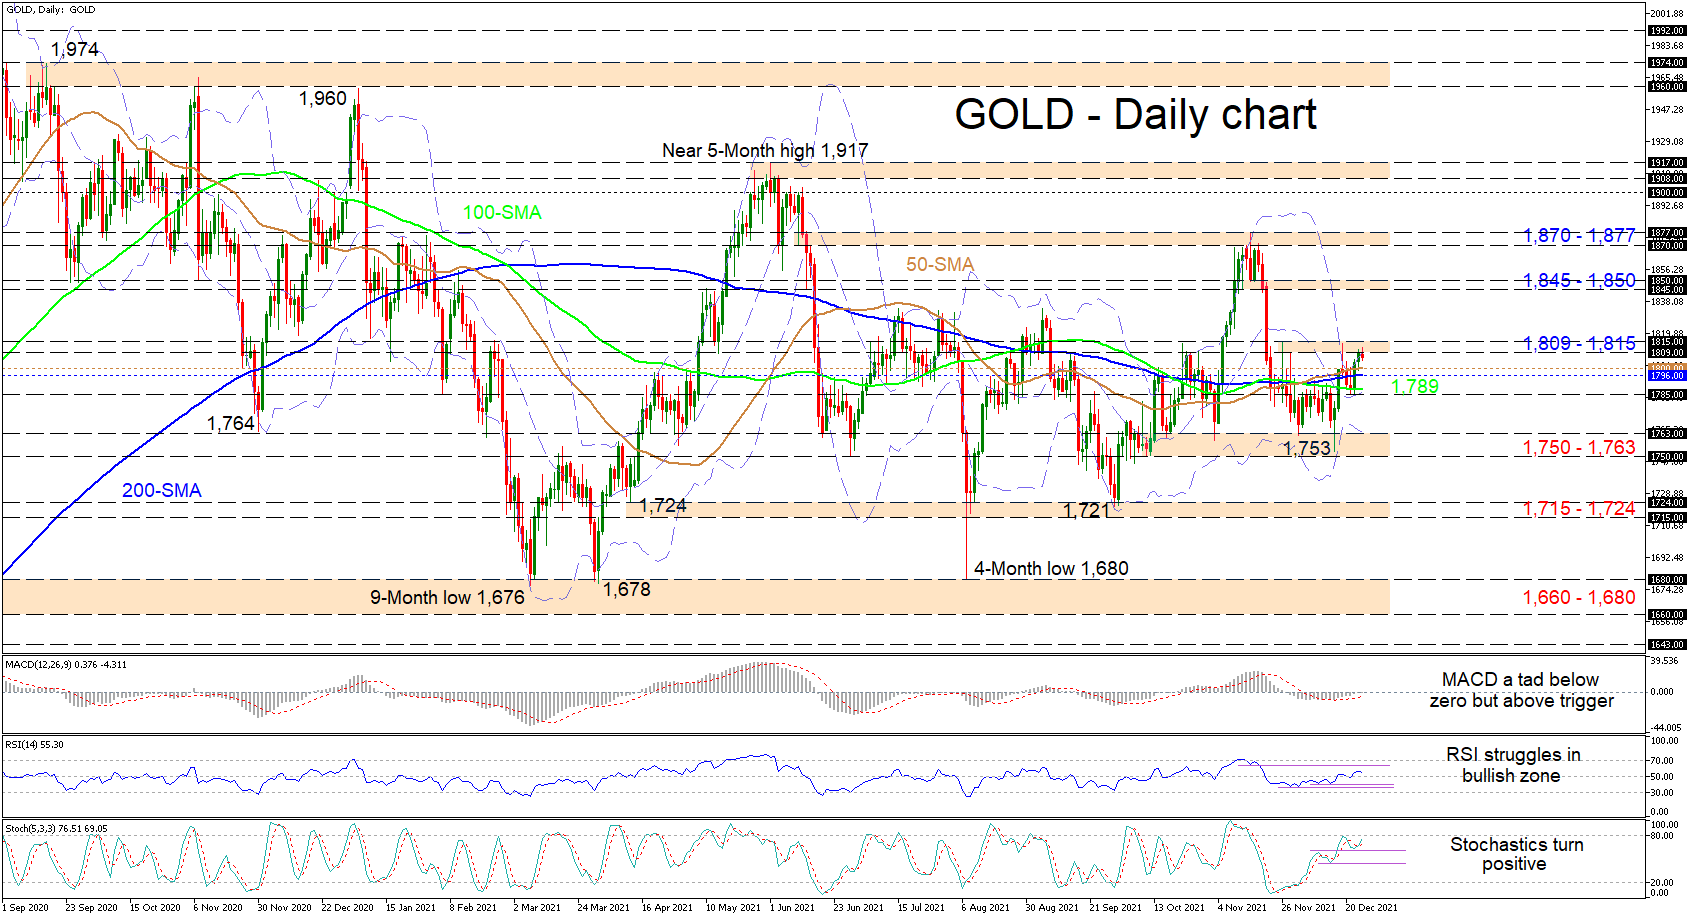
Gold’s recent positive traction off the mid-Bollinger band after a price bounce within the 1,750-1,763 support region is having trouble soaring past the 1,809-1,815 resistance belt. The converged simple moving averages (SMAs) are currently not endorsing any clear trend in the pair.
That said, the short-term oscillators are skewed to the upside but are reflecting that bullish momentum remains somewhat frail. The MACD, in the negative region, is rising above its red trigger line and has neared the zero threshold, while the RSI is starting to fade in bullish territory. The stochastic oscillator has regained a positive bearing and has yet to signal any weakness in buying powers.
To the upside, immediately hindering progress in the commodity is the upper Bollinger band along with the 1,809-1,815 barrier. Now, should the price successfully push beyond the 1,815 level, the 1,845-1,850 resistance zone could step into the spotlight. Clawing higher could feed belief in additional gains however, for bullish confidence to return to the picture, the bulls would need to retain control and surpass the 1,870-1,877 boundary.
If advances are curbed by the 1,809-1,815 barricade, an initial section of support could stem from the 50-day SMA at 1,800 until the 1,785 low. If this reinforced area fails to negate fresh declines from evolving, the price may then confront the lower Bollinger band coupled with the 1,750-1,763 region of troughs, which started to unfold from mid-October. If selling interest intensifies and sinks the price of the commodity past the 1,715-1,724 border, the bears could target the 1,660-1,680 support base, which started to take shape around mid-April 2020.
Summarizing, gold is exhibiting a tendency to improve beyond the nearby band of highs from 1,809-1,815, which could boost bullish pressures. That said, directional impetus is currently lacking and for downside worries to return, the price would need to slip below the 1,750-1,763 support section.
Yen Dips Despite Stronger JPY Retail Sales
The Japanese yen continues to lose ground. The yen suffered a third straight losing week, and the trend has continued on Monday. With USD/JPY currently trading around the 114.70 level, the 115 line is vulnerable. The pair last breached this symbolic level a month ago, but the dollar couldn’t consolidate above this level.
Japan’s retail sales overperforms
Christmas week started off on a positive note, as Japan Retail Sales for November posted a strong gain of 1.9% y/y, ahead of the consensus of 1.7% and above the 0.9% gain in October. Consumers were out in force as Covid-19 cases fell during November. Still, the Omicron variant has started to spread in Japan’s major cities, leading to fears that the government could impose health restrictions or that consumers will stay at home to avoid contracting Omicron.
Japan is set on spending its way to a stronger economy, and parliament approved a record 10.8 trillion yen budget on Friday, which includes payouts to households and businesses hit by Covid. Japan’s economy is expected to roar back in Q4, with a consensus of 6.4% growth, after a contraction of -3.6% in the third quarter.
Inflation is on the rise in Japan. In November, Core CPI rose 0.5% y/y, above the consensus of 0.4%. That might seem insignificant compared with inflation numbers in the UK and the United States, but given that inflation has been negligible for years in Japan, this is certainly a change in direction. The uptick in inflation will be welcome news at the Bank of Japan, and should ease policymakers concerns about deflation. The bank’s inflation target of 2% remains a long way off, but inflation could move higher if the Omicron does not derail economic activity.
USD/JPY Technical
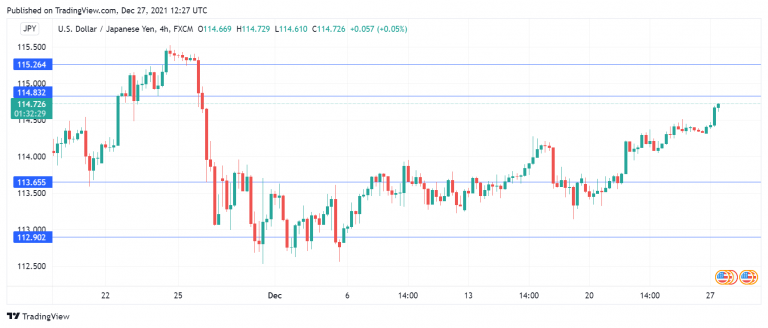
- USD/JPY is putting pressure on resistance at 114.82. Above, there is resistance at 115.26
- There is support at 113.65 and 112.90
Brent is Consolidating
Early in the final week of December, the Brent price is looking quite stable; the asset is trading at $76 and it can be assumed that the situation won’t dramatically change until the end of the year.
However, in January 2022, global tendencies may force oil prices to go down. First of all, it’s a disposition towards the oil supply surplus, which may occur early in the year and will become a trend for the whole 12 months. Secondly, the pandemic didn’t go anywhere: during the Christmas holidays, a lot of flights in the US were cancelled due to a possible upsurge in the number of new coronavirus cases.
On 4 January, OPEC+ will have another meeting and the cartel is highly likely to keep the current output parameters for February intact. The total daily output will increase by 400 thousand barrels every month.
In fact, the supply is already significantly increasing while the demand remains stable.
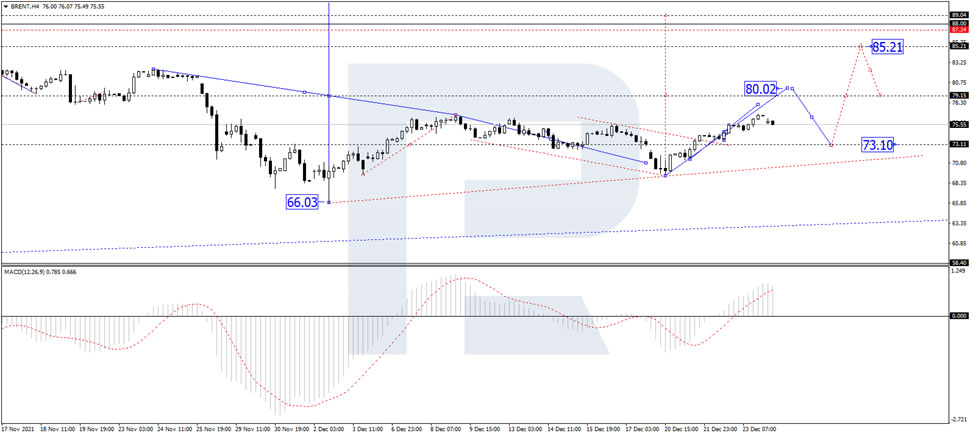
In the H4 chart, after rebounding from 74.00, Brent is growing towards 80.00 and forming the third wave within the uptrend; right now, the asset is correcting and may reach 74.65. After that, the instrument may resume trading upwards to reach 80.00 and then start another correction to return to 74.65. Later, the market may form one more ascending structure to break 80.00 and then continue growing with the short-term target at 85.00. From the technical point of view, this scenario is confirmed by MACD Oscillator: its signal line is moving above 0 inside the histogram area, thus indicating a further uptrend in the price chart, while the line may continue its movement to reach new highs.
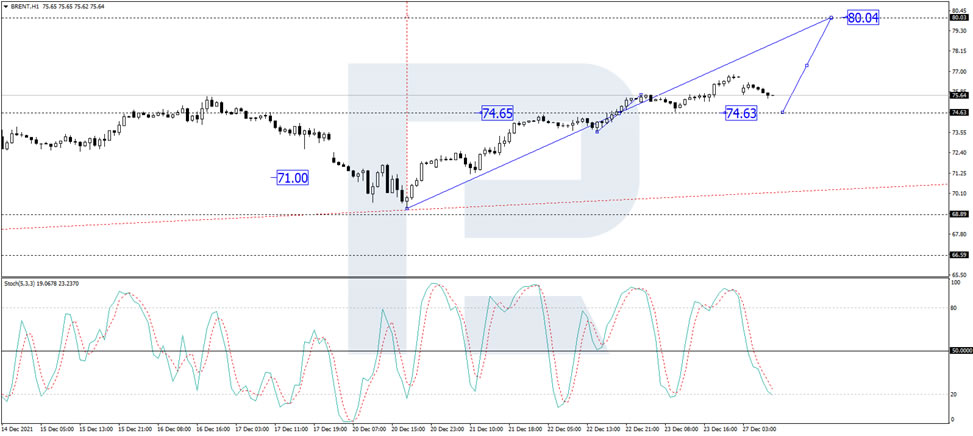
As we can see in the H1 chart, after forming a new consolidation range around 74.60 and breaking it to the upside, Brent continues trading upwards and has already reached 76.83. Today, the asset may correct to test 74.63 from above and then resume growing with the target at 85.00. From the technical point of view, this idea is confirmed by the Stochastic Oscillator: its signal line is moving at 20. Later, the line may rebound from this level and move upwards to break 50. After that, it may continue growing to reach 80.
Cautious Mood in Holiday-Thinned Trade
- Asia drifts lower despite China support but European shares eye gains
- Rising virus cases put investors on edge as doubts re-emerge about Omicron impact
- Commodities pressured, dollar firms, pound advances
Subdued start to final week of 2021
Markets were struggling for direction on Monday in what is the last trading week of the year. The optimism that the Omicron variant will not cause a major setback to the post-pandemic economic progress has been brought into question by the latest surge in new infections in many parts of the world, including the United States.
With headlines of thousands of flight cancellations over the Christmas weekend, it is hard not to be feeling anxious about what the outlook holds for the winter months. However, although the worrying trend in new infections is ringing alarm bells for investors, there is no sense of panic just yet.
Policy hopes may be keeping virus jitters at bay
The Fed’s open-minded approach to rate hikes is probably spurring hopes that should the virus situation deteriorate dramatically, policymakers will ease up on the pace at which they remove stimulus, even as they turn more hawkish on inflation.
There is also some relief after China’s central bank signalled on Saturday that it will be more “proactive” in supporting the economy and promoting growth in the troubled property sector.
Mixed start for stocks
Nevertheless, China’s main indices closed marginally lower as the country reported its highest number of locally transmitted Covid cases since January over the weekend. Most other Asian markets were closed or also in the red, but in Europe, shares turned positive after opening in negative territory.
With the London market closed and not much on the economic agenda, trading is likely to remain muted until Wall Street traders return from their long holiday weekend later in the day. S&P 500 futures were last quoted about 0.1% higher, having set another all-time high last Thursday.
Oil steadier, dollar climbs
In commodities, oil prices followed the slight improvement in the risk tone by moving away from earlier session lows. Brent crude futures were negligibly positive, but WTI futures were still down about 0.2% on the day, weighed by the fresh uncertainty about the US travel industry following the holiday disruptions.
Gold was unable to move past the $1,810 resistance, slipping to around $1,805/oz as the US dollar edged up.
The dollar index climbed above 96.20 as the euro and yen sagged. The Japanese safe-haven currency was weaker across the board, hinting at a modest risk-on tone. However, the risk-sensitive aussie, kiwi and loonie were all struggling against the greenback on Monday, with the New Zealand dollar down the most.
Pound bucks the trend, but only just
The pound was the only major currency that managed to rise against the mighty dollar, though it appears to have stumbled once again at the $1.34 barrier. Cable has been bolstered lately by the early indications that Omicron leads to fewer hospitalizations than the other variants.
British Prime Minister Boris Johnson has so far refused to bring England into line with the other UK nations by imposing tougher restrictions, even as daily infections top 100,000. Many investors are now looking at the UK as a case study for the Omicron outbreak to see whether vaccines will be enough to stave off a big surge in hospitalizations.
Market Participation is Light as Christmas Holiday Continues in Some EU Countries
Notes/Observations
- Continue market holidays in Europe keeps participation on the sidelines.
Asia
- Japan Nov Retail Sales registered its 3rd consecutive increase (M/M: 1.2% v 1.3%e; Y/Y: 1.9% v 1.7%e).
- BOJ Summary of Opinions for Dec Meeting saw CPI rising moderately into positive territory in the short run due to rise in energy prices.
- China PBOC quarterly monetary policy meeting statement pledged more support for the real economy along with more "proactive" use of policy tools. Reiterated prudent policy to be flexible and appropriate.
- China Nov Industrial Profits Y/Y: 9.0% v 24.6% prior.
Coronavirus
- US halted the distribution of Regeneron and Eli Lilly COVID antibody treatments, cited omicron efficacy concerns.
Europe
- Markets closed in UK and Ireland (both Monday and Tuesday for Christmas holiday).
Energy
- Yamal-Europe pipeline (delivers Russian gas to Western Europe) was sending the fuel back to Poland for 6th consecutive day.
Speakers/Fixed income/FX/Commodities/Erratum
Equities
Indices [Stoxx600 +0.19% at 483.96, FTSE closed, DAX +0.18% at 15,784.81, CAC-40 +0.08% at 7,091.94, IBEX-35 +0.35% at 8,593.50, FTSE MIB +0.29% at 27,095.00, SMI +0.52% at 12,852.28, S&P 500 Futures +0.17%].
Market Focal Points/Key Themes: European indices open modestly lower but later turned around to rade generally higher; light trading due to holidays; among sectors trending higher are materials and industrials; while underperforming sectors inluce financials and technology; Gorge confirms made offer for iXblue; no major earnings expected during the upcoming US session.
Equities
- Energy: Gazprom [GAZP.RU] +1% (Has not booked gas transit capacity for exports via the Yamal-Europe pipeline for 7th day in a row).
- Financials: Commerzbank [CBK.DE] -1% (press interview).
- Telecom: Orange Belgium [OBEL.BE] +1% (acquisition).
Speakers
- Poland Fin Min Koscinski noted that 2022 average CPI was seen between 7.0-8.0% range (**Note: forecast raised after Poland energy regulator recently approved hikes in gas and electricity prices for households).
- Hungary Central Bank Gov Matolcsy stated that the most effective measure against inflation was raising interest rates. Reiterated stance that rate hike cycle to continue in 2022 Base Rate to 'catch up' with the 1-week deposit rate during H1 2022.
- Russia Foreign Min Lavrov noted that the talks with US on the security guarantees to take place immediately after Russian New Year holidays (**Note: Russian holidays end on Jan 9th).
Currencies/Fixed Income
- FX price action was subdued as Various markets remained closed on Monday due to Christmas break.
- TRY currency was softer by 5% as markets re-evaluate the Turkish govt measures on the Lira Deposits that looked to shield savers from a depreciating currency (**Note: Move followed a run of gains that snapped its seven-week falling streak for the Lira).
Economic data
- (FI) Finland Dec Consumer Confidence: -3.5 v +1.2 prior; Business Confidence: 18 v 23 prior.
- (NO) Norway Nov Retail Sales (includes auto/fuel) M/M: 0.9 v 0.9% prior.
- (TR) Turkey Dec Capacity Utilization: 78.7% v 78.1% prior.
- (TR) Turkey Dec Real Sector Confidence (seasonally adj): 110.1 v 112.0 prior; Real Sector Confidence NSA (unadj): 106.1 v 108.4 prior.- (RO) Romania Nov M3 Money Supply Y/Y: 14.7 v 15.7% prior.
- (CH) Swiss weekly Total Sight Deposits (CHF): 722.3B v 722.7B prior; Domestic Sight Deposits: 650.0B v 645.7B prior.
Fixed income Issuance
- None seen.
Looking ahead
- 05:25 (EU) Daily ECB Liquidity Stats.
- 06:00 (IL) Israel Nov Unemployment Rate: No est v 5.0% prior; Unemployment Rate (including covid effect): No est v 7.0% prior.
- 06:00 (IL) Israel to sell bonds.
- 06:25 (BR) Brazil Central Bank Weekly Economists Survey.
- 06:45 (US) Daily Libor Fixing.
- 07:00 (IN) India announces details of upcoming bond sale (held on Fridays).
- 08:00 (UK) No Daily Baltic Dry Bulk Index this week.
- 09:00 (FR) France Debt Agency (AFT) cancels weekly Bills.
- 10:30 (US) Dec Dallas Fed Manufacturing Activity Index: 13.0e v 11.8 prior.
- 11:30 (US) Treasury to sell 13-week and 26-week Bills.
- 13:00 (US) Treasury to sell 2-Year Notes.
- 16:00 (KR) South Korea Dec Consumer Confidence: No est v 107.6 prior.
- 18:30 (JP) Japan Nov Jobless Rate: 2.7%e v 2.7% prior; Job-To-Applicant Ratio: 1.16e v 1.15 prior.
- 18:50 (JP) Japan Nov Preliminary Industrial Production M/M: 4.8%e v 1.8% prior; Y/Y: +2.9%e v -4.1% prior.
- 22:00 (TH) Thailand Central Bank to sell THB50B in 3-month bills.
- 22:30 (HK) Hong Kong to sell 3-month and 6-month Bills.
- 23:00 (MY) Malaysia Nov Trade Balance (MYR): 19.0Be v 26.3B prior; Exports Y/Y: 29.0%e v 25.5% prior; Imports Y/Y: 29.9%e v 27.9% prior.
EUR/USD Remains Sideways: Elliott Wave Analysis
Markets can remain slow, especially today when some countries still have a day off. Stocks are higher, and it looks like a nice risk-on move but there is a threat for a potential pullback as coronavirus seems to be spreading really fast.
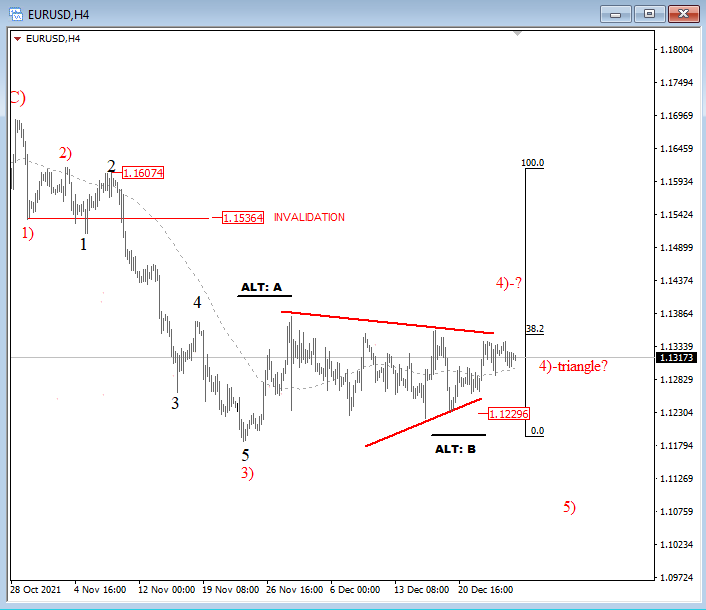
For now, however, the USD is weak while commodity currencies dominate between the currencies as metals and energy trade higher. EURUSD however is sideways, ideally forming a triangle which can be in wave 4, or in b of 4, so we will have to wait on more price data before one of the counts can be confirmed.
EUR/USD 4h Elliott Wave analysis
Gold Price Correcting Lower and Trading Below $1810
Gold price found support near $1,785 and started an upside correction against the US Dollar. The price broke the $1,800 level to move into a short-term positive zone.
Besides, there was a break above the $1,805 level and the 50 hourly simple moving average. However, the price is struggling to clear the $1,812 zone. It is now correcting lower and trading below $1,810 on FXOpen.
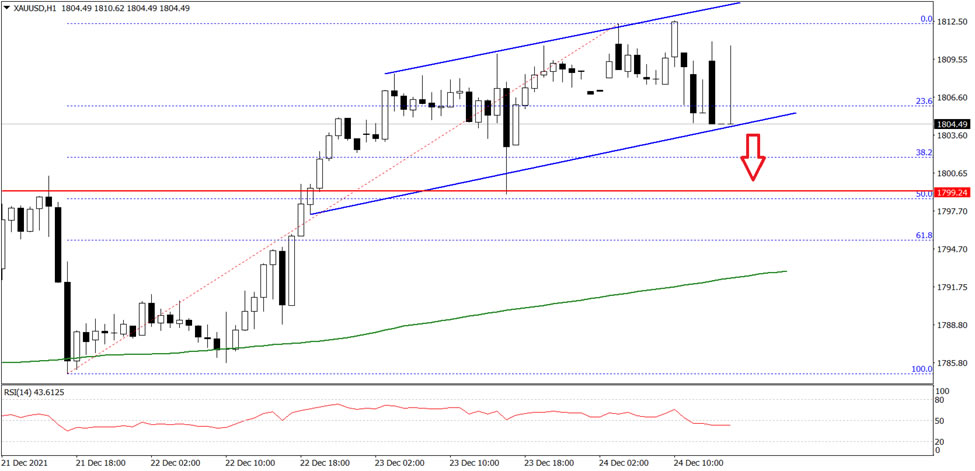
The price is testing a key bullish trend line at $1,804 on the hourly chart. The first key support on the downside is near the $1,800 level, below which there is a risk of more downsides. In the stated case, the price could test $1,780.
On the upside, the price is facing resistance near the $1,810 level. The next main resistance could be near the $1,812 level, above which the price could rise towards the $1,820 level.
EURUSD’s 6-Month Decline Oscillates around 1.13 Mark
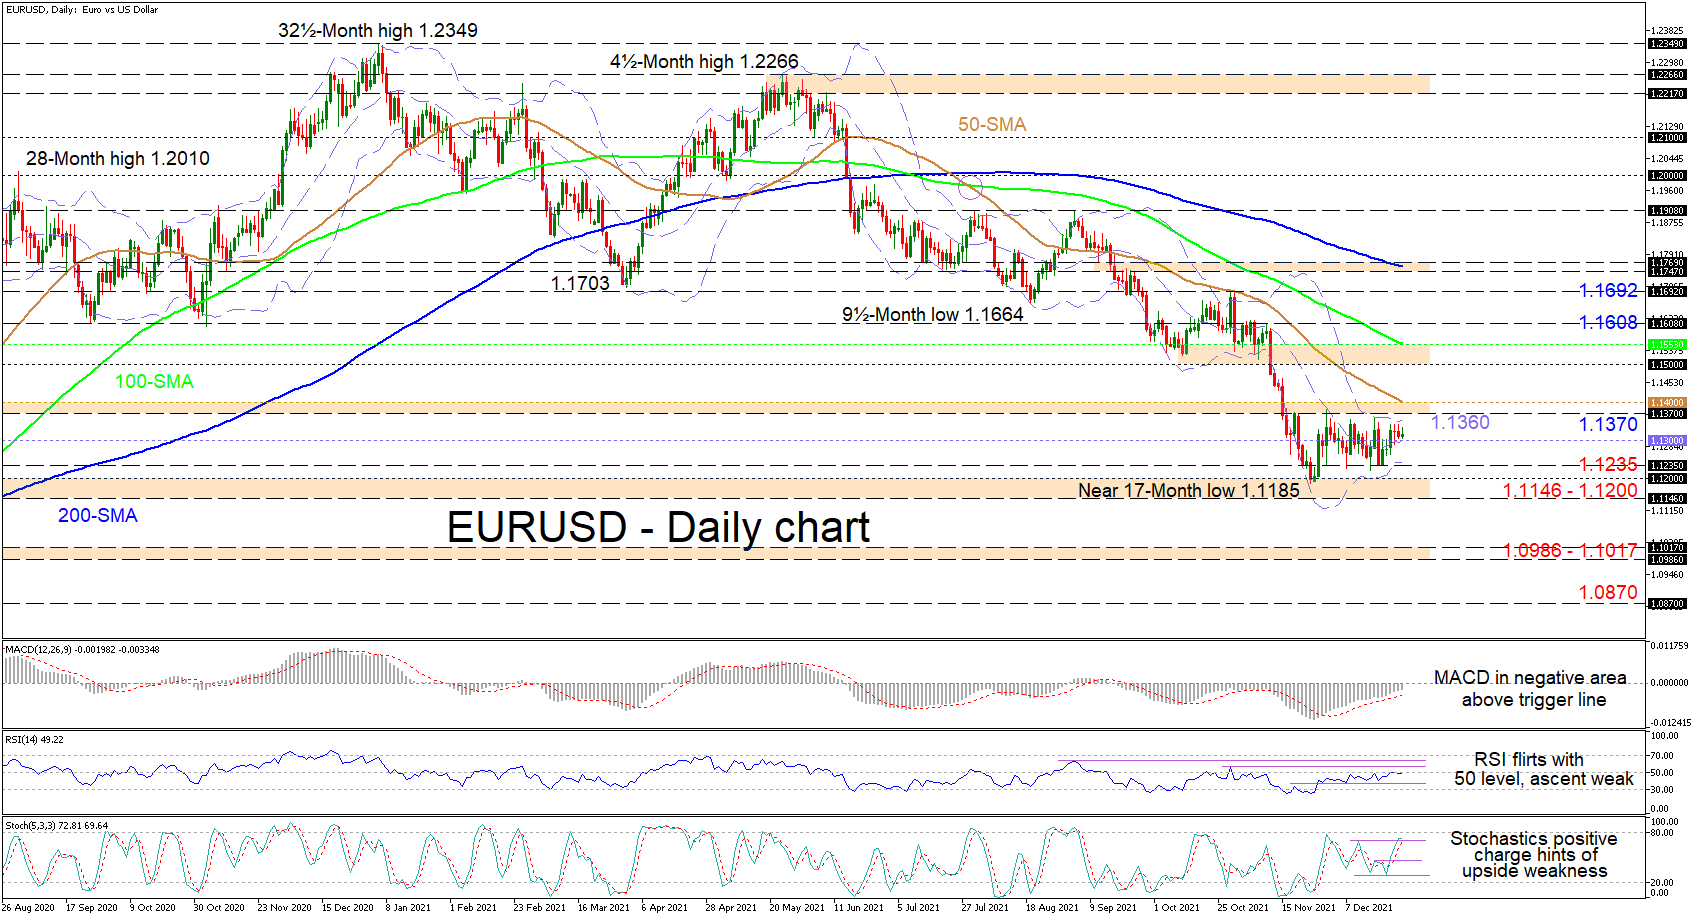
EURUSD is slightly above the mid-Bollinger band and appears set to continue its one-month consolidation in the vicinity of the 1.1300 handle. That said, downside risks remain, something also being mirrored in the falling simple moving averages (SMAs), which are defending the bearish bearing.
The short-term oscillators are indicating that negative momentum has softened. The MACD is rising above its red trigger line closing in on the zero mark, while the RSI is toying with the 50 neutral threshold, showing that bullish drive is vulnerable. Moreover, the positively charged stochastic oscillator is hinting that buying power is starting to fade.
Noteworthy is the squeeze in the Bollinger bands, which is signalling that a surge in volatility is expected, which suggests a larger directional move may evolve.
If the pair’s positive pressures diminish further and the price slides underneath the mid-Bollinger band at 1.1300, sellers could face initial downside constraints around the 1.1235 barrier, where the lower Bollinger band also resides. In order for the decline to resume, sellers would need to break below the 1.1146-1.1200 support border, reinforced by the lows of June 2020 and the near 17-month trough of 1.1185. Should this floor of the fresh range happen to give way, sellers could target the 1.0986-1.1017 region, formed over the mid-April to mid-May 2020 period. If selling forces dominate, the bears could then aim for the trough of 1.0870, identified in May 2020.
Alternatively, in order to underpin buyers’ confidence, the price would need to surpass the upper Bollinger band at 1.1360 and the adjacent 1.1370-1.1400 resistance boundary. Climbing from here, the 1.1500-1.1553 resistance section may attempt to impede buyers from gaining ground towards the 1.1608 and 1.1692 highs respectively.
Summarizing, even though EURUSD is lacking strong directional momentum, bearish risks endure as the price persists beneath the SMAs and the 1.1400 handle.
US Stock Futures Rise amid Christmas Holiday Travel Chaos
The British pound held steady on Monday morning amid a low-volume environment. The currency has been rising as investors adjust their expectations of the Omicron variant. While the number of Covid-19 cases in the country has been rising, evidence shows that the number of deaths has not increased dramatically. This is in line with two reports published last month that showed the Omicron variant is milder than Delta. Therefore, investors believe that the Bank of England (BOE) will embrace a relatively hawkish tone in the coming year.
American futures tilted higher on Monday, even after the latest flight cancellation numbers. During the Christmas weekend, it was reported that more than 6,000 flights were cancelled globally. This happened as more employees in airlines called in sick amid a surge in Covid-19 cases. Some of the companies that cancelled flights were Delta, Southwest, United, and American. Other leading global airlines that cancelled flights were China Eastern and Air India. These cancellations will most definitely affect company results.
The economic calendar will have no major events today as most investors remain at home with their families. Some countries like the UK, Australia, Canada, and New Zealand will also be on holiday today. Therefore, the volume will be significantly low. Still, investors will be focusing on the cryptocurrency industry today. Most coins like Bitcoin, Ethereum, and Litecoin made a bullish breakout on Friday, although the upward trend has slowed.
GBPUSD
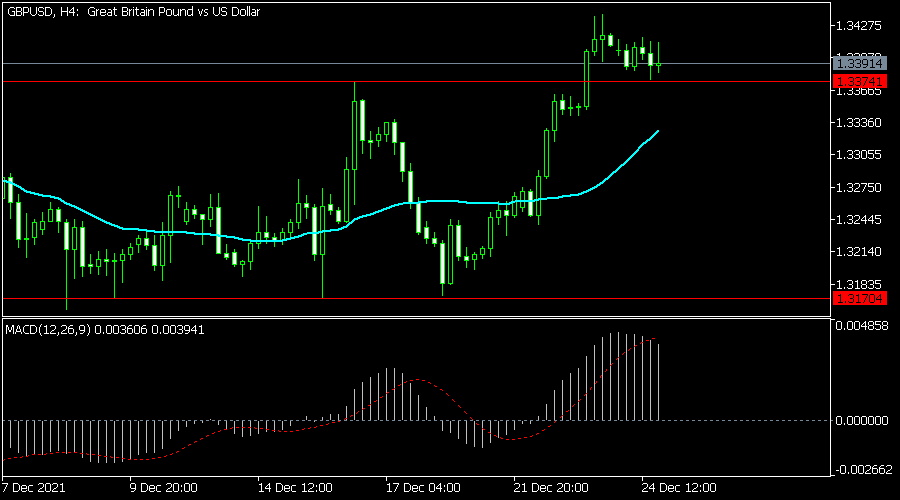
The GBPUSD pair has been in a strong bullish trend in the past few days. It is trading at 1.3391, which is a few points below last week’s high of 1.3437. On the four-hour chart, the pair has formed a break and retest pattern, since it is currently at the key support at 1.3391. This price was the highest level on December 16. It is also slightly above the 25-day and 50-day moving averages. Therefore, there is a likelihood that the pair will keep rising today.
EURUSD
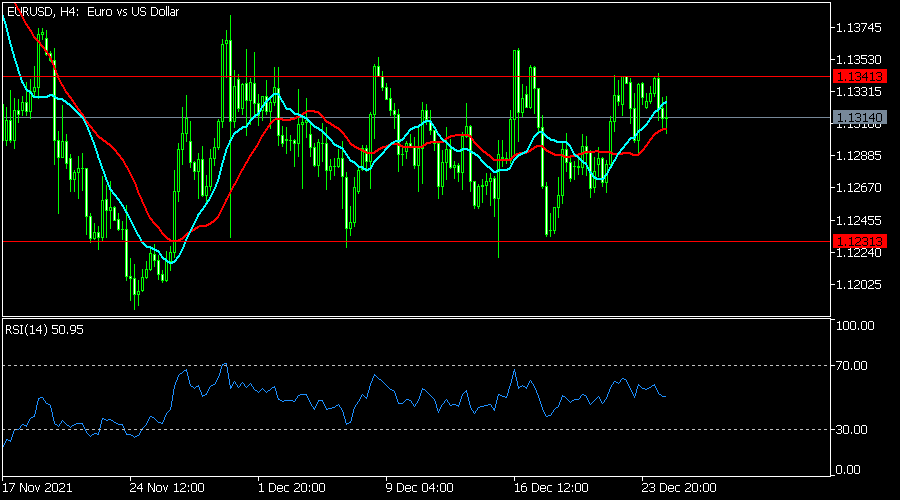
The EURUSD pair is in a tight range as investors focus on the Covid situation in Europe and the US. The pair is trading at 1.1315, where it has been in the past few days. It is slightly below the 25-day and 50-day moving averages. It has moved between the horizontal channel shown in red, while the Relative Strength Index (RSI) is at the neutral level. Therefore, the pair will likely remain in this range for a while.
XBRUSD
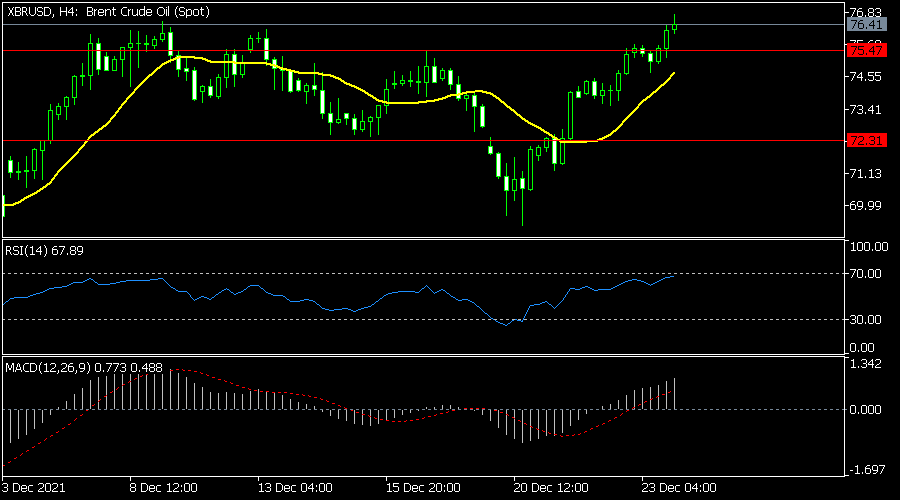
The XBRUSD pair has been in a strong bullish trend in the past few days. It is trading at 76.40, which is the highest it has been since December 9. It has even moved above the key resistance level at 76.0 and the 25-day moving average. The RSI and the MACD have also been rising. Therefore, the pair will likely keep rising as bulls target the key resistance level at 77.
Technical Outlook and Review
DXY:
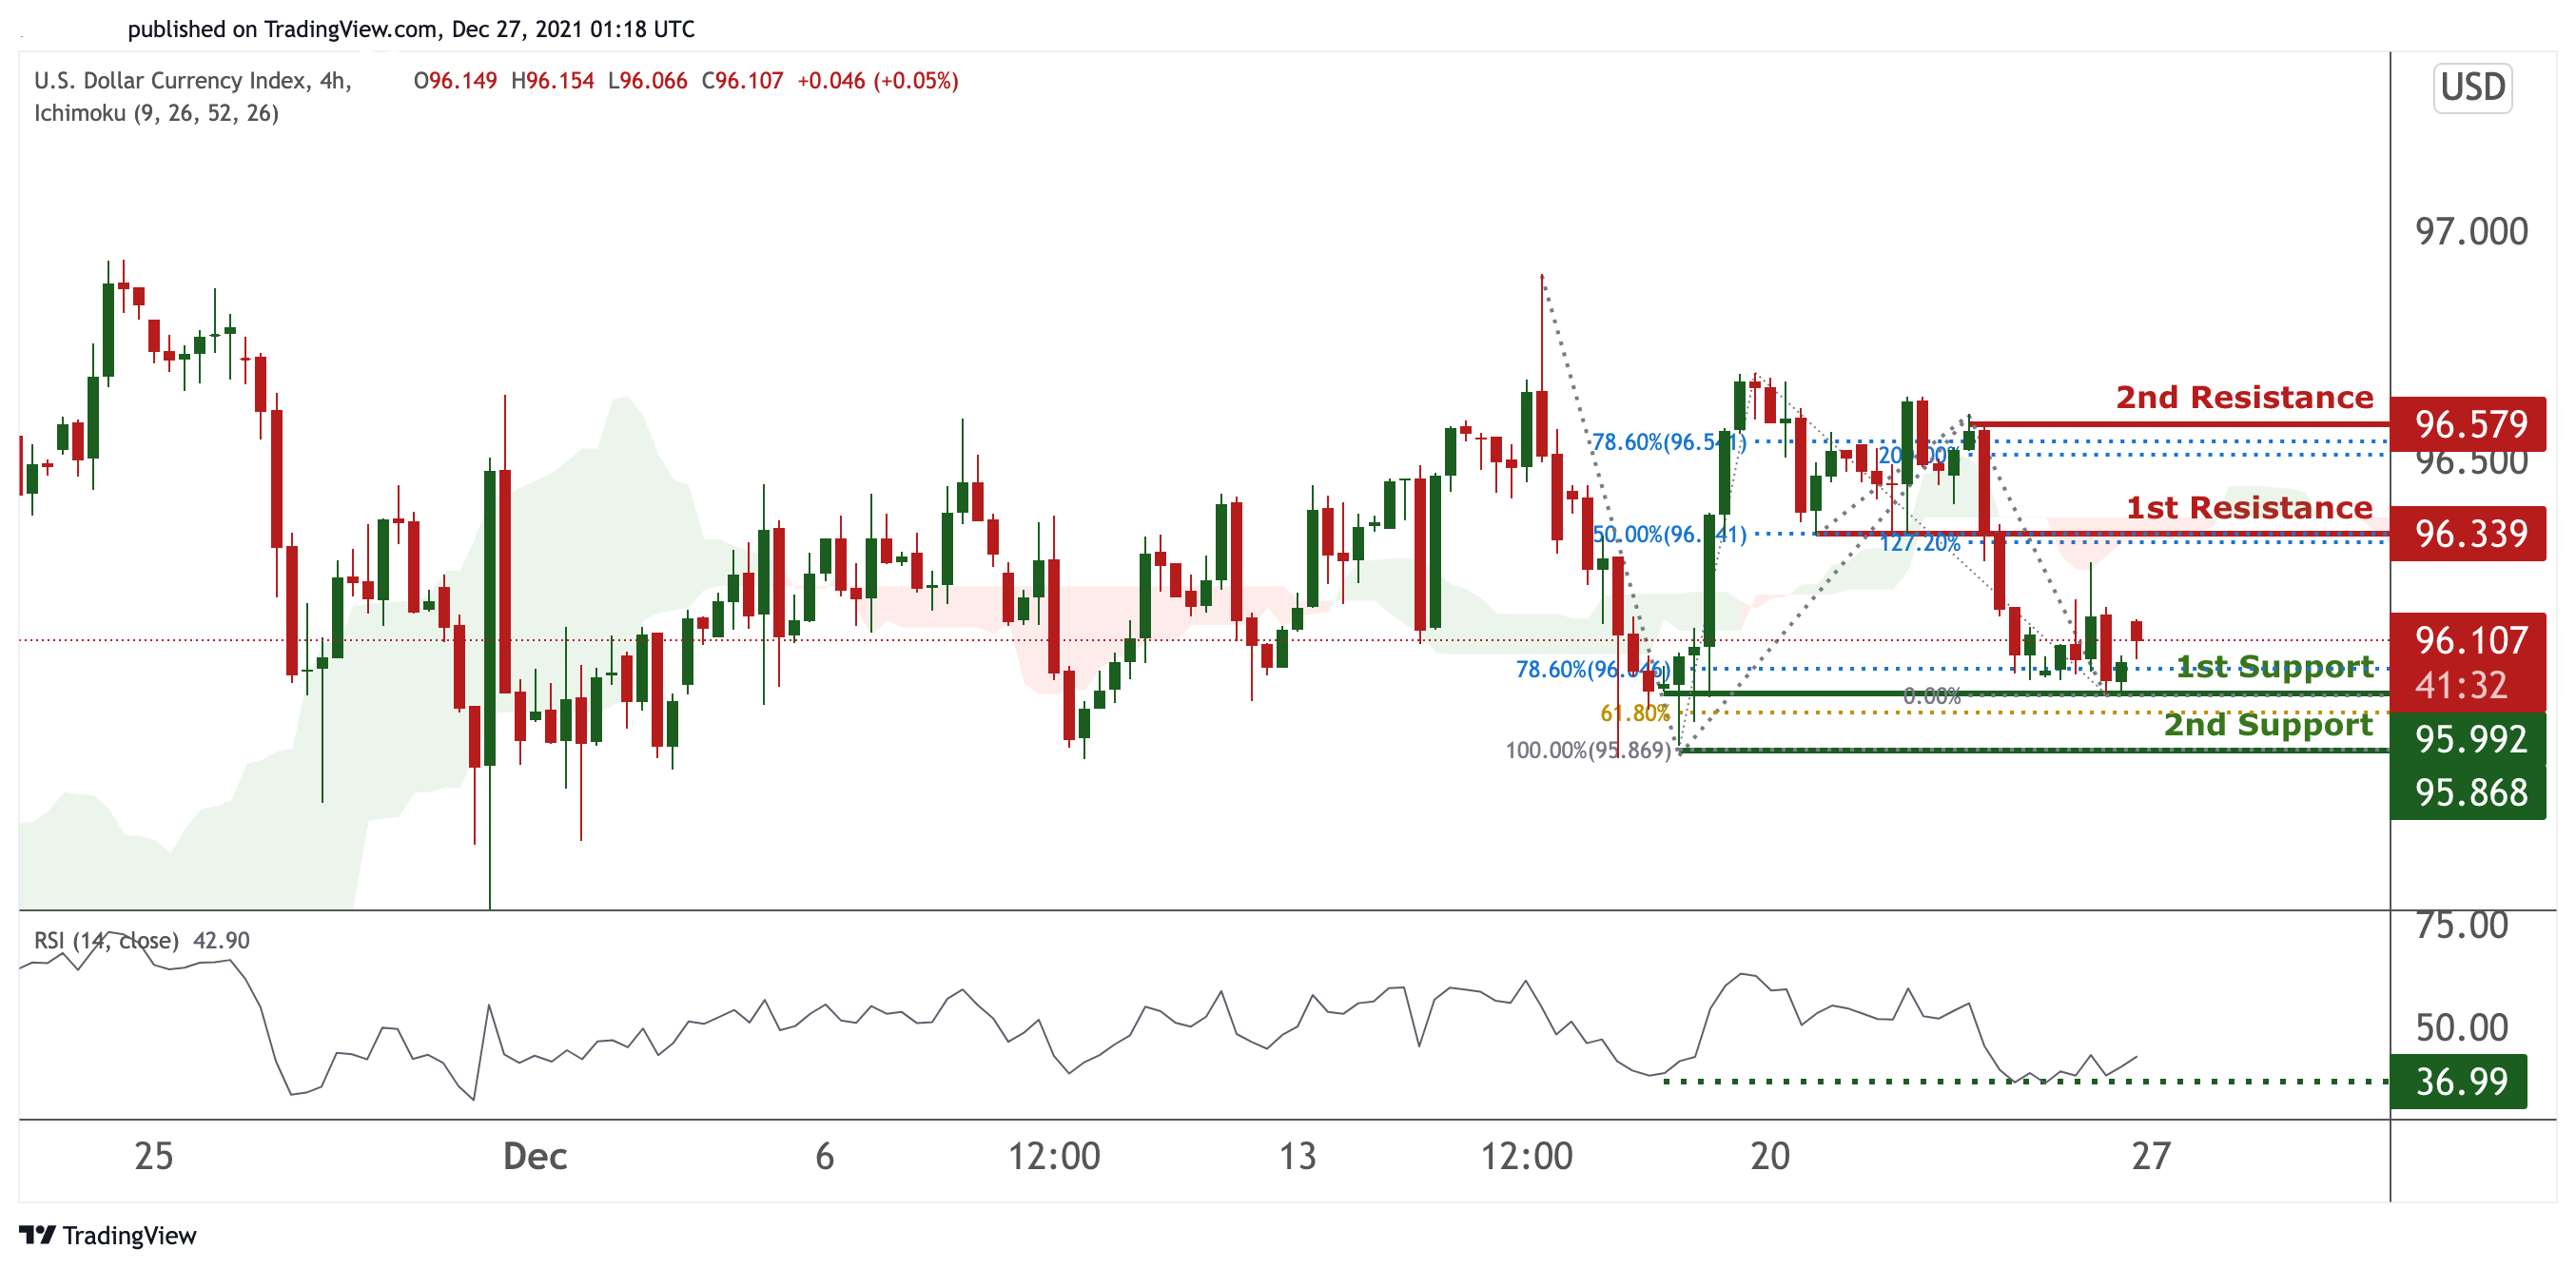
On the H4 timeframe, prices have reached a pivot which is a graphical swing low. We would expect a bounce from our 1st support at 95.992 in line with 78.6% Fibonacci retracement towards our 1st resistance at 96.339 in line with 127.2% Fibonacci extension and 50% Fibonacci retracement. RSI is at a level where bounces previously occurred and also ichimoku clouds are showing bullish momentum.
Areas of consideration:
- H4 time frame, 1st resistance at 96.339
- H4 time frame, 1st support at 95.992
XAU/USD (GOLD):
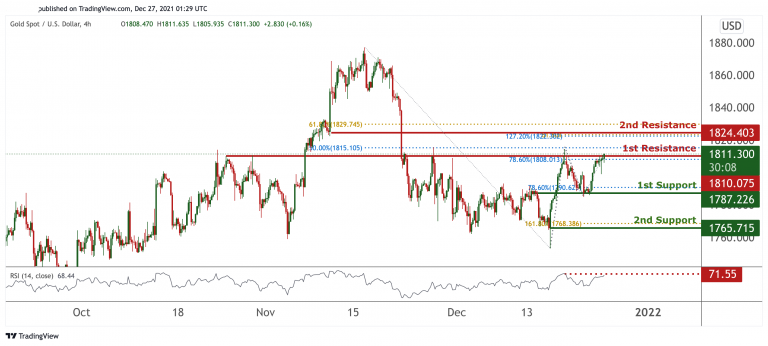
On the H4 chart, prices are at a graphical strong overlap resistance. We see potential for prices to dip from our 1st resistance at 1810.075 in line with 78.6% Fibonacci extension and 50% Fibonacci retracement towards our 1st support at 1787.226 in line with 78.6% Fibonacci retracement. RSI is at a level where dips previously occurred. Alternatively, breaking our 1st resistance will find prices climbing further towards our 2nd resistance at 1824.403 in line with 127.2% and 61.8% Fibonacci extension and 61.8% Fibonacci retracement.
Areas of consideration:
- 4h 1st support at 1787.226
- 4h 1st resistance at 1810.075
GBP/USD
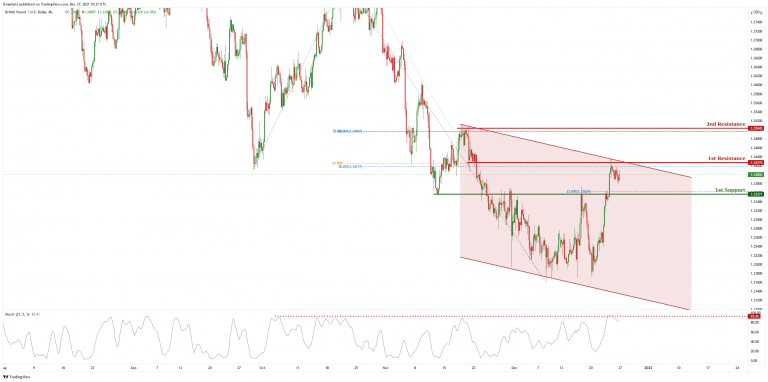
On the H4 chart, price is trading in a descending channel and near 1st resistance level of 1.34726 which is also 38.2% Fibonacci retracement and 61.8% Fibonacci projection. Price can potentially dip to the 1st support level of 1.33751 which is also the graphical overlap support and 23.6% Fibonacci retracement. Our bearish bias is supported by a stochastic indicator as it is near the resistance level.
Areas of consideration :
- H4 1st resistance at 1.34276
- H4 1st support 1.33571
USD/CHF
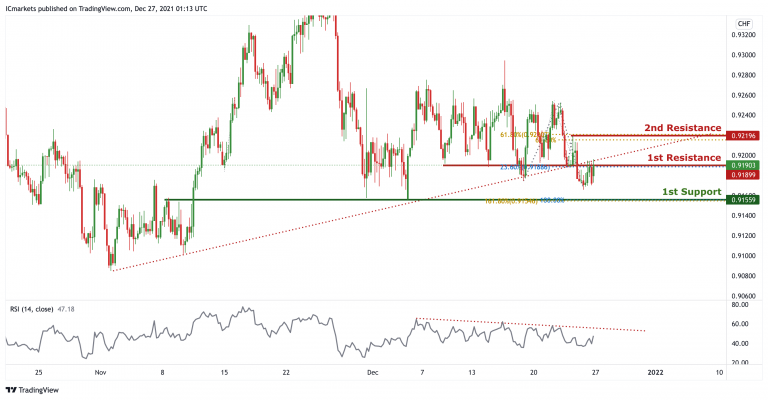
On the H4 timeframe, price broke out of the ascending trendline support, signifying potential bearish momentum. We can expect price to drop from 1st Resistance in line with 23.6% fibonacci retracement and graphical overlap resistance towards 1st Support in line with graphical overlap support, 100% Fibonacci projection and 161.8% Fibonacci extension. Our bearish bias is further supported by the RSI indicator abiding to the descending trendline resistance.
Areas of consideration:
- Watch 1st Support at 0.91559
- Watch 1st Resistance at 0.91899
EUR/USD :
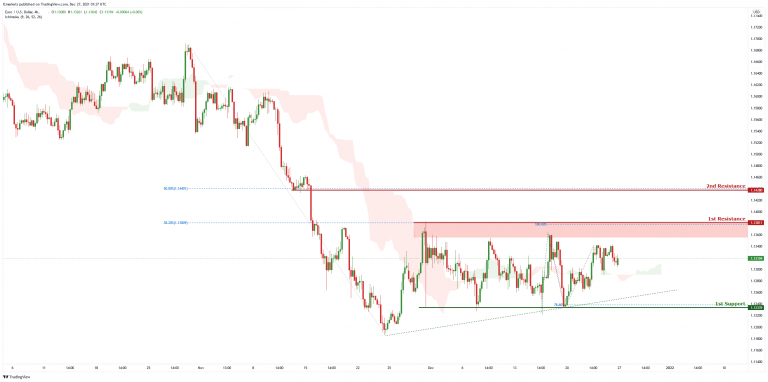
On the H4 chart, price is abiding by the ascending trendline and near the first resistance level of 1.13811 which is also 100% Fibonacci projection and 38.2% Fibonacci retracement. Price can potentially dip to the 1st support level of 1.12339 which is also 78.6% Fibonacci projection. Our bearish bias is supported by the ichimoku cloud indicator as price is trading under the cloud
Areas of consideration :
- H4 1st resistance at 1.13811
- H4 1st support at 1.12339
USD/JPY:
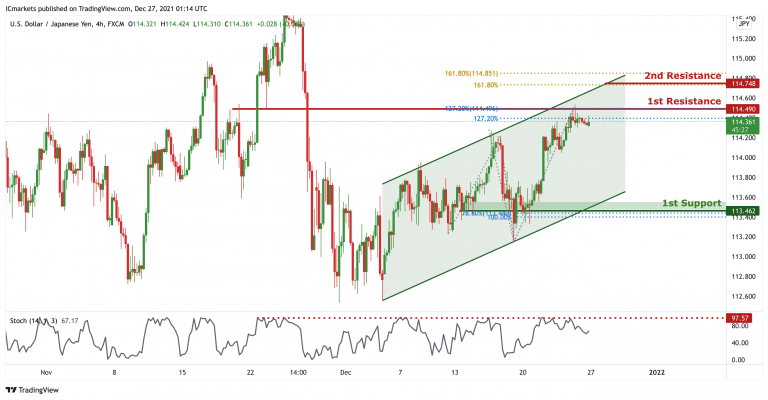
On the H4 timeframe, price is abiding to the ascending channel, showing an overall bullish momentum. However, we can expect a short term bearish momentum and drop from 1st resistance in line with previous high ,127.2% Fibonacci projection and 127.2% Fibonacci retracement towards 1st Support in line with horizontal support, 100% Fibonacci projection and 78.6% Fibonacci retracement. Our bearish bias is further supported by stochastic where the %K line dropped from the resistance.
Areas of consideration:
- H4 1st resistance level 114.490
- H4 1st support level 113.462
AUD/USD:
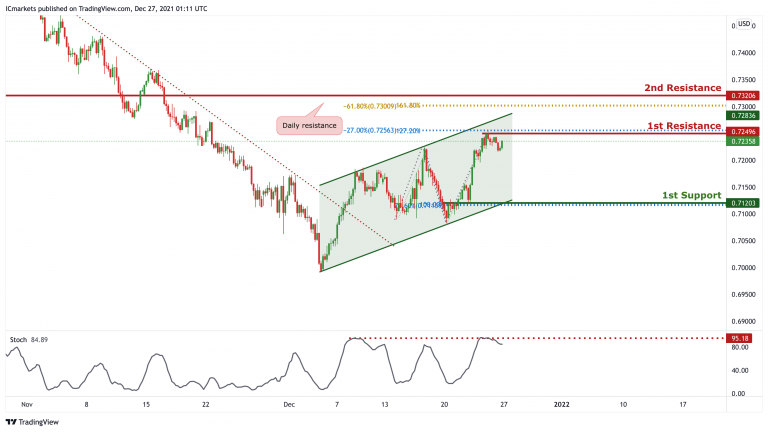
On the H4, price is reacting in an ascending channel, signifying bullish momentum. However, price is currently at a resistance, we can expect price to drop from 1st Resistance in line with 127.2% Fibonacci projection and -27.2% Fibonacci Extension towards 1st Support in line with 100% Fibonacci projection and 78.6% Fibonacci retracement. Our short-term bearish bias is further supported by the stochastic indicator where the %K line is at the resistance level. Areas of consideration:
- H4 1st Support level 0.71203
- H4 1st resistance level 0.72496
NZD/USD:
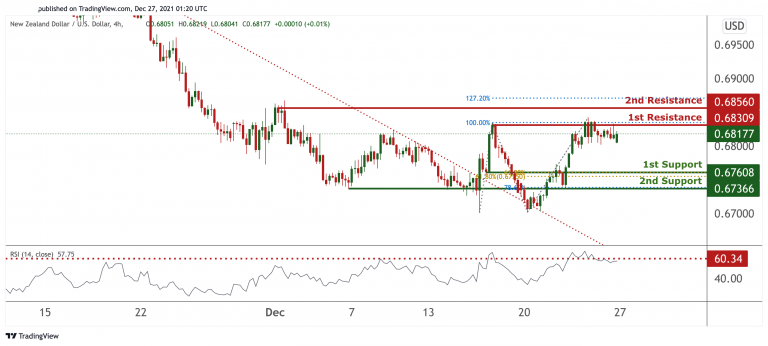
On the H4 timeframe, prices are at a graphical swing high and are experiencing a squeeze. We see potential for prices to dip from our 1st resistance at 0.68309 in line with 100% Fibonacci extension towards our 1st support at 0.67608 which is an area of Fibonacci confluences. RSI at a level where dips usually occur. If prices break our 1st resistance, we can potentially find prices climbing higher towards our 2nd resistance at 0.68560 in line with 127.2% Fibonacci extension.
Areas of consideration:
- H4 time frame, 1st resistance at 0.68309
- H4 time frame, 1st support at 0.67609
USD/CAD:
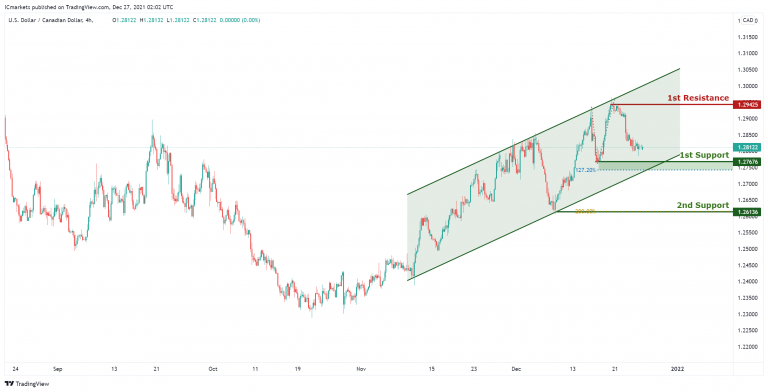
On the H4 timeframe,with price moving in the ascending channel, we have a bullish bias that price will rise from 1st support at 1.27676 in line with the graphical swing low support and 127.2% Fibonacci extension to 1st resistance at 1.29425 in line with the graphical swing high resistance. Alternatively, we may see price break 1st support and head for 2nd support at 1.26136 in line with the horizontal swing low support and 200% Fibonacci projection.
Areas of consideration:
- H4 time frame, support at 1.27676
- H4 time frame, resistance at 1.29425
OIL:
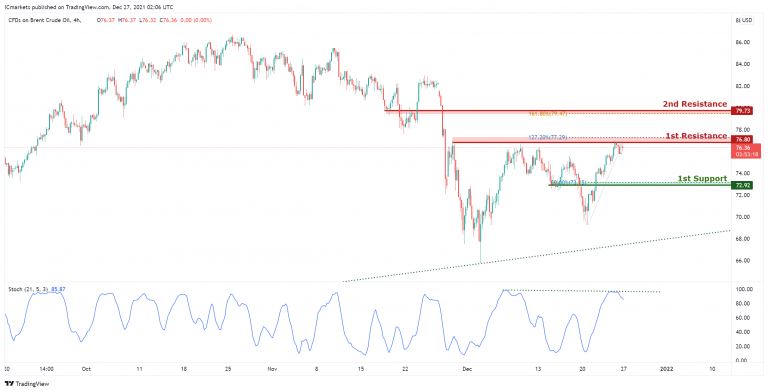
On the H4 timeframe,with price approaching the resistance of the stochastics indicator, we have a bearish bias that price will drop to 1st support at 74.92 in line with the graphical overlap support and 50% Fibonacci retracement from 1st resistance at 76.80 in line with the 127.2% Fibonacci projection and graphical swing high resistance. Alternatively, we may see price break 1st resistance and head for 2nd resistance at 79.73 in line with the horizontal swing high resistance and 161.8% Fibonaccai extension.
Areas of consideration:
- H4 time frame, 1st resistance of 80
- H4 time frame, 1st support of 92
Dow Jones Industrial Average:
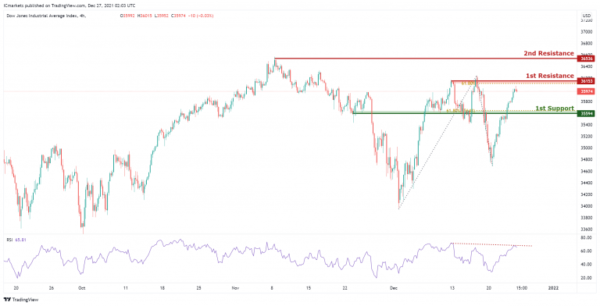
On the H4 timeframe,with price approaching the resistance of the stochastics indicator, we have a bearish bias that price will drop to 1st support at 35594 in line with the graphical overlap support and 61.8% Fibonacci retracement from 1st resistance at 36153 in line with the 61.8% Fibonacci retracement and graphical swing high resistance. Alternatively, we may see price break 1st resistance and head for 2nd resistance at 36536 in line with the horizontal swing high resistance.
Area of consideration:
- 4H resistance at 36153
- 4H support at 35594