Sample Category Title
USDCAD Losses Ground; Long-Term Bullish Outlook Maintained
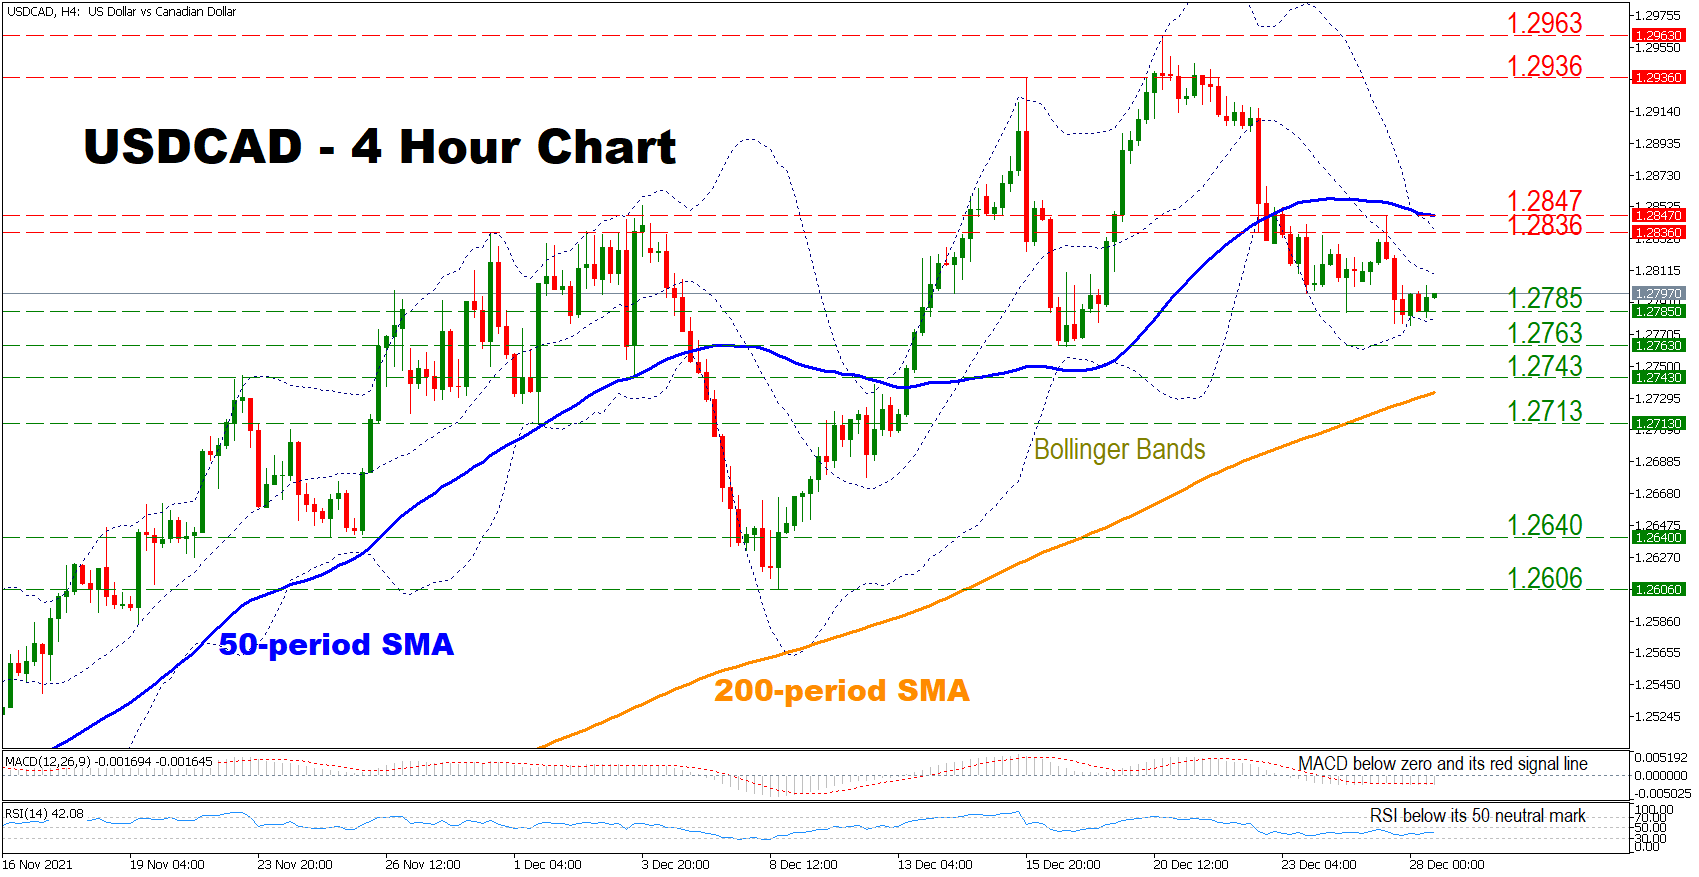
USDCAD has retreated from its December high amid strengthening negative momentum, and is currently found near its lower Bollinger Band indicating that an immediate upward movement should not be ruled out. However, despite the negativity in the short-term, the price is trading way above its 200-period SMA, reinforcing the pair's long-term bullish outlook.
Short-term momentum indicators are reflecting a negative bias as the RSI is located below its 50 neutral mark, while the MACD is found below zero and its red signal line.
Should the bulls regain control, initial resistance might be found at the 1.2836 level before moving towards the region that includes the 50-period SMA and the 1.2847 obstacle. A break above the latter could revive the pair’s positive momentum, opening the door towards the 1.2936 point, before buyers shift their attention towards the 1.2963 barrier.
On the flip side, if the price crosses below the 1.2785 level, support might then be found at the 1.2763 obstacle. A break below that level could pave the way towards the 1.2743 barrier before sellers turn to the 200-period SMA currently at 1.2733. A decisive move below the latter could turn the fortunes around for the pair, opening the door towards the 1.2713 level.
In brief, despite the bearish short-term outlook, the long term picture remains positive. For sentiment to change, sellers would need to break below the 200-period SMA.
Quiet Markets Continue as Year-End Holidays Approach
Notes/Observations
- Continued holidays in overseas markets kept participation light (UK, Ireland, Australia, New Zealand and Canada off today).
- Concern builds over rising restrictions from France to China in efforts to curb the spread of Covid-19
Overall markets globally appear optimistic that the fallout from Omicron would be contained. - market participants await fresh news on the omicron variant and mulled its impact on the global economy.
Asia
- Japan Nov Jobless Rate 2.8% v 2.7%e.
- Japan Nov Preliminary Industrial Production beat expectations aided by easing global supply chain bottlenecks (M/M: 7.2% v 4.8%e (highest since 2013); Y/Y: 5.4% v 2.9%e.
- China PBOC Open Market Operation (OMO) was the largest in 2 months: alloted CNY200B in 7-day reverse repos v CNY50B prior; Net inject: CNY190B v CNY40B prior.
- China FX Regulator SAFE said to increase forex (FX) market monitoring in 2022. To step up risk prevention and control and promote cross-border investment of private equity investment funds.
- China Evergrande faces two bond payments today in test of investor confidence (Company has ~$255M in bond coupon payments due on Dec 28th (Tues) [~$50.4M relates to Jun 2023 USD bond, ~$204.8M relates to Jun 2025 USD bond].
Europe
- France PM Castex unveiled proposals to fight Omicron variant with measures to take effect Jan 15th if Parliament approved them. PM noted that Covid health pass to become vaccine pass with required vaccination; Negative test would no longer suffice to enter public places; Home working to become mandatory three days per week at least if possible.
Speakers/Fixed income/FX/Commodities/Erratum
Equities
- Indices [Stoxx600 +1.04% at 488.06, FTSE closed, DAX +0.72% at 15,948.82, CAC-40 +0.48% at 7,174.97, IBEX-35 +0.72% at 8,684.48, FTSE MIB +0.83% at 27,457.00, SMI +0.67% at 12,952.79, S&P 500 Futures +0.25%].
- Market Focal Points/Key Themes: European indices started the day in general positive territory and stayed upbeat through the thin trading session; better performing sectors lead by industirals and materials; under performing sectors include consumer discretionary and financials; UK and Ireland closed for holiday; no major earnings expected during the upcoming US session.
Equities
- Energy: Gazprom [GAZP.RU] +1% (Has not booked gas transit capacity for exports via the Yamal-Europe pipeline for 8th day in a row).
- Technology: S&T AG [SANT.DE] +1.5% (responds to short-seller report).
Speakers
- Poland Central Bank's Lon wrote an Oped article that warned that too tight of monetary policy might cool future economic growth. He saw chance that CPI pressures to ease in early 2022. He added that could back a small rate hike in Jan.
- China PBoC Gov Yi Gang reiterated view that country's financial risks were overall controllable. Market expectations on certain property companies were improving and that the adjustment in property market to helped its development.
Currencies/Fixed Income
- Some slight unwinding of safe-haven flows helped to soften bothe the USD and JPY currencies despite concerns over rising restrictions from France to China in efforts to curb the spread of Covid-19. The Overall take continued to see markets globally appear optimistic that the fallout from Omicron would be contained.
- EUR/USD drifting slightly higher at test 1.1330 area. The USD still seen on firm legs on central bank divergence. Money markets currently pricing over a 50% odds for a first quarter-point rate hike by March and were close to fully pricing for three rate hikes by December 2022.
- USD/JPY probing the 115 area.
Economic data
- (ES) Spain Nov Adjusted Retail Sales Y/Y: +4.9 v -0.7% prior; Retail Sales (unadj) Y/Y: +5.9 v -2.5% prior.
- (SE) Sweden Nov Trade Balance (SEK): 0.3B v 0.7B prior.
- (SE) Sweden Nov Household Lending Y/Y: 6.6% v 6.6% prior.
- (HK) Hong Kong Nov Trade Balance (HKD): -11.6B -35.0Be; Exports Y/Y: 25.0% v 18.0%e; Imports Y/Y: 18.3%e.
Fixed income Issuance
- None seen.
Looking Ahead
- (PT) Portugal Year-to-Date Budget Report.
- 05:15 (CH) Switzerland to sell 12-month Bills.
- 05:25 (EU) Daily ECB Liquidity Stats.
- 05:30 (HU) Hungary Debt Agency (AKK) to sell 3-Month Bills.
- 05:30 (ZA) South Africa cancels weekly Bonds Auction.
- 05:30 (EU) ECB allotment in 7-Day Main Refinancing Tender (MRO).
- 06:45 (US) Daily Libor Fixing.
- 07:00 (BR) Brazil Oct National Unemployment Rate: 12.3%e v 12.6% prior.
- 07:30 (BR) Brazil Nov Total Outstanding Loans (BRL): 4.542Te v 4.497T prior; M/M: 1.4%e v 1.5% prior; Personal Loan Default Rate: No est v 4.3% prior.
- 08:00 (UK) No Daily Baltic Dry Bulk Index this week.
- 08:00 (RU) Russia announcement on upcoming OFZ bond issuance (held on Wed).
- 08:55 (US) Weekly Redbook LFL Sales data.
- 09:00 (US) Oct FHFA House Price Index M/M: 0.9%e v 0.9% prior.
- 09:00 (US) Oct S&P/Case-Shiller House Price Index (20-City) M/M: 0.90%e v 0.96% prior; Y/Y: 18.60%e v 19.05% prior.
- 09:00 (US) Oct S&P/Case-Shiller House Price Index (overall) Y/Y: No est v 19.51% prior.
- 09:00 (EU) Weekly ECB Forex Reserves.
- 09:00 (EU) ECB weekly QE bond buying update.
- 10:00 (US) Dec Richmond Fed Manufacturing Index: 11e v 11 prior.
- 10:00 (MX) Mexico Weekly International Reserve data.
- 11:30 (US) Treasury to sell 52-Week Bills.
- 13:00 (US) Treasury to sell 5-Year Notes.
- 14:00 (AR) Argentina Oct Shop Center Sales Y/Y: No est v 307.0% prior; Supermarket Sales Y/Y: No est v 6.4% prior.
- 16:00 (KR) South Korea Jan Business Manufacturing Survey: No est v 88 prior; Non-Manufacturing Survey: No est v 83 prior.
- 16:30 (US) Weekly API Oil Inventories.
- 19:01 (IE) Bank of Ireland Dec Economic Pulse: No est v 83.2 prior.
- 23:00 (TH) Thailand Nov ISIC Manufacturing Production Index Y/Y: 2.8%e v 2.9% prior; Capacity Utilization: No est v 64.1% prior.
Bitcoin could be heading back to 45560 support
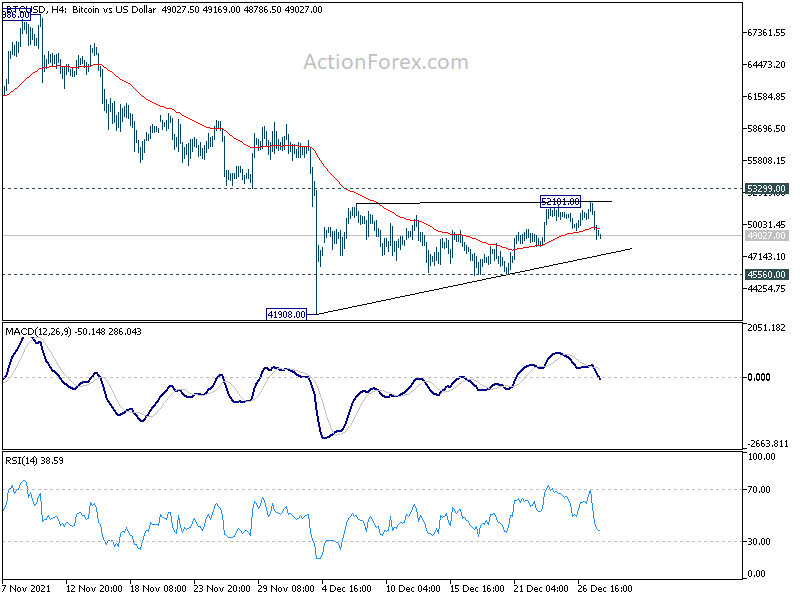
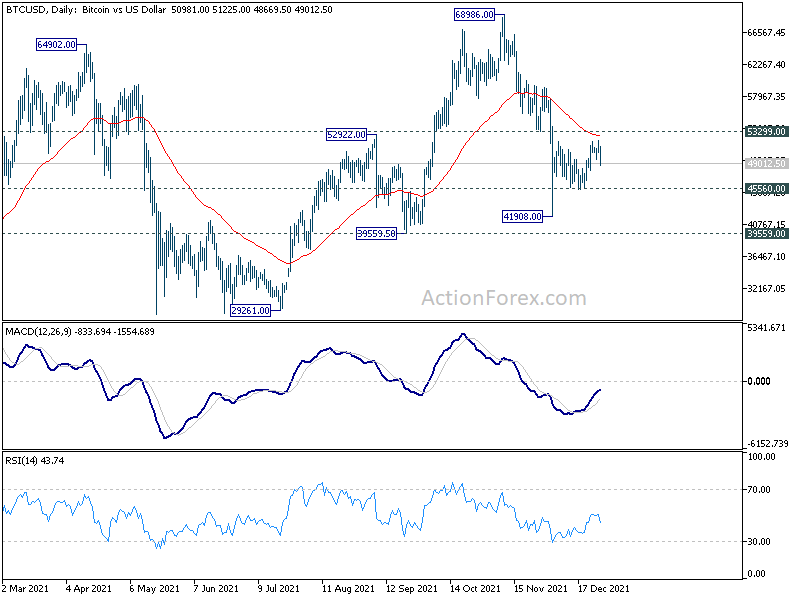
We're viewing Bitcoin's price actions from 41908 spike low as a corrective pattern. Even in case of another rise, strong resistance should be see from 53299 support turned resistance to limit upside. Indeed, break of 45560 support will argue that fall from 68986 is resuming through 41908.
Today's fall has pushed Bitcoin back below 50k handle and 4 hour 55 EMA. We'll now monitor if there is more downside acceleration to push it through 45560 to trigger the above bearish case.
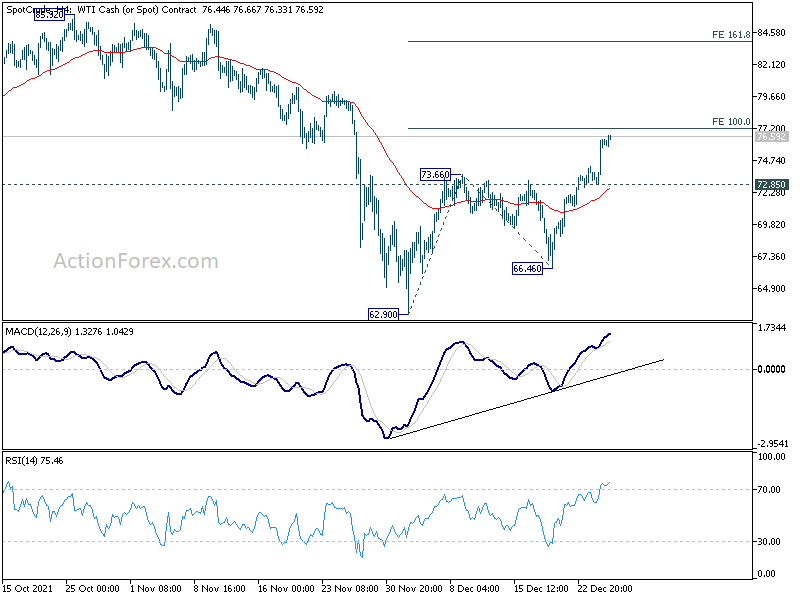
WTI oil extending rally, eyeing 77.2 projection level
Oil prices follow broad based risk-on sentiments and jumped higher this week. Investors seem to be getting Omicron worries behind, as the health impacts of infection look much milder than feared.
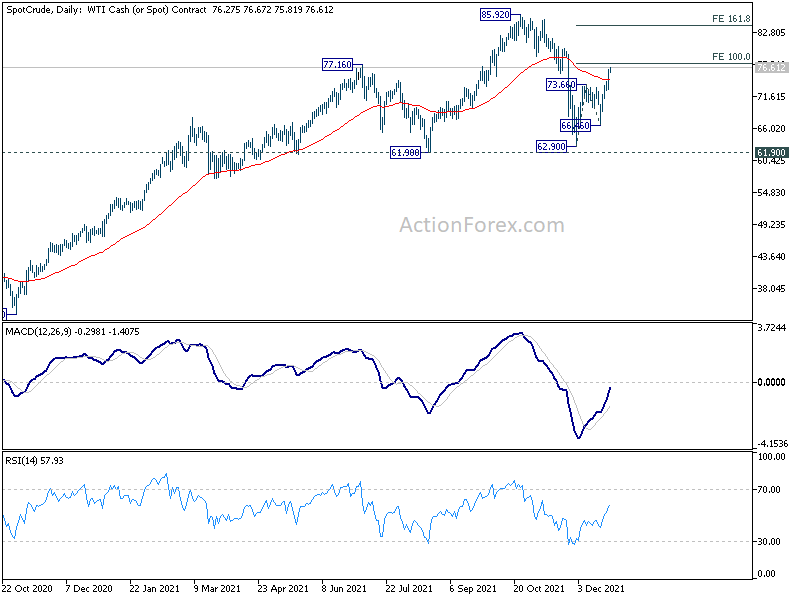
With the strong break of 55 day EMA, WTI's pull back from 85.92 has likely completed at 62.90 already. Immediate focus is now on 100% projection of 62.90 to 73.66 from 66.46 at 77.22. Firm break there could bring upside acceleration to 161.8% projection at 83.86.
For now, we're viewing the pattern from 85.92 has a sideway corrective pattern, with range set between 61.90 and 85.92. Hence, we'd not expecting a break of 85.92 any time soon. Instead, there should at least be one more falling leg to complete the pattern. Let's see.
Swiss Franc Snoozing
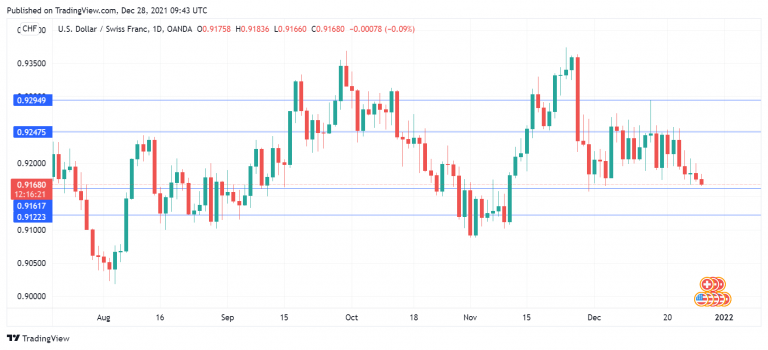
The Swiss franc flexed some muscle in the days leading into Christmas, but the currency is almost unchanged this week, trading around 0.9170.
Swiss franc steady despite Omicron
The Omicron variant continues to spread as countries scramble to deal with the newest wave of Covid. The good news is that most reports have shown that Omicron is believed to be far milder than Delta, which hopefully means that this latest Covid wave will not cause as much devastation as Delta. However, there is no question that Omicron is far more contagious than Delta and poses a serious health hazard to unvaccinated people, which could potentially overload hospitals.
The markets are extremely reactionary now, especially this week with many market participants on holiday and the markets marked by illiquidity. We are seeing sharp moves from risk currencies such as the Australian dollar, while USD/CHF, both of which are safe-haven assets, has showed limited movement. It’s a light economic calendar this week, but there are two Swiss events that could have an impact on the movement of the Swiss franc – Credit Suisse Economic Expectations on Wednesday and the KOF Economic Barometer on Thursday.
The uncertainty surrounding Omicron has captivated the market’s attention, overshadowing other issues such as a Federal Reserve rate hike. The equity markets have been on the rise, buoyed by reports that Omicron is less severe than Delta and may not impact the US economy as much as feared. The US consumer is spending and unemployment is at low levels, which has kept the recovery going strong. Fed Watch has priced in a 53% chance of a 25-bps hike in March, and the odds of a rate hike will surely change based on the impact of Omicron on the US economy.
USD/CHF Technical
- There is weak support at 0.9161, followed by support at 0.9247
- USD/CHF faces resistance at 0.9247 and 0.9294
GBPUSD Rallies from 1-Year Lows but Downside Risks Remain
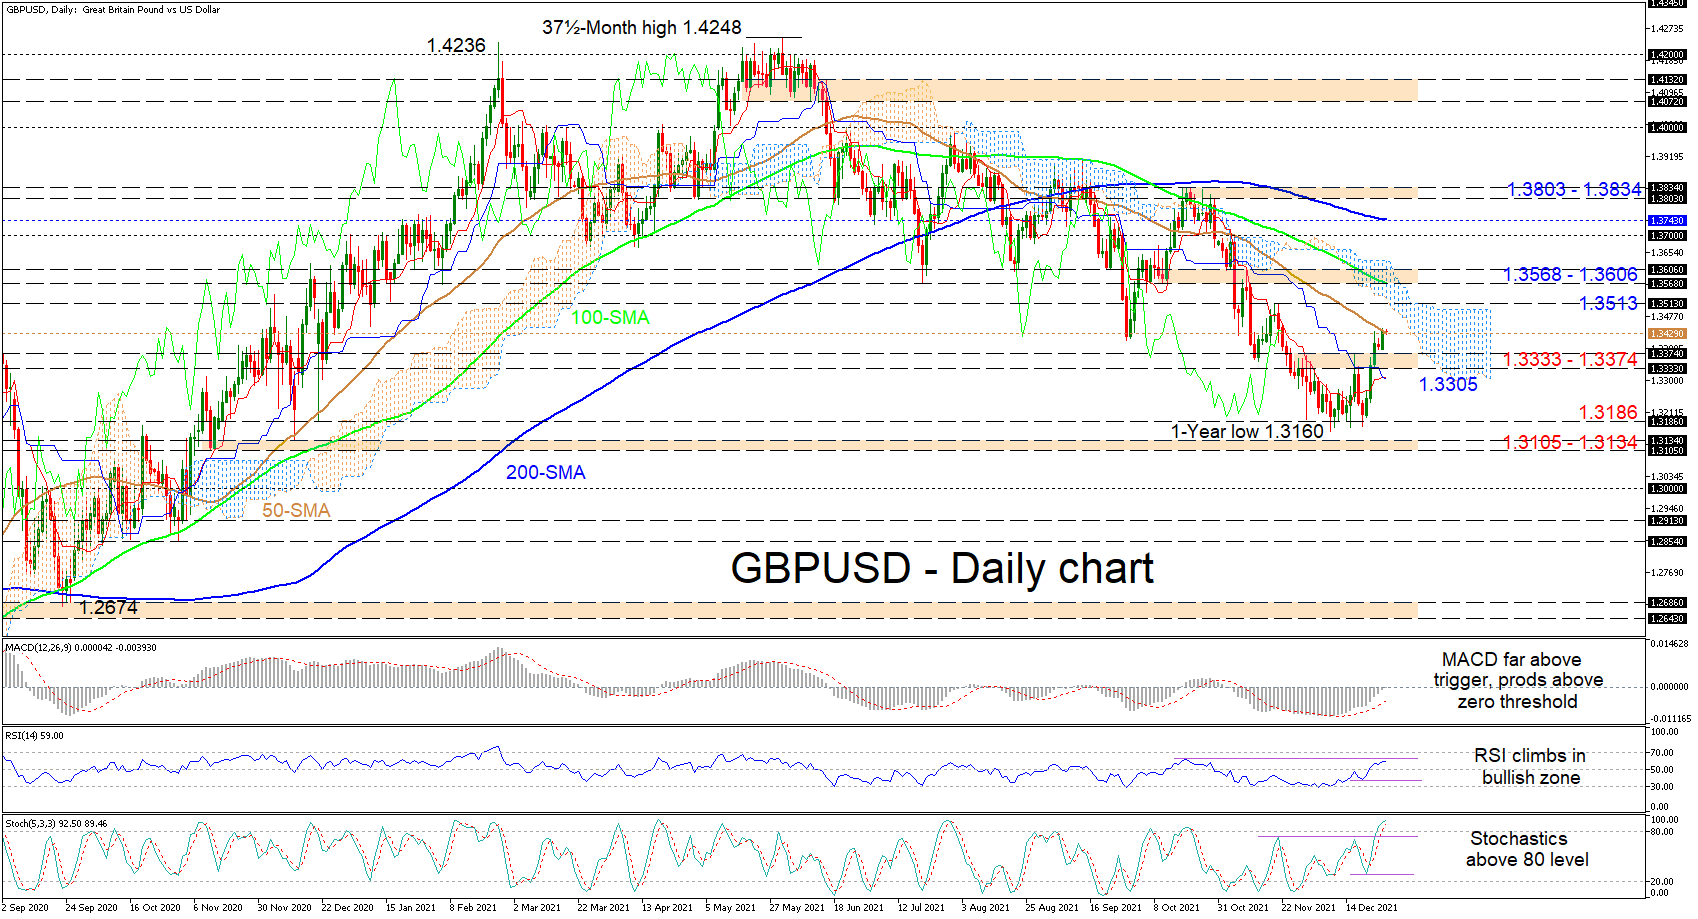
GBPUSD is confronting the falling 50-day simple moving average (SMA) at 1.3429 after buyers powered up around the 1.3186 vicinity, opposing the six-month decline from the more than three-year high of 1.4248. The bearish SMAs are shielding the negative trend in the pair.
That said, the Ichimoku lines are indicating some waning in negative pressures but have yet to confirm that buyers have the upper hand. Looking at the short-term oscillators, they are showing no clear signs that upside drive is weak, suggesting that the bullish momentum is growing. The MACD has distanced itself from its red trigger line and has nudged above the zero mark, while the RSI is improving in the positive region. The stochastic lines are rising in overbought territory promoting positive price action in the pair.
If the pair oversteps the 50-day SMA at 1.3429, preliminary upside obstructions could stem from the Ichimoku cloud and the 1.3513 nearby high. Successfully thrusting higher, buyers may then struggle around the reinforced 1.3568-1.3606 border. Conquering this too may boost upside momentum, encouraging the bulls to tackle a critical zone of resistance between the 1.3700 handle and the 200-day SMA at 1.3743 before reaching for the 1.3803-1.3834 zone of highs from mid-October.
If the 50-day SMA curbs advances, initial footing for the pair could transpire within the 1.3333-1.3374 area. However, should the area fail to provide the necessary support to revive upside impetus, the price drop could snag around the Ichimoku lines at 1.3305 before sliding towards the 1.3186 key boundary, which recently muted negative powers. From here, if sellers manage to plot new lows and overcome the 1.3105-1.3134 support boundary, formed over the November-December 2020 period, the bears could then pursue the 1.3000 hurdle.
Summarizing, GBPUSD is striving to make headways, but the pair’s picture remains skewed to the downside as the price holds beneath the SMAs and the 1.3513 high.
S&P 500 Soars to a Record High as Retail Stocks Lead
American stocks surged to record highs as investors cheered the performance of this year’s Christmas holiday. The S&P 500 index rose to an all-time high of $4,760 as retail stocks led. Among the biggest winners were companies like Target, Walmart, and Costco. Data by Mastercard SpendingPulse showed that sales rose by 8.5% over the holiday season. This period starts on November 1 and ends on December 24th. Sales in stores rose by 8.1% compared to a year earlier, while e-commerce sales jumped by 11%. The latter made up about 20% of the total sales, which was higher than 14.6% before the pandemic started.
The price of crude oil rose in the overnight session as investors reflected on cancelled Christmas holiday flights. More than 1,300 flights were cancelled by American Airlines as more employees called in sick with Covid-19. There is also a likelihood that the number of Covid-19 infections will continue rising for a while in the coming year. Still, oil investors are optimistic because most Covid cases are of the Omicron variant. And recent data showed that the variant is a lot milder than the other variants. It also does not require hospitalization. Focus shifts to the actions by OPEC and its allies, considering that they will meet in the coming week.
As on Monday, the economic calendar will be relatively muted today. Earlier today, Japan published strong unemployment rate and industrial production data. The numbers showed that the country’s unemployment rate remained below 3%. The jobs to applications ratio also improved from 1.15 in October to 1.16 in November. Other data to watch today will be Hong Kong’s trade data and Sweden’s household lending data. The US will also publish the latest house price index data.
EURUSD
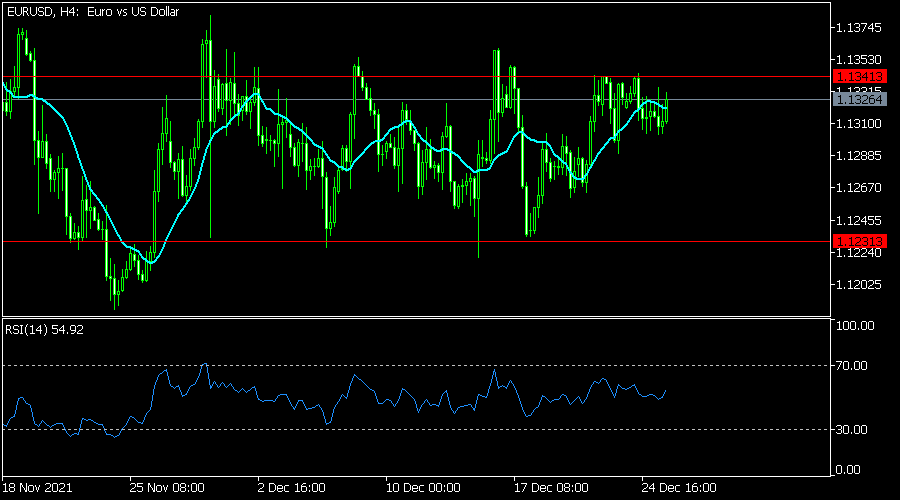
The EURUSD pair tilted upwards in the overnight session, although volume remained under pressure. The pair rose to a high of 1.1328. On the four-hour chart, the pair managed to move slightly above the 25-day moving average. It is also approaching the upper side of the horizontal channel. Also, oscillators like the Relative Strength Index (RSI) have pointed upwards. Therefore, the pair will likely remain inside this range today.
USDCHF
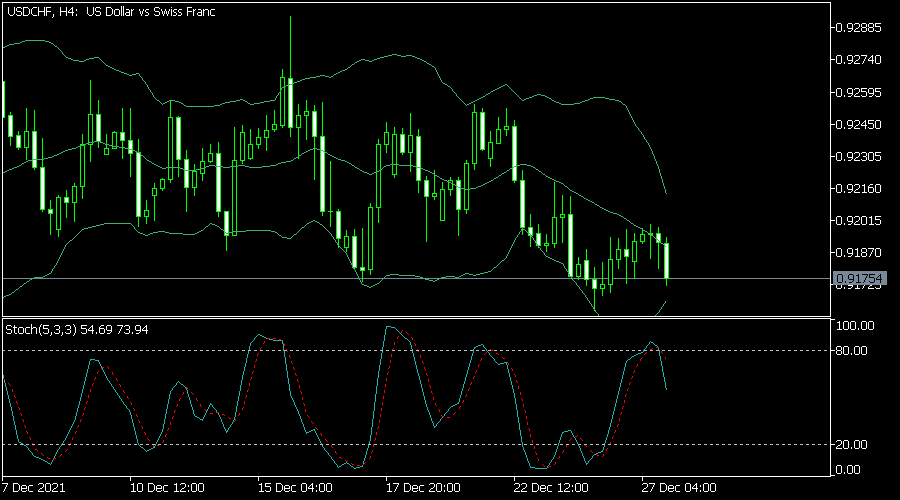
The USDCHF pair declined sharply as the US dollar declined broadly. The pair is trading at 0.9175, which is along the lower line of the Bollinger Bands on the four-hour chart. It also moved slightly below the 25-day moving average, while the Stochastic Oscillator moved below the overbought level. The pair will likely keep falling today, with the next key target being at 0.9150.
EURJPY
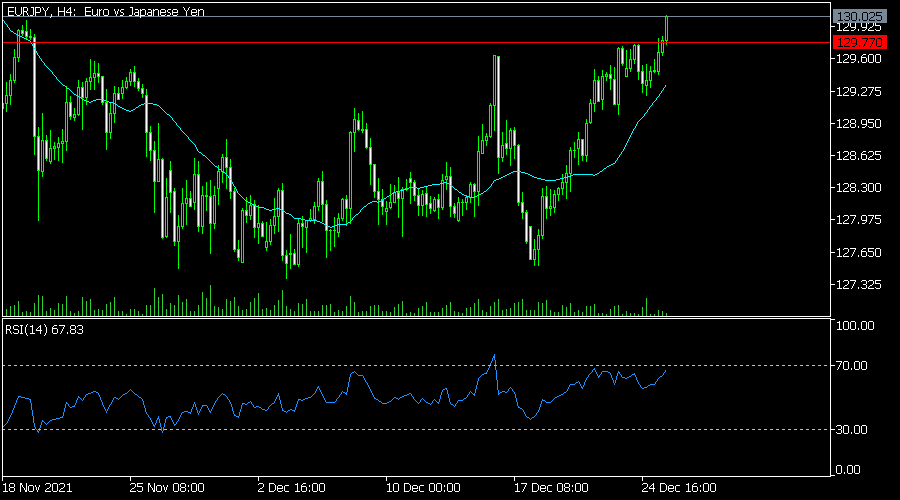
The EURJPY pair rose to a high of 130, which was the highest level since November 16. The pair managed to cross the key resistance level at 129.77, which was the highest level last week. It has also moved slightly above the 25-day and 50-day moving averages and the dots of the Parabolic Oscillator. Therefore, the path of the least resistance for the pair is to the upside.
EURJPY Approaches the Flat 200-Day SMA Near 130.00
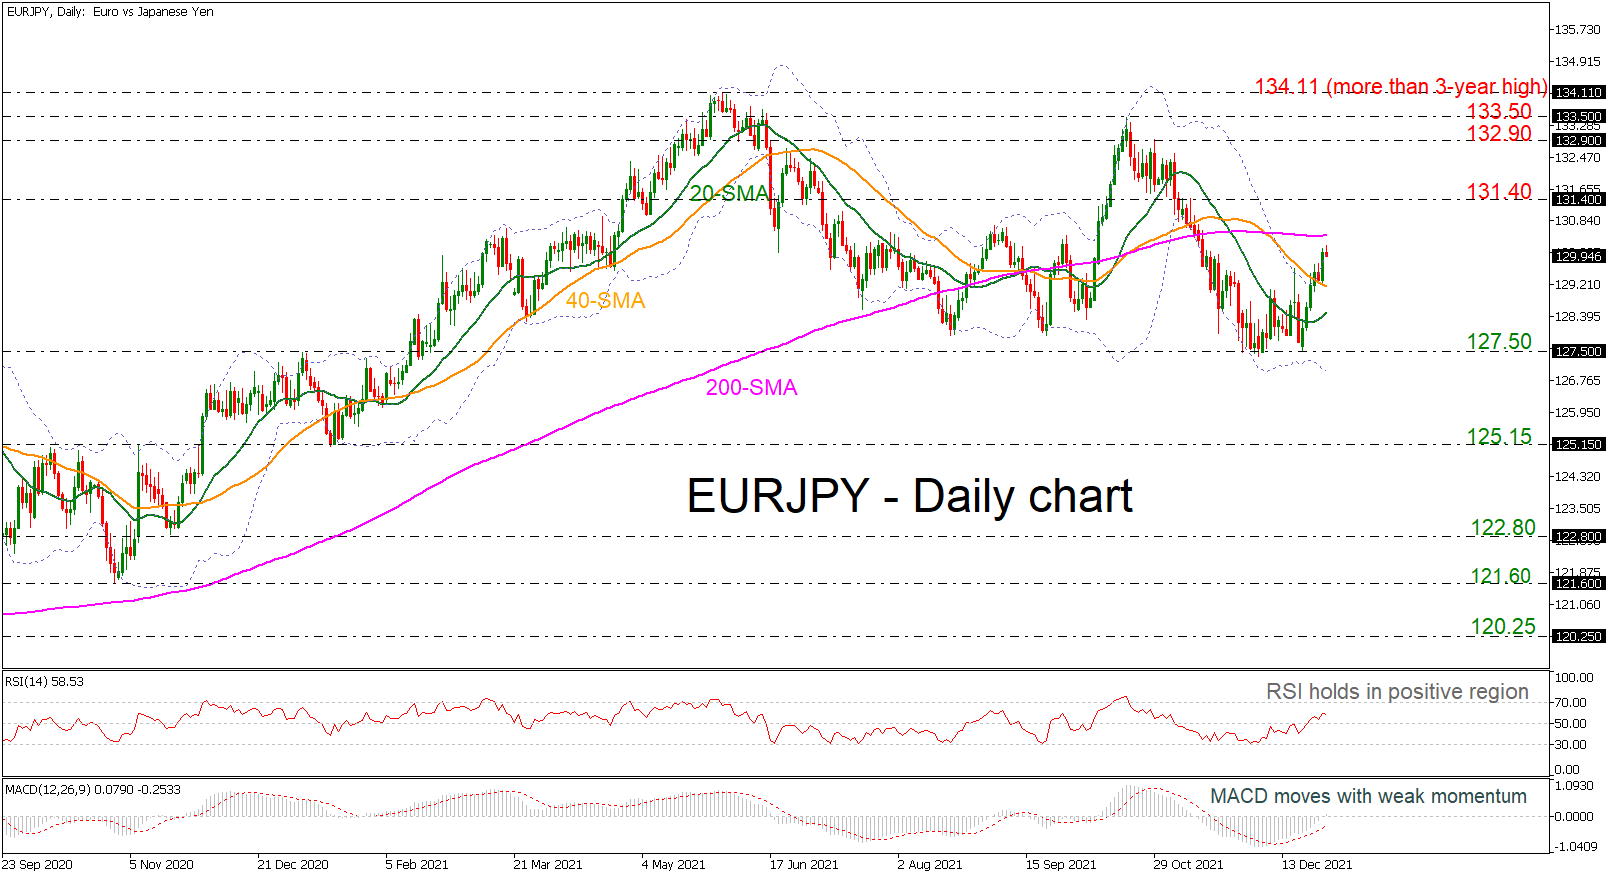
EURJPY has been in an upside movement near 130.00 after the bounce off the 127.50 support level around the lower Bollinger band. The price overcame the 20- and 40-day simple moving averages (SMAs) and it’s possible to jump above the 200-day SMA in the next few sessions as well, confirming the bullish bias.
Technically, the indicators are showing weak signals. The RSI is moving sideways in the positive region, while the MACD is flattening near its zero line and above its trigger line.
Immediate resistance could come from the flat 200-day SMA currently at 130.50 ahead of the 131.40 resistance level, taken from the latest inside swing lows. If the bulls take the upper hand and continue the recent move, the next target could be the 132.90 and 133.50 barriers.
On the flip side, a decline below the 40-day SMA could meet the 20-day SMA at 128.50 and the 127.50 support before touching the lower Bollinger band at 127.00. More losses could open the door for the 125.15 hurdle, achieved on January 18.
All in all, EURJPY has been in a slight descending move since June 1, but in the very short-term, the bias is distinctly bullish.
Intraday Market Analysis – Risk Currencies Rally
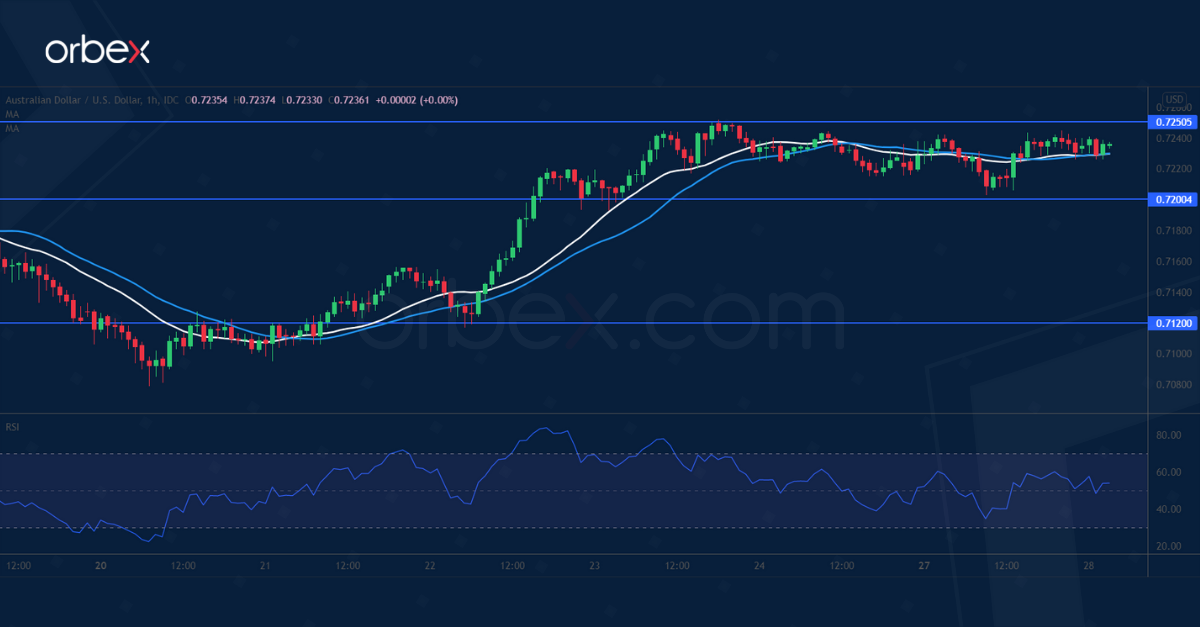
AUDUSD falls back for support
The Australian dollar pulls back as risk assets tread water amid low liquidity. A break above the previous high at 0.7220 reveals a strong bullish bias.
However, the RSI’s repeatedly overbought situation may have prompted short-term buyers to take some chips off the table. In turn, this left price action vulnerable to retracement.
0.7200 is the closest support. Its breach would trigger a deeper correction towards 0.7120. A close above 0.7250 may resume the reversal and carry the Aussie to the daily resistance at 0.7360.
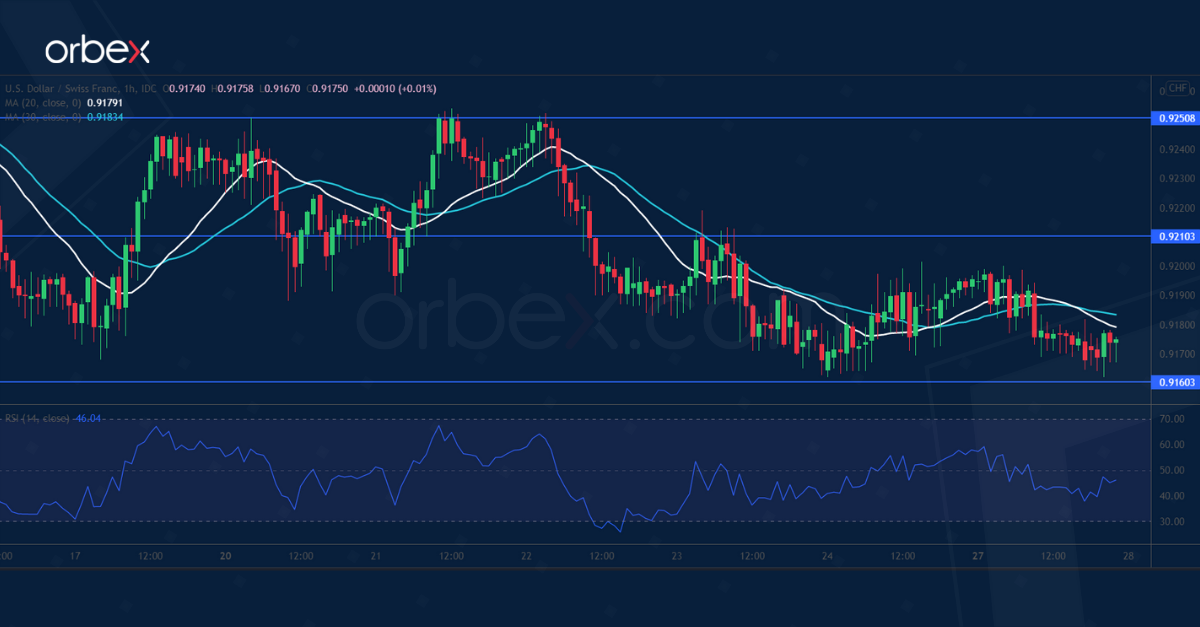
USDCHF tests consolidation range
The US dollar softens over weaker Treasury yields.
The pair’s latest rebound has met aggressive selling at the upper bound of the consolidation range near 0.9250. That is a sign of lingering bearish pressure. The greenback is testing the lower bound near 0.9160. Range traders were eager to buy the dip as the RSI ventured into the oversold zone.
0.9210 is an intermediate hurdle leading to the upper limit where a breakout could trigger a bullish reversal towards 0.9350. Otherwise, a drop below 0.9160 may send the pair to 0.9100.
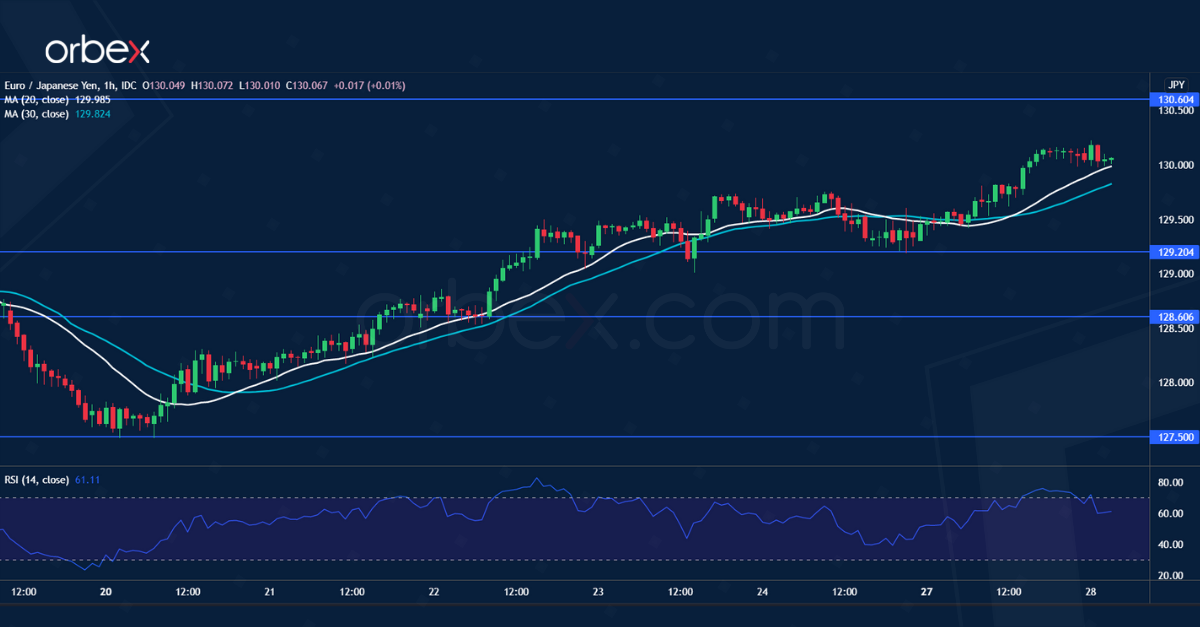
EURJPY breaks higher
The Japanese yen weakened after Japan’s jobless rate rose to 2.8% in November. The long side has gained the upper hand after they pushed above 129.60.
A bullish MA cross following a brief consolidation indicates an acceleration in the upward momentum. A break above the psychological level of 130.00 would set 130.60 as the next target, clearing the path for a rally to 131.30.
An overbought RSI may cause a temporary pullback. 129.20 from the previous supply zone has become a fresh support.
EUR/USD Daily Outlook
Daily Pivots: (S1) 1.1309; (P) 1.1321; (R1) 1.1340; More...
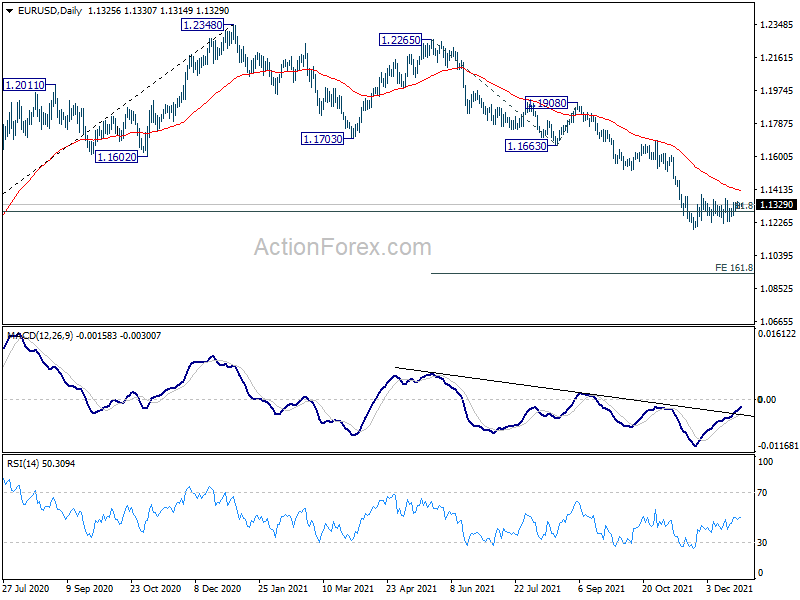
Sideway trading continues in EUR/USD and intraday bias remains neutral at this point. On the downside, break of 1.1185 will resume larger decline from 1.2348. Next target is 161.8% projection of 1.2265 to 1.1663 from 1.1908 at 1.0934. On the upside, firm break of 1.1382 resistance should confirm short term bottoming at 1.1186. Intraday bias will be turned back to the upside for 55 day EMA (now at 1.1405) and above.
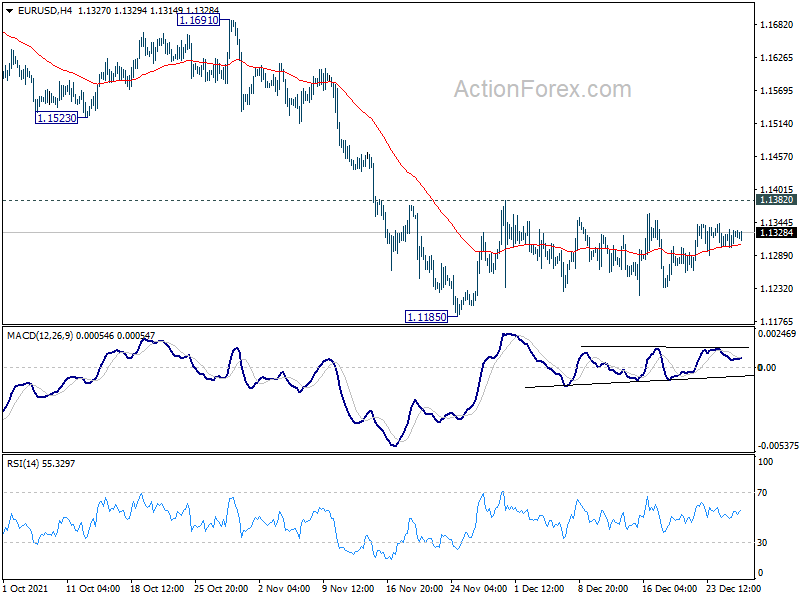
In the bigger picture, there are various ways of interpreting the fall from 1.2348 (2021 high). It could be a correction to rise from 1.0635 (2020 low), the fourth leg of a sideway pattern from 1.0339 (2017 low), or resuming long term down trend. In any case, outlook will now stay bearish as long as 1.1703 support turned resistance holds. Sustained break of 61.8% retracement of 1.0635 to 1.2348 at 1.1289 would pave the way back to 1.0635.