Sample Category Title
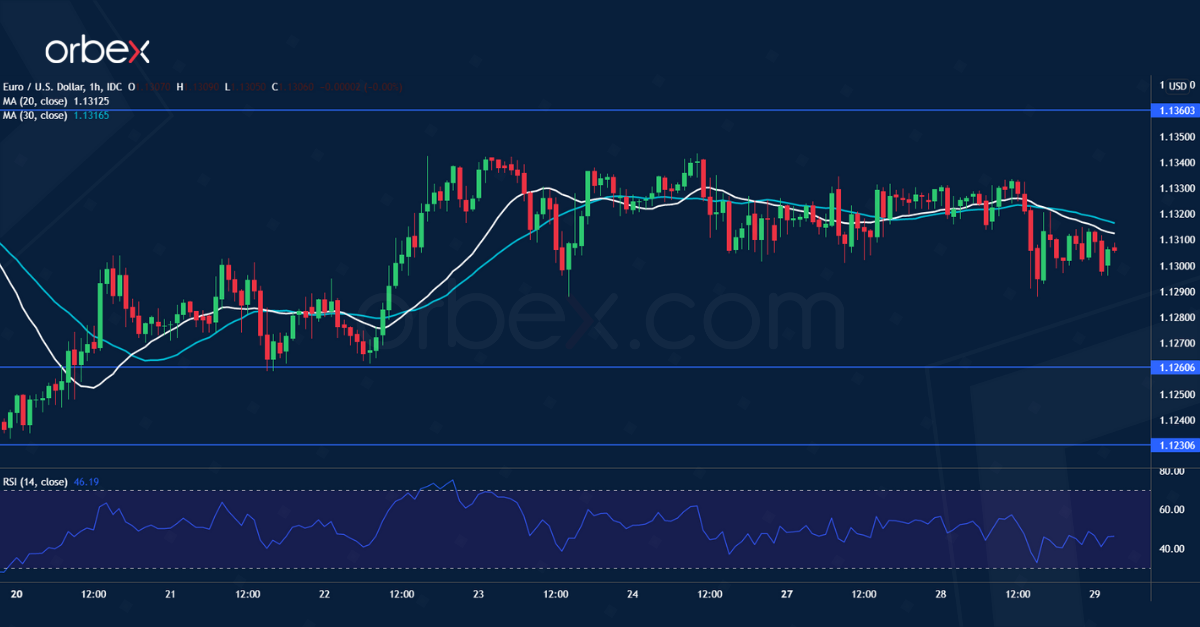
EURUSD Tests Important Resistance
The US dollar struggles as the Omicron scare subsides. The pair has been stuck in a narrow range between 1.1230 and 1.1360, because of a lack of liquidity and a catalyst.
Following a bounce from 1.1260 price action is testing the upper band of the horizontal consolidation. A bullish breakout would pop up volatility as sellers rush for the exit.
An extended rally would set 1.1450 as the next target. On the downside, a fall below 1.1260 may prolong the sideways action for a few more days.
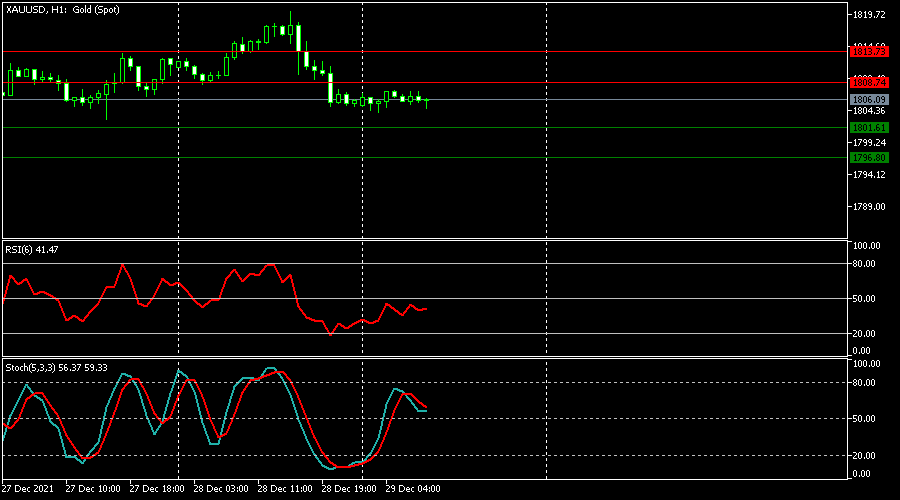
XAUUSD Is Possibly Bearish
Technical analysis
The RSI is below level 50.
The Stochastics left the overbought zone and headed downwards to level 50.
Most likely scenario – SELL
Target prices: 1,801.61 1,796.80
Alternative scenario – BUY
Target prices: 1,808.74 1,813.73
Key levels
Support 1,801.61 1,796.80
Resistance 1,808.74 1,813.73
Daily Technical Analysis
EUR/USD
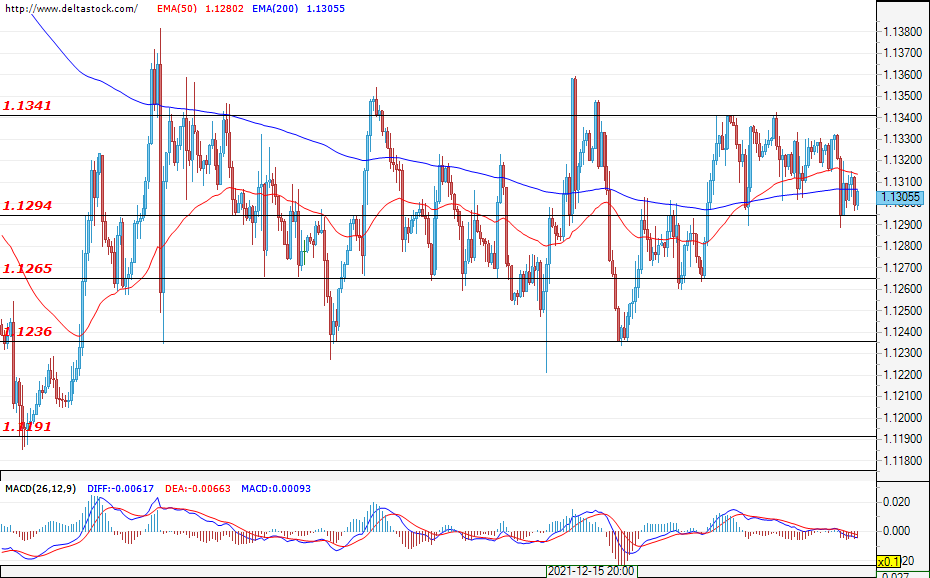
Current level - 1.1305
The market continues to trade without a clear direction and, so far, the bulls are failing to overcome the resistance zone between 1.1340 and 1.1360. The first local support for the pair is 1.1294, followed by 1.1265. The main support remains the lower limit of the range at 1.1236. If the trade stays above 1.1294, then it is possible that the bulls will try a new attack on 1.1340. If this zone is cleared, then a rally towards 1.1500 would also be possible. In an alternative scenario in which the bears dominate the market, we can expect a test of the zone at 1.1190 coming from the highest time frames.
| Resistance | Support | ||
| intraday | intraweek | intraday | intraweek |
| 1.1340 | 1.1460 | 1.1294 | 1.1235 |
| 1.1360 | 1.1500 | 1.1265 | 1.1190 |
USD/JPY
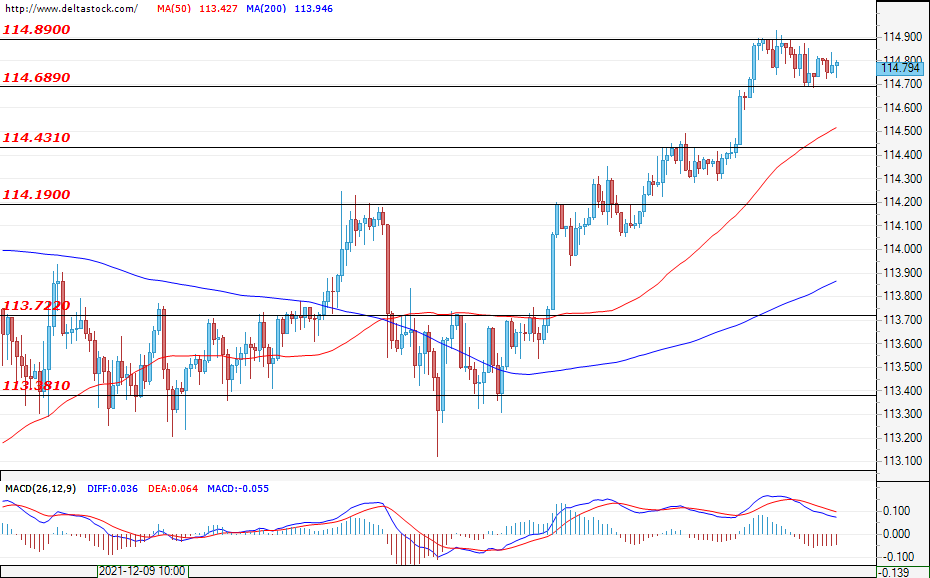
Current level - 114.79
In recent days, the market has entered an uptrend, reaching the resistance at 114.90. Prices are now consolidating below this zone and the expectations are for a more substantial pullback, which should be limited by the support at around 114.43. As long as this bullish attitude is maintained, a breach of 114.90 can be expected, followed by a test of the high at around 115.44.
| Resistance | Support | ||
| intraday | intraweek | intraday | intraweek |
| 114.90 | 115.44 | 114.68 | 114.19 |
| 115.44 | 116.00 | 114.43 | 113.72 |
GBP/USD
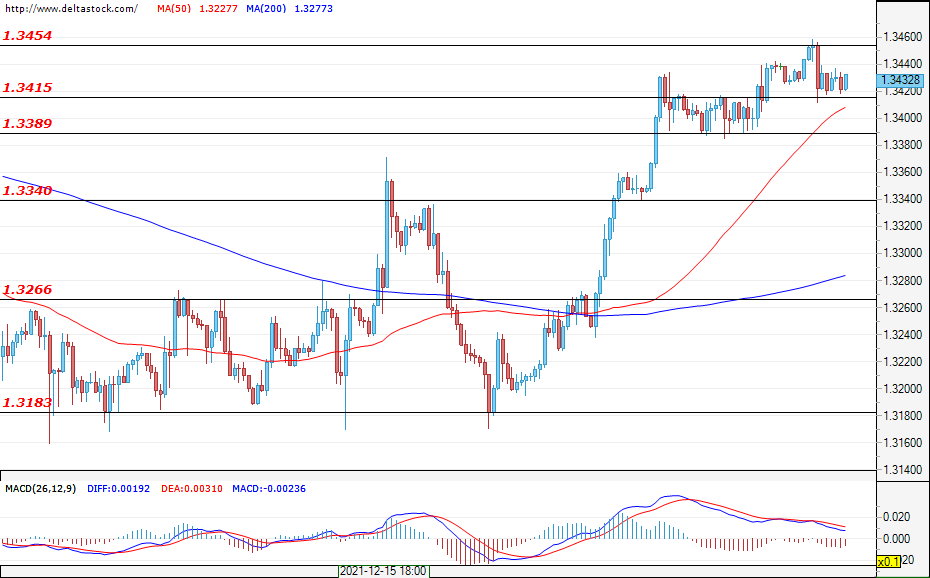
Current level - 1.3432
The sterling managed to overcome the last resistance at 1.3425 and now the market is gravitating around this area. The current breach forms two local support zones – one at 1.3390 and another at 1.3415. At the moment, the correction is extremely shallow, which suggests another strong upward impulse. In such a scenario, an attack on 1.3510 can be expected. It is possible that the activity will remain low in the few remaining days of the year and that the market could stay in the range between 1.3390 and 1.3454.
| Resistance | Support | ||
| intraday | intraweek | intraday | intraweek |
| 1.3454 | 1.3510 | 1.3415 | 1.3340 |
| 1.3510 | 1.3580 | 1.3390 | 1.3266 |
EUR/USD Daily Outlook
Daily Pivots: (S1) 1.1288; (P) 1.1311; (R1) 1.1331; More...
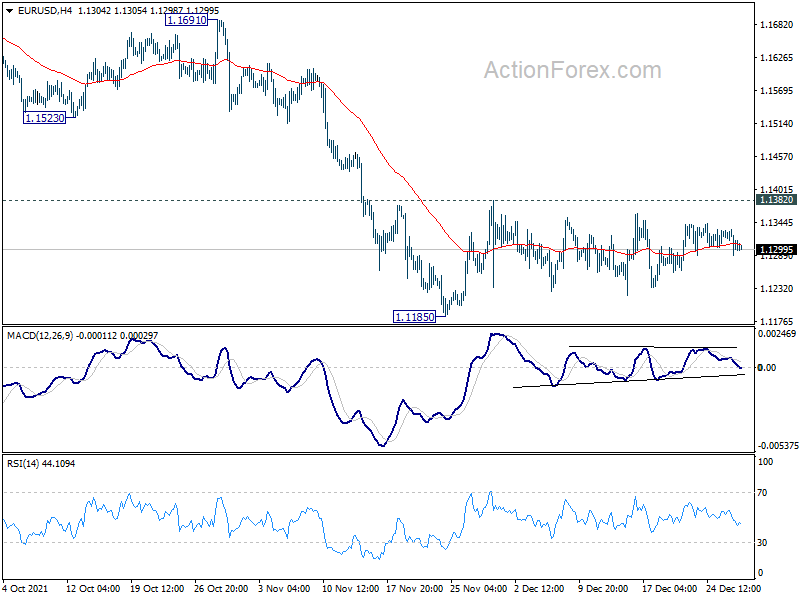
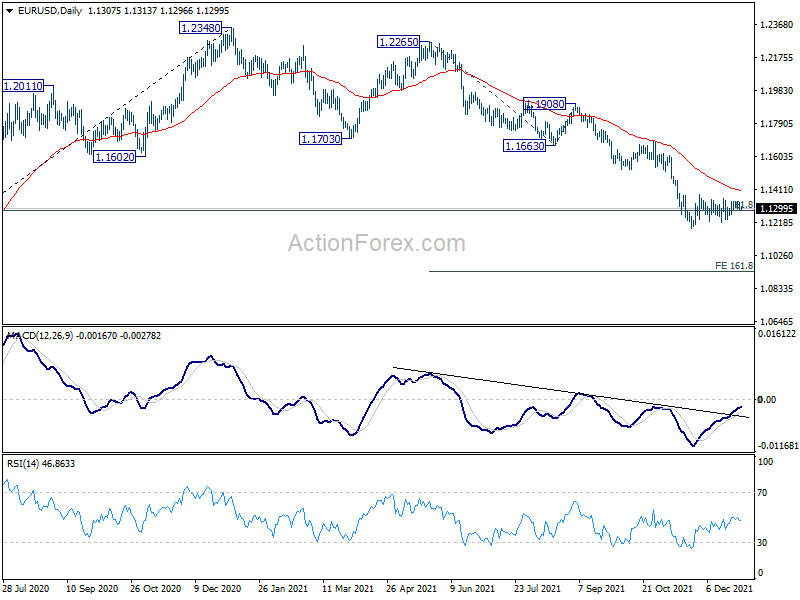
EUR/USD is still struggling in range trading and intraday bias remains neutral first. On the downside, break of 1.1185 will resume larger decline from 1.2348. Next target is 161.8% projection of 1.2265 to 1.1663 from 1.1908 at 1.0934. On the upside, firm break of 1.1382 resistance should confirm short term bottoming at 1.1186. Intraday bias will be turned back to the upside for 55 day EMA (now at 1.1405) and above.
In the bigger picture, there are various ways of interpreting the fall from 1.2348 (2021 high). It could be a correction to rise from 1.0635 (2020 low), the fourth leg of a sideway pattern from 1.0339 (2017 low), or resuming long term down trend. In any case, outlook will now stay bearish as long as 1.1703 support turned resistance holds. Sustained break of 61.8% retracement of 1.0635 to 1.2348 at 1.1289 would pave the way back to 1.0635.
GBP/USD Daily Outlook
Daily Pivots: (S1) 1.3411; (P) 1.3437; (R1) 1.3457; More...
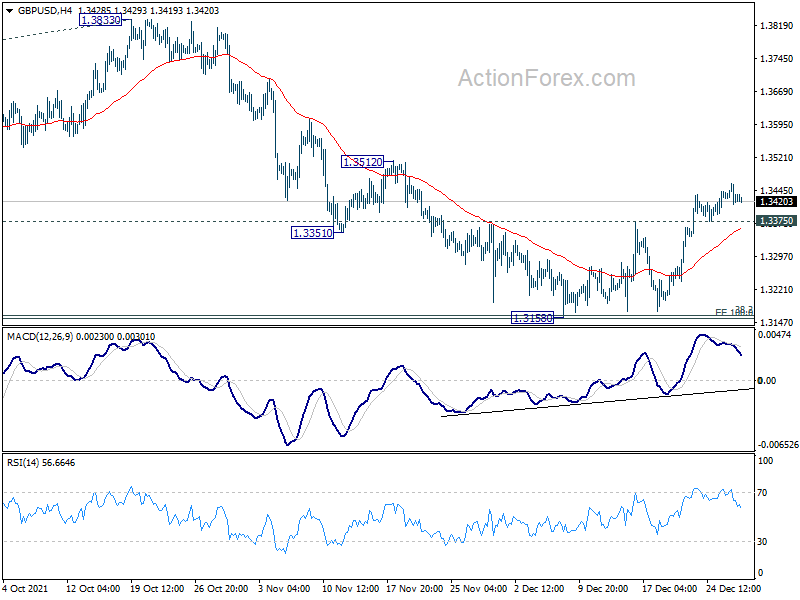
Intraday bias in GBP/USD remains mildly on the upside despite some loss of upside momentum. Sustained trading above 55 day EMA (now at 1.3426) will be an early sign of bullish reversal. That is, correction from 1.4248 might have completed with three waves down to 1.3158, after hitting 1.3164 medium term fibonacci level. Further rally would be seen to 1.3570 support turned resistance next. On the downside, break of 1.3375 minor support will turn intraday bias neutral first.
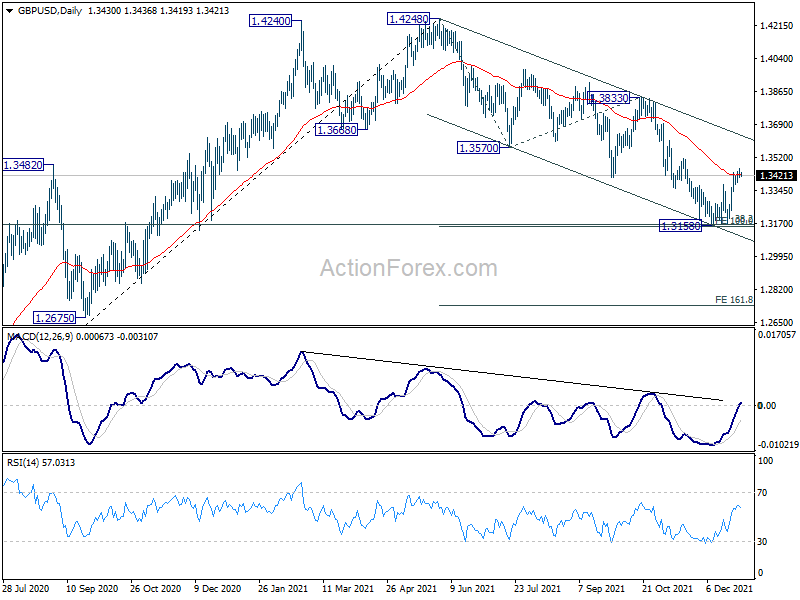
In the bigger picture, focus remains on 38.2% retracement of 1.1409 to 1.4248 at 1.3164. Sustained break there will argue that whole rise from 1.1409 has completed at 1.4248, after rejection by 1.4376 long term resistance. That will revive some medium term bearishness and and target 61.8% retracement at 1.2493. However, strong rebound from current level will revive argue that up trend from 1.1409 is still in progress, and probably ready to resume.
USD/CHF Daily Outlook
Daily Pivots: (S1) 0.9158; (P) 0.9175; (R1) 0.9189; More....
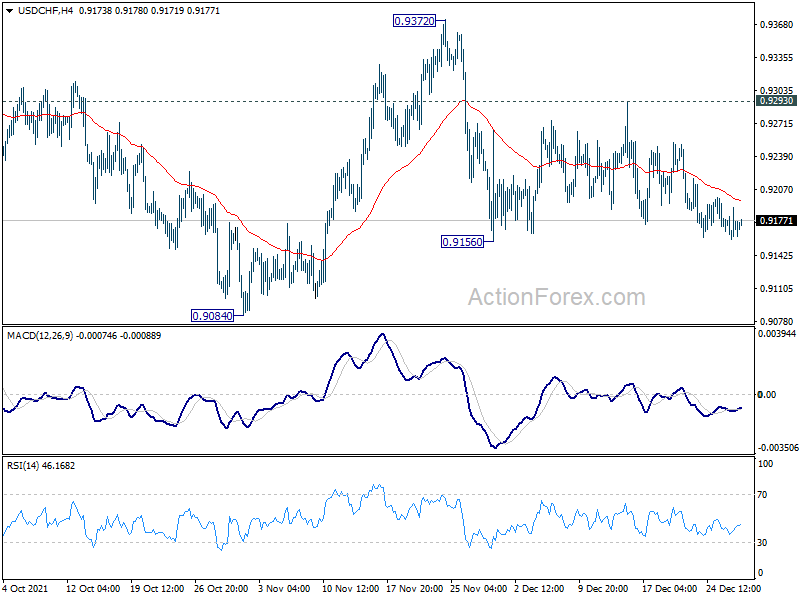
Intraday bias in USD/CHF remains neutral and outlook is unchanged. On the downside, below 0.9156 will target 0.9084 support. Firm break there should confirm that choppy rise from 0.8925 has completed, and suggests that fall from 0.9471 is resuming. Deeper decline would be seen through 0.8925. On the upside, break of 0.9293 will suggest that the pull back from 0.9372 is finished. Intraday bias will be turned back to the upside for 0.9372.
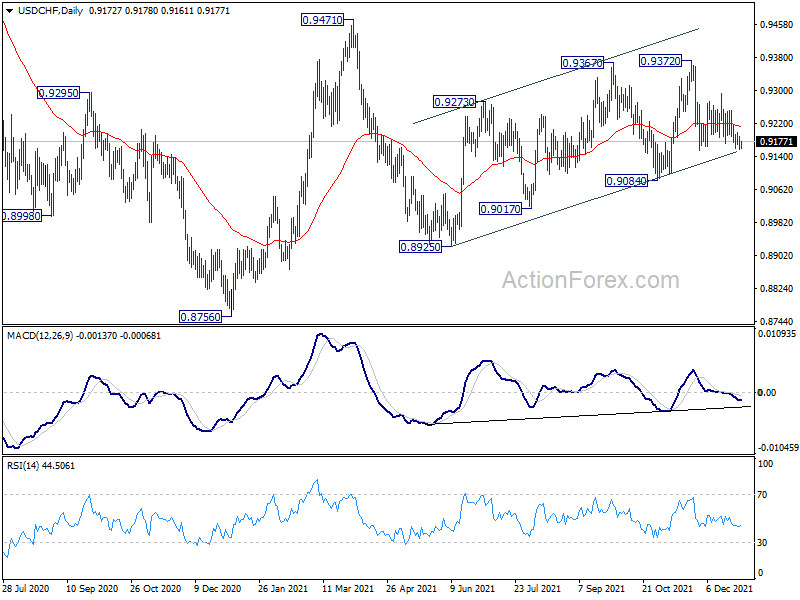
In the bigger picture, the corrective structure of the rebound from 0.8925 argues that fall from 0.9471 is not complete yet. It could either be the second leg of pattern from 0.8756 (2021 low), or resuming larger down trend from 1.0237 (2018 high). We'd pay attention to the downside momentum and assess the odds later. But for now, medium term outlook will be neutral at best as long as 0.9471 resistance holds.
USD/JPY Daily Outlook
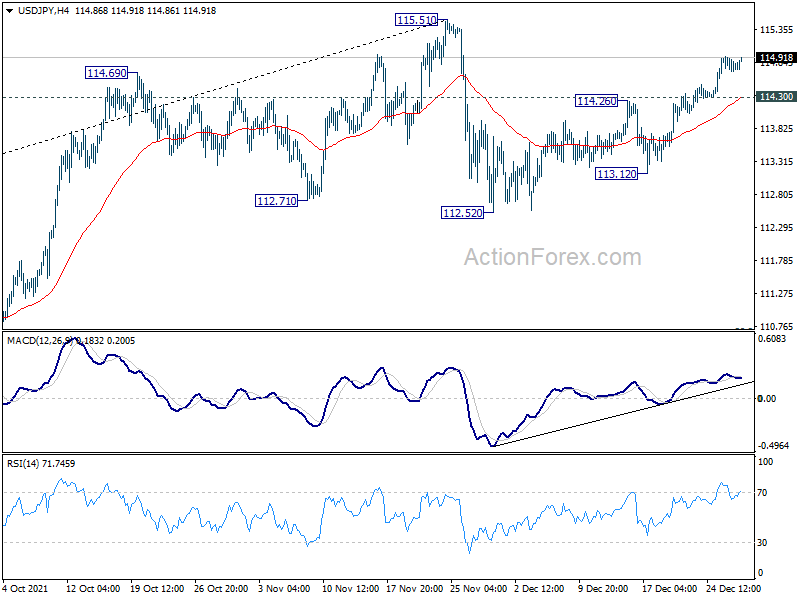
Daily Pivots: (S1) 114.70; (P) 114.83; (R1) 114.94; More...
Intraday bias in USD/JPY stays on the upside at this point. Rise from 112.52 should target a test on 115.51 high first. Firm break there will resume larger up trend to 118.65 long term resistance next. On the downside, however, break of 114.30 will turn bias to the downside, and extend the corrective pattern from 115.51 with another falling leg back to 112.52 support.
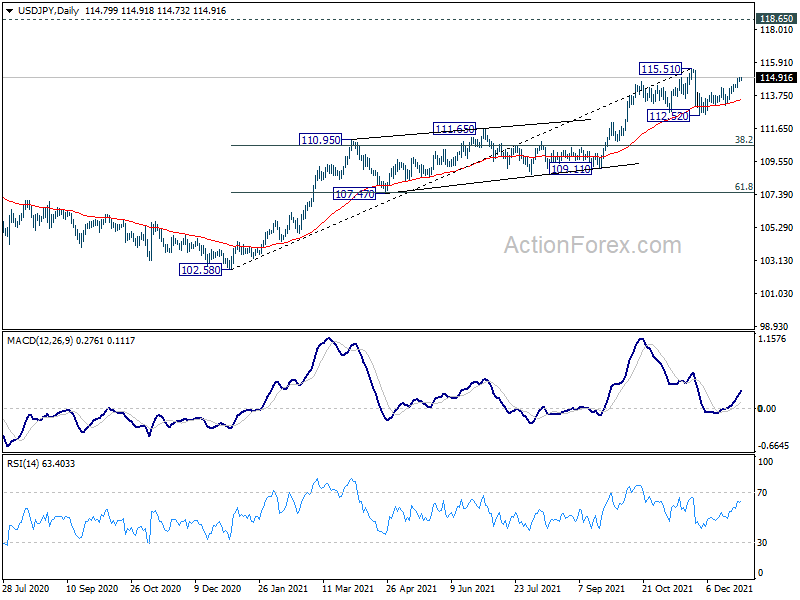
In the bigger picture, no change in the view that rise from 102.58 is the third leg of the up trend from 101.18 (2020 low). Such rally should target a test on 118.65 (2016 high) on resumption. However, firm break of 109.11 structural support will argue that the trend might have reversed and bring deeper fall to 107.47 support and possibly below.
AUD/USD Daily Report
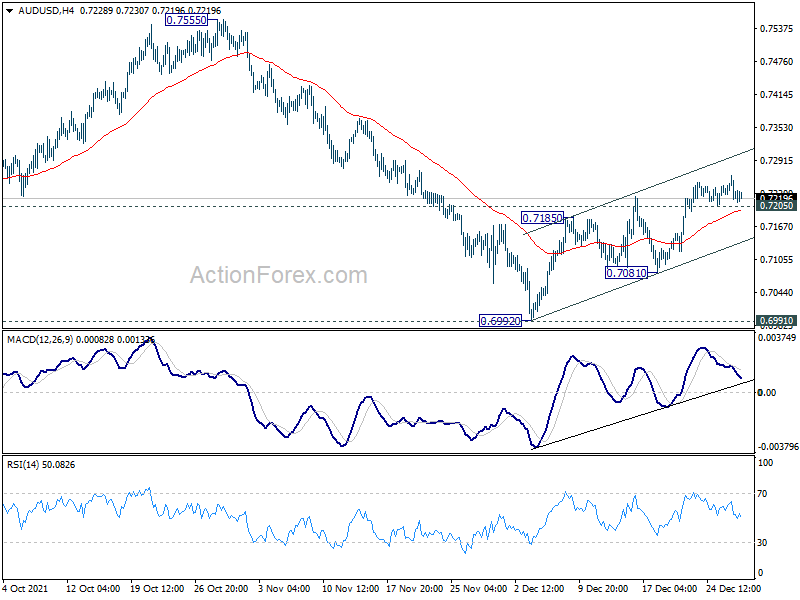
Daily Pivots: (S1) 0.7211; (P) 0.7237; (R1) 0.7256; More...
AUD/USD is losing upside momentum but further rise is in favor as long as 0.7205 minor support holds. Sustained trading above 55 day EMA (now at 0.7236) will argue that fall from 0.8006 has completed at 0.6992, after defending 0.6991 support. Further rally would be seen to 0.7555 resistance for confirmation. On the downside, below 0.7205 minor support will mix up the near term outlook and turn intraday bias neutral first.
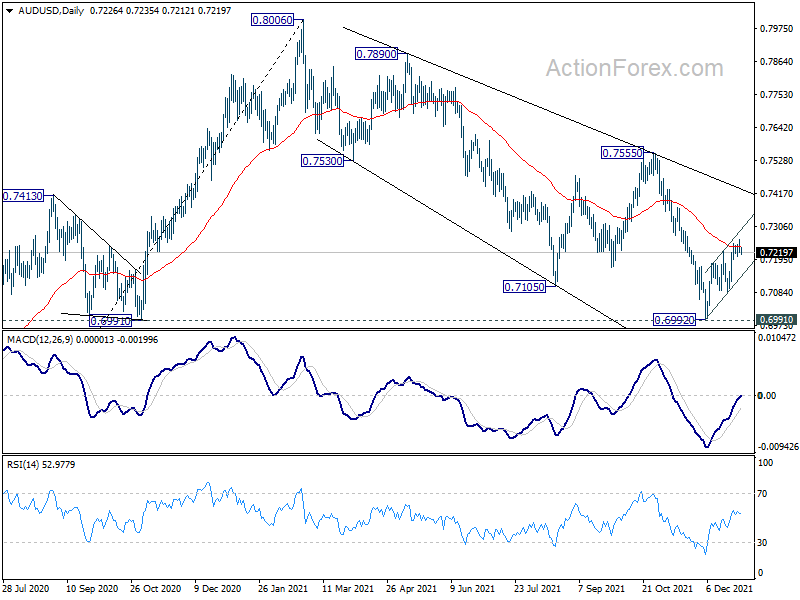
In the bigger picture, strong rebound from 0.6991 key structural support will retain medium term bullishness. That is, whole up trend from 0.5506 is still in progress. Firm break of 0.7555 resistance will target 0.8006 high and above. However, sustained break of 0.6991 will argue that the whole up trend from 0.5506 might be finished at 0.8006, after rejection by 0.8135 long term resistance. Deeper decline would then be seen back to 61.8% retracement of 0.5506 to 0.8006 at 0.6461.
USD/CAD Daily Outlook
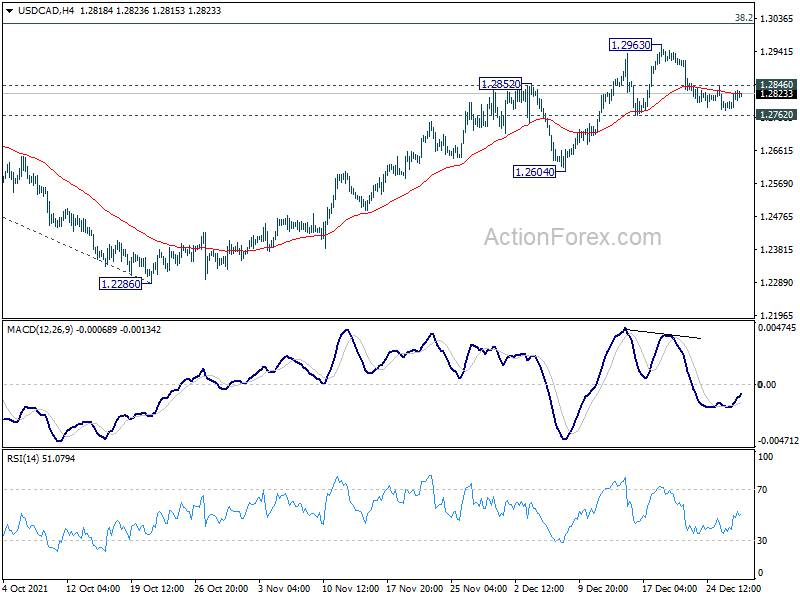
Daily Pivots: (S1) 1.2788; (P) 1.2810; (R1) 1.2838; More...
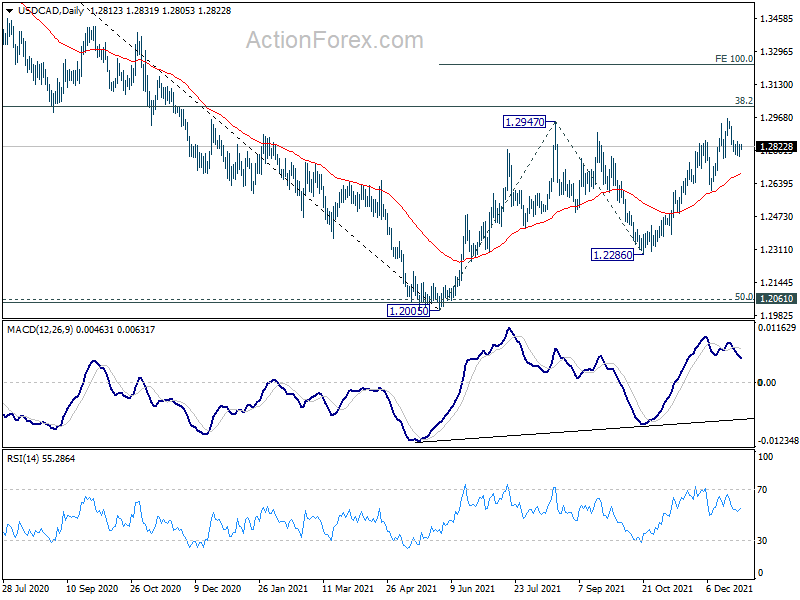
Intraday bias in USD/CAD stays neutral at this point. As long as 1.2762 support holds, further rally is expected. On the upside, above 1.2846 minor resistance will bring retest of 1.2963 resistance first. Break there will resume the rise from 1.2005 to 1.3022 key medium term fibonacci level. Sustained break of 1.3022 will carry larger bullish implications. Next target will be 100% projection of 1.2005 to 1.2947 from 1.2286 at 1.3228. However, break of 1.2762 will turn bias back to the downside for 1.2604 support instead.
In the bigger picture, focus will be on 38.2% retracement of 1.4667 (2020 high) to 1.2005 (2021 low) at 1.3022. Sustained break there should confirm that the down trend from 1.4667 has completed after defending 1.2061 long term cluster support. Further rise would then be seen towards 61.8% retracement at 1.3650. On the downside, however, break of 1.2286 will turn focus back to 1.2005 low again.
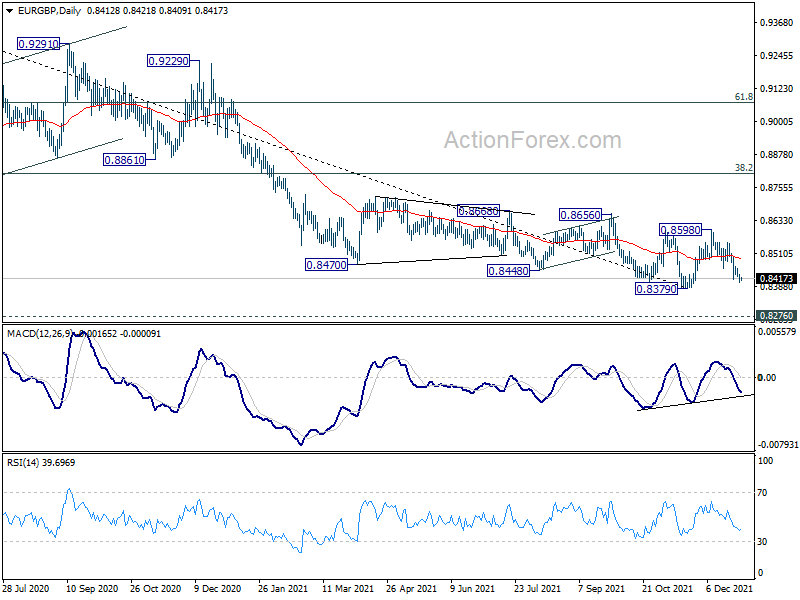
EUR/GBP Daily Outlook
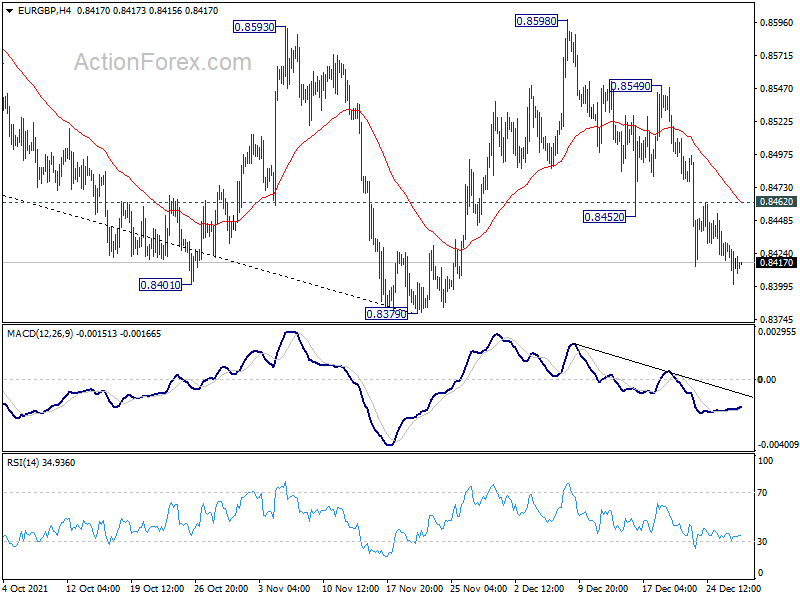
Daily Pivots: (S1) 0.8403; (P) 0.8418; (R1) 0.8435; More...
EUR/GBP's fall resumed after brief consolidation and intraday bias is back on the downside for 0.8379 support. Firm break there will resume larger down trend from 0.9499 towards long term support at 0.8276. On the upside, above 0.8462 minor resistance will turn intraday bias neutral first.
In the bigger picture, price actions from 0.9499 (2020 high) are still seen as developing into a corrective pattern. Deeper fall could be seen as long as 0.8593 resistance holds, towards long term support at 0.8276. We'd look for bottoming signal around there to bring reversal. Meanwhile, firm break of 0.8593 will now be an early sign of medium term bottoming. Further break of 0.8656 will pave the way to 38.2% retracement of 0.9499 to 0.8379 at 0.8807.