Sample Category Title
Holiday Mode Continues
Notes/Observations
- Markets remain in holiday mode as subdued trading continued.
Asia
- China PBOC Open Market Operation (OMO) injects CNY200B in 7-day reverse repos with a net injection of CNY190B.
- China Q4 Beige Book showed companies cut investment and remained cautious on borrowing.
Europe
- EU Economic Commissioner Gentiloni (Italy) said to intend to propose a modification of the EU Stability Pact in.
- Spain parliament approves record 2022 budget; Minimum 15% corporate tax clears final hurdle 2022.
- Italian government's budget bill with confidence motion attached to face vote in Lower House (Note: Senate adopted the 2022 budget back on Dec 25th).
Energy
- Weekly API Crude Oil Inventories: -3.1M v -3.7M prior.
- Russia Gazprom [GAZP.RU] again had not booked gas transit capacity for exports via the Yamal-Europe pipeline for Dec 29th (9th day in a row).
Speakers/Fixed income/FX/Commodities/Erratum
Equities
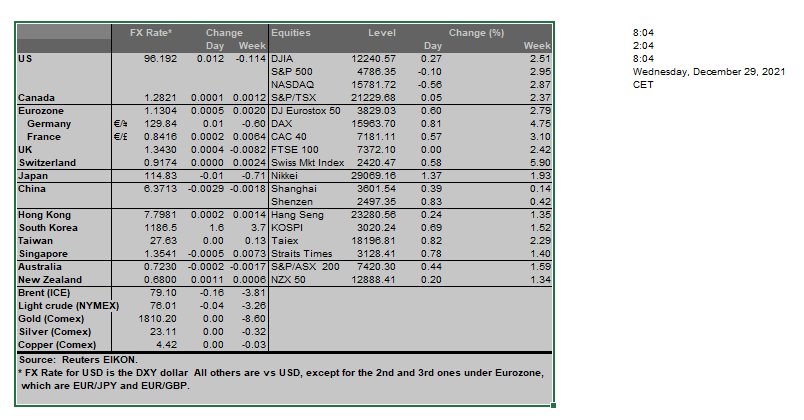
- Indices [Stoxx600 +0.22% at 489,58, FTSE +1.10% at 7,453.10, DAX -0.13% at 15,942.15, CAC-40 +0.07% at 7,186.21, IBEX-35 -0.27% at 8,665.11, FTSE MIB -0.14% at 27,406.00, SMI -0.16% at 12,949.85, S&P 500 Futures +0.23%].
- Market Focal Points/Key Themes: European indices open with a modest bias to the downside, but later trended slowly higher towards a record high; light trading despite all bourses open in Europe; sectors leading to the upside include consumer discretionary and materials; while laggards include financials and industrials; Lukoil and |Gazprom confirm JV on gas exploration; no major earnings expected during the upcoming US session.
Equities
- Consumer discretionary: RWS Holdings [RWS.UK] +2% (CFO resigns).
- Materials: Anglo American plc [AAL.UK] +1% (talks with Vale).
Speakers
- Turkey Central Bank Annual Account: noted that Inflation targeting to continue in 2022 and would maintain the 1-Week Repo Rate as its main policy tool. To maintain medium inflation target at 5.0% and the floating exchange rate regime to continue.
- Poland Central Bank Gatnar saw the potential for 75bps rate hike at the Jan 4th MPC meeting. Weak PLN currency (Zloty) might lead to a larger hike in the Base Rate.
Currencies/Fixed Income
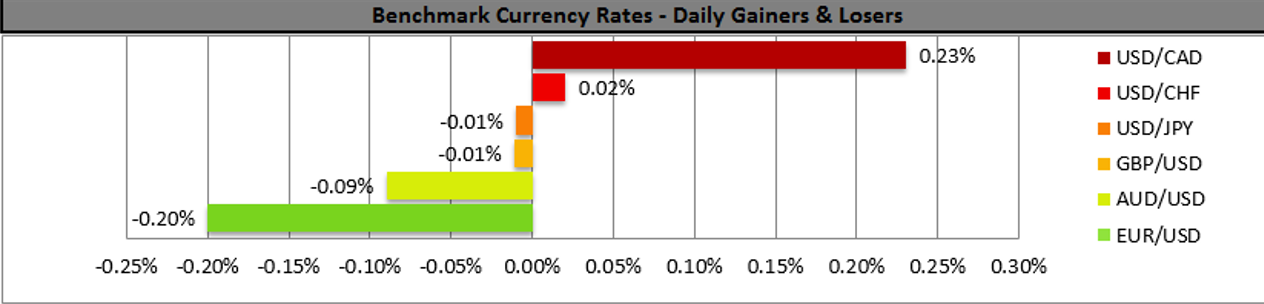
- USD drifted higher against the major pairs in quiet trading. USD/JPY tested the 115 area for a 1-month high with dealers eyeing key resistance at 115.25.
- EUR/USD back below the 1.13 level and stuck within the recent quarterly range.
- TRY currency (Lira) gave back so more of its recent strength amid renewed demand for USD. Lira weakness despite the CBRT continued to take steps to support the currency. TRY currency unable to capitalize on its rising 10-year govt bond yield as its climbed to a record high near 24.75% area.
Economic data
- (RU) Russia Dec PMI Manufacturing: 51.6 v 51.5e (3rd straight expansion).
- (EU) Euro Zone Nov M3 Money Supply Y/Y: 7.3% v 7.6%e.
- (CH) Swiss Dec Expectations Survey: 0.0 (flat) v -10.8 prior.
- (AT) Austria Dec Manufacturing PMI: 58.7 v 58.1 prior (18th straight expansion).
Fixed income Issuance
- (IN) India sold total INR200B vs. INR200B indicated in 3-month, 6-month and 12-month bills.
- (DK) Denmark sold total DKK in 3-month, 6-month, 9-month and 12-month Bills.
Looking ahead
- 05:25 (EU) Daily ECB Liquidity Stats.
- 05:30 (GR) Greece Debt Agency (PDMA) to sell 26-week Bills; Avg Yield: % v -0.43% prior; Bid to cover: x v 2.07x prior (Dec 1st 2021).
- 06:00 (BR) Brazil Dec FGV Inflation IGPM M/M: 0.7%e v 0.0% prior; Y/Y: 17.6%e v 17.9% prior.
- 06:00 (PT) Portugal Nov Retail Sales M/M: No est v 2.3% prior; Y/Y: No est v 3.4% prior.
- 06:45 (US) Daily Libor Fixing.
- 07:00 (US) no MBA Mortgage Applications data scheduled (**Note: 2-weeks’ worth of data to be released on Wed, Jan 5th).
- 08:00 (UK) No Daily Baltic Dry Bulk Index this week.
- 08:30 (US) Nov Preliminary Wholesale Inventories M/M: 1.5%e v 2.3% prior; Retail Inventories M/M: 0.5%e v 0.1% prior.
- 08:30 (US) Nov Advance Goods Trade Balance: -$88.1Be v -$82.9B prior.
- 10:00 (US) Nov Pending Home Sales M/M: 0.8%e v 7.5% prior; Y/Y: No est v -4.7% prior.
- 10:30 (US) Weekly DOE Oil Inventories.
- 11:00 (RU) Russia Q3 Final GDP (3rd reading) Y/Y: 4.4%e v 4.3% prelim.
- 11:00 (RU) Russia Nov Unemployment Rate: 4.3%e v 4.3% prior.
- 11:00 (RU) Russia Nov Real Retail Sales Y/Y: 4.3%e v 4.1% prior.
- 11:00 (RU) Russia Oct Real Wages Y/Y: 1.4%e v 2.0% prior.
- 11:00 (RU) Russia Dec Preliminary CPI M/M: 0.7%e v 1.0% prior; Y/Y: 8.3%e v 8.4% prior.
- 12:30 (BR) Brazil Nov Central Govt Budget Balance (BRL): 1.3Be v 28.2B prior.
- 13:00 (US) Treasury to sell 2-Year FRN Reopening.
- 13:00 (US) Treasury to sell 7-Year Notes.
- 18:00 (KR) South Korea Nov Industrial Production M/M: +2.5%e v -3.0% prior; Y/Y: 3.4%e v 4.5% prior.
Santa Claus Rally Takes A Breather, Dollar Firms
- Stocks mixed after Wall Street rally fizzles out, but futures point up
- Dollar inches higher, yen firms too amid some Omicron worries
- Oil extends gains, gold pulls back despite soft Treasury yields
Wall Street falters but party not over
Equity markets were feeling somewhat less joyous on Wednesday after the S&P 500 failed in its bid to close above the 4,800 level for the first time and as Chinese tech stocks came under renewed selling pressure.
The S&P 500 ended the day 0.1% lower, while the Nasdaq Composite slid 0.6%. Only the Dow Jones Industrial Average managed to stretch its gains onto a fifth day, coming just shy of its all time high from November. With three more trading days to go before 2021 draws to a close, there’s hope yet for the Santa Claus rally to resume and lift Wall Street to unchartered territory.
Optimism about the US growth outlook and diminishing fears that the rapid spread of the Omicron variant will prompt new lockdowns in the major economies are driving this latest upswing. Although daily virus cases are soaring in several countries like America and Britain where Omicron is now the dominant strain, hospitalizations have so far remained below the peaks seen in the Delta wave.
Omicron and China doubts weigh in Asia
A bigger worry is what impact Omicron will have in Asia once it starts to escalate there as well. Vaccination rates vary greatly across Asia and even those countries with a very high uptake level have yet to get started with booster jabs. Hence, there’s a fair bit of uncertainty hanging over the growth picture in the first few months of 2022.
These jitters, combined with ongoing concerns about China’s regulatory crackdown on its tech sector are weighing slightly on Asian markets today. Shares in Hong Kong, China and South Korea fell the most.
Europe also succumbed to some profit-taking, though London’s FTSE 100 jumped about 1% as it played catchup after a two-day bank holiday. US stock futures were positive too, indicating sentiment is more likely to improve than not during the course of the day.
Dollar rises to one-week high in subdued trading
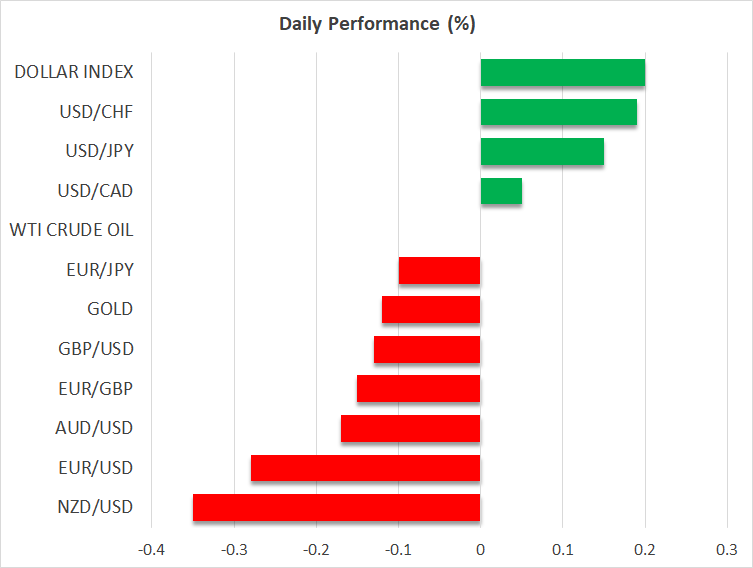
In the FX arena, the mildly more cautious tone nudged the US dollar slightly higher. The dollar index climbed to a one-week high, mainly on the back of the yen’s slump as other majors have been trading in narrower ranges this week. However, the Japanese currency has been recouping some of its losses in the past 24 hours, particularly against the euro. Though, dollar/yen hit a fresh one-month high today to test the 115 level.
The pound, euro and New Zealand dollar retreated slightly, but the aussie and loonie were flat on the day.
The greenback has been consolidating since late November, with the riskier currencies making only a partial rebound from the Omicron-induced selloff. The steady uptrend in the two-year Treasury yield is probably what’s supporting the dollar because longer-dated yields haven’t really gone anywhere lately.
Gold slips again, but oil maintains bullishness
But the moves in the US Treasury market have on balance been positive for gold, which has been slowly edging higher since mid-December. Nevertheless, the latest attempt to convincingly break above $1,800 didn’t end well, as the precious metal has now pulled back towards this key level after briefly brushing $1,820/oz yesterday.
Oil prices, however, maintained their upward trajectory as investors continued to bet that the Omicron outbreak will have only a limited hit on demand. WTI futures were last trading at $76.10 a barrel, having recovered more than 20% from the early December low.

US Indices Are Going For Records And Oil Is Stable
Yesterday, the US stock market traded without a single trend. The S&P 500 index (US500) decreased by 0.1%, the Nasdaq technology index (US100) lost 0.56%, while the Dow Jones Industrial Average (US30) gained 0.26% and rose for the fifth straight trading session, the longest uninterrupted period of growth in two months. Since the beginning of the current year, the Dow Jones (US30) has gained nearly 19%, the S&P 500 (US500) added more than 27%, the Nasdaq (US100) increased by 22.5%. Meanwhile, the S&P 500 index showed a larger gain for 2021 than the Nasdaq index for the first time since 2016.
On Monday, the Centers for Disease Control and Prevention (CDC) reduced the recommended isolation time for Americans with asymptomatic cases of COVID-19 infection to five days from 10 days previously. The CDC has issued new recommendations, as well as the approval of new pills and vaccines against COVID-19. This helped investors not respond sharply to the cancellation of thousands of flights and the closure of Apple stores due to increased illness among employees.
European stock indices mostly rose yesterday. Germany's DAX (DE30) increased by 0.81%, France's CAC 40 (FR40) gained 0.57% and Spain's IBEX (ES35) added 0.77%. Spain's retail sales index jumped by 4.9% in November. The sales did not grow four months in a row. The ECB began to reduce the pace of buying assets. These are the first steps toward ending the PEPP program next year and raising the issue of an interest rate hike. But analysts agree that the ECB will not raise the rates before 2023.
On Tuesday, Asian stock indexes were mixed and are decreasing at the opening on Wednesday. Traders negatively weigh the economic growth risks associated with the Omicron virus outbreak and the latest regulatory tightening in China. In Asia, there are relatively few cases of infection with a strain Оmicron compared to European countries and the United States. Despite this fact, investors are growing concerned that the rise in the disease will lead to lockdowns and new problems in supply chains. But the Australian stock market, which opened on Wednesday for the first time since the Christmas holiday, saw strong gains. The Australian ASX 200 Index (AU200) jumped by 1.21% from the open.
The data from the American Petroleum Institute showed that US crude oil inventories fell by 3.1 million barrels last week, which was in line with analysts' expectations. The oil keeps its upward trend as Omicron risks to demand decrease while inventories are also declining, causing a weak deficit. The US Department of Energy will release its report on crude oil inventories today.
The number of tankers carrying gas from the US to Europe has increased by a third. This suggests that Europe does not have enough reserves to pass the heating season.
Main market quotes:
- S&P 500 (F) (US500) 4,786.35 −4.84 (−0.10%)
- Dow Jones (US30) 36,398.21 +95.83 (+0.26%)
- DAX (DE40) 15,963.70 +128.45 (+0.81%)
- FTSE 100 (UK100) 7,372.10 −1.24 (−0.02%)
- USD Index 96.16 +0.07 (+0.07%)
Important events for today:
- US Pending Home Sales (m/m) at 17:00 (GMT+2);
- US Crude Oil Inventories (w/w) at 17:30 (GMT+2).
The Analytical Overview Of The Main Currency Pairs
The EUR/USD currency pair
Technical indicators of the currency pair:
Prev Open: 1.1326
Prev Close: 1.1308
% chg. over the last day: -0.16%
The ECB reduced the pace of its asset purchases. This is a positive factor for the strengthening of the Euro. However, it should be noted that the FED is also cutting the QE program. Therefore, EUR/USD quotes are not likely to grow significantly, but in the short term, the Euro will be stable.
Trading recommendations
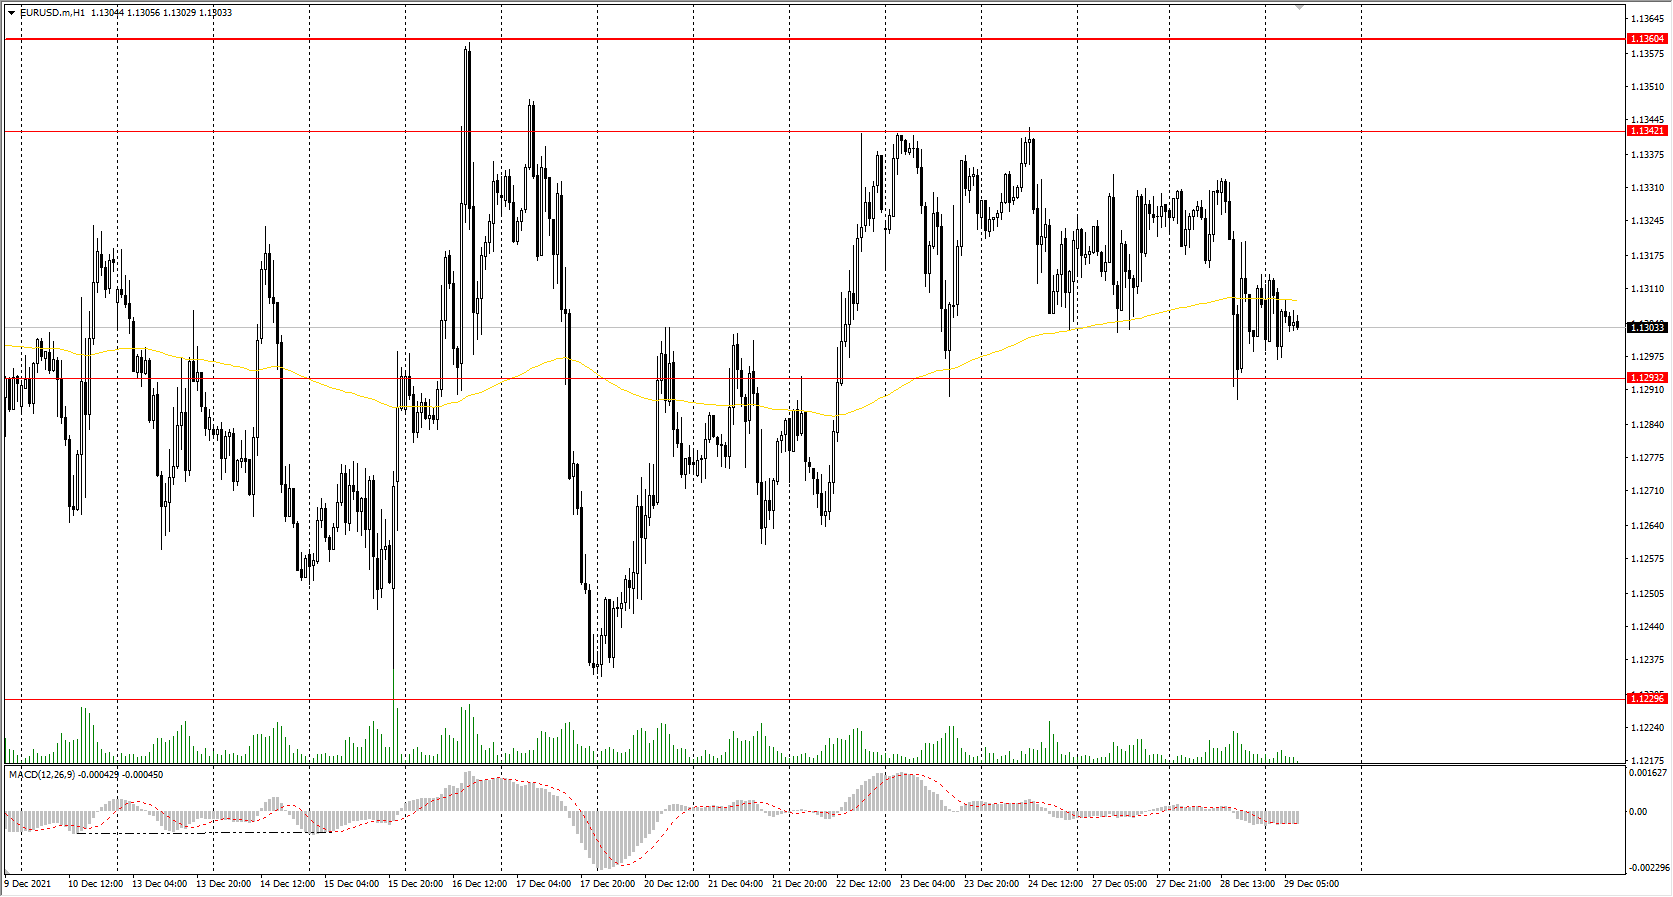
Support levels: 1.1293, 1.1230, 1.1168
Resistance levels: 1.1342, 1.1360, 1.1436, 1.1535, 1.1613, 1.1667, 1.1717
From a technical point of view, the EUR/USD on the hour time frame is still bearish. The price is traded in a corridor. The MACD indicator has become inactive; the volatility is below average due to the holidays. It is better to consider sell deals after a false breakout of the 1.1342 resistance level. Buy trades can be considered on the lower time frames from the support level of 1.1293, but only with additional confirmation.
Alternative scenario: if the price breaks out through the 1.1360 resistance level and fixes above, the mid-term uptrend will likely resume.
News feed for 2021.12.29:
- US Pending Home Sales (m/m) at 17:00 (GMT+2).
The GBP/USD currency pair
Technical indicators of the currency pair:
Prev Open: 1.3437
Prev Close: 1.3428
% chg. over the last day: -0.07%
The British government has no plans to impose a nationwide lockdown despite the high sickness rate as the number of hospitalizations is 50% lower than under the Delta strain. Growth in "Brent" oil prices provides additional support to the British currency.
Trading recommendations
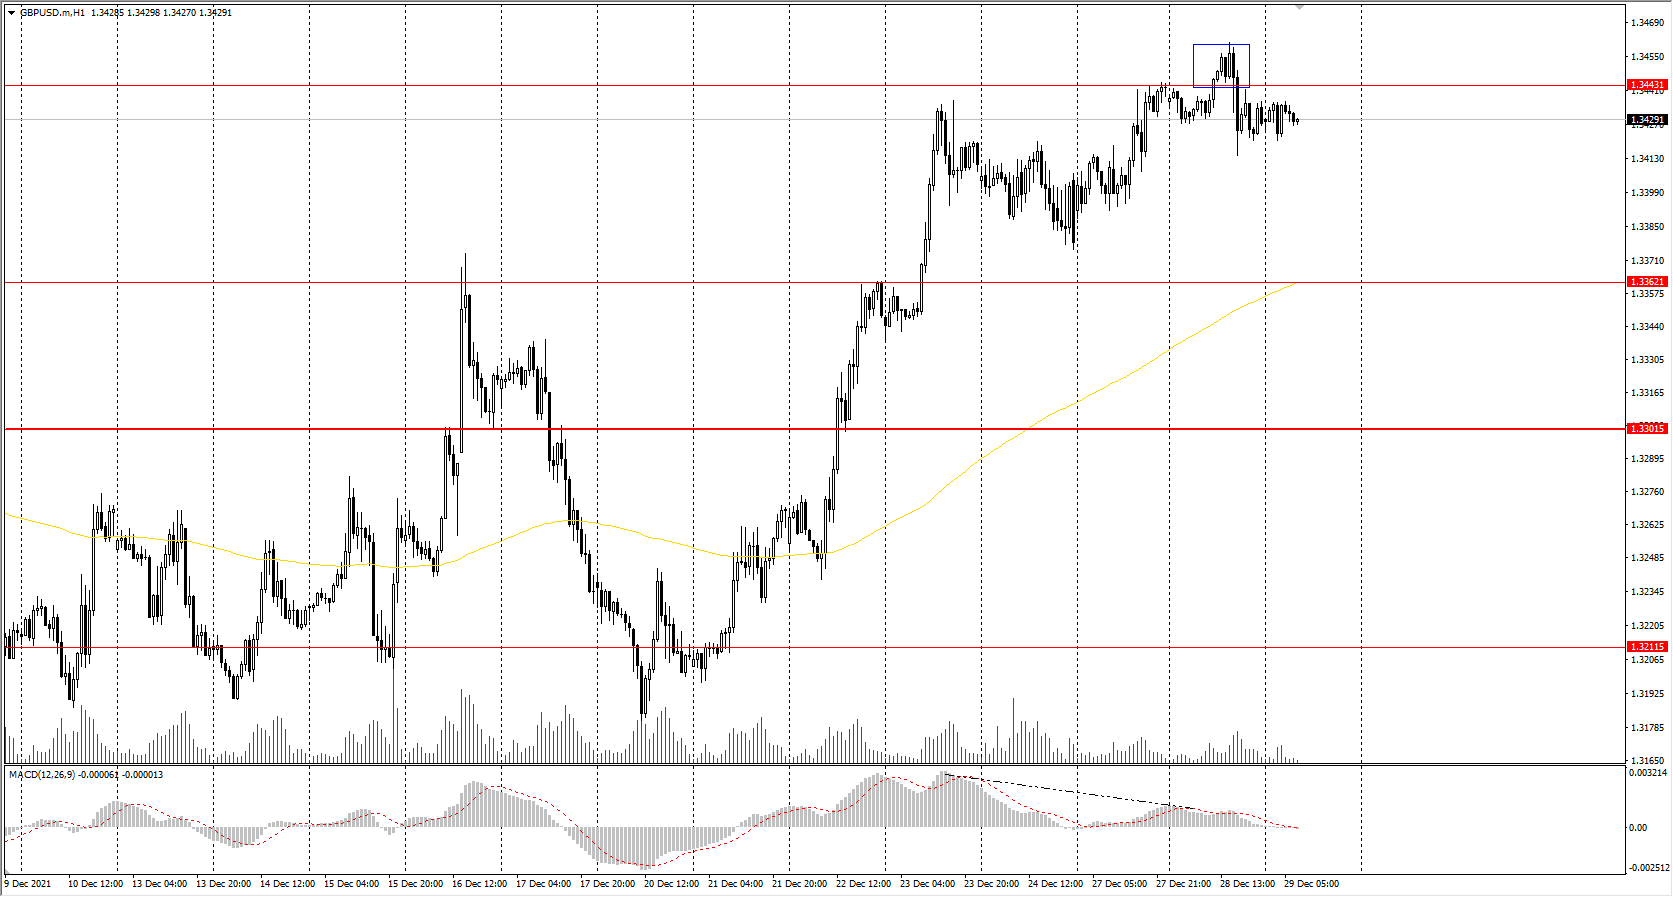
Support levels: 1.3362, 1.3301, 1.3277, 1.3220
Resistance levels: 1.3443, 1.3507, 1.3575, 1.3685
On the hourly time frame, the trend on GBP/USD is still bullish. But the MACD indicator is showing a divergence. Under such market conditions, traders should consider buy positions from the 1.3362 support level but only with additional confirmation in the form of a buyers' initiative. Sell trades can be considered from the resistance level of 1.3443, where there was a false breakout.
Alternative scenario: if the price breaks down through the 1.3301 support level and consolidates below, the bearish scenario will likely resume.
The USD/JPY currency pair
Technical indicators of the currency pair:
Prev Open: 114.83
Prev Close: 114.81
% chg. over the last day: -0.02%
In terms of monetary policy analysis, Japan's central bank is now actively stimulating the economy, while the US Federal Reserve is reducing its stimulus program. This means that in the mid-term the dollar index will go up in value, while the Japanese yen will go down. As a result, the USD/JPY currency pair will continue its uptrend.
Trading recommendations
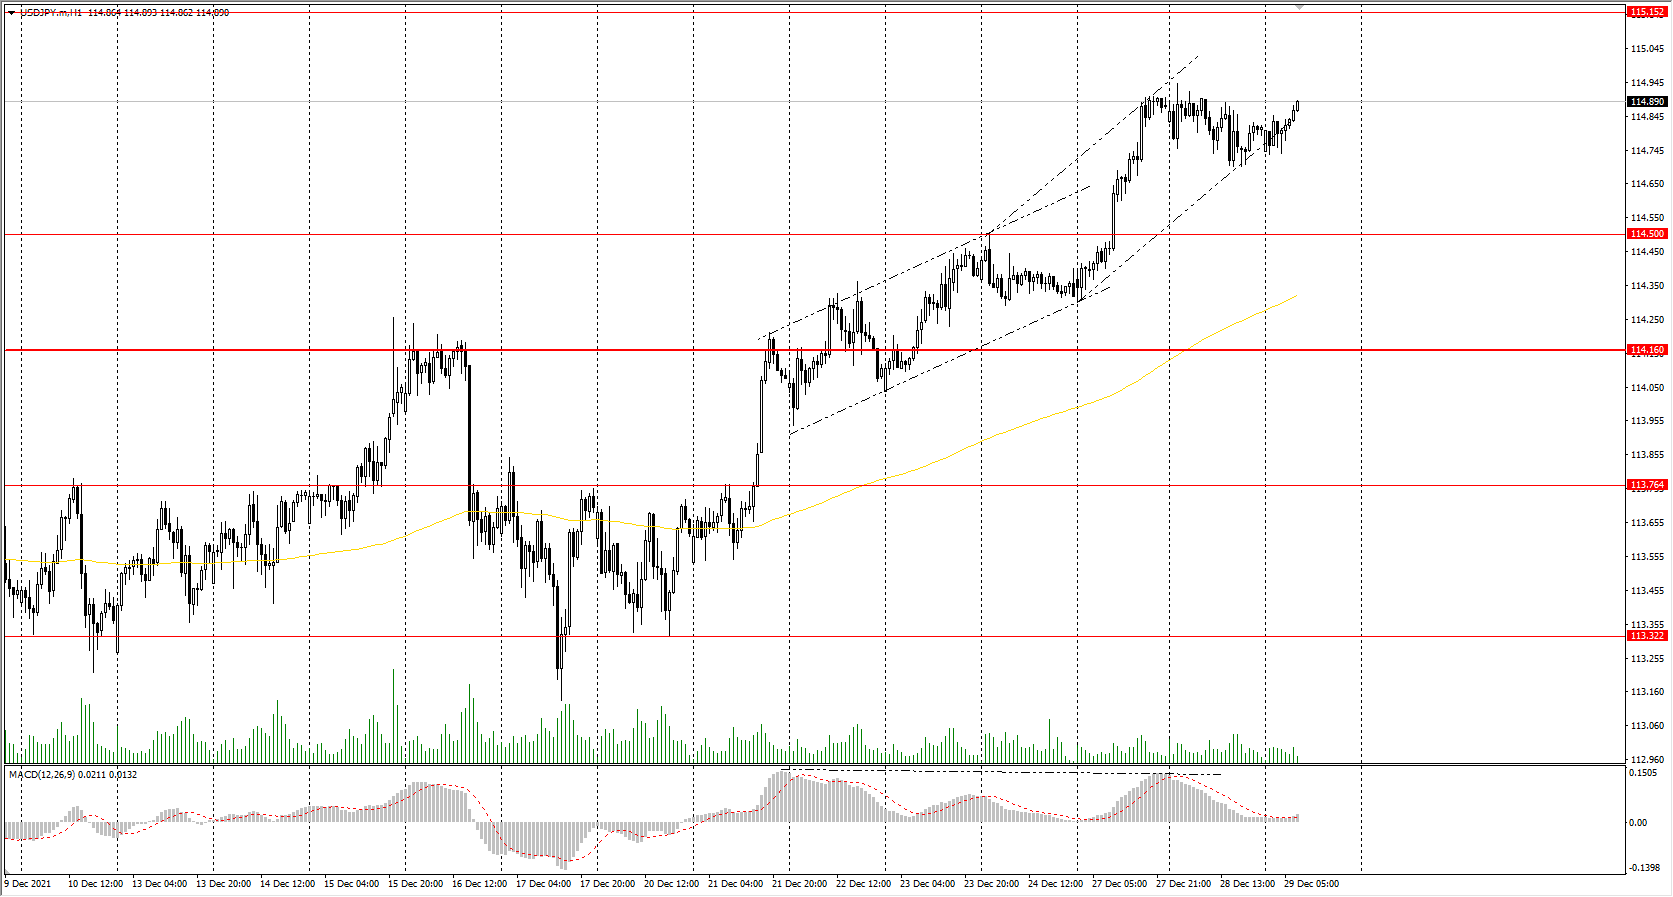
Support levels: 114.50, 114.16, 113.76, 113.32, 112.62, 112.30
Resistance levels: 115.15, 115.50
The global trend on the USD/JPY currency pair is bullish. The MACD indicator is signaling a divergence at several timeframes, which means that a slight correction should be expected. Buy positions should be considered from the 114.50 support level, but with additional confirmation in the form of a buyers' initiative. There is no optimal entry point for sell positions now.
Alternative scenario: if the price fixes below 114.16, the uptrend will likely be broken.
The USD/CAD currency pair
Technical indicators of the currency pair:
Prev Open: 1.2784
Prev Close: 1.2817
% chg. over the last day: +0.25%
The Canadian dollar is a commodity currency, so it correlates strongly with oil prices and the dollar index. Yesterday, oil prices increased while the dollar index was stable. As a result, the USD/CAD currency pair has grown slightly.
Trading recommendations
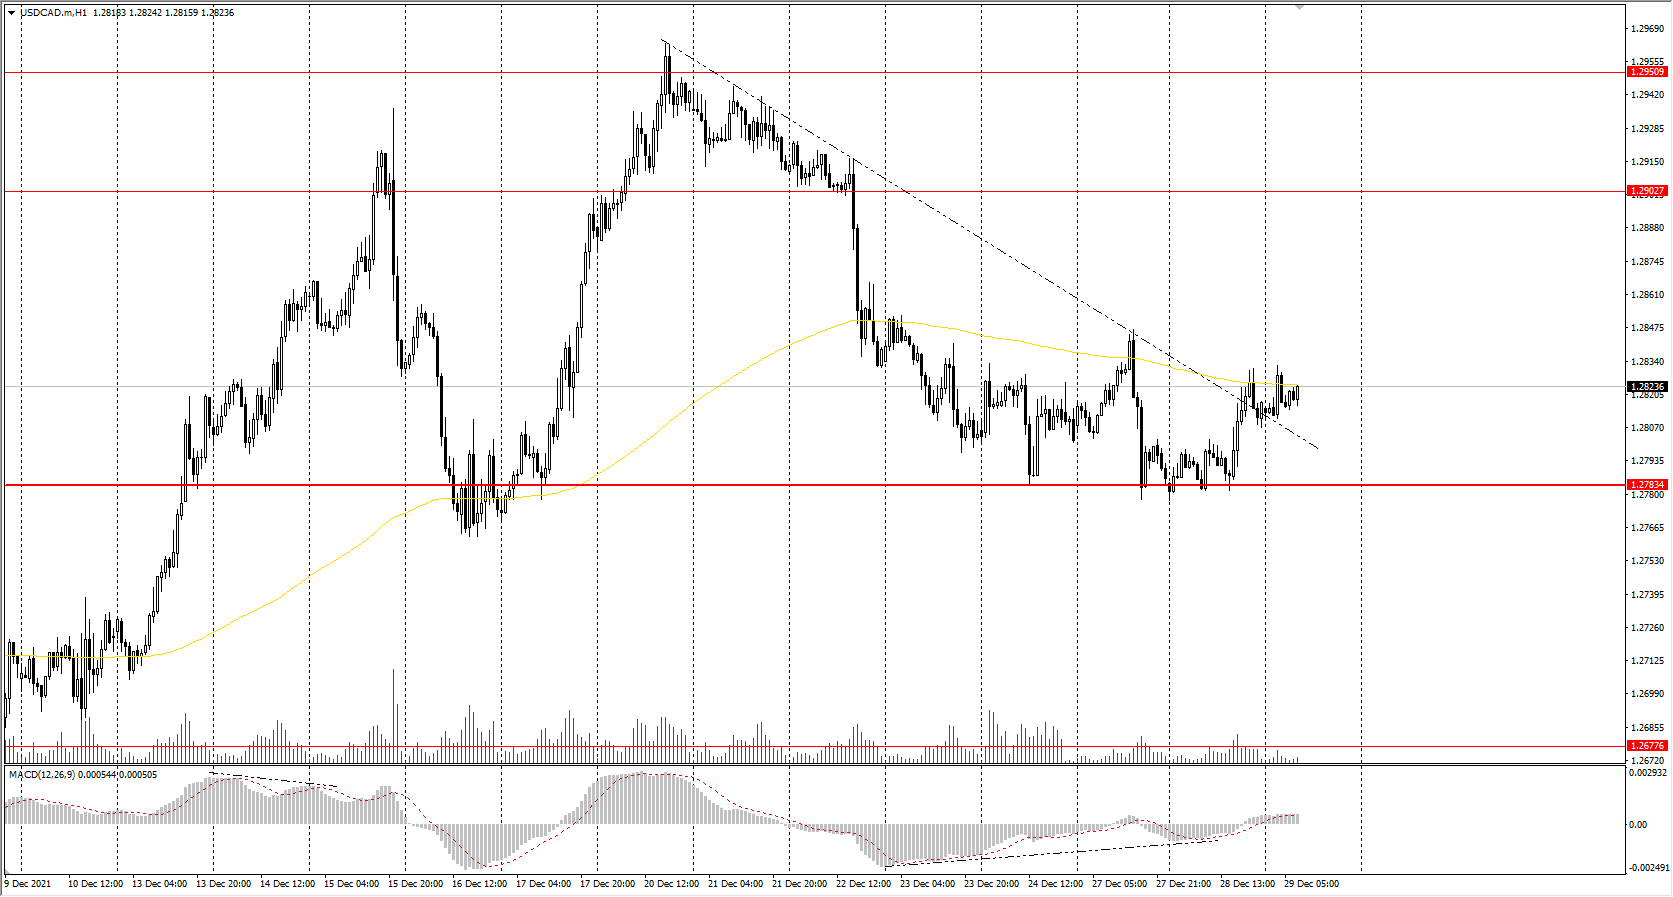
Support levels: 1.2783, 1.2721, 1.2677, 1.2638
Resistance levels: 1.2903, 1.2951
From a technical point of view, the USD/CAD currency pair trend is bullish. Buyers were able to defend the priority change level, the price rebounded, and broke out the local descending trendline. The MACD indicator has become positive. Under such market conditions, it is better to look for buy deals on the lower time frames with the target of 1.2903. Sell deals should be considered from the resistance level of 1.2903 or after breakdown and fixation below the priority change level.
Alternative scenario: if the price breaks down through the 1.2783 support level and fixes below, the downtrend will likely resume.
News feed for 2021.12.29:
- US Crude Oil Inventories (w/w) at 17:30 (GMT+2).
Omicron Uncertainty Continues To Drive The Markets
Tuesday’s price action was rather muted during the European session yet volatility increased to some extent entering the US session. The USD gained some strength and managed to work its way to dominate across the board. The greenback made notable gains against the CAD and the EUR while it neared break even against the JPY making it the only currency to stand its ground against the USD. The JPY may have been supported by a strong Preliminary Industrial Production reading that jumped from previous 1.8% to 7.2% in November.
Among other currencies the EUR was rather weak and lost ground against all majors except the AUD and the NZD which may have performed their weakest session during this week so far. The GBP was extremely strong against the NZD. However, even though it reached a new monthly high against the USD it corrected lower in the US session and did not manage to top the greenback for a second consecutive daily session. On a weekly basis GBP displayed significant strength against the JPY. WTI’s price action remained rather muted as the market seems to be concerned about future plans the OPEC plus group will implement to keep the market in balance.
Some analysts don’t see OPEC changing its strategy thus a sentiment for a stabilization at higher prices seems to persist for the time being. WTI continues to trade above $75.50 per barrel for the time being. Gold initially strengthened during the normal course of the daily session yet later turned lower and lost the ground gained including some gains from the past days. Silver reached a new December high on Tuesday yet relented ground thereafter in the early US session. US stock markets sent mixed signals as the Nasdaq and the S&P500 fell in red territory while the Dow Jones remained positive.
Technically some stabilization for the indexes makes sense as the upward movement persisted for the previous four daily sessions. The Turkish lira weakened for the second consecutive day against the USD, GBP and the EUR. Very notably reports state that the Turkish Banking Supervision and Regulation Agency is suing individuals that supposedly tried to manipulate the Liras exchange rate through comments on social media platforms. Among the people sued are two previous chairmen of the central bank of Turkey. Impressively, the CZK on a continuous strengthening managed to reach a 22 month high against the EUR. The Czech currency is supported by the confidence the Czech economy is displaying as the CNB continues to impose rate hikes.
This happening seems to favour the CZK against the EUR, as the later remains affected by the uncertainty surrounding the Eurozone block. On Tuesday media headlines from around the world confirmed COVID-19 cases had been on the rise in several countries reaching record highs. The impact on the market has been mild yet traders should be cautious as circumstances can change in an instance. On a more positive note The US Centre for Disease Control and Prevention (CDC) reduced isolation time for asymptomatic cases of COVID-19 to five days from the previous guidance of 10 days. This is said to be an action taken to limit somewhat the impact on the economy. We suggest that new actions that will combine public protection and economic support will continue to be announced in the days to come, as this may be the only path forward at the moment.
GBP/JPY continues to be in an upward momentum at the moment and has tested the (R1) 154.50 recently. This level may require extensive power to be breached yet a move above it could confirm the bulls are dominating the scene. In this case we could also see the (R2) 155.35 line coming into play while even higher the (R3) 156.20 may also be a target as it was last seen in early November. In the opposite direction a possible selloff can become evident if the price action make its way to test the (S1) 153.65 line. If this level is breached downwards then the (S2) 152.75 line could be next while at the end the (S3) 151.90 is the final support for this analysis.
According to the RSI indicator below our chart, a move above the 70 level may be implying the upward momentum persists. In our view an upward bias with some sideways tendencies in the short term could be more appropriate.
XAG/USD is also among the instruments that continues to run upwards in the current week. Yesterday Silver managed to break above the (R1) 23.10 line reaching a new monthly high yet the price action returned lower a few hours later. If the trend continues then the (R2) 23.60 level is approached then this can signal the buying tendencies have increased. At the top the (R3) 24.05 line is also imminent. A possible drop to the downside can force silver towards the (S1) 22.60 level. A movement even lower could bring the price action closer to the (S2) 22.15 level. Finally the (S3) 21.50 level can also be engaged in a more extended selling strategy. The RSI indicator below our chart remains below 70 implying the bulls may need more space to move in order to take over.
GBP/JPY H4 Chart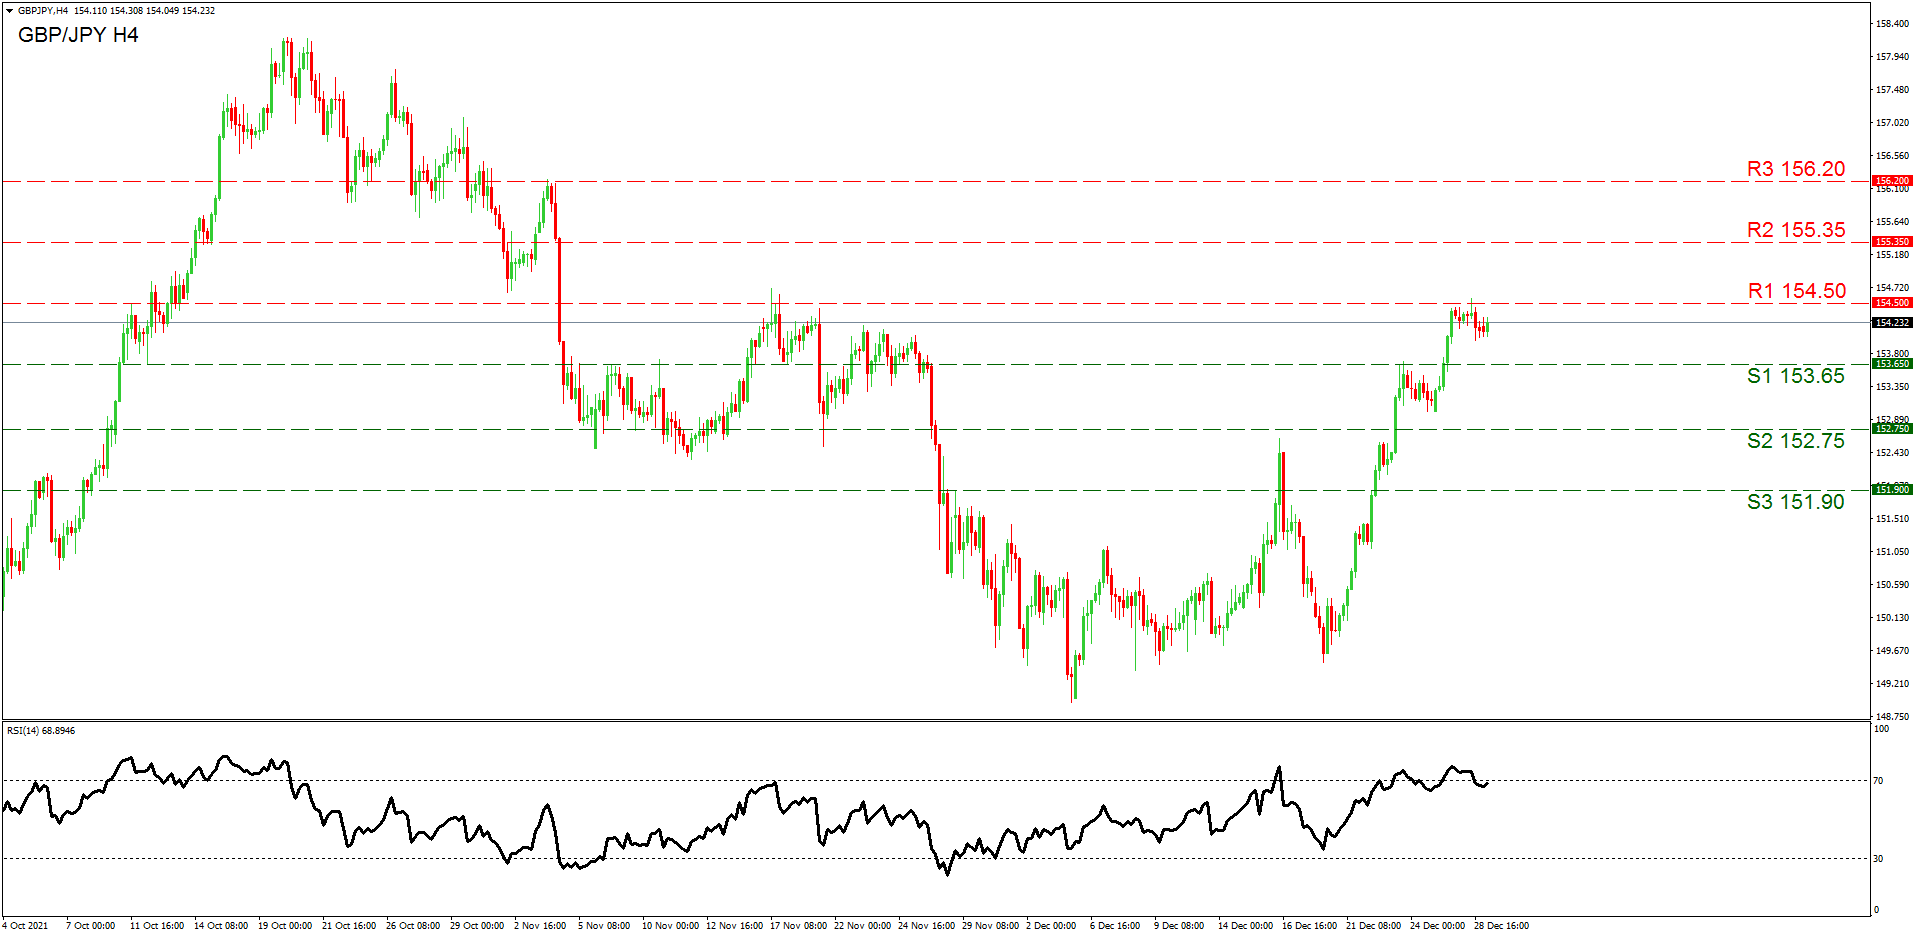
Support: 153.65 (S1), 152.75 (S2), 151.90 (S3)
Resistance: 154.50 (R1), 155.35 (R2), 156.20 (R3)
XAG/USD H4 Chart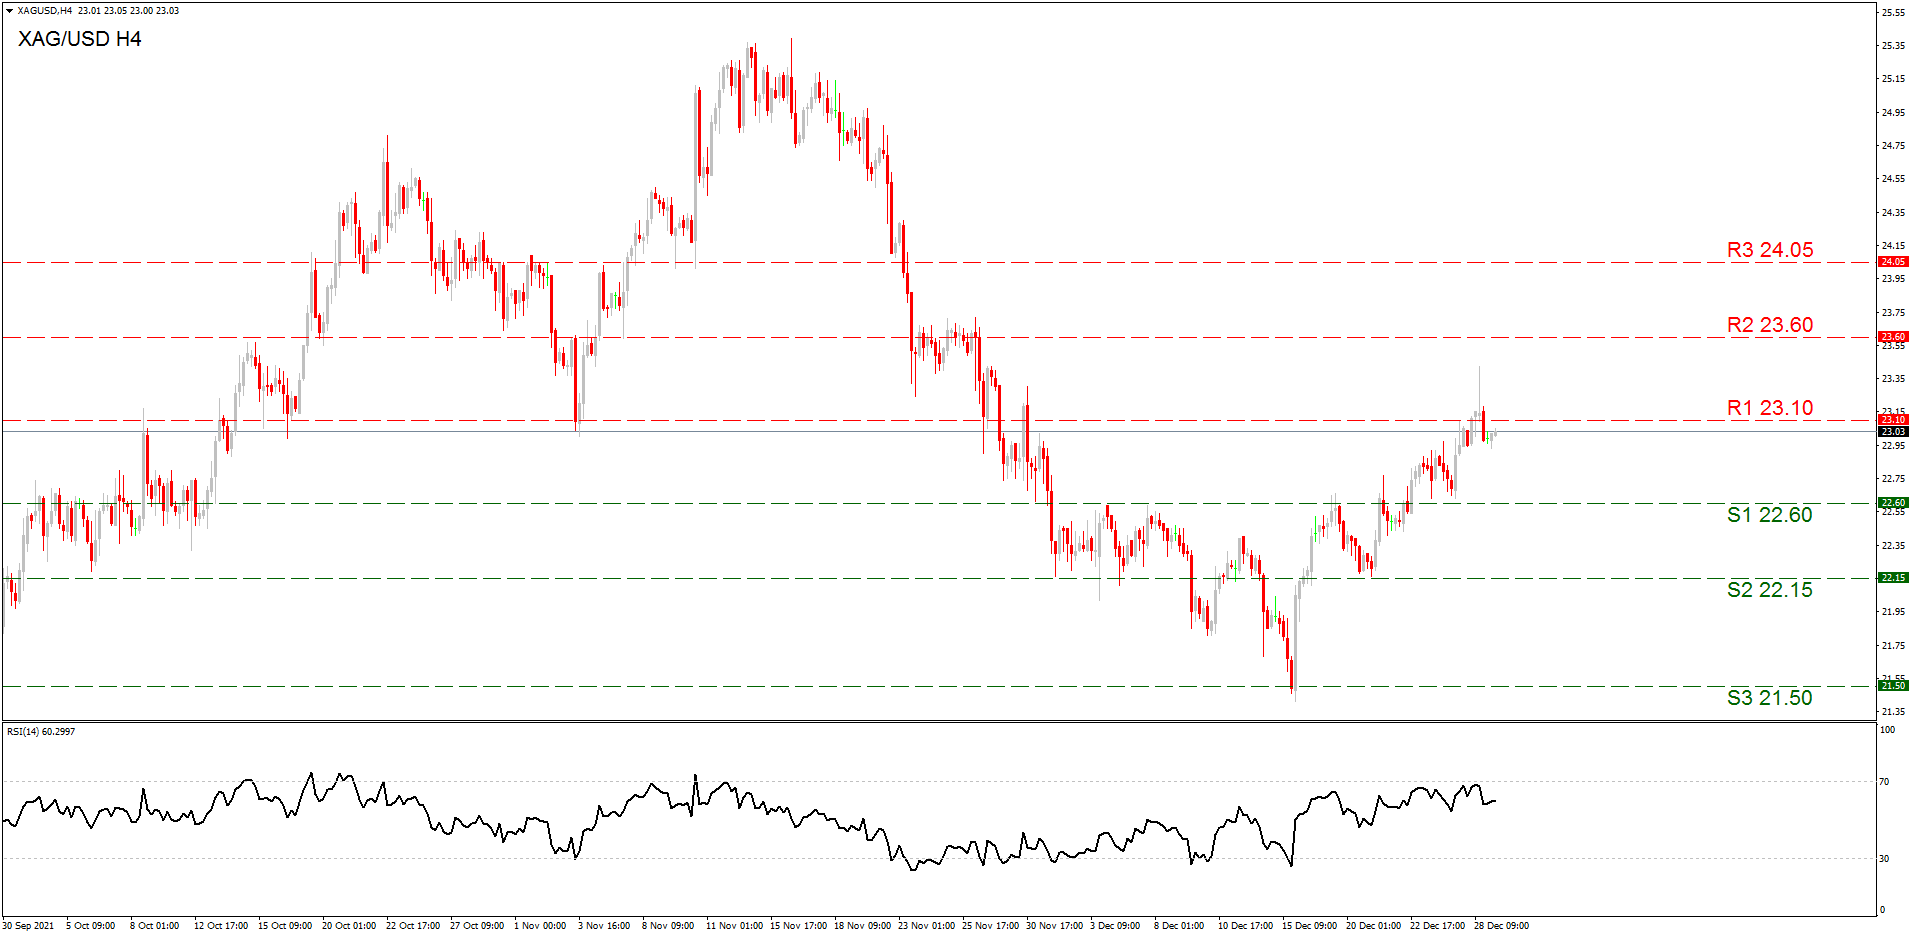
Support: 22.60 (S1), 22.15 (S2), 21.50 (S3)
Resistance: 23.10 (R1), 23.60 (R2), 24.05 (R3)
USDJPY’s One-Month Rally Reinforces Broader Uptrend
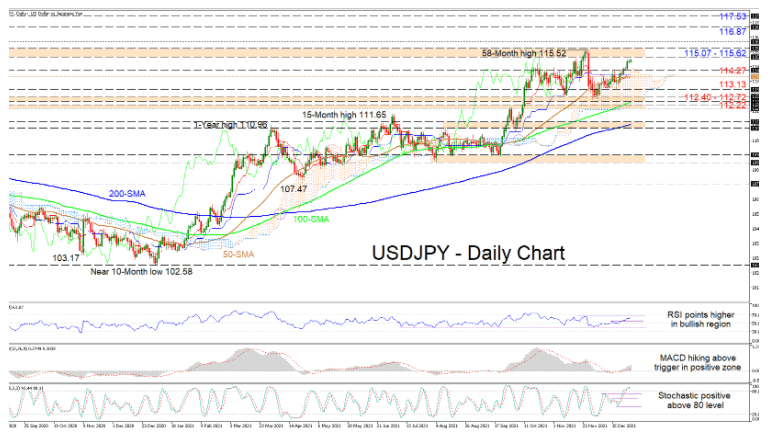
USDJPY is ready to confront the resistance section of 115.07-115.62 after the price bounced within the 112.40-112.72 support base and subsequently found footing off the Ichimoku cloud's upper band. The simple moving averages (SMAs) are maintaining a northbound trajectory, backing the ascent.
Currently, the Ichimoku lines are not indicating a definitive price direction, while the short-term oscillators are promoting advances in the pair. The MACD, north of the zero mark, is climbing above its red trigger line, while the RSI is ascending in the bullish region. Moreover, in the overbought territory, the stochastic lines are promoting upside drive in the pair, as the %K line has yet to hint of any waning in bullish forces.
If the price sustains its current path, resistance could originate from the toughened 115.07-115.62 barricade shaped by the rally peaks from January and March 2017, as well as the fresh near 5-year high of 115.52. If the one-year uptrend resumes, the 116.00 psychological number could draw attention. From here, any additional gains in the pair may encourage buyers to pilot for the 116.87 and 117.53 highs, achieved in January 2017.
Otherwise, if the 115.07-115.62 barrier curbs the extension of the one-month rally, sellers could face initial downside limitations between the 114.27 obstacle and the 50-day SMA at 113.89. However, retreating deeper into the cloud, the 113.13 low could come into play ahead of the 112.40-112.72 support border. It's worth pointing out that either the above mentioned border, or the adjacent support band from the February 2020 rally peak of 112.22 until the 112.00 handle would need to remain intact to avoid throwing any doubt into the broader uptrend.
Summarizing, USDJPY is sustaining a bullish bias above the SMAs and the 112.40-112.72 support barrier.
GBP/USD Pair Started A Downside Correction From The 1.3461 High
The British Pound started a fresh increase from the 1.3320 support zone against the US Dollar. The GBP/USD pair was able to clear the 1.3400 and 1.3420 resistance zone.
It even climbed slightly above the 1.3450 level and the 50 hourly simple moving average. The pair traded as high as 1.3461 and started a downside correction. There was a move below the 1.3440 and 1.3420 levels.
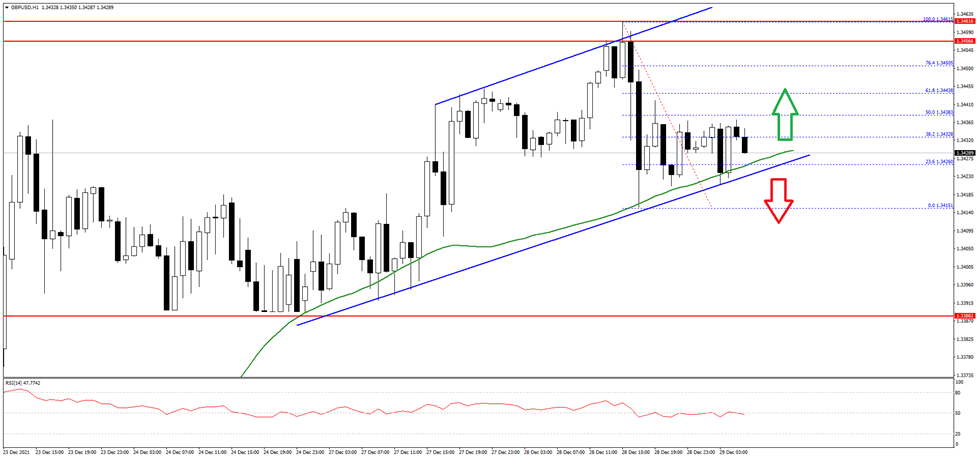
An initial support on the downside is near the 1.3425 level. The main support is forming near 1.3400 on FXOpen. A break below the 1.3400 support level could even push the pair below the 1.3380 support
On the upside, the pair is now facing resistance near the 1.3440 zone. The next key resistance is near the 1.3450 level. Any more gains might push the pair towards the 1.3500 level.
Santa Claus Rally Gains Momentum As S&P Soars To Record High
US equities extended the Christmas holiday rally as interest in stocks rose. The Dow Jones added more than 160 points, while the S&P 500 soared to a record high of $4,800. The Nasdaq 100 index moved sideways. Carnival was the biggest gainer in the S&P 500 as its stock rose by more than 3%. Other travel-related stocks like United Airlines and Southwest Holdings also rallied. This is a sign that investors are optimistic that the Omicron variant will not deter people from travelling. The top laggards were companies like Pfizer, Micron, and DexCom.
The US dollar rose even after the relatively weak US housing data. The closely-watched S&P Case-Shiller National Home Price Index rose by about 19.1% in the year that ended in October. This was a decline from the previous month’s increase of 19.1%. The number, which measures the average home prices in major metro areas, has declined in the past three months. Still, home prices have jumped sharply this month as buyers took advantage of low interest rates and low inventories. The existing-home sale price rose to $353,900 in November as the proportion of first-time homebuyers declined to 26%.
The economic calendar will have few events, since most countries published their monthly data last week because of the Christmas holiday. The key data to watch today will be from the United States. The Energy Information Administration (EIA) will publish the latest oil inventory data. Analysts expect the data to show that the country’s inventories declined by another 3.23 million barrels last week. That will be a smaller decline than the previous month’s decline of more than 4.7 million barrels. The US will also publish the latest pending home sales and mortgage numbers.
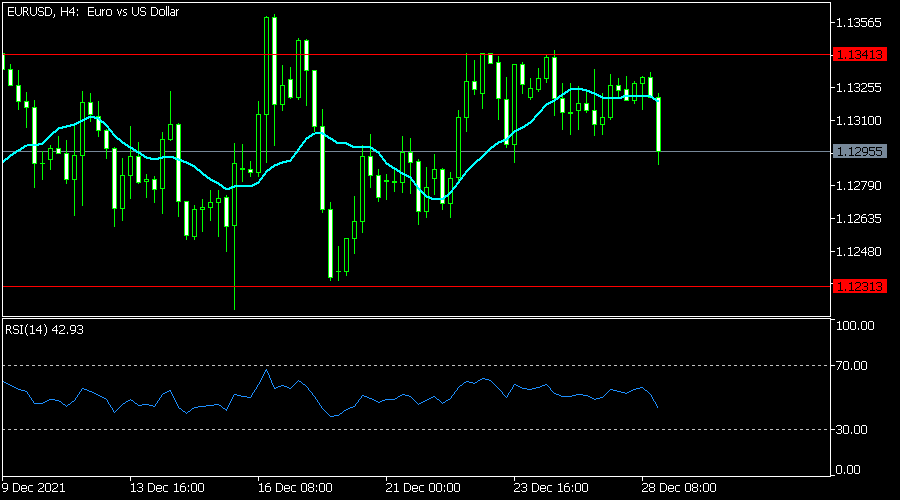
EURUSD
The EURUSD pair tilted lower after the relatively weaker US economic data. The pair declined to a low of 1.1293, which was the lowest level since December 23. The pair is slightly below the chin of the double-top pattern at 1.13000. It is still slightly below the upper side of the horizontal channel that is shown in red. Also, it has moved slightly below the 25-day and 50-day moving averages. Therefore, the pair will likely keep falling as bears target the lower side of the channel at 1.1230.
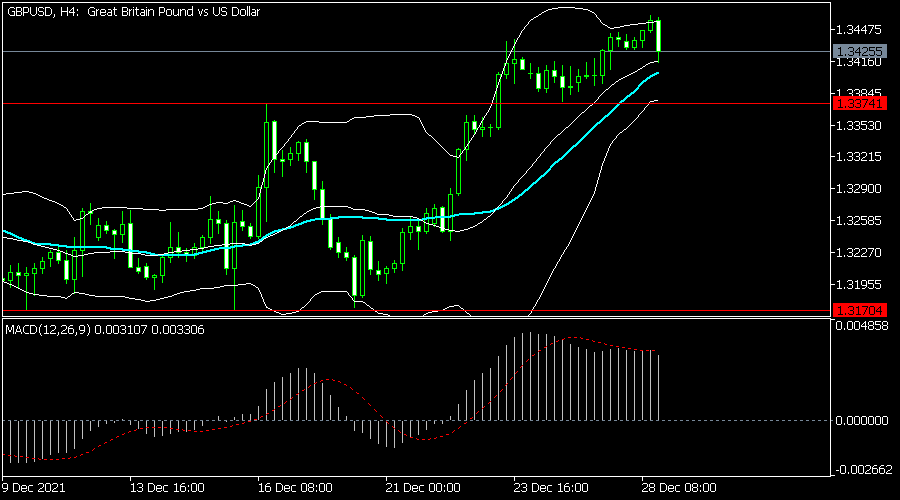
GBPUSD
The GBPUSD pair declined to 1.3415, which was slightly below this week’s high of 1.3462. The pair has formed what looks like a double-top pattern. It also moved to the middle line of the Bollinger Bands, while the Relative Strength Index (RSI) and MACD have moved lower. Therefore, the pair will likely keep falling as bears target the key support at 1.3375, which was at the highest level on December 16.
USDMXN
The USDMXN pair declined to the lowest level since November 15. It is trading at 20.58, which was substantially lower than November’s high of 22.15. It moved below the 25-day and 50-day moving averages. The pair is slightly above the descending trendline, which is the neckline of the head and shoulders pattern. The MACD has also been in a bearish trend. Therefore, the pair will likely keep falling as bears target the next support at 20.40.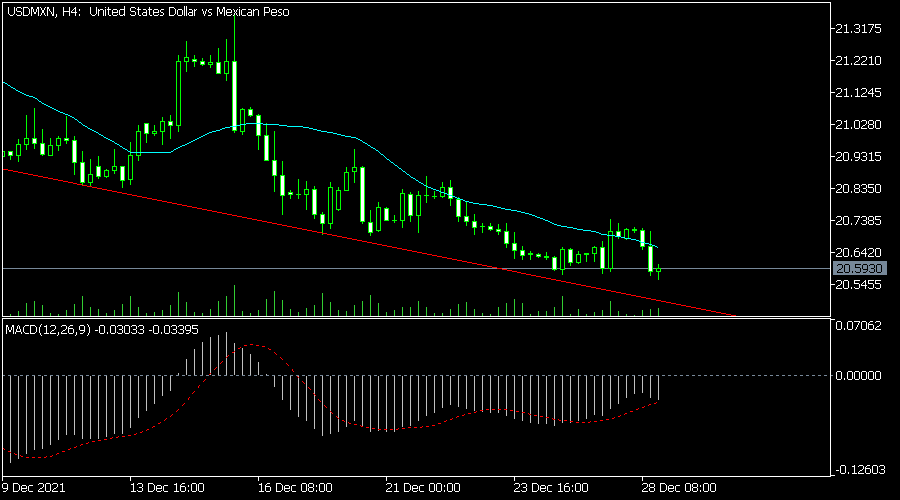
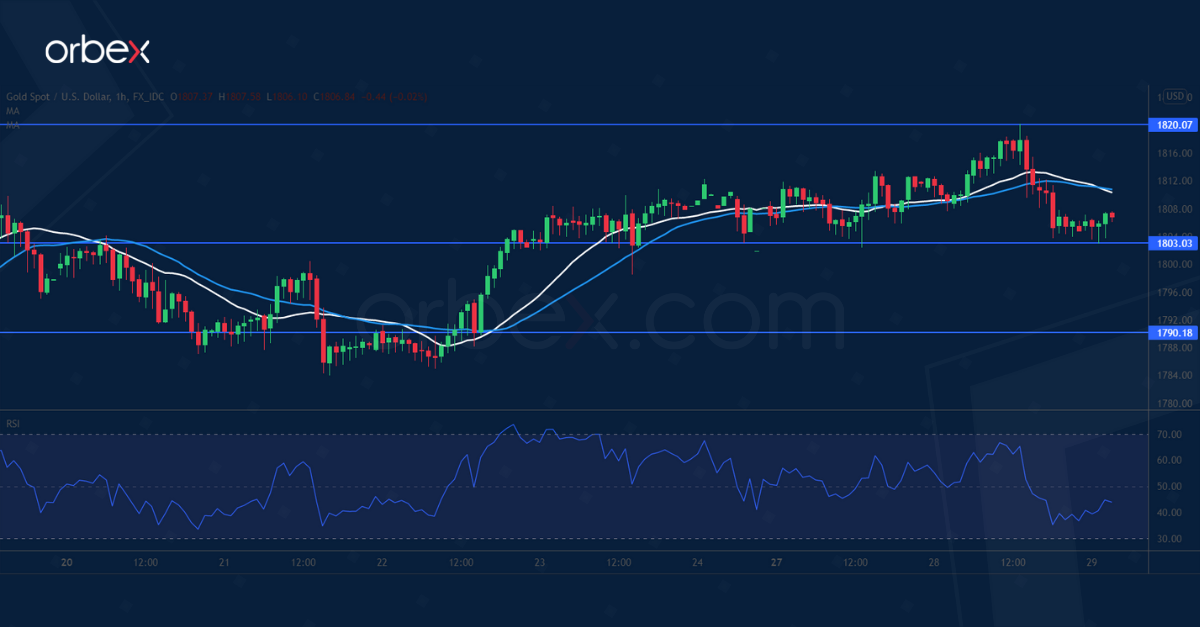
XAUUSD Seeks Support
Gold edged higher as the US dollar slipped across the board. A close above the supply zone around 1815 is a short-term confirmation that sentiment favors the upside.
A bullish MA cross on the hourly chart indicates that the recovery could be picking up steam. Above 1820, 1840 would be the target when momentum makes its way back into the market.
In the meantime, buyers may see a retracement to 1803 as an opportunity to buy the dip after the RSI returned to the neutrality area. 1790 is a second level of support.
NZDUSD Consolidates Recent Gains
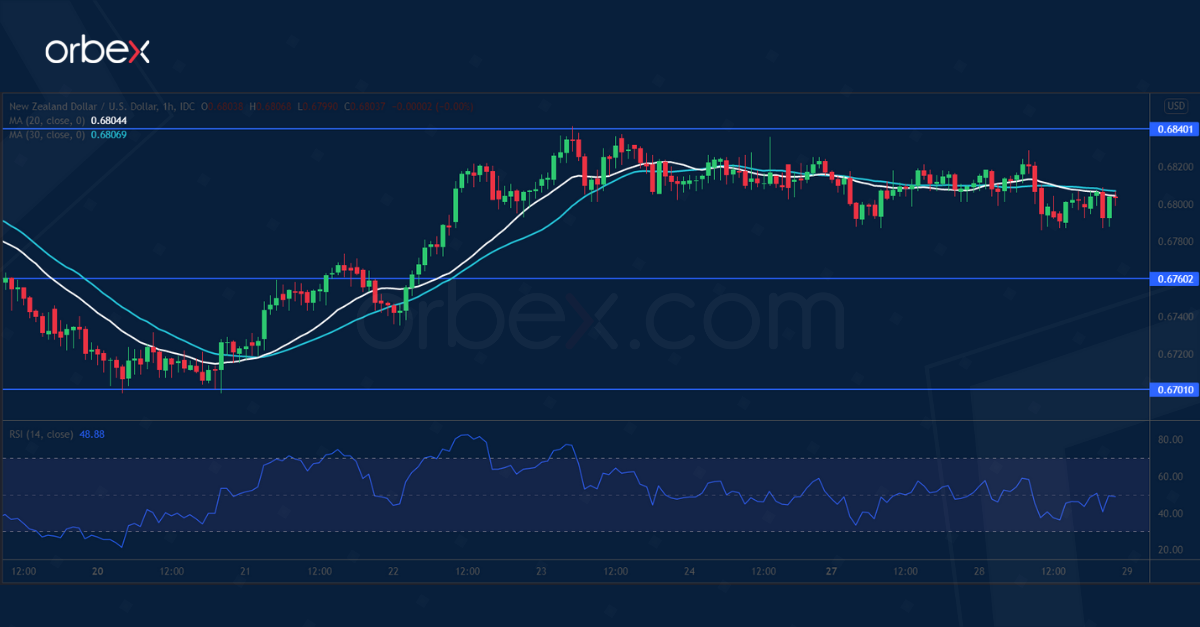
The New Zealand dollar softens over a limited year-end risk appetite. The latest surge above 0.6830 has put the bears on the defensive. Intraday traders took profit after the RSI showed overextension.
The current flag-shaped consolidation could be an opportunity for the bulls to regroup and catch their breath. The demand zone around 0.6760 is a major level to support the rebound.
On the upside, 0.6840 on the 30-day moving average is the closest resistance. And its breach may trigger a broader rally towards 0.6920.