Sample Category Title
USD/CAD Daily Outlook
Daily Pivots: (S1) 1.2776; (P) 1.2806; (R1) 1.2823; More...
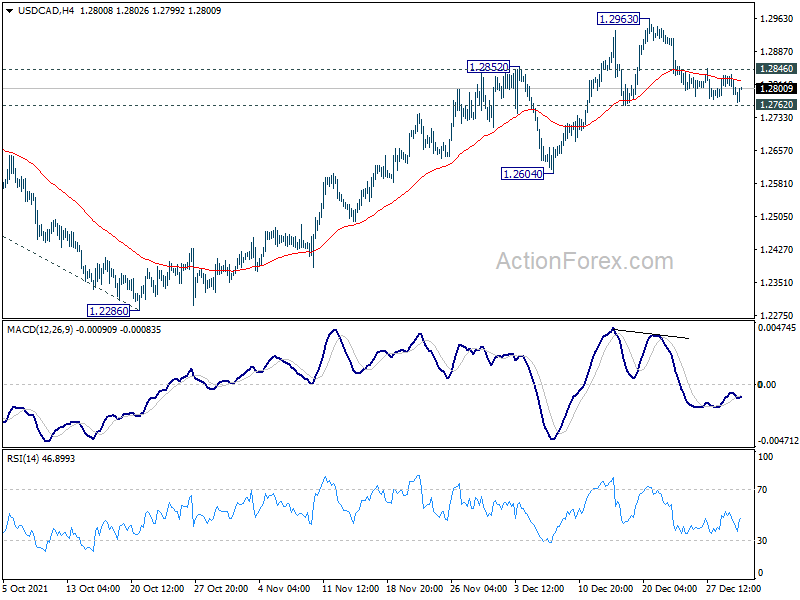
Outlook in USD/CAD is unchanged and intraday bias remains neutral for the moment. As long as 1.2762 support holds, further rally is expected. On the upside, above 1.2846 minor resistance will bring retest of 1.2963 resistance first. Break there will resume the rise from 1.2005 to 1.3022 key medium term fibonacci level. Sustained break of 1.3022 will carry larger bullish implications. Next target will be 100% projection of 1.2005 to 1.2947 from 1.2286 at 1.3228. However, break of 1.2762 will turn bias back to the downside for 1.2604 support instead.
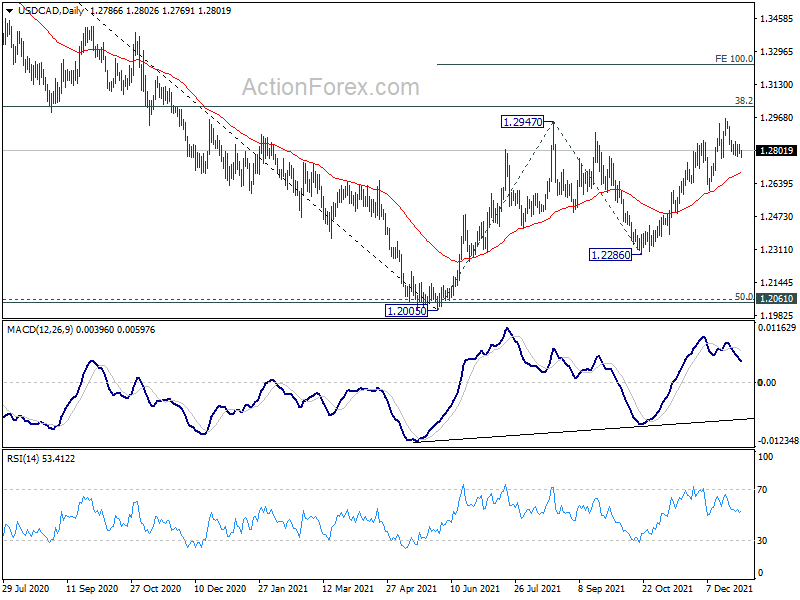
In the bigger picture, focus will be on 38.2% retracement of 1.4667 (2020 high) to 1.2005 (2021 low) at 1.3022. Sustained break there should confirm that the down trend from 1.4667 has completed after defending 1.2061 long term cluster support. Further rise would then be seen towards 61.8% retracement at 1.3650. On the downside, however, break of 1.2286 will turn focus back to 1.2005 low again.
AUD/USD Daily Report
Daily Pivots: (S1) 0.7217; (P) 0.7245; (R1) 0.7276; More...
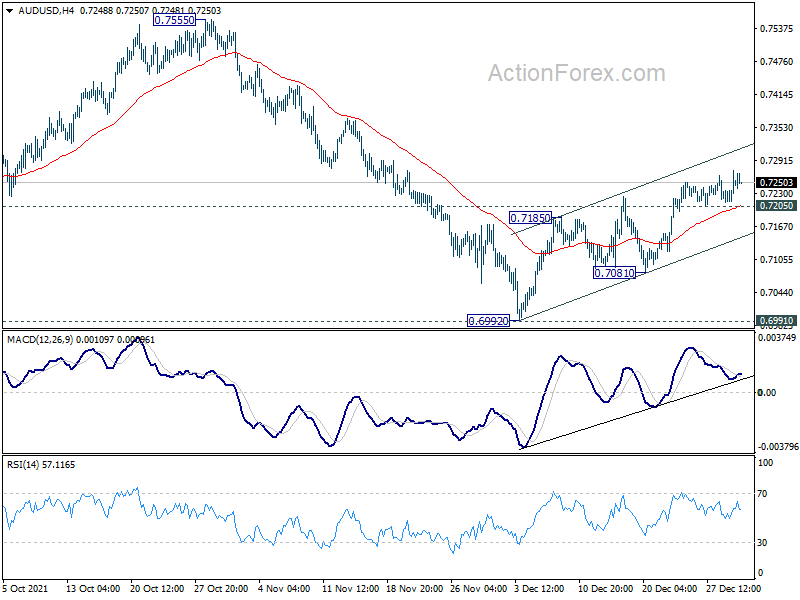
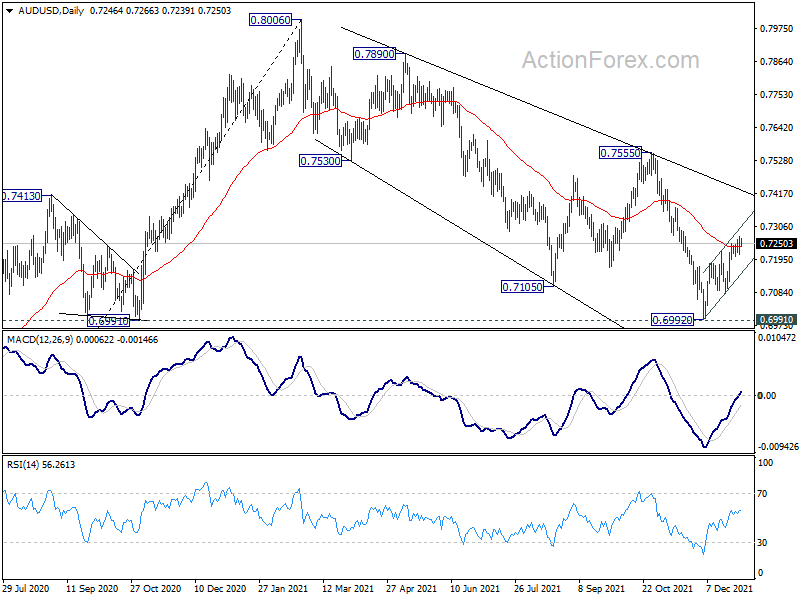
Intraday bias in AUD/USD remains mildly on the upside with 0.7205 minor support intact. Sustained trading above 55 day EMA (now at 0.7236) will argue that fall from 0.8006 has completed at 0.6992, after defending 0.6991 support. Further rally would be seen to 0.7555 resistance for confirmation. On the downside, below 0.7205 minor support will mix up the near term outlook and turn intraday bias neutral first.
In the bigger picture, strong rebound from 0.6991 key structural support will retain medium term bullishness. That is, whole up trend from 0.5506 is still in progress. Firm break of 0.7555 resistance will target 0.8006 high and above. However, sustained break of 0.6991 will argue that the whole up trend from 0.5506 might be finished at 0.8006, after rejection by 0.8135 long term resistance. Deeper decline would then be seen back to 61.8% retracement of 0.5506 to 0.8006 at 0.6461.
EUR/USD Daily Outlook
Daily Pivots: (S1) 1.1292; (P) 1.1330; (R1) 1.1387; More...
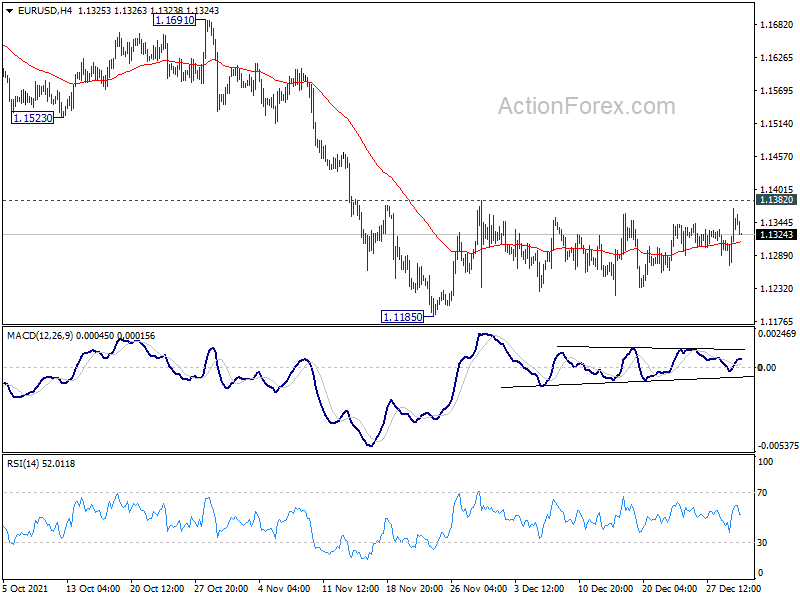
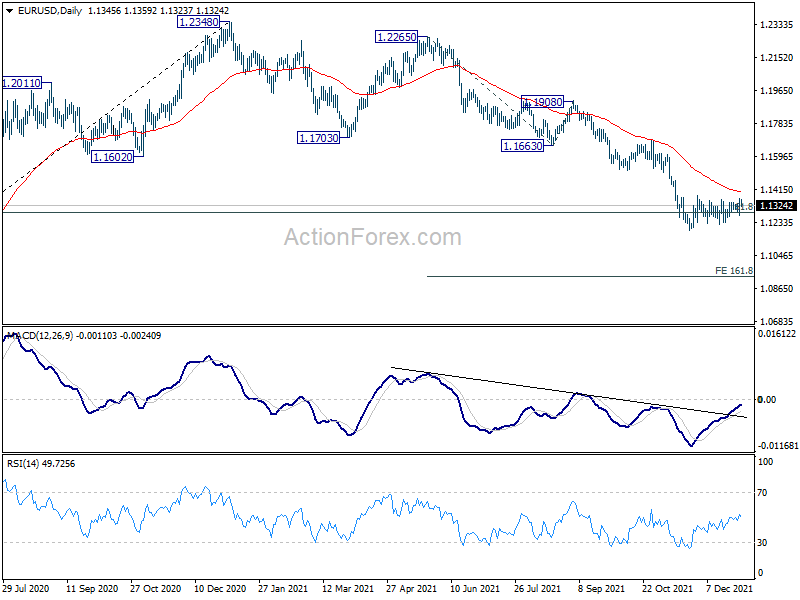
EUR/USD is still bounded in range of 1.1185/1382 and intraday bias remains neutral. On the upside, firm break of 1.1382 resistance will resume the rebound from 1.1186. Sustained trading above 55 day EMA (now at 1.1399) will bring stronger rise back to 1.1663 support turned resistance. On the downside, break of 1.1185 will resume larger decline from 1.2348. Next target is 161.8% projection of 1.2265 to 1.1663 from 1.1908 at 1.0934.
In the bigger picture, there are various ways of interpreting the fall from 1.2348 (2021 high). It could be a correction to rise from 1.0635 (2020 low), the fourth leg of a sideway pattern from 1.0339 (2017 low), or resuming long term down trend. In any case, outlook will now stay bearish as long as 1.1703 support turned resistance holds. Sustained break of 61.8% retracement of 1.0635 to 1.2348 at 1.1289 would pave the way back to 1.0635.
GBP/USD Daily Outlook
Daily Pivots: (S1) 1.3431; (P) 1.3465; (R1) 1.3521; More...
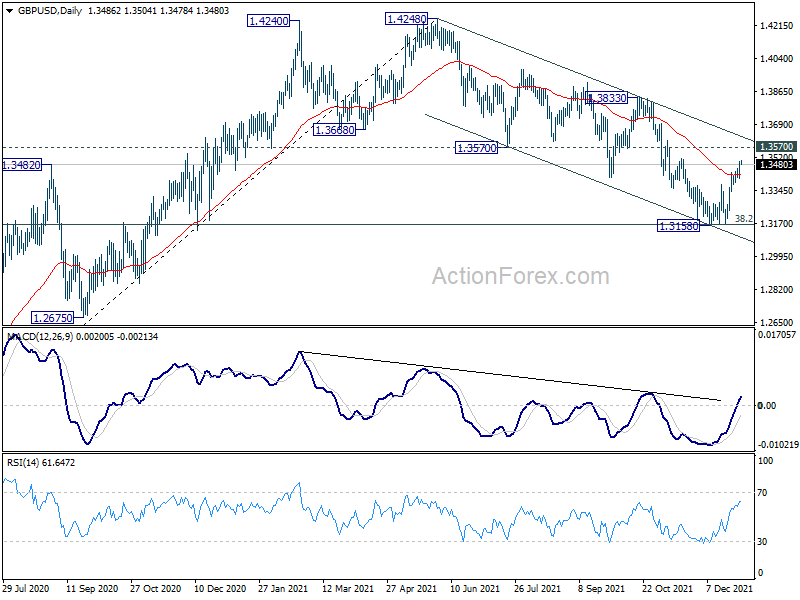
Intraday bias in GBP/USD remains on the upside for the moment. Current development suggests that corrective fall from 1.4248 has completed with three waves down to 1.3158, after hitting 1.3164 medium term fibonacci level. Further rise should be seen to 1.3570 support turned resistance. Sustained break there will further affirm this bullish case and target 1.3833 resistance next. On the downside, break of 1.3375 minor support will turn intraday bias neutral first.
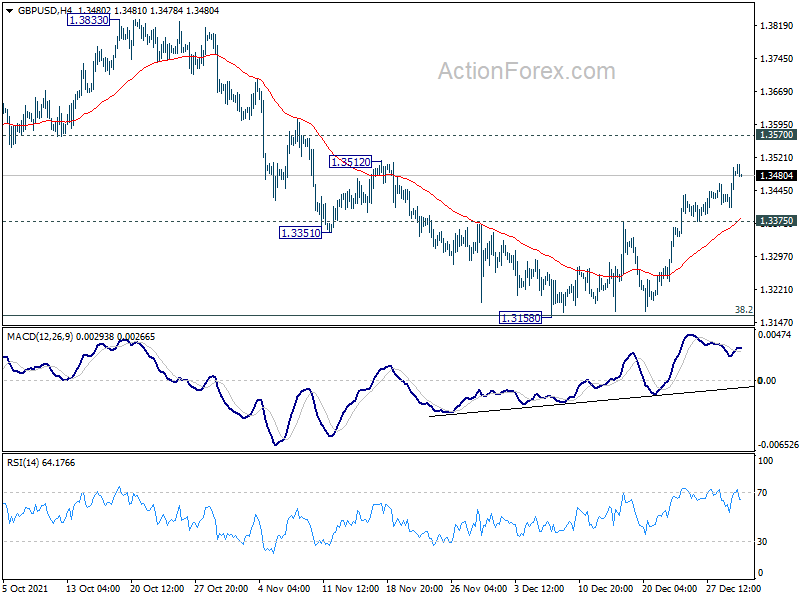
In the bigger picture, focus remains on 38.2% retracement of 1.1409 to 1.4248 at 1.3164. Sustained break there will argue that whole rise from 1.1409 has completed at 1.4248, after rejection by 1.4376 long term resistance. That will revive some medium term bearishness and and target 61.8% retracement at 1.2493. However, strong rebound from current level will revive argue that up trend from 1.1409 is still in progress, and probably ready to resume.
USD/CHF Daily Outlook
Daily Pivots: (S1) 0.9116; (P) 0.9159; (R1) 0.9191; More....
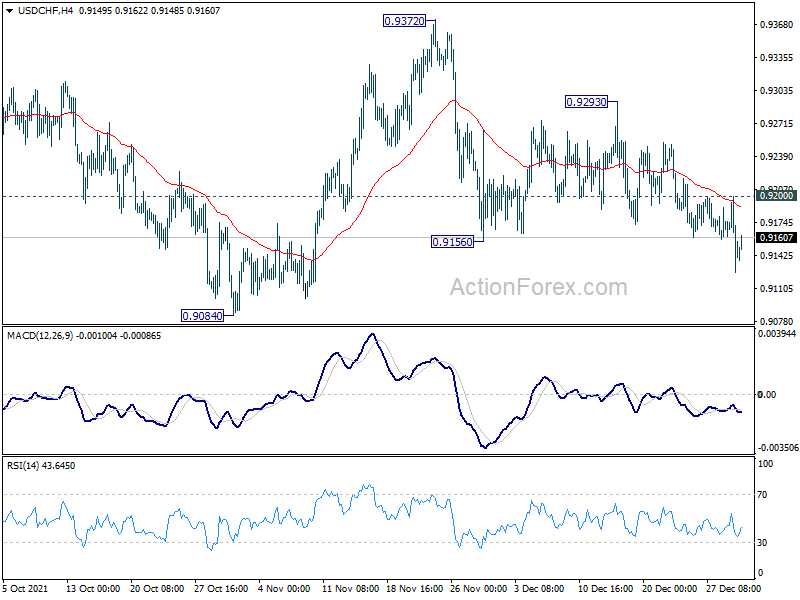
With break of 0.9156 support, intraday bias in USD/CHF is back on the downside for 0.9084 support. Firm break there should confirm that choppy rise from 0.8925 has completed, and suggests that fall from 0.9471 is resuming. Deeper decline would be seen through 0.8925. Nevertheless, break of 0.9200 minor resistance will mix up the outlook again and turn intraday bias neutral first.
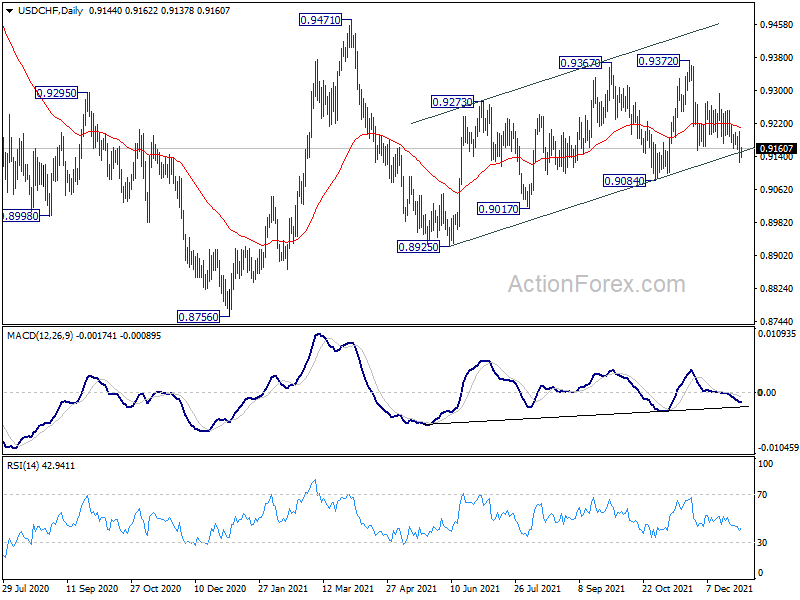
In the bigger picture, the corrective structure of the rebound from 0.8925 argues that fall from 0.9471 is not complete yet. It could either be the second leg of pattern from 0.8756 (2021 low), or resuming larger down trend from 1.0237 (2018 high). We'd pay attention to the downside momentum and assess the odds later. But for now, medium term outlook will be neutral at best as long as 0.9471 resistance holds.
USD/JPY Daily Outlook
Daily Pivots: (S1) 114.70; (P) 114.83; (R1) 114.94; More...
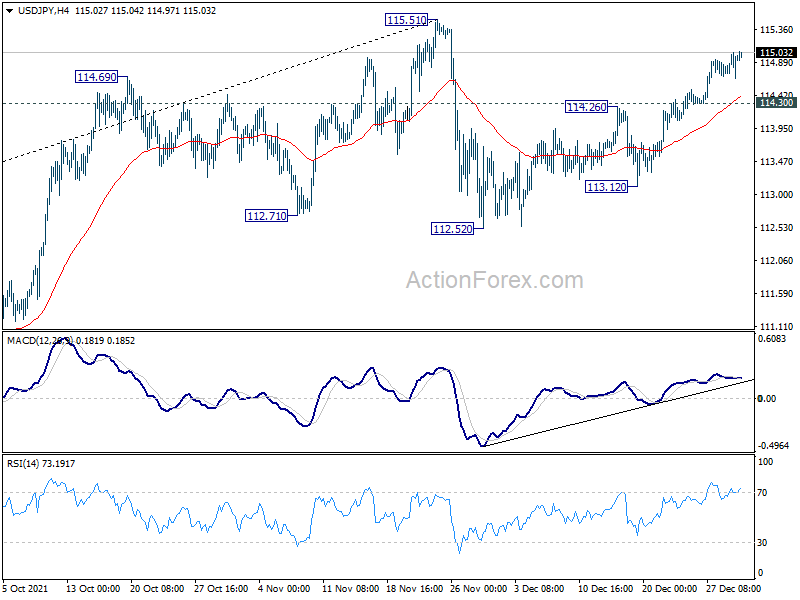
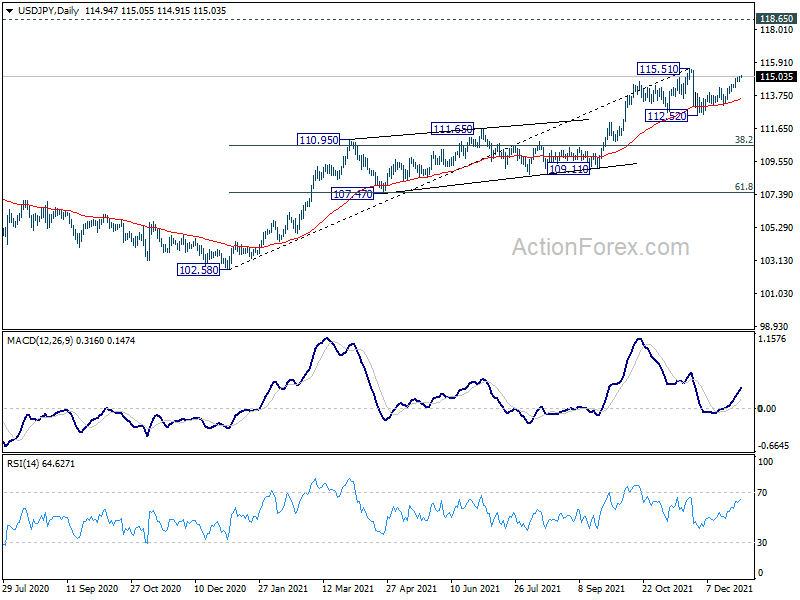
Intraday bias in USD/JPY remains on the upside at this point. Rise from 112.52 should target a test on 115.51 high first. Firm break there will resume larger up trend to 118.65 long term resistance next. On the downside, however, break of 114.30 will turn bias to the downside, and extend the corrective pattern from 115.51 with another falling leg back to 112.52 support.
In the bigger picture, no change in the view that rise from 102.58 is the third leg of the up trend from 101.18 (2020 low). Such rally should target a test on 118.65 (2016 high) on resumption. However, firm break of 109.11 structural support will argue that the trend might have reversed and bring deeper fall to 107.47 support and possibly below.
Yen Selloff Continues as DOW Hit Record, Yields Jumped
Selloff in Yen continued as DOW was pushed to new record by risk-on sentiment, while US benchmark treasury yield also jumped. Dollar is also under some pressure together with Canadian and Euro. On the other hand, Sterling continues to be the outperformer, leading Aussie in the race. With easing fear on Omicron, the markets look set to end the year on a high note.
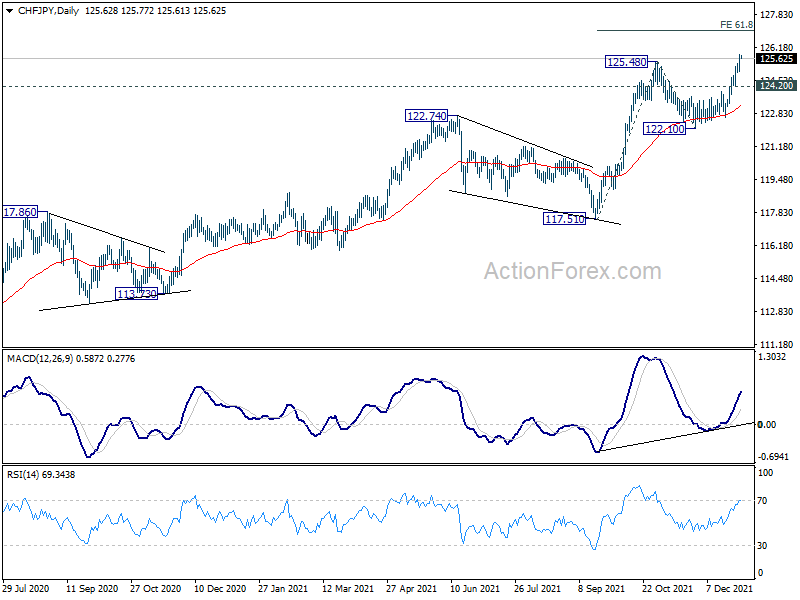
Technically, CHF/JPY's up trend resumed by taking out 125.48 resistance. Near term outlook will now stay bullish as long as 124.20 minor support holds. Next target is 61.8% projection of 117.51 to 125.48 from 122.10 at 127.02. A question now is whether, or when, would USD/JPY follows to break through 115.51 high.
In Asia, at the time of writing, Nikkei is down -0.28%. Hong Kong HSI is up 0.09%. China Shanghai SSE is up 0.82%. Singapore Strait Times is down -0.31%. Japan 10-year JGB yield is up 0.0152 at 0.075. Overnight, DOW rose 0.25%. S&P 500 rose 0.14%. NASDAQ dropped -0.10%. 10-year yield rose 0.062 to 1.543.
DOW notched new record, 37129 projection level next
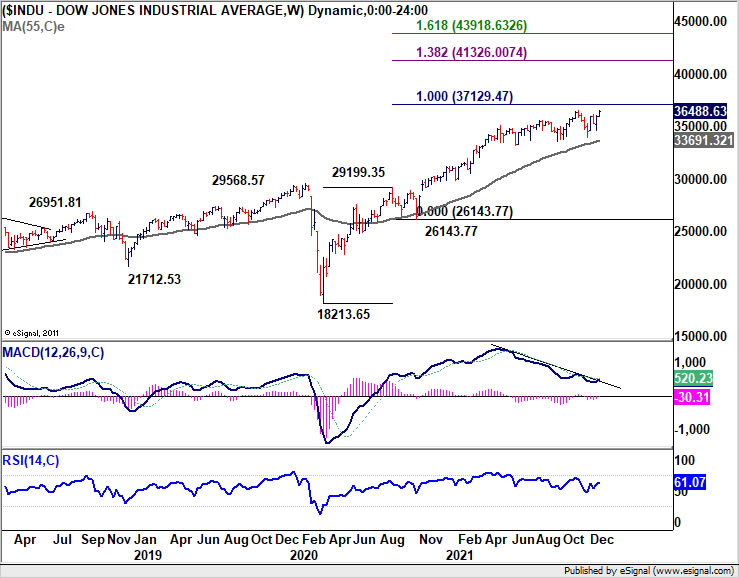
DOW finally caught up the S&P 500 and notched a new record close at 36488.63 overnight. Market sentiments remained positive despite record surge in daily Omicron cases. Investors are relieved by more and more evidence that Omicron is less severe than Delta.
From a medium term point of view, DOW is holding well above 55 week EMA, maintaining a healthy up trend. Weekly MACD also suggest that it might also be picking up momentum again. Nevertheless, a important test lies ahead at 100% projection of 18213.65 to 29199.35 from 26143.77 at 37129.47. Sustained break of 37129.47 could easily trigger more upside acceleration in Q1 towards 138.2% projection at 41326.00.
10-year yield setting stage for up trend resumption?
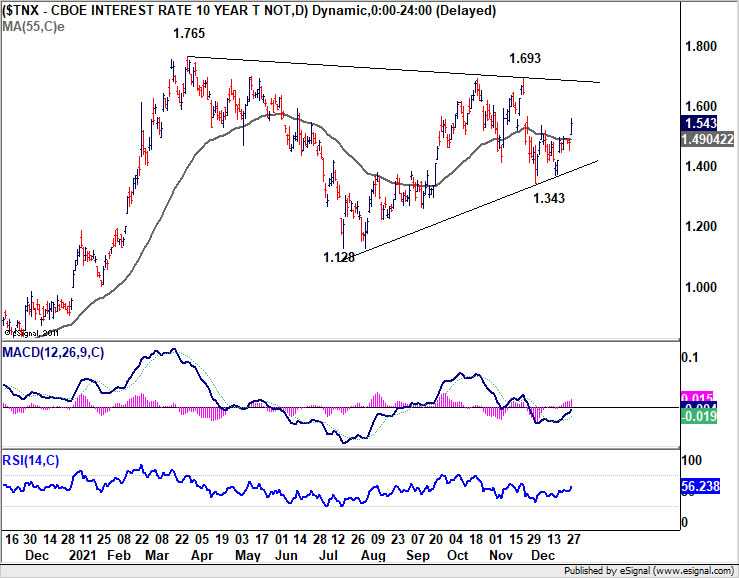
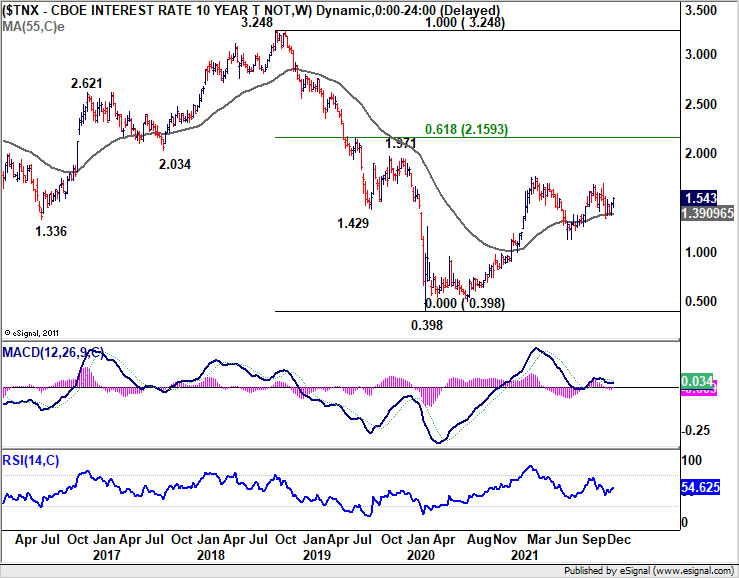
US 10-year yield jumped notably and closed up 0.062 at 1.543. With a strong break above 55 day EMA, it's starting to suggest that consolidation pattern from 1.765 has completed with three waves to 1.343 already. TNX has also drew solid support from 55 week EMA again, keeping medium term bullishness well in place.
The focus could quickly be on 1.693 resistance when we come back from new year holiday. Firm break there should push TNX through 1.765 resistance to resume the up trend from 0.398. If this happens, we could easily see 10-year yield back at 2% level and above.
Looking ahead
Swiss KOF economic barometer is a feature in European session. US will release jobless claims and Chicago PMI.
USD/JPY Daily Outlook
Daily Pivots: (S1) 114.70; (P) 114.83; (R1) 114.94; More...
Intraday bias in USD/JPY remains on the upside at this point. Rise from 112.52 should target a test on 115.51 high first. Firm break there will resume larger up trend to 118.65 long term resistance next. On the downside, however, break of 114.30 will turn bias to the downside, and extend the corrective pattern from 115.51 with another falling leg back to 112.52 support.
In the bigger picture, no change in the view that rise from 102.58 is the third leg of the up trend from 101.18 (2020 low). Such rally should target a test on 118.65 (2016 high) on resumption. However, firm break of 109.11 structural support will argue that the trend might have reversed and bring deeper fall to 107.47 support and possibly below.
Economic Indicators Update
| GMT | Ccy | Events | Actual | Forecast | Previous | Revised |
|---|---|---|---|---|---|---|
| 08:00 | CHF | KOF Economic Barometer Dec | 106.4 | 108.5 | ||
| 13:30 | USD | Initial Jobless Claims (Dec 24) | 205K | 205K | ||
| 14:45 | USD | Chicago PMI Dec | 61.5 | 61.8 | ||
| 15:30 | USD | Natural Gas Storage | -55B |
10-year yield setting stage for up trend resumption?
US 10-year yield jumped notably and closed up 0.062 at 1.543. With a strong break above 55 day EMA, it's starting to suggest that consolidation pattern from 1.765 has completed with three waves to 1.343 already. TNX has also drew solid support from 55 week EMA again, keeping medium term bullishness well in place.
The focus could quickly be on 1.693 resistance when we come back from new year holiday. Firm break there should push TNX through 1.765 resistance to resume the up trend from 0.398. If this happens, we could easily see 10-year yield back at 2% level and above.
DOW notched new record, 37129 projection level next
DOW finally caught up the S&P 500 and notched a new record close at 36488.63 overnight. Market sentiments remained positive despite record surge in daily Omicron cases. Investors are relieved by more and more evidence that Omicron is less severe than Delta.
From a medium term point of view, DOW is holding well above 55 week EMA, maintaining a healthy up trend. Weekly MACD also suggest that it might also be picking up momentum again. Nevertheless, a important test lies ahead at 100% projection of 18213.65 to 29199.35 from 26143.77 at 37129.47. Sustained break of 37129.47 could easily trigger more upside acceleration in Q1 towards 138.2% projection at 41326.00.
Elliott Wave View: AUD/USD Approaching Inflection Area
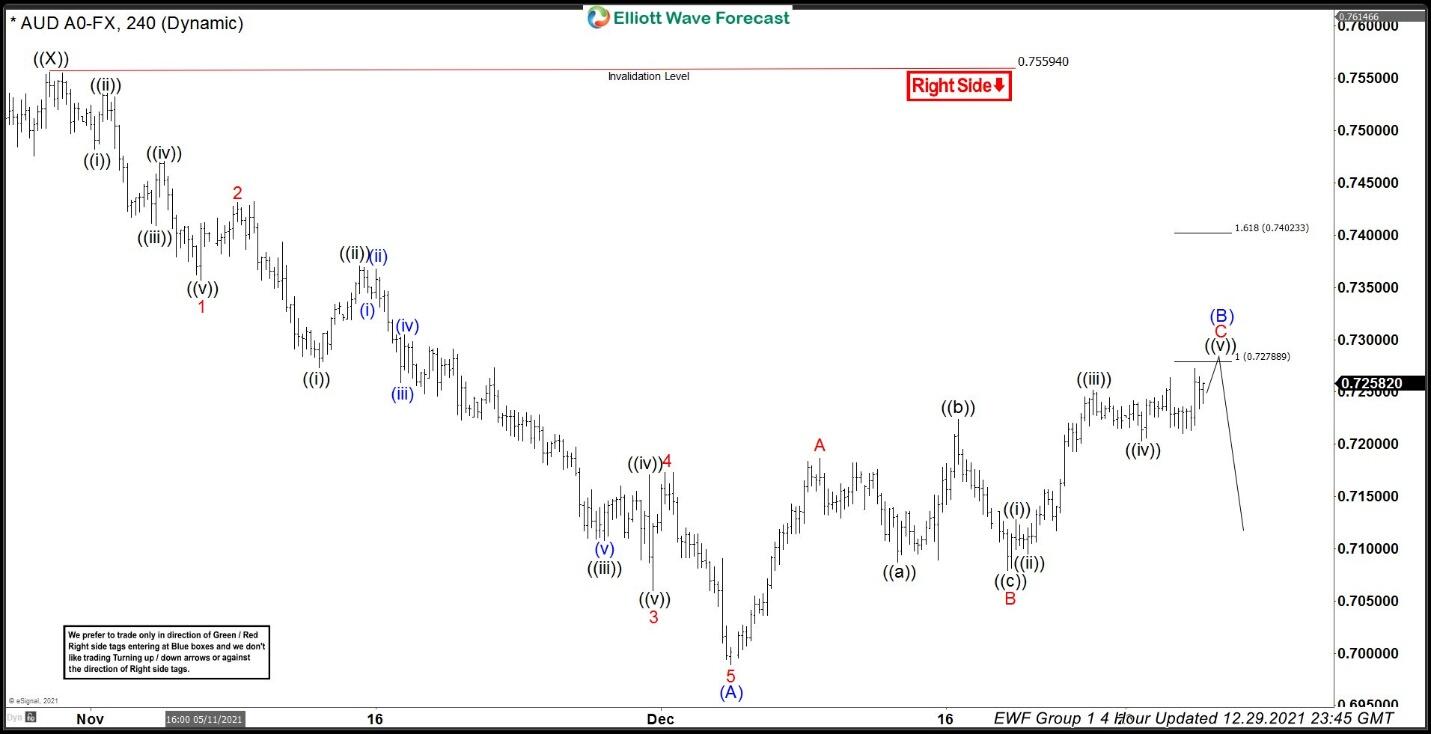
Elliott wave view in AUDUSD suggests the decline from February 25, 2021 high is unfolding as a double three Elliott Wave structure. Down from February 25 high, wave ((W)) ended at 0.7106 and rally in wave ((X)) ended at 0.756. Wave ((Y)) lower is currently in progress as a zigzag structure. Wave (A) of the zigzag ended at 0.699 as a 5 waves impulse. Down from wave ((X)), wave 1 ended at 0.7357 and rally in wave 2 ended at 0.743. Pair then extends lower in wave 3 towards 0.706, and wave 4 rally ended at 0.7173. Final leg lower wave 5 ended at 0.699 which completed wave (A).
Wave (B) rally is now ongoing to correct the decline from October 29, 2021 wave ((X)) high. Internal of wave (B) is unfolding as a zigzag structure. Up from wave (A), wave A ended at 0.7186 and dips in wave B ended at 0.7079. Expect wave C to extend a bit more to the upside towards 100% – 161.8% Fibonacci extension of wave A at 0.727 – 0.74. Afterwards, pair could resume lower from this area, or at least pullback in 3 waves. As far as pivot at 0.756 high remains intact, expect wave (B) rally to fail in 3, 7, or 11 swing for more downside.
AUDUSD 4 Hour Elliott Wave Chart