Sample Category Title
Wall Street Hits Another Record But Trading Remains Slow, Dollar Oscillates
- Stocks mixed after more US all-time highs as trading volumes thin out further
- Investor optimism put to the test amid surging Covid cases globally
- Dollar rebounds from lows as Treasury yields spike
 Surging virus cases put investors on edge
Markets stuck to the mildly positive tone on Thursday as investors constantly reassessed the risks from the latest wave of Covid-19 cases that is gripping most nations around the world. The shrinking liquidity during this slow holiday week has brought about small bouts of volatility, adding some much needed excitement to the festive lull.
The Omicron variant is sweeping across the globe at an astronomical rate, pushing daily infections to record levels in several countries, including the US, UK, Australia and France. However, all the studies continue to indicate that Omicron is less severe than other variants, and with vaccination rates now at a very high level in all the major economies, investors are betting that tough curbs won’t be necessary to combat the Omicron outbreak.
But one country that is not giving up on its zero-Covid policy is China, which has resorted to draconian measures to stamp out the virus in Xi’an. The city is one of China’s many manufacturing hubs and memory chip manufacturer Micron Technology has warned that the lockdown in Xi’an is likely to affect production.
The chip shortages have already caused widespread disruption in global supply chains as well as push up the price of automobiles. However, there was also some good news as South Korean industrial output bounced back strongly in November, suggesting that the chip crisis is easing.
There are also hopes that more policy easing is on the way in China after the government signalled it will guide borrowing costs lower through increased bond issuance in 2022.
Another quiet day looms as end of year approaches
Yet again, traders seem to be leaning towards the optimistic side of things and the worrying trend in virus numbers has surprisingly not sparked any undesirable knee-jerk reactions despite the low volumes. Most big players have likely already closed out their positions for the year so trading looks set to remain muted until the New Year.
Stocks in China ended the session higher, but Japan’s Nikkei 225 was unable to bolster its year-to-date gains on its last trading day of 2021, slipping by 0.4%. European shares opened mixed and US futures stood in positive territory at the time of writing.
Wall Street resumed its Santa rally yesterday, with both the S&P 500 and Dow Jones closing at new all-time highs. However, the gains were modest and the upbeat sentiment wasn’t shared in the tech sector, as small-cap stocks pulled the Nasdaq Composite lower. Though, the Nasdaq 100 still managed to eke out small gains.
A spike in Treasury yields pressured interest-sensitive stocks on Wednesday after a US Treasury auction for seven-year notes was met with poor demand. Although the weak auction was mainly down to many investors being away during the holiday period, there were still some ripples across the yield curve, most notably in the 10-year yield, which subsequently jumped to 1.56%.
Dollar goes on an end-of-year offensive
Bond markets were quieter on Thursday, though, and the higher Treasury yields didn’t do much for the dollar overnight, with the US currency only now catching a bid.
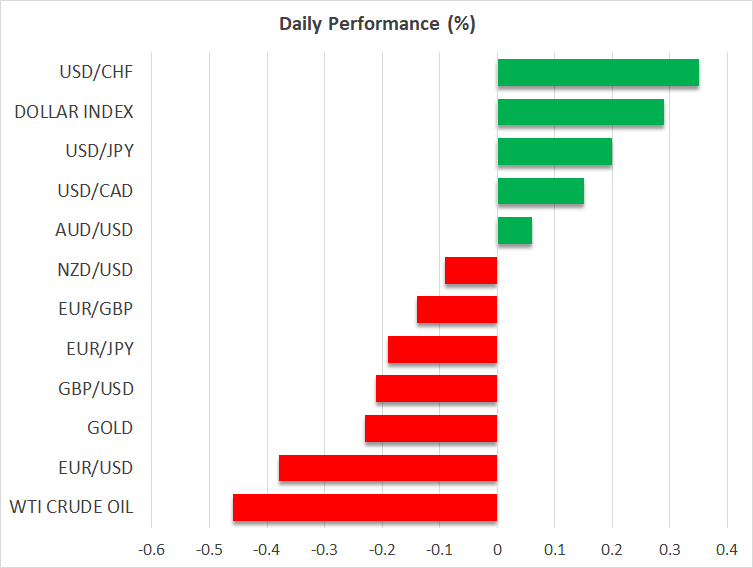
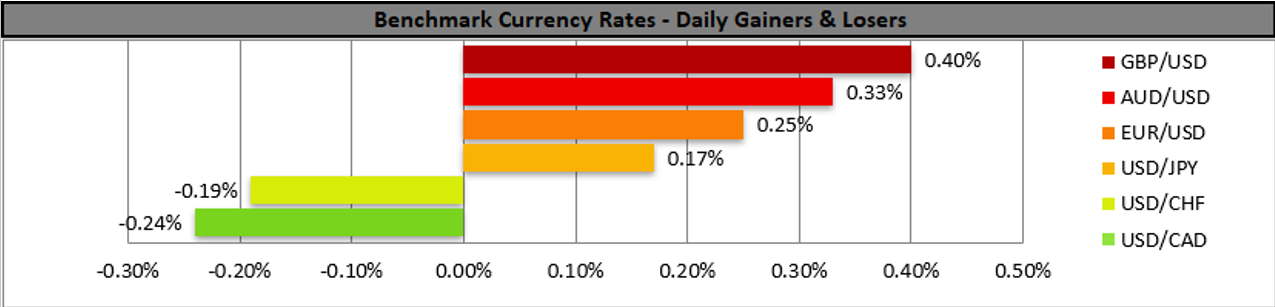
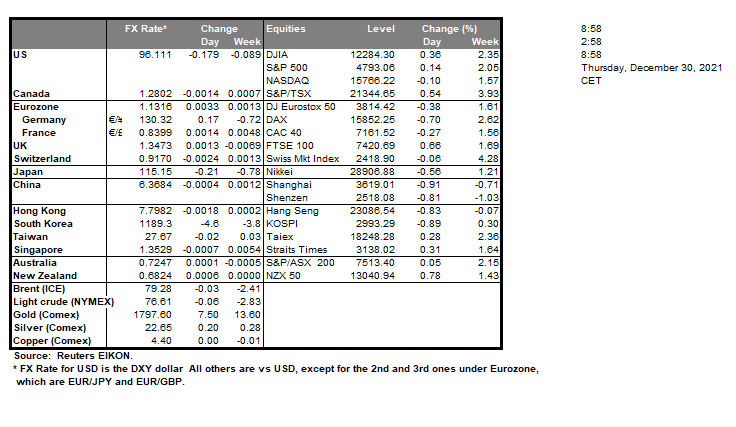
The greenback has gone on the offensive today after yesterday's sudden dip and is up about 0.3% against a basket of currencies. The yen continues to crumble against its US rival, breaching the 115 level and on track the finish the year down by more than 11%. Sterling, meanwhile, has reversed lower after failing to break above $1.35 earlier in the session.
The euro is stuck in its familiar sideways range and headed for losses of more than 7% in 2021. From the commodity pairs, the Australian dollar stands out as having put up a stronger performance this week compared to its kiwi and loonie peers, but year-to-date, it is the worst performer out of the three.
Omicron Fears Continue Receding
Strong US retail sales provides upbeat market move
Omicron fears continued to fade overnight, in North America at least, propelling the S&P 500 and Dow Jones to record closes, lifting oil prices, and weighing on the US dollar. Even gold managed to recoup most of its intra-day losses as optimistic long positions were once again culled.
The upbeat mood was helped along by better than expected US Retail Sales and larger than expected drops in US crude oil and gasoline inventories, suggesting that despite the current virus wave, the US domestic economy continues to power forward. A dearth of heavy-duty data releases globally this week continues to leave markets driven by sentiment and by sentiment, I mean omicron headlines.
China has also shrugged of tightening virus measures in the city of Xi’an, and a Bloomberg report indicating that Evergrande Property has once again missed two offshore bond payments on Tuesday, totalling around USD 220 million. A Ministry of Finance official said that China would guide interest rates lower for 2022 government bond issuance, which despite sounding a little bit illegal potentially in other countries, is a reason for cheer in China stocks, which are performing well today. The controversial IPO of SenseTime in Hong Kong today, up 25.0%, is also lifting the animal spirits of local investors.
Today’s only significant data release in Asia, South Korean Industrial Production, rose to a 17-month high of 5.10% MoM. However, it was overshadowed by a virus-induced slump of 1.90% MoM by Retail Sales in November, with the Kospi gently lower today.
Tonight’s US Initial Jobless Claims will be of passing interest, a fall below 200,000 for the weekly number likely reinforcing the bullish sentiment dominating markets. Far more important will be China’s official Manufacturing and Non-Manufacturing PMIs for December released tomorrow morning. We should get a very binary outcome, up or down, on a decent deviation from the forecast 50.50 and 52.5 respectively. Otherwise, I expect the modestly bullish risk appetite washing through asset classes to continue as holiday season markets continue.
The US Indices Continue To Break Price Records Despite Year-End Economic Slowdown
Yesterday, major US stock indices were traded without a single trend. The S&P 500 (US500) gained 0.1%, the Dow Jones Industrial Average (US30) added 0.3%, and the Nasdaq Technology Index (US100) remained flat. Meanwhile, the S&P 500 (US500) and Dow Jones (US30) indices closed at record highs on Wednesday.
Biogen shares jumped more than 9% in a day after the Korea Economic Daily reported that the company was in talks about a possible sale to electronics giant Samsung.
Medallion Financial Corp. shares plunged 50% to a 13-month low. The Securities and Exchange Commission (SEC) charged the company and its chief operating officer Andrew Murstein with engaging in fraudulent schemes to boost Medallion's stock price.
The general director of the World Health Organization, Tedros Adhanom Gebreyesus, urged nations to vaccinate 70% of the global population against COVID-19 by July 1, 2022.
European stock indexes were mostly down yesterday. Germany's DAX (DE30) decreased by 0.7%, Spain's IBEX 35 (ES35) decreased by 0.2%, France's CAC 40 (FR40) lost 0.3%, while the British FTSE 100 (UK100) increased by 0.66%. The growth in many European countries negatively affects traders' moods. Also, many investors are fixing their positions on the eve of the New Year. The necessary wearing of masks on the streets will be introduced in Paris. Wearing masks on the streets of Paris will become compulsory from December 31 because of a sharp increase in the number of infections of the coronavirus, the prefecture of the capital's police said on Wednesday.
A study by Die Zeit newspaper shows that Germany is likely to fall short of its carbon dioxide reduction goals in the next two years.
Shares of Germany's Deutsche Bank fell by 1.4% yesterday. On Wednesday, it became known that the German Federal Financial Supervision Authority (BaFin) fined the bank €8.66 million for insufficient control of the system of providing data to calculate the interbank interest rate EURIBOR (Euro Interbank Offered Rate).
Yesterday, Asian stock markets closed in the red zone, except for Australia. Japanese index Nikkei 225 (JP225) decreased by 0.56%, Hong Kong's Hang Seng Index (HK50) added 0.83%, and Australia's ASX 200 (AU200) added +1.21%.
The US oil inventories dropped nearly 3.6 million barrels. In the background of such data, given the reduction of concerns about the impact of Omicron on demand for petroleum products, the energy market continues to rise. The US oil and gas executives are forecasting increased production and drilling activity next year as oil prices rise.
Main market quotes:
- S&P 500 (F) (US500) 4,793.06 +6.71 (+0.14%)
- Dow Jones (US30) 36,488.63 +90.42 (+0.25%)
- DAX (DE40) 15,852.25 −111.45 (−0.70%)
- FTSE 100 (UK100) 7,420.69 +48.59 (+0.66%)
- USD Index 95.91 −0.29 (−0.31%)
Important events for today:
- US Initial Jobless Claims (w/w) at 15:30 (GMT+2);
- US Chicago PMI (m/m) at 16:45 (GMT+2);
- US Natural Gas Storage (w/w) at 17:30 (GMT+2).
The Analytical Overview Of The Main Currency Pairs
The EUR/USD currency pair
Technical indicators of the currency pair:
Prev Open: 1.1308
Prev Close: 1.1343
% chg. over the last day: +0.31%
Investors have now returned to riskier assets amid declining concerns over the Omicron strain, which has led to a small sell-off in the dollar index and a rise in the European currency (inverse correlation). The decrease in the growth rate of the money supply in the Eurozone is also a positive factor for the strengthening of the Euro.
Trading recommendations
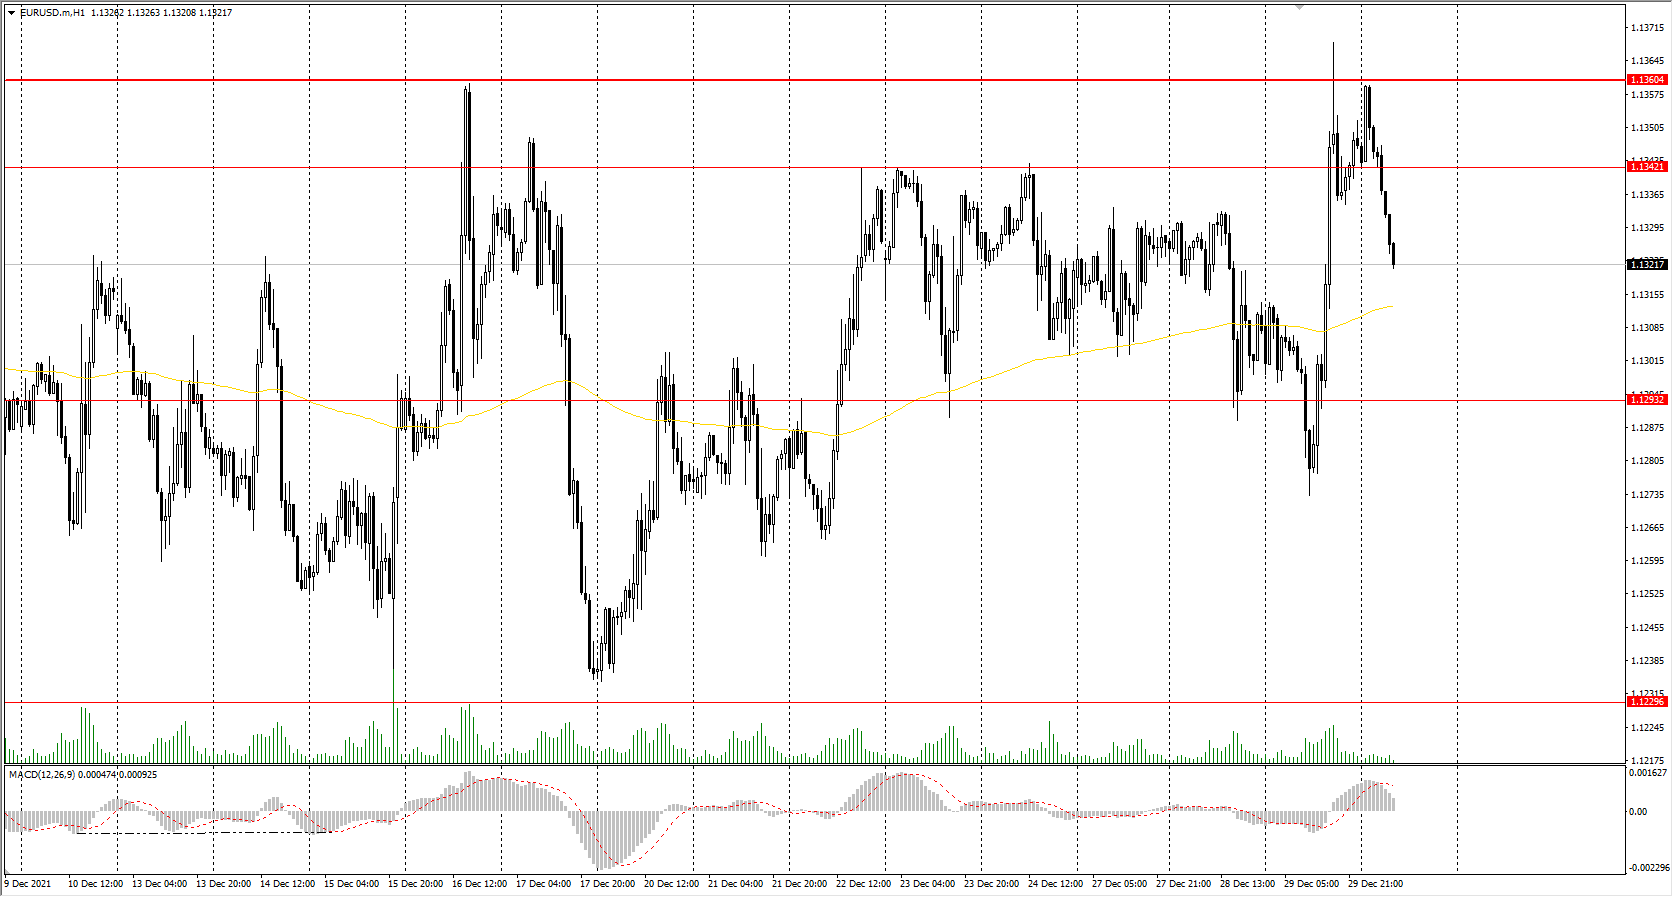
Support levels: 1.1293, 1.1230, 1.1168
Resistance levels: 1.1342, 1.1360, 1.1436, 1.1535, 1.1613, 1.1667, 1.1717
From a technical point of view, the EUR/USD on the hour timeframe is still bearish. Yesterday, the buyers tried to break out through the priority change level, but the sellers protected their positions. The price is back in the corridor again, but the buyers' pressure remains high. The MACD indicator is positive. It is better to consider sell deals from the 1.1342 resistance level. Buy trades can be considered on the lower timeframes from the support level of 1.1293, but only with additional confirmation.
Alternative scenario: if the price breaks out through the 1.1360 resistance level and fixes above, the mid-term uptrend will likely resume.
News feed for 2021.12.30:
- US Initial Jobless Claims (w/w) at 15:30 (GMT+2);
- US Chicago PMI (m/m) at 16:45 (GMT+2).
The GBP/USD currency pair
Technical indicators of the currency pair:
Prev Open: 1.3429
Prev Close: 1.3486
% chg. over the last day: +0.42%
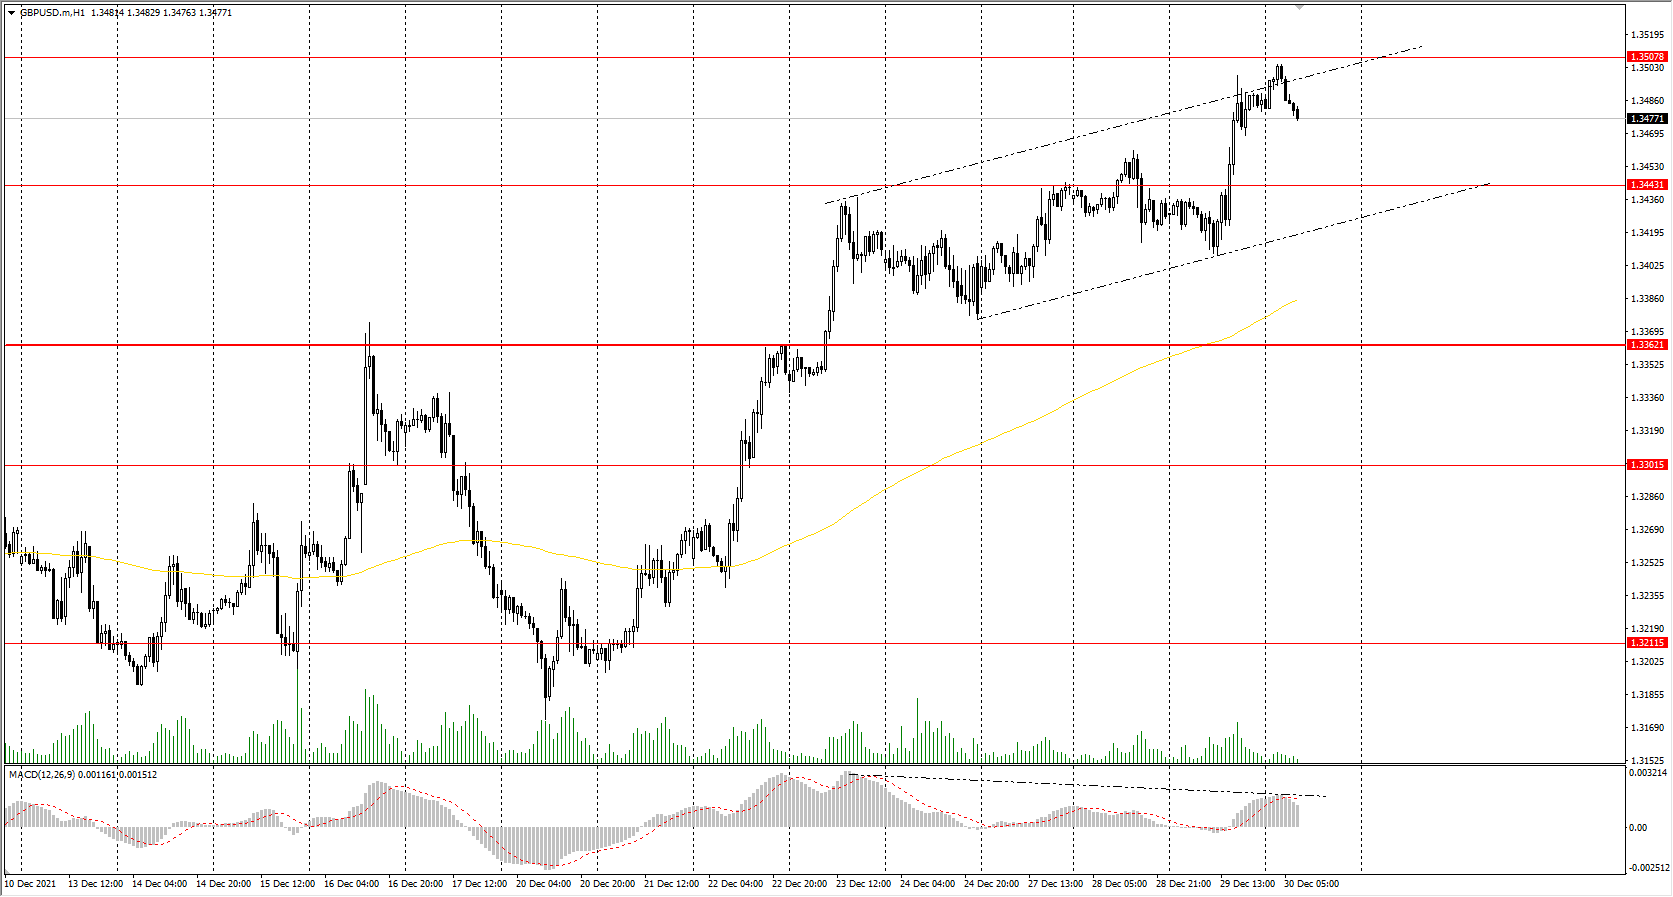
Great Britain reports a record 183,037 cases of COVID in a 24-hour period. But despite the increase in cases, hospitalizations are not increasing as rapidly; the health care system is coping. The UK has no plans to impose additional restrictions ahead of the holidays, and the Central Bank of England policy is now aimed at strengthening the pound sterling.
Trading recommendations
Support levels: 1.3443, 1.3362, 1.3301, 1.3277, 1.3220
Resistance levels: 1.3507, 1.3575, 1.3685
On the hourly timeframe, the GBP/USD trend is still bullish. But the MACD indicator is showing divergence on several timeframes; a technical correction may occur soon. Under such market conditions, traders should consider buy positions from the 1.3443 support level but only with additional confirmation in the form of a buyers' initiative. Sell trades can be considered from the resistance level of 1.3507, but it is also better to wait for the sellers' initiative.
Alternative scenario: if the price breaks down through the 1.3362 support level and consolidates below, the bearish scenario will likely resume.
The USD/JPY currency pair
Technical indicators of the currency pair:
Prev Open: 114.74
Prev Close: 114.96
% chg. over the last day: +0.19%
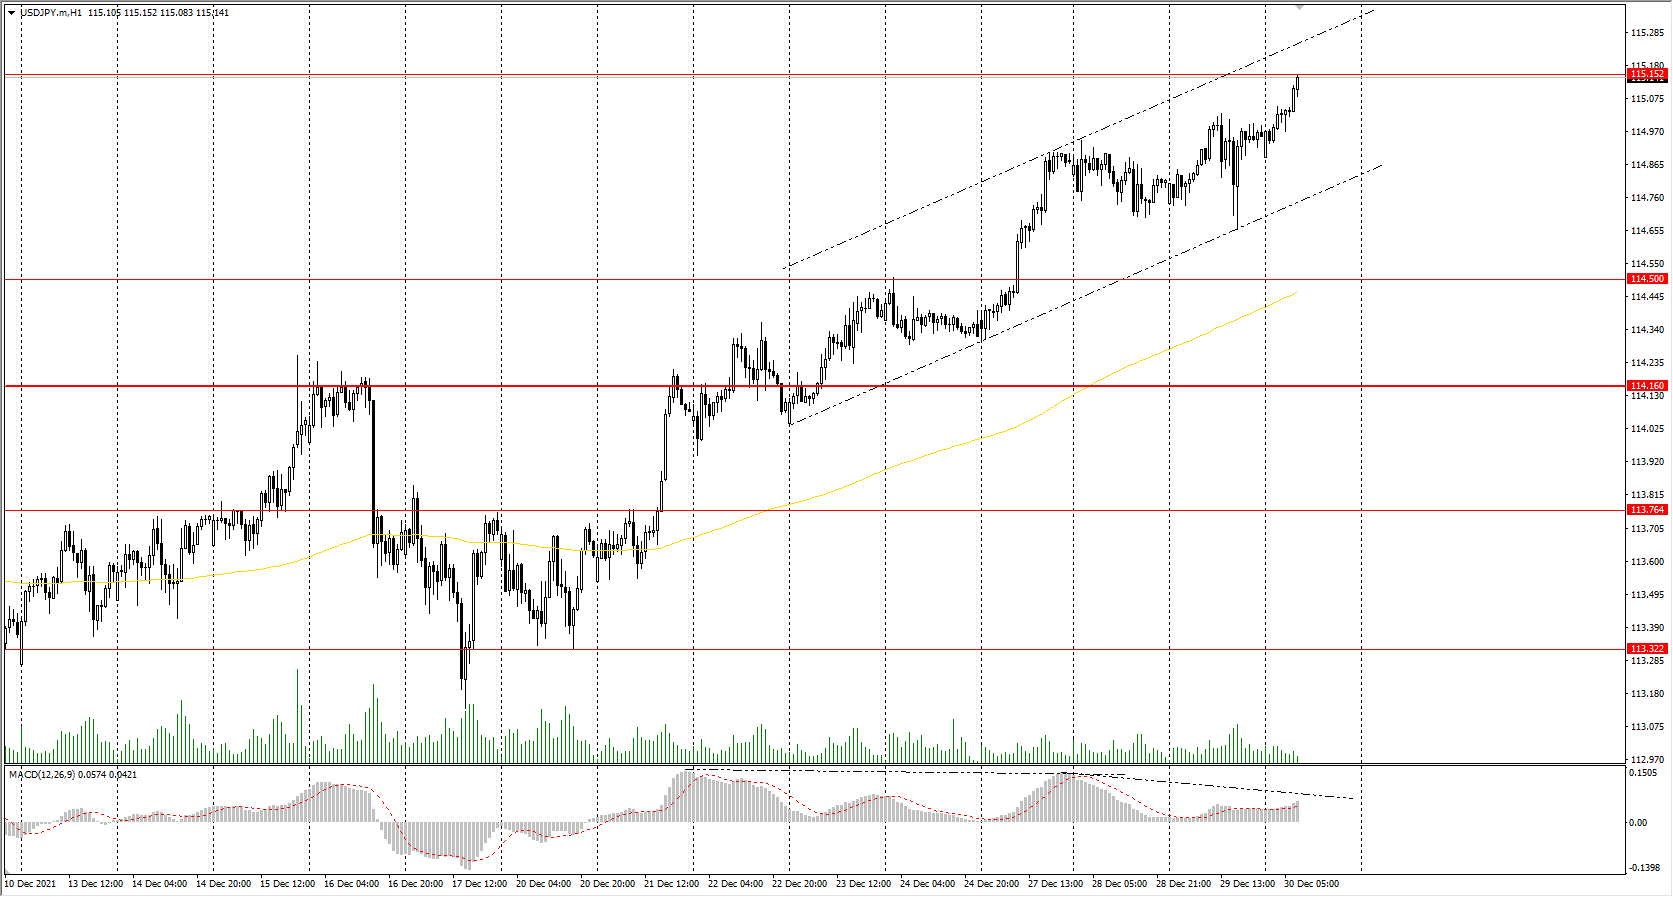
In terms of monetary policy analysis, Japan's central bank is now actively stimulating the economy, while the US Federal Reserve is reducing its stimulus program. This central bank policy will contribute to a decline in the yen and a strengthening of the dollar index. Yesterday, USD/JPY reached a one-month high and was close to a four-and-a-half-year high.
Trading recommendations
Support levels: 114.50, 114.16, 113.76, 113.32, 112.62, 112.30
Resistance levels: 115.15, 115.50
The global trend on the USD/JPY currency pair is bullish. The MACD indicator is signaling a divergence at several timeframes, which means that a slight correction should be expected. Buy positions should be considered from the 114.50 support level, but with additional confirmation in the form of a buyers' initiative. For sell positions, it is necessary to analyze the price reaction to the resistance level of 115.15. If there is a sellers' initiative here, it is possible to look for sales on lower timeframes but with short targets.
Alternative scenario: if the price fixes below 114.16, the uptrend will likely be broken.
The USD/CAD currency pair
Technical indicators of the currency pair:
Prev Open: 1.2815
Prev Close: 1.2788
% chg. over the last day: -0.21%
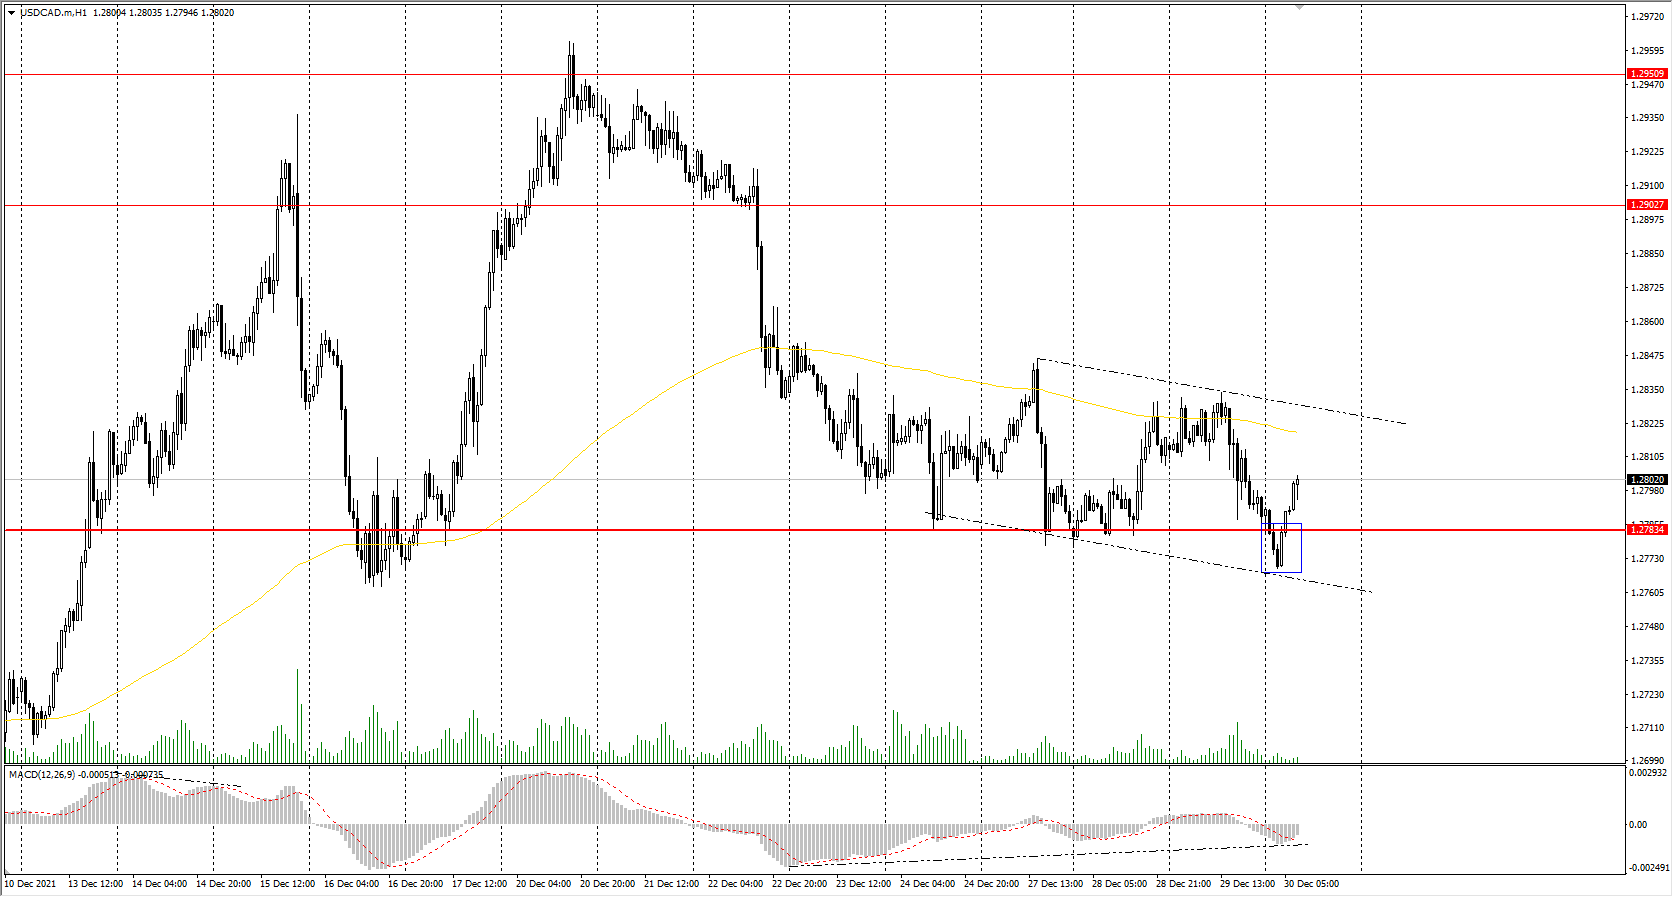
The Canadian dollar is a commodity currency, so it correlates strongly with oil prices and the dollar index. Crude oil inventories showed another sharp decline yesterday. In the medium term, oil prices will rise slightly, while the dollar index will also strengthen. As a result, both the Canadian dollar and the dollar index will have fundamental support, so the USD/CAD currency pair should not expect medium-term trends and trade only on the lower timeframes.
Trading recommendations
Support levels: 1.2783, 1.2721, 1.2677, 1.2638
Resistance levels: 1.2903, 1.2951
From a technical point of view, the USD/CAD currency pair trend is bullish. Buyers again were able to defend the priority change level, the price failed to consolidate below, forming a false breakdown zone. The MACD indicator is signaling a buy divergence. Under such market conditions, it is better to look for buy deals on the lower timeframes with the target of 1.2903. Sell deals should be considered from the resistance level of 1.2903 or after breakdown and fixation below the priority change level.
Alternative scenario: if the price breaks down through the 1.2783 support level and fixes below, the downtrend will likely resume.
USD Seems To Remain Soft
USD remained soft against some of its counterparts yesterday as the Omicron variant of the pandemic still dominates the headlines as it has a firm grip over a number of countries. Nevertheless, the low hospitalisation numbers of the Omicron variant seem to create some optimism in the markets which tended to drive safe haven JPY lower against the USD, while riskier currencies such as the GBP and AUD seemed to gain.
However Aussie traders could also be keeping an eye out for the release of Chinas’ NBS December PMI figures in order to gauge the pace of expansion of economic activity, especially in the manufacturing sector. The release could be of great importance particularly for Australian exporters of raw materials in order to build expectations for future orders to come from their Chinese customers.
Across the world we note that tensions between the US and Russia about Ukraine seem to intensify and could create some flights towards safe havens should the situation get out of hand, yet US President Biden and Russian President Putin are scheduled to talk in an effort to defuse the situation. As for precious metals it should be noted that Gold’s price also remained rather soft failing to take advantage of the weakening USD yesterday possibly also due to the rise of US yields which reduced the attractiveness of the shiny metal and despite its price rising for the month of December is about to end the year lower.
We also must note that US stockmarkets have shown some mixed signals given that on the one hand Dow Jones briefly touched new record highs yesterday while on the other hand Nasdaq was a bit on the retreat. As for financial releases we note from the US the release of the initial jobless claims figure which is expected to rise slightly and thus could be signalling a pause in the tightening of the US employment market. Last but not least we tend to maintain our worries for TRY as the currency seems to have some bearish tendencies and should they intensify, CBTs’ market interventions could prove to be fruitless.
The USD Index edged lower yesterday staying below the 96.15 (R1) line despite an attempt to break it and remain above it. It should be noted that the RSI indicator below our 4-hour chart was below the reading of 50 indicating a bearish sentiment of the market for the Dollar, yet seems to be recovering ground, which could imply that the bears are losing steam. We tend to maintain a bias for a sideways motion of the index, yet the bearish tendencies should not be pass unnoticed. Should the bears actually take control over the index, we may see its price action breaking the 95.60 (S1) support line and aim for the 94.95 (S2) level. Should the bulls be in charge of the index’s direction, we may see it breaking the 96.15 (R1) resistance line and take aim of the 96.65 (R2) resistance level.
AUD/USD rose yesterday breaking above the 0.7230 (S1) support line. The RSI indicator below our 4-hour chart is above the reading of 50 signaling a bullish sentiment for the pair yet the indicator seems to be dropping which could imply that the bulls are present yet may be on the retreat. We tend to maintain a bias for a sideways motion, yet the bullish tendencies of the pair should be taken in to account. Should the buying interest for the pair be renewed we may see AUD/USD breaking the 0.7290 (R1) resistance line and aim for the 0.7365 (R2) level. Should sellers be in charge of AUD/USD’s direction, we may see it breaking the 0.7230 (S1) support line and aim for the 0.7170 (S2) level.
Other highlights for today and early tomorrow
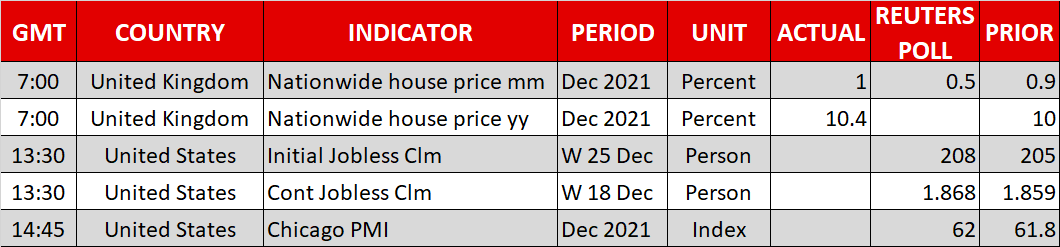
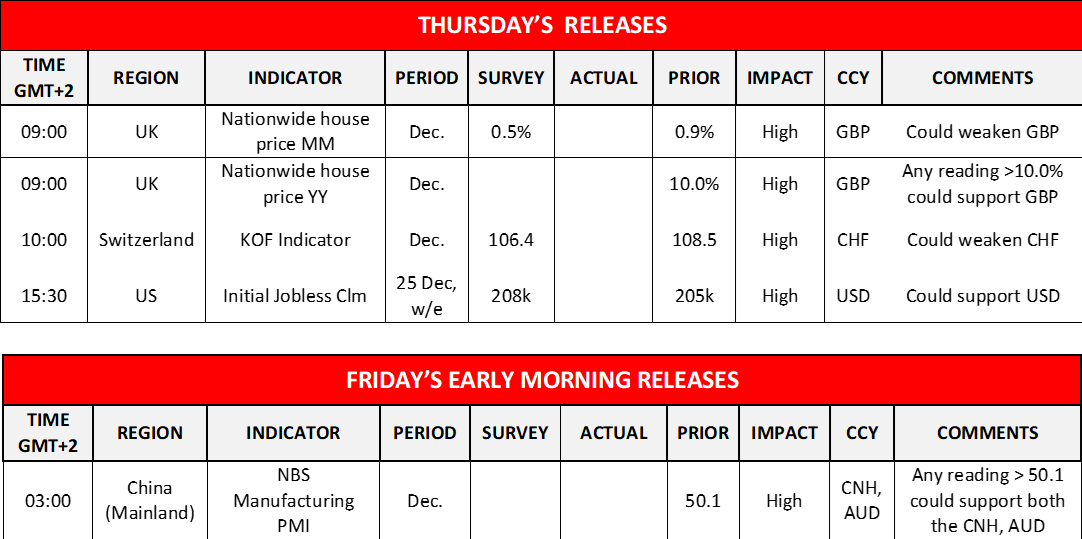
Today in the European session we note the release of the UK Nationwide House prices for December and from Switzerland the KOF indicators also for December. Later we get from the US the weekly initial jobless claims figure and during tomorrow’s Asian session we get China’s NBS PMIs for December.
USD Index H4 Chart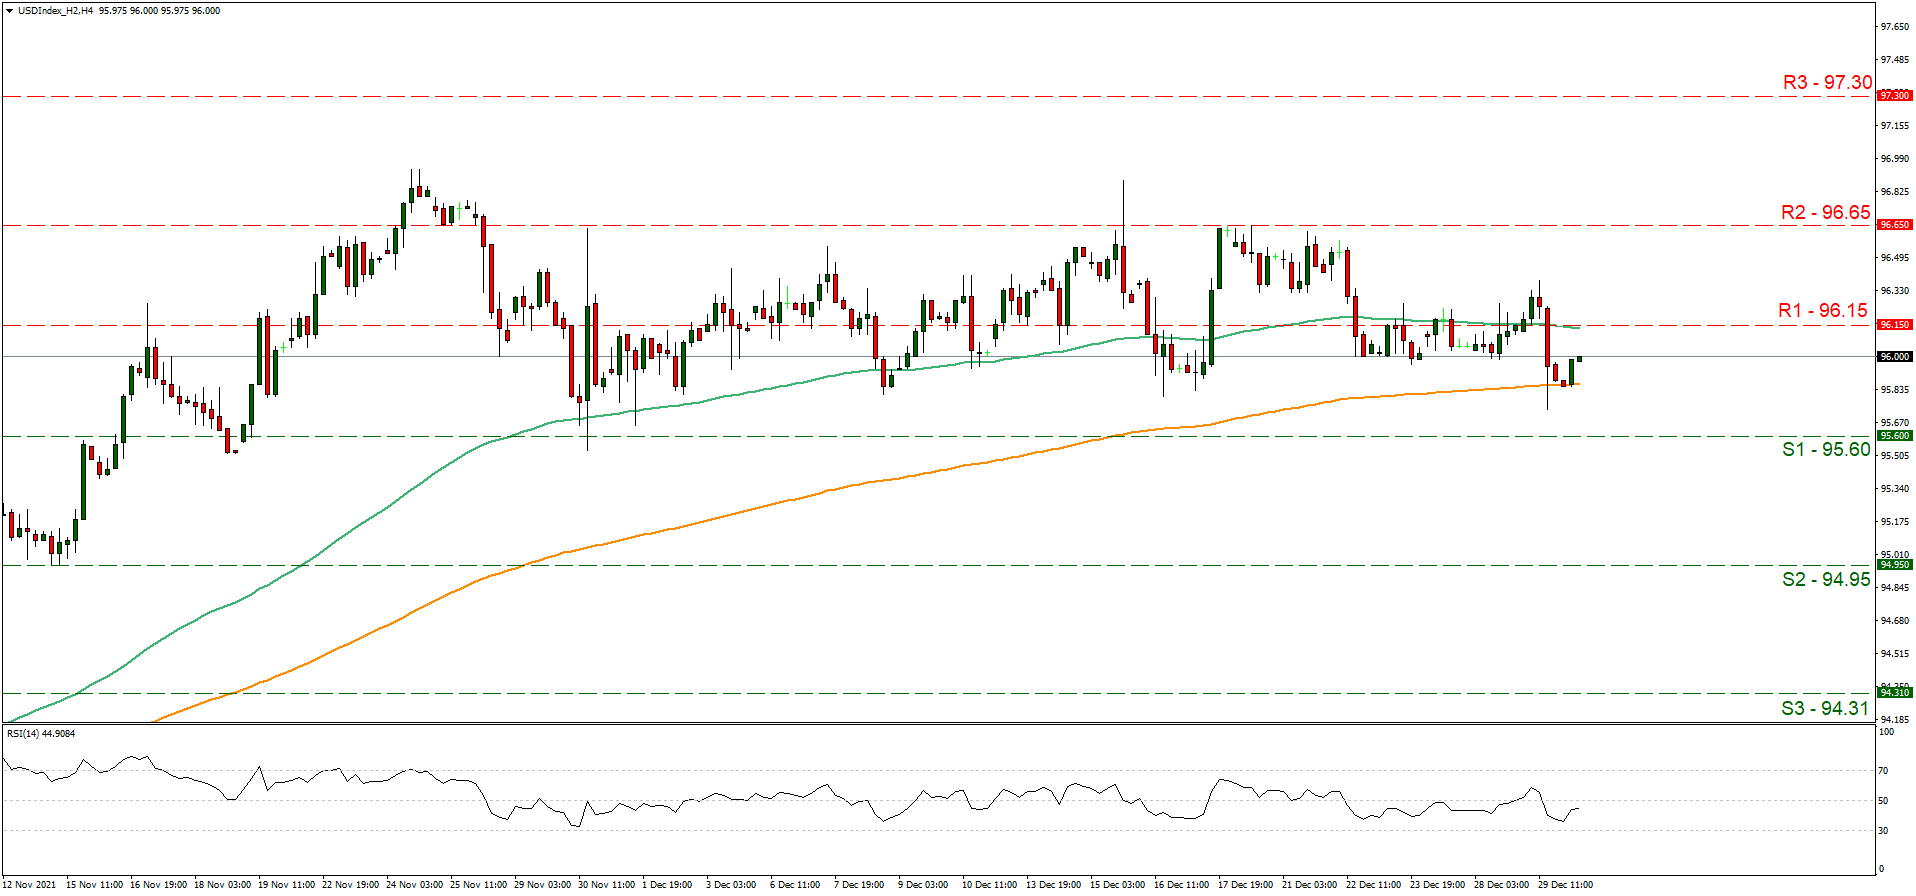
Support: 95.60 (S1), 94.65 (S2), 94.31 (S3)
Resistance: 96.15 (R1), 96.65 (R2), 97.30 (R3)
AUD/USD H4 Chart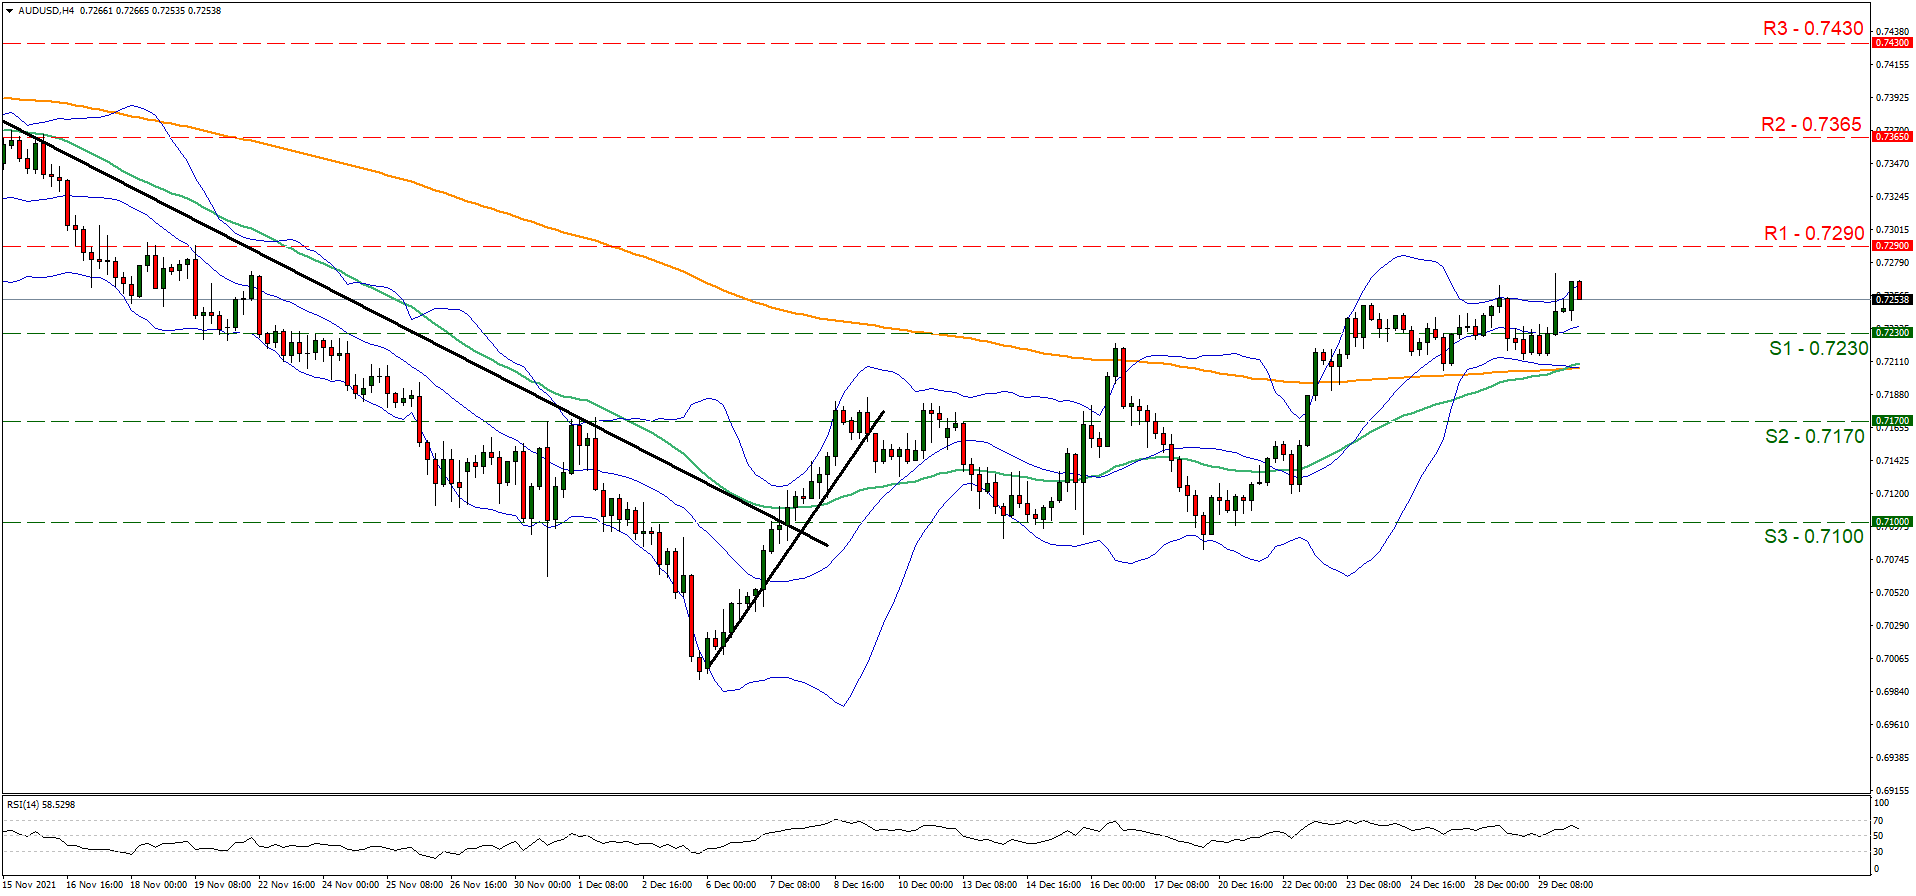
Support: 0.7230 (S1), 0.7170 (S2), 0.7100 (S3)
Resistance: 0.7290 (R1), 0.7365 (R2), 0.7430 (R3)
AUDUSD Downside Risks Linger Despite Latest Climb
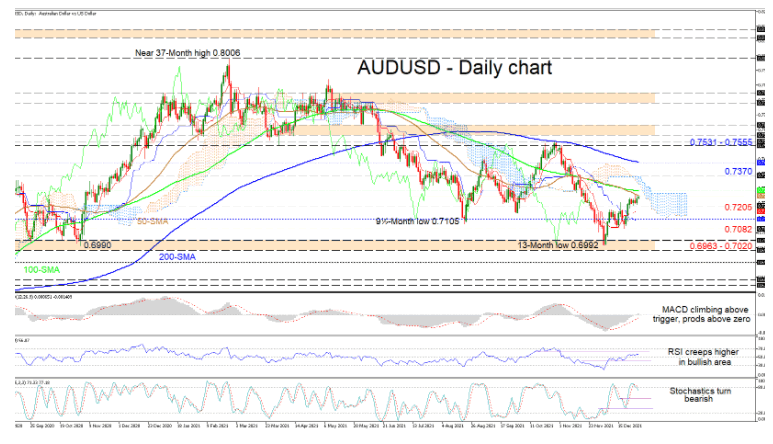
AUDUSD buyers are in the process of trying to extend the ascent from the 13-month low of 0.6992 beyond the falling 50- and 100-day simple moving averages (SMAs). Nevertheless, the bearish SMAs are demonstrating that the directional trend remains skewed to the downside.
The Ichimoku lines are indicating that positive forces are making efforts to take control, while the short-term oscillators are currently reflecting conflicting signals in directional momentum. The MACD, over its red trigger line, is strengthening into the bullish region, while the RSI is crawling higher in the positive zone. That said, the bearish stochastic oscillator is suggesting positive price action is weak, signalling that the averages may curb advances.
As things stand, buyers are confronting immediate downside pressures compounded by the adjacent 50- and 100-day SMAs at 0.7260 and 0.7290 respectively. If the bulls manage to recapture the area above the SMAs and the adjoining Ichimoku cloud, upside momentum could steer the price towards the 0.7370 high. Successfully breaching this too, a continued climb in the pair may eye the 200-day SMA at 0.7439 before trader’s attention turns to the 0.7531-0.7555 resistance zone, formed by the peaks around the end of October.
In the event the 50- and 100-day SMAs cap advances, initial downside friction could occur at the 0.7205 low ahead of a zone of support existing between the Ichimoku lines at 0.7175 and 0.7134 respectively. Should negative pressures intensify, the 0.7082 trough may come into play before sellers turn their focus towards the critical support of 0.6963-0.7020.
Summarizing, AUDUSD is neutral in the short-term timeframe. That said, for downside risks to abate the price would need to rise above the 0.7531-0.7555 resistance border, while a drop past the key 0.6963-0.7020 support base could spark worries about the broader positive structure.
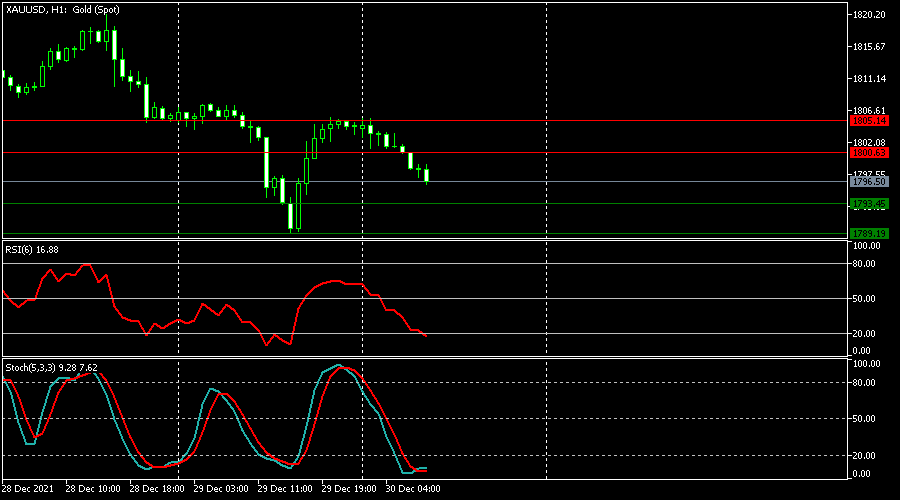
XAUUSD Is Possibly Bearish
Technical analysis
The RSI is at the oversold zone.
The Stochastics is below level 50.
Most likely scenario – SELL
Target prices: 1,793.45 1,789.19
Alternative scenario – BUY
Target prices: 1,800.63 1,805.14
Key levels
Support 1,793.45 1,789.19
Resistance 1,800.63 1,805.14
Daily Technical Analysis
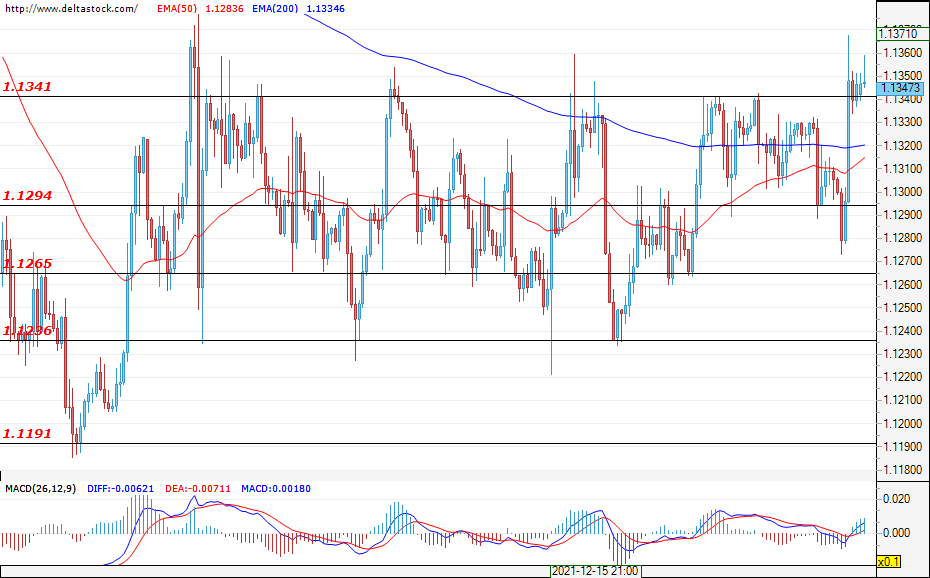
EUR/USD
Current level - 1.1305
The European common currency gained some ground against the U.S. dollar and the pair tested the resistance at 1.1341. At the time of writing the analysis, the pair is consolidating above the mentioned zone and, If the breach is confirmed, then a rally towards the level at 1.1380 would be the most probable scenario. However, If the bears prevail, a new successful attack on the support level at 1.1294, followed by a breach of the next target at 1.1265, would pave the way for a test of the major support zone at 1.1236 and would lead to a change in the current expectations of the market participants. Today, volatility might pick up after the announcement of the initial jobless claims for the U.S. at 13:30 GMT.
| Resistance | Support | ||
| intraday | intraweek | intraday | intraweek |
| 1.1360 | 1.1460 | 1.1294 | 1.1235 |
| 1.1460 | 1.1500 | 1.1265 | 1.1190 |
USD/JPY
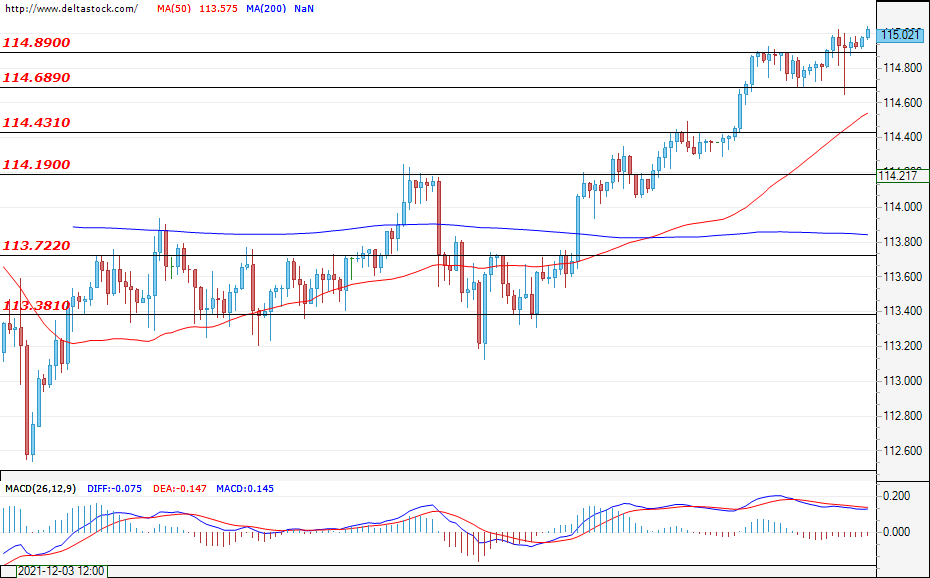
Current level - 114.79
In recent days, the market has entered an uptrend, reaching the resistance at 114.90. Prices are now consolidating below this zone and the expectations are for a more substantial pullback, which should be limited by the support at around 114.43. As long as this bullish attitude is maintained, a breach of 114.90 can be expected, followed by a test of the high at around 115.44.
| Resistance | Support | ||
| intraday | intraweek | intraday | intraweek |
| 114.90 | 115.44 | 114.68 | 114.19 |
| 115.44 | 116.00 | 114.43 | 113.72 |
GBP/USD
Current level - 1.3432
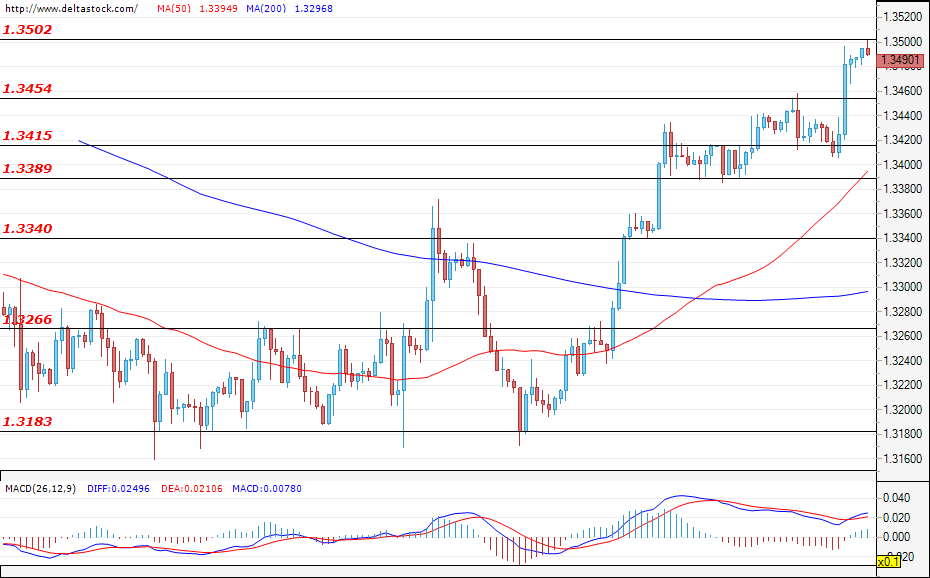
The sterling managed to overcome the last resistance at 1.3425 and now the market is gravitating around this area. The current breach forms two local support zones – one at 1.3390 and another at 1.3415. At the moment, the correction is extremely shallow, which suggests another strong upward impulse. In such a scenario, an attack on 1.3510 can be expected. It is possible that the activity will remain low in the few remaining days of the year and that the market could stay in the range between 1.3390 and 1.3454.
| Resistance | Support | ||
| intraday | intraweek | intraday | intraweek |
| 1.3454 | 1.3510 | 1.3415 | 1.3340 |
| 1.3510 | 1.3580 | 1.3390 | 1.3266 |
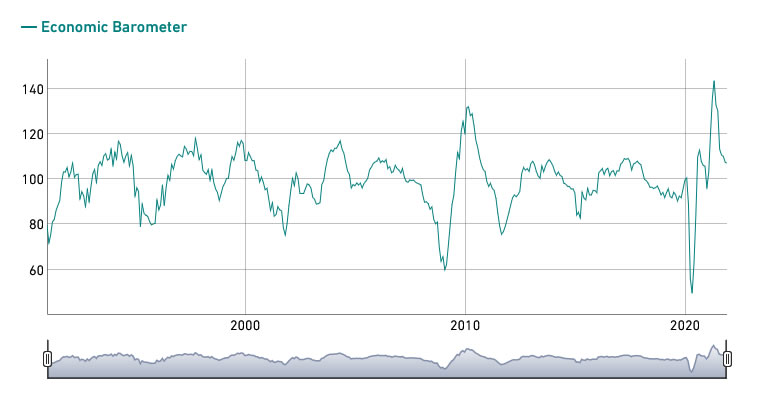
Swiss KOF dropped to 107 in Dec, economy to develop positively at 2022 start
Swiss KOF Economic Barometer dropped slightly from 107.5 to 107.0 in December. "The barometer remains above its long-term average," KOF said. "The Swiss economy should thus continue to develop positively at the beginning of 2022, if the economic activity is not impaired by the renewed spread of the virus."
"This month, the barometer is mostly influenced by indicators covering private consumption, which are slightly negative. Another slight negative contribution is sent by bundles of indicators from the finance and insurance sector. In contrast, indicators for foreign demand are contributing positively."
EURUSD Crosses Key Resistance After Weak US Homes Data
US equities were mixed on Wednesday as Treasury yields rose. The Dow Jones index rose by more than 100 points while the S&P 500 was little changed. The tech-heavy Nasdaq 100 index declined by about 35 points. There was no major catalyst, meaning that investors are assessing the impact of the Covid-19 pandemic on the economy. This is after the US announced the sharpest increase in daily cases. Still, the market believes that the impact of the variant will be muted because it has milder symptoms.
The US dollar index declined after the US published the latest pending home sales and trade numbers. Data by the Commerce Department showed that the country’s goods trade deficit widened to more than $97.78 billion in November. That was a bigger increase than October’s increase of $83.20 billion and the median estimate of $89 billion. Additional data revealed that the country’s pending home sales declined sharply in November. Sales fell by about 2.2% after rising by 7.5% in the previous month. These numbers came a day after the Case-Shiller house price index declined for the third straight month.
The price of crude oil jumped sharply after positive oil inventories data. According to the Energy Information Administration (EIA), US oil stockpiles declined by more than 3.5 million barrels last week. This decline was bigger than the median estimate of 3.22 million barrels. Inventories have declined in the past few weeks because of the decision by the Biden administration to release millions of barrels from the Strategic Petroleum Reserves (SPR).
XTIUSD
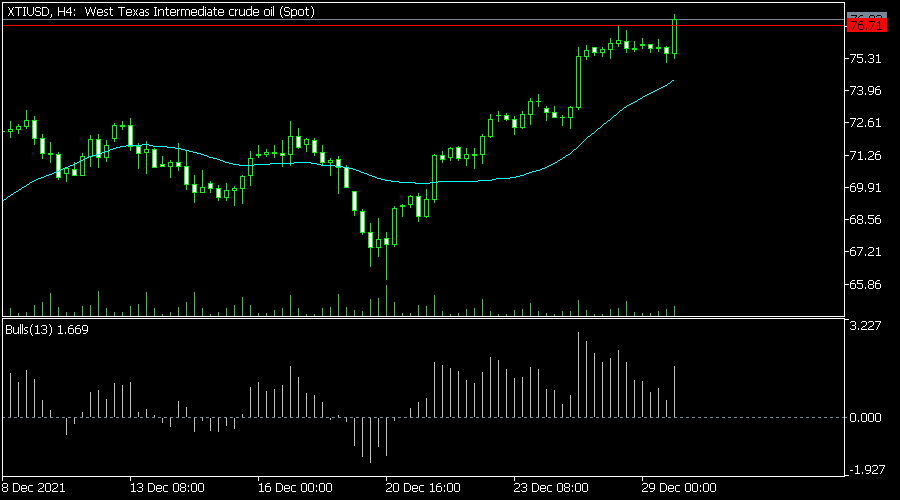
The XTIUSD pair jumped sharply after positive inventories data. It rose to a high of 76.95, which was the highest level since November 25. The pair has managed to rise from a low of 62.30 in November. It has also passed the key resistance level at 76.71. Also, the pair has jumped above the 25-day and 50-day moving averages while the Bulls Power has continued rising. Therefore, the pair will likely keep rising as bulls target the key resistance at 80.
EURUSD
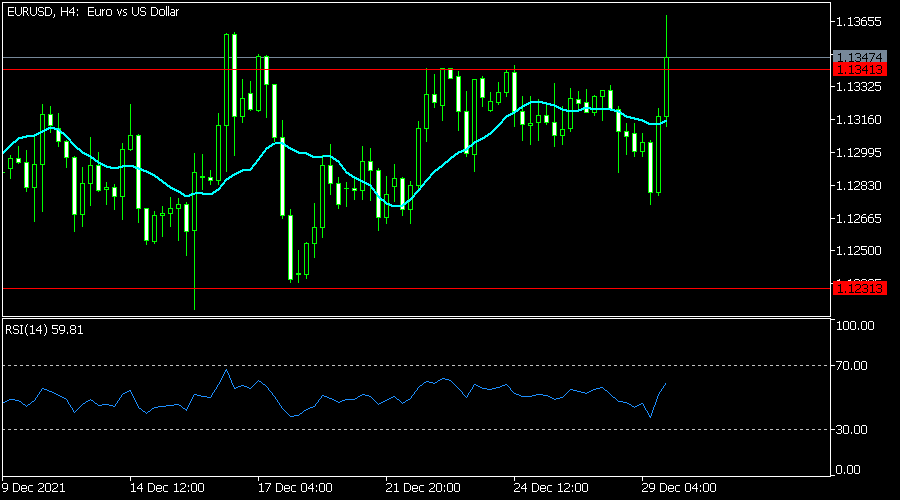
The EURUSD pair made a bullish breakout as investors reacted to weak US housing data. It rose to a high of 1.1370, which was the highest level since November 30th. It also managed to cross the key resistance level at 1.1340, which was the upper side of the horizontal channel. It also rose above the 25-day moving average. Therefore, there is a possibility that the pair will continue holding steady today.
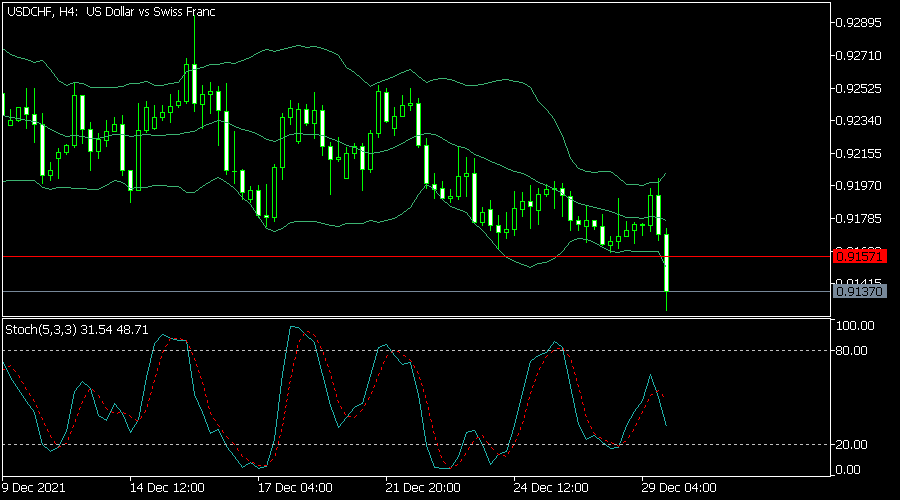
USDCHF
The USDCHF pair crashed to the lowest level in months after the latest housing data. The pair moved to a low of 0.9130, which was lower than this month’s high of 0.9295. It has moved along the lower side of the Bollinger Bands while the Stochastic oscillator has tilted lower. It has also moved below the 25-day and 50-day moving averages. Therefore, the pair will likely keep falling today.