Sample Category Title
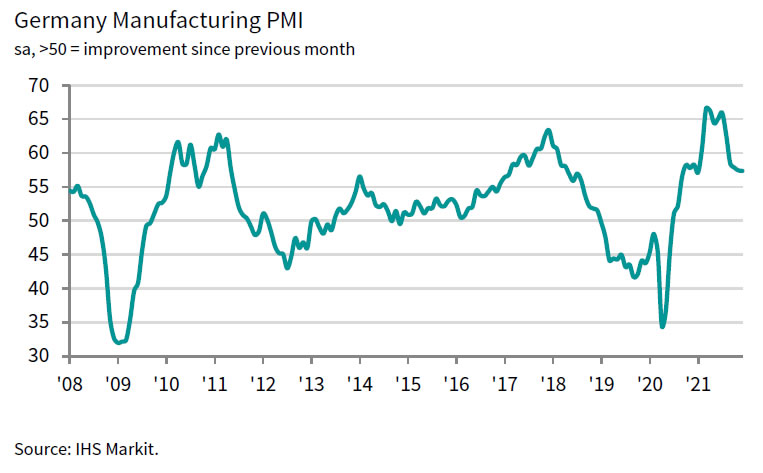
Germany PMI manufacturing finalized at 57.4 in Dec, some signs of encouragement
Germany PMI Manufacturing was finalized at 57.4 in December, unchanged from November's level, lowest since January. Markit said output growth ticked up as incidence of lengthening input lead times fell. Input costs and output prices rose sharply, but rates of inflation eased. Faster rise in employment as business expectations strengthened slightly.
Phil Smith, Associate Economics Director at IHS Markit, said:
"After a promising start to 2021, the German manufacturing sector's performance faded as the year went on as unprecedented supply chain constraints took their toll. However, although growth in December was only modest with supply shortages still an issue, the survey's output index has now ticked up in each of the last two months, to offer some hope that the final quarter of 2021 can be a turning point from which growth starts to pick up as we move through 2022.
"Buoyed by full order books, German manufacturers are confident about growth prospects in the coming year, though much still depends on an improvement in the supply situation.
"Latest data provided some signs of encouragement, as expectations improved, the incidence of lengthening lead times eased to an 11-month low, and firms were able to rapidly build up stocks of inputs. Nevertheless, supply chains remain under intense pressure by historical standards, and there's still a risk of fresh disruption as a result of flare-ups in the pandemic."
France PMI manufacturing finalized at 55.6 in Dec, growth rates could get better in 2022
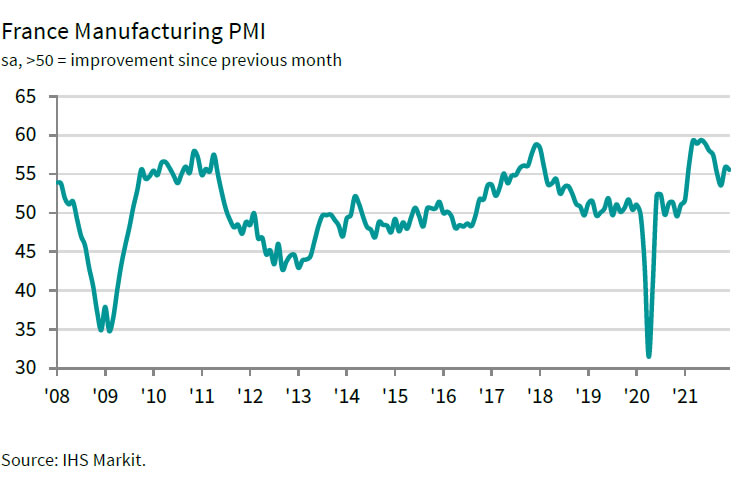
France PMI Manufacturing was finalized at 55.6 in December, down from November's 55.9. Markit noted trends in output and new orders improved but rounded off subdued quarter. Delivery delays were at least severe since March as pressures abated. Purchasing activity rose further while firms stockpiled at record pace.
Joe Hayes, Senior Economist at IHS Markit, said:
"The December PMI survey gave us a few reasons to be a bit more optimistic towards the manufacturing sector looking ahead. The Suppliers' Delivery Times Index registered a meaningful move higher in December. We're by no means anywhere near out of the woods yet, and a large portion of our survey panel are still seeing shortages and increasing lead times, but there were some reports of improving stock levels at vendors.
"Firms took advantage though, and we saw purchasing activity growth accelerate and stocks of purchases accumulate to the fastest extent on record, which will certainly help firms increase production levels.
"We also saw continued hiring across the sector, despite anecdotal evidence suggesting that demand conditions still remain subdued. Manufacturers expect order books to begin filling a lot faster as the supply situation improves.
"Overall, the stabilisation in the output and new order indices following the harsh slowdown in the second half of 2021, combined with some alleviation of supply-side constraints, suggests growth rates could get better in 2022."
Gold Price Started a Fresh Increase from the $1,790 Support
Gold price found support near $1,790 and started a fresh increase against the US Dollar. The price broke the $1,808 level to move into a short-term positive zone.
Besides, there was a break above the $1,820 level and the 50 hourly simple moving average. The price is now facing resistance near the $1,830 level and might correct lower.
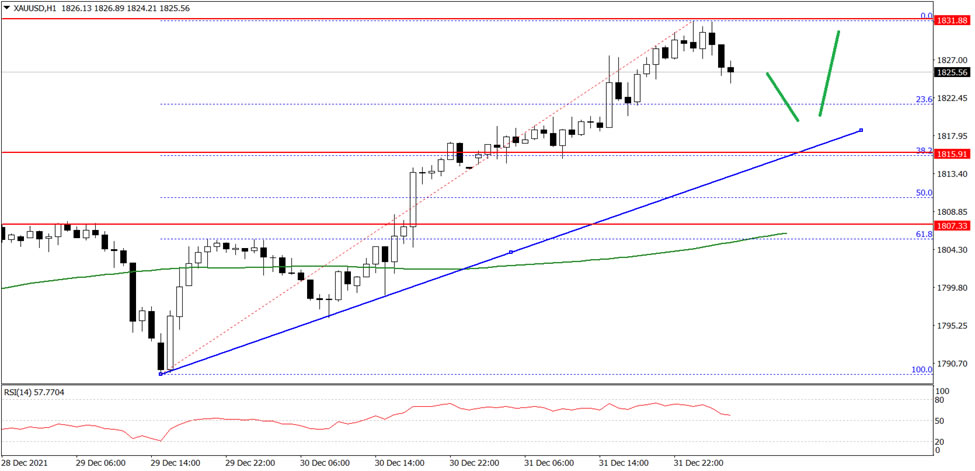
An initial support on the downside is near the $1,822 level. first key support on the downside is near the $1,818 level and a bullish trend line on the hourly chart, below which there is a risk of more downsides. In the stated case, the price could test $1,800 on FXOpen.
On the upside, the price is facing resistance near the $1,830 level. The next main resistance could be near the $1,842 level, above which the price could rise towards the $1,860 level.
US Dollar Spikes as Omicron Cases Surge
The US dollar rose on the first trading day of the month as worries of the Omicron variant failed to dampen the mood among investors. Recent data from around the world shows that the number of Covid-19 cases is rising, with most of the cases being because of the Delta and Omicron variants. For example, in the United States, the 14-day average of the cases has risen to about 401k, which is a 201% increase. However, the 14-day average of deaths has fallen by 1.4%, meaning that the new variant is milder than the others.
US futures rose on Monday as the focus shifted to the new year. Futures tied to the Dow Jones rose by 115 points while those tied to the S&P 500 and Nasdaq 100 rose by more than 0.40%. In general, stocks had a great 2021 as the S&P 500 index rose by 28%, making it the third straight month of double-digit gains. Analysts expect that the S&P 500 returns will be lower this year as the Federal Reserve starts to hike interest rates. Meanwhile, in Asia, the Hang Seng index declined by 0.70% while the Nifty 50 rose by 0.65%.
The economic calendar will have a few events today. The most important one will be the Turkish inflation rate. Economists expect the data to show that the headline consumer price index (CPI) rose from 21.30% in November to 30.60% in December. On a month-on-month basis, the CPI is expected to have risen by 9%. These numbers will be important because the Turkish Central Bank implemented three rate cuts in 2021 as inflation rose. Other key numbers to watch today will be the European and US PMI data.
EURUSD
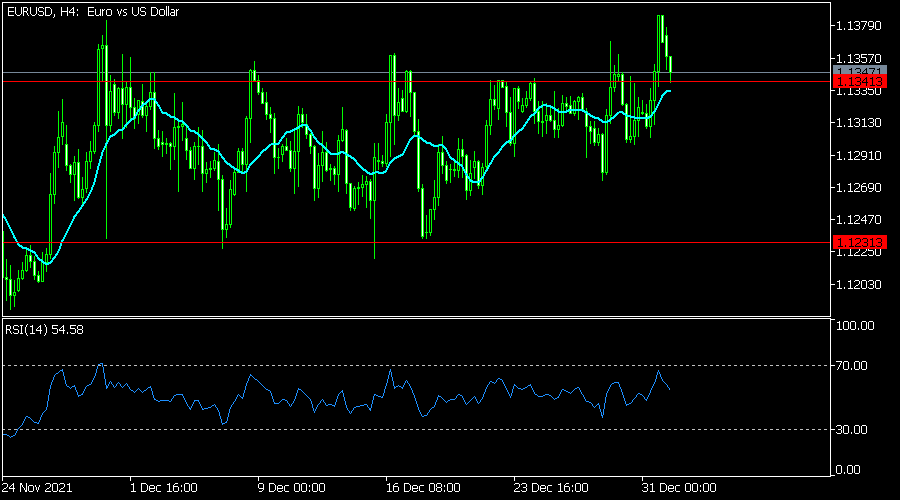
The EURUSD pair rose to a high of 1.1387 on Friday. This was the highest level since November 15. The pair declined to a low of 1.1340, which is along the upper side of the horizontal channel shown in red. It has moved slightly above the 25-day moving average while the Relative Strength Index (RSI) has moved to 54. The pair will likely resume the bullish trend after forming a break and retest pattern.
USDCHF
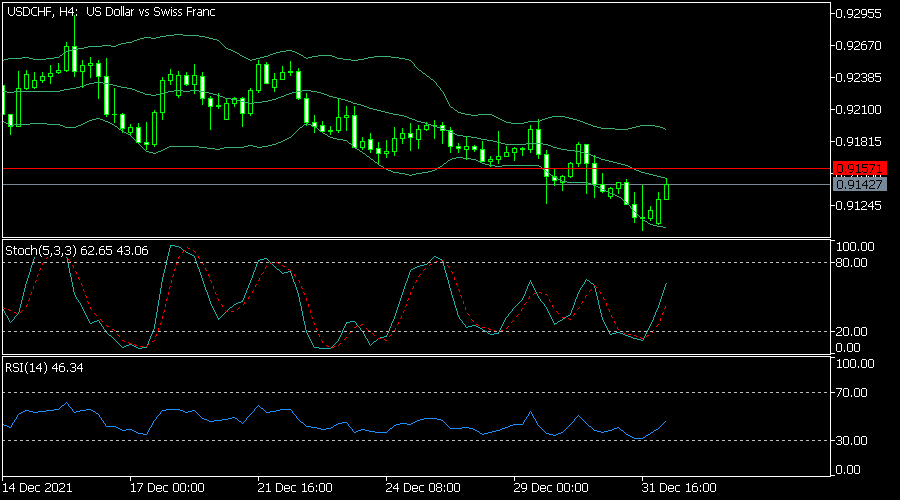
The USDCHF pair rose to a high of 0.9142, which was slightly above last week’s low of 0.9100. On the four-hour chart, the pair moved to the middle line of the Bollinger Bands while the Stochastic Oscillator has moved above the oversold level. The Relative Strength Index has also moved slightly above the oversold level. Therefore, the pair will likely keep rising as bulls target the upper side of the Bollinger Bands.
XBRUSD
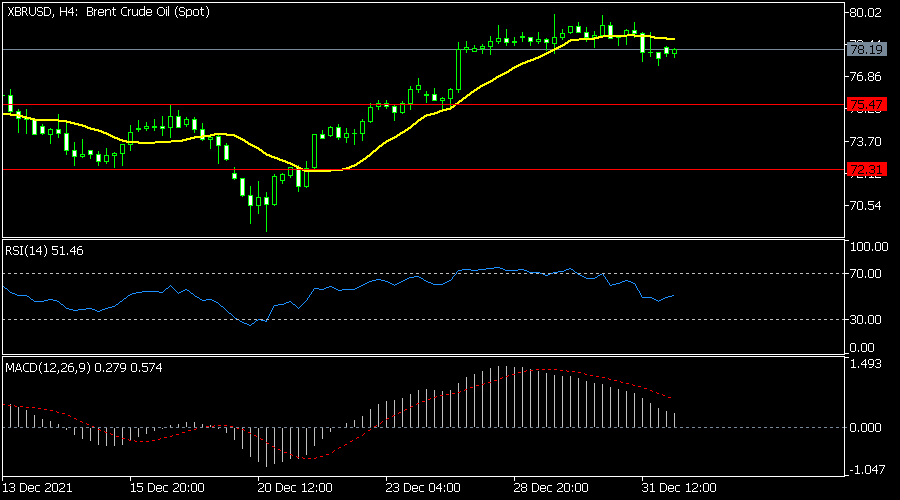
The XBRUSD pair was little changed on Monday. It is trading at 78.17, where it has been in the past few days. The price is slightly below the key resistance at 79.95. It also moved slightly below the 25-day moving average while the MACD and the Relative Strength Index (RSI) tilted lower. Therefore, the pair will likely remain in this range today.
Dollar Largely Flat amid Macroeconomic Stalemate
Market movers today
Happy New Year! On this year's first trading day we have a limited agenda ahead of us. Today, we get country-specific PMI manufacturing, including from Sweden and Norway. Overnight, Chinese Caixin PMI manufacturing is due.
This week's key release is the US jobs report for December due out on Friday.
Key themes over the next six months are still COVID-19, high inflation, bottlenecks, a cyclical slowdown and central bank policy.
The 60 second overview
Equities in hindsight: 2021 was a fantastic year for equities with 21% return measured by the MSCI world AC local currency index. However, this came with very big regional differences where US lead the gains by returning almost 30% while China (Hang Seng) lost almost 15%. Energy was the best performing sector last year, returning 44% while utilities was the bottom performer returning 13%. Looking at styles it was interesting to see how momentum was the weakest part, returning only 10% after a massive outperformance back in 2020. Quality, cyclicals and value were the best performing styles in 2021.
A slow start to the year: The year begins as last year ended with many of the same themes carrying over and this week is unlikely to bring much new information to the table. As such, US and European equities are near all-time highs whereas Emerging Markets continue to be wobbly. The key themes over the next six months are still COVID-19, high inflation, bottlenecks, a cyclical slowdown and central bank policy.
The dollar: Amid this stalemate in macroeconomic news, the dollar (EUR/USD) continues its largely sideways move, as we saw during December. In our view, on the one hand, the big-picture strength of US over EM adds to USD-upside but US equities have been quite wobbly over recent weeks as well. The lack of more firm (short-term) trends in relative equities have gone hand-in-hand with mild weakness in the global commodity prices. As the latter has been a key EUR-negative element in recent months, we are starting to see a more sideways and slight upside risk to EUR/USD on days when equities and commodities struggle. Looking ahead, we expect EUR/USD to drop further over the coming quarters.
Equities: Turning the page to 2022, Asian markets are slowing starting up with both Japan and mainland China closed. Rest of Asia showing gains this first trading day of the year, though with Hang Seng being the exemption. Futures in Europe are flat while US futures are showing small gains this morning.
FI: Last year ended with a modest decline in yields as well as stable spreads. The BTPS-Bund spread stabilised around 130bp. We think it is too wide given the positive rating outlook and that the supply of Italian government bonds in 2022 did not surprise on the upside.
FX: EUR/USD moved higher on 31 December and was trading closer to 1.14 than 1.13 at the time of writing. EUR/GBP went briefly below 0.84 on the last trading day of 2021 but is now marginally above. EUR/SEK and EUR/NOK are trading around 10.30 and 10.02, approximately. EUR/DKK traded close to the 7.4360 FX intervention level from earlier last year throughout most of December, but the downwards pressure did ease slightly in the final days of the year.
Credit: Credit markets have seen good performance over Christmas and New Year where iTraxx Xover has tightened 10bp and Main 2.5bp. Hence, CDS indices are now below or close to their September post-roll levels (trading in 242bp and 48bp, respectively). HY bonds have tightened 7bp and IG is unchanged.
Gold breaks 1830 as rebound resumes, heading towards 1877 resistance
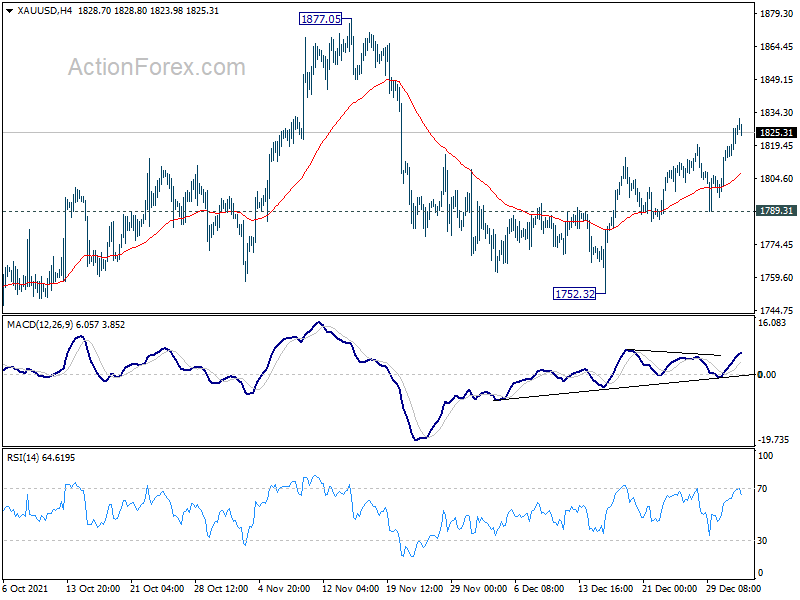
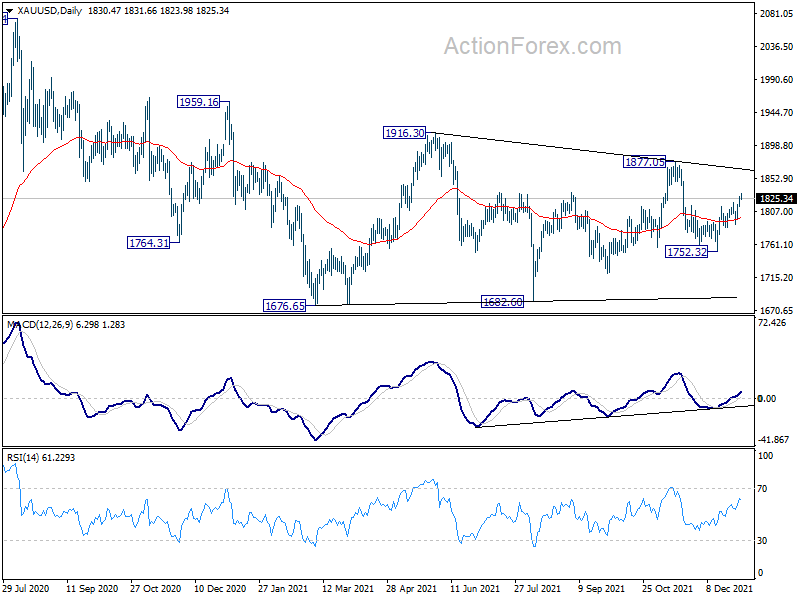
Gold's rebound form 1752.32 resumed after brief pull back and hit as high as 1831.66 so far. 4 hour MACD suggests that Gold is picking up upside momentum. For now further rise is expected as long as 1789.31 support holds. Rise from 1752.32 should target a test on 1877.05 resistance next.
At this point, Gold is see as being in a leg inside the range pattern from 1676.65. While a break of 1877.05 cannot be ruled out, we're not seeing much chance of breaking through 1916.30 medium term resistance. Meanwhile, break of 1789.31 support will argue that fall from 1877.05 is probably ready to resume through 1752.32.
Technical Outlook and Review
DXY:
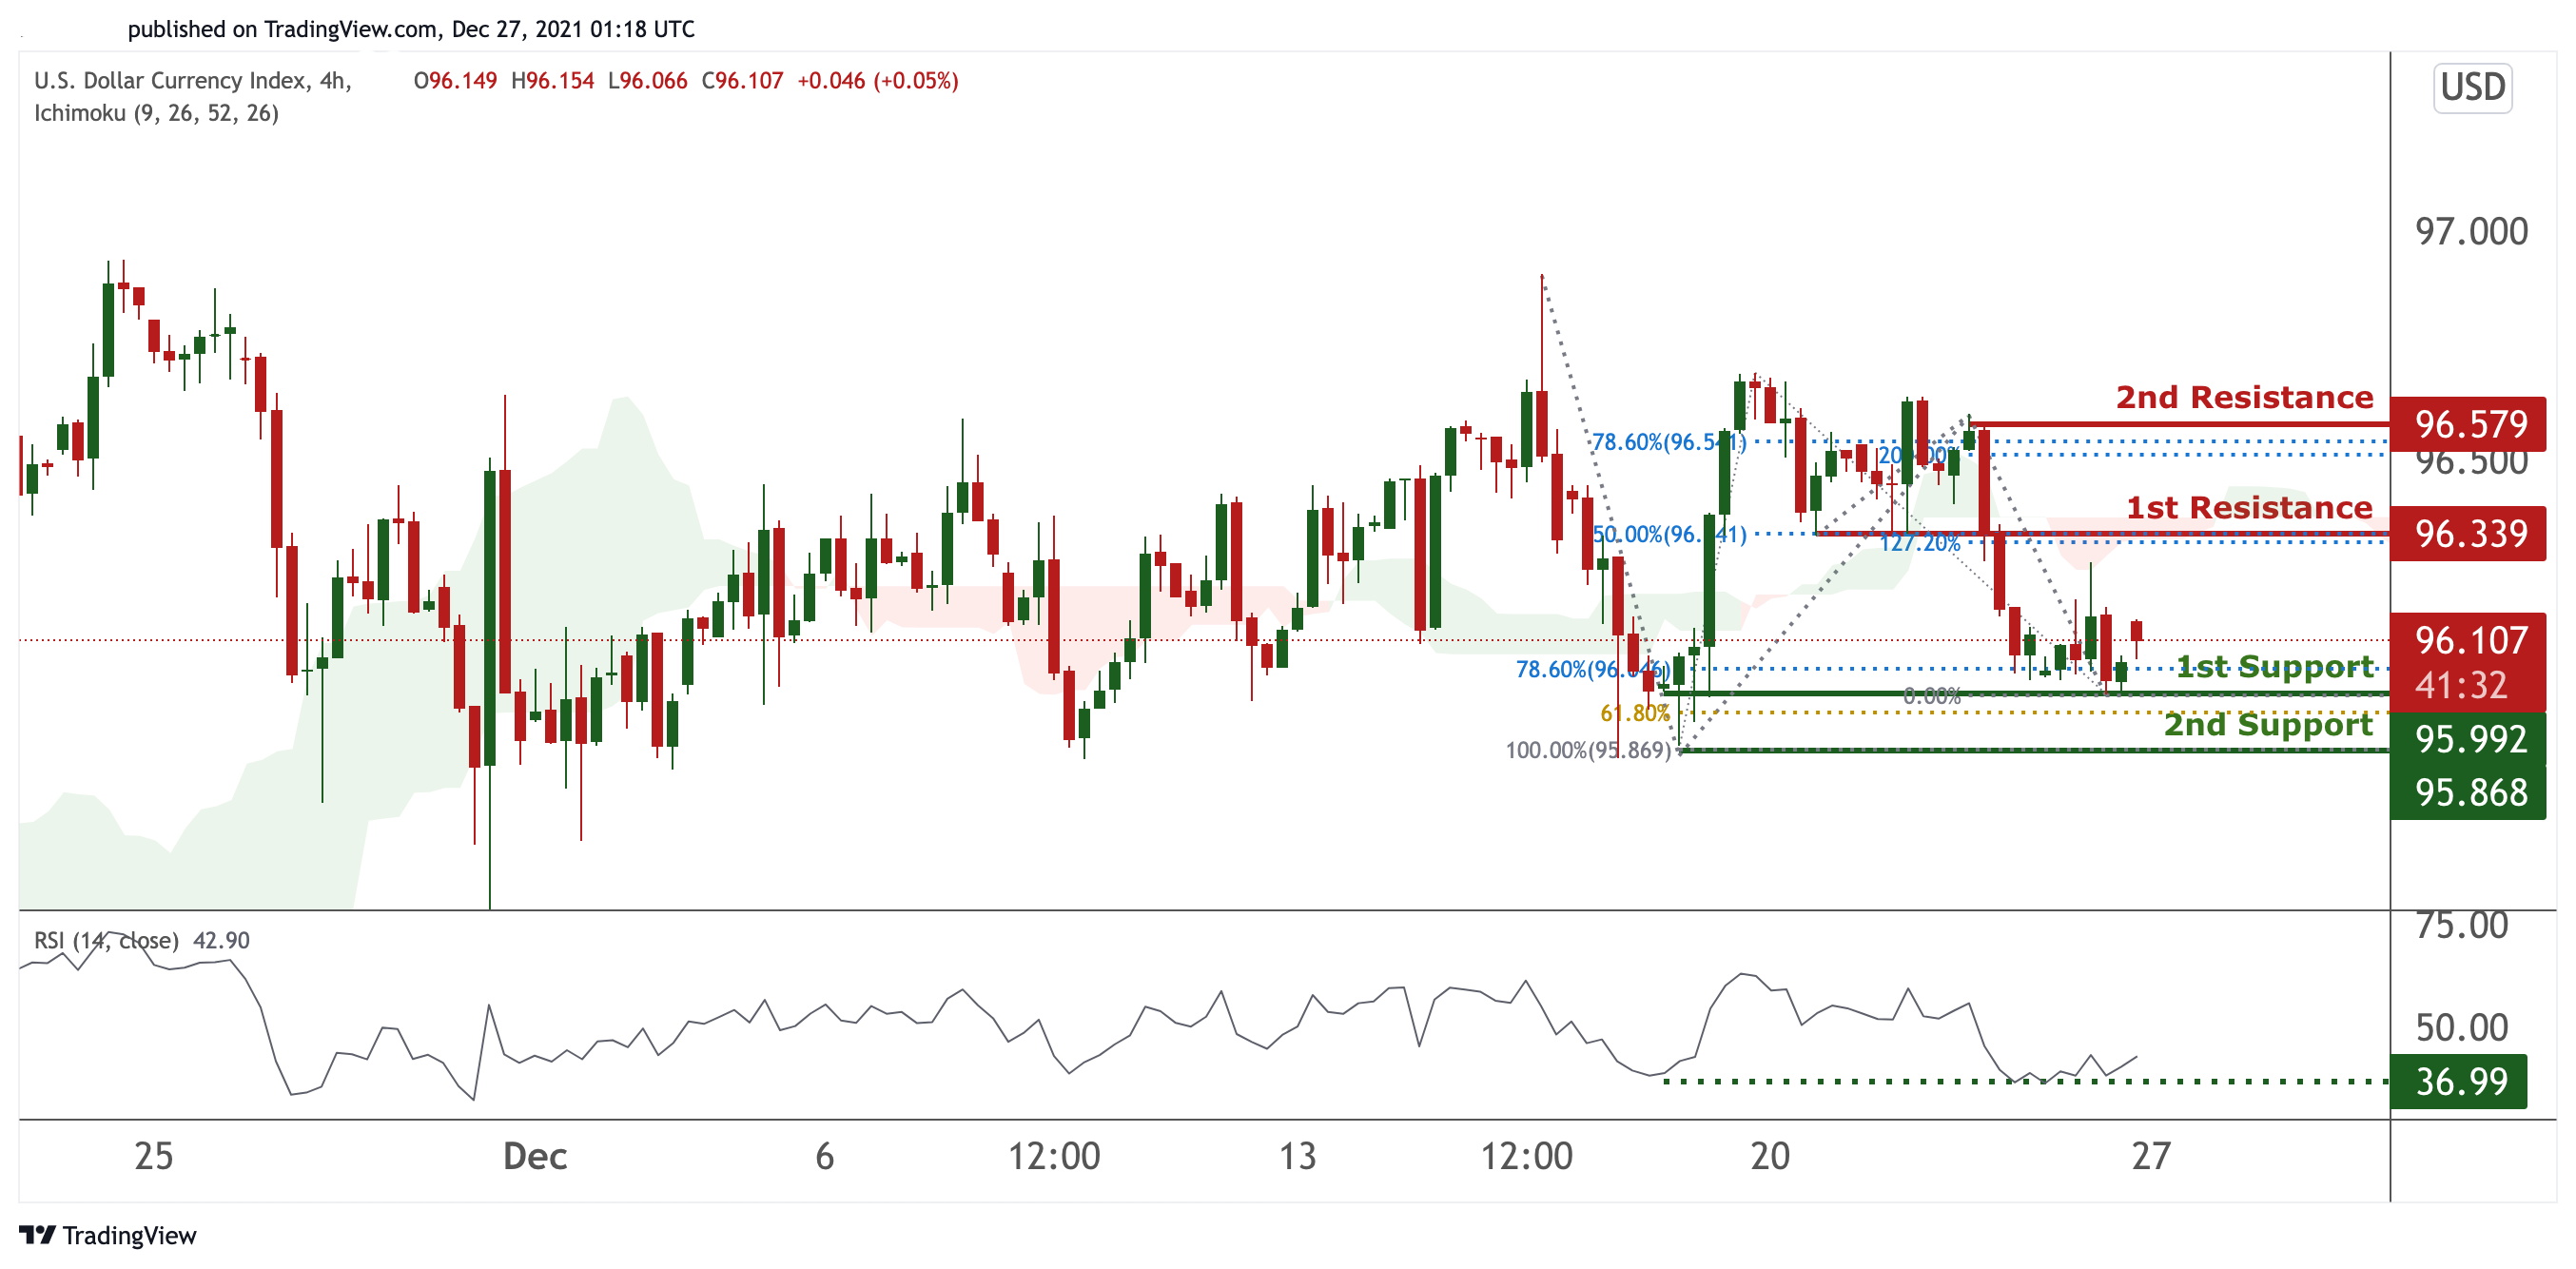
On the H4, prices are on bearish momentum and abiding to our descending trendline. We see the potential for a dip from our 1st resistance at 95.927 in line with 23.6% Fibonacci retracement and 38.2% Fibonacci retracement towards our 1st support in line 95.566 with 100% Fibonacci extension. Prices are trading below our MA 40 and ichimoku clouds showing further bearish momentum.
Areas of consideration:
H4 time frame, 1st resistance at 95.827
H4 time frame, 1st support at 95.566
XAU/USD (GOLD):
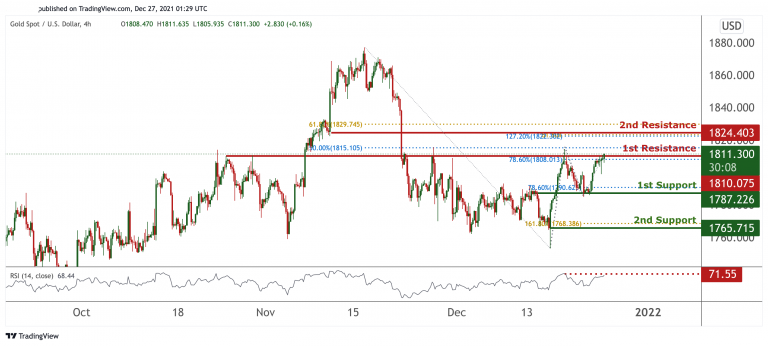
On the H4, Prices are at a pivot and strong graphical overlap. We see the potential for a dip from our 1st resistance at 1834.195 in line with 61.8% Fibonacci retracement towards our 1st support at 1813.845 in line with 50% and 50% Fibonacci retracement. RSI are at levels where dips previously occurred. Alternatively, breaking our 1st resistance could find prices could climb higher towards our 2nd resistance at 1849.77 in line with 161.8% Fibonacci Projection and 78.6% Fibonacci retracement.
Areas of consideration:
H4 1st support at 1813.845
H4 1st resistance at 1834.195
GBP/USD
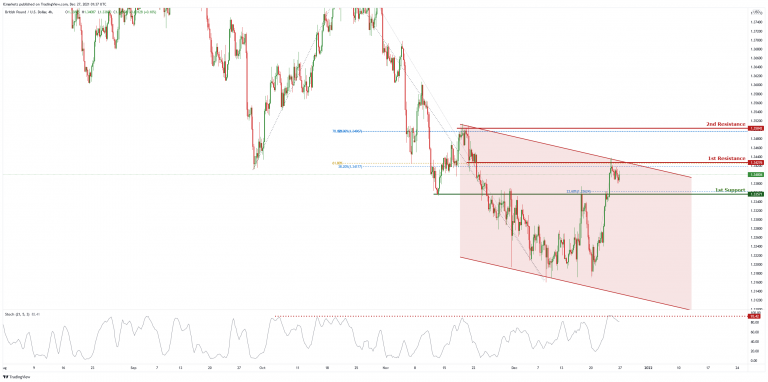
On the H4 chart price is abiding by an ascending trendline and near 1st support of 1.35037 which is 78.6% Fibonacci projection. Price can potentially go to the 1st resistance level of 1.36034 which is also 100% Fibonacci projection and 61.8% Fibonacci retracement. Our bullish bias is supported by the ichimoku cloud indicator as price is trading above it.
Areas of consideration :
H4 1st resistance at 1.36034
H4 1st support at 1.35037
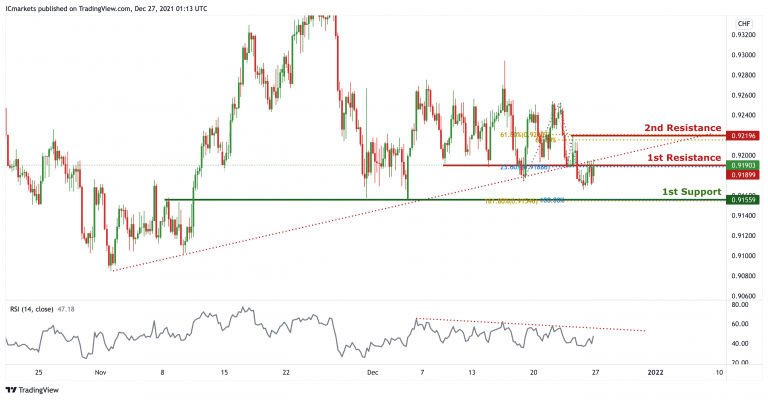
USD/CHF
In reference to last week’s analysis, price indeed dropped to the 1st Support at 0.91011. On the H4 timeframe, price broke out of the ascending trendline support, signifying potential bearish momentum. We can expect price to drop from 1st Resistance in line with 50% Fibonacci retracement and 61.8% Fibonacci projection towards 1st Support in line with 78.6% Fibonacci projection. Our bearish bias is further supported by price holding below the Ichimoku cloud and RSI is abiding to the descending trendline resistance.
Areas of consideration:
Watch 1st Support at 0.91011
Watch 1st Resistance at 0.91562
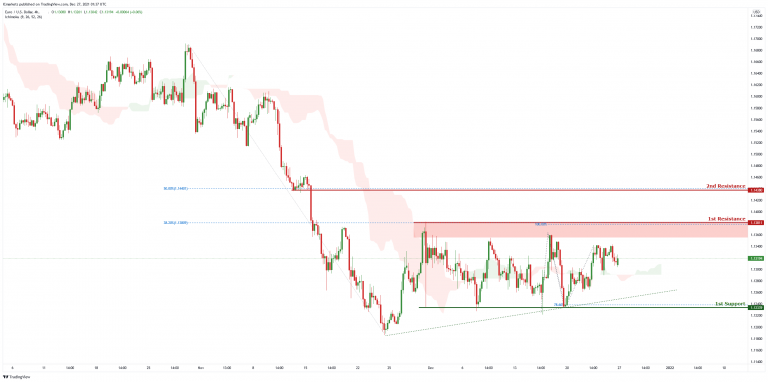
EUR/USD :
On the H4 chart price is near 1st resistance level of 1.13854 which is also 100% Fibonacci projection and 38.2% Fibonacci retracement. Price can potentially dip to the 1st support level of 1.12339 which is also 23.6% Fibonacci retracement and 78.6% Fibonacci projection. Our bearish bias is supported by the stochastic indicator as it is near resistance level.
Areas of consideration :
H4 1st resistance at 1.13854
H4 1st support at 1.12339
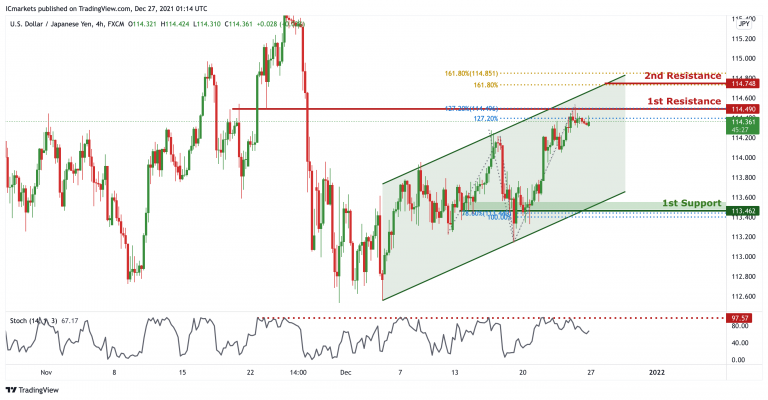
USD/JPY
On the H4 timeframe, price is abiding to the ascending channel, showing an overall bullish momentum. However, we can expect a short term bearish momentum and drop from 1st resistance in line with graphical overlap resistance and 127.2% Fibonacci projection towards 1st Support in line with graphical overlap support, 78.6% Fibonacci projection and 38.2% Fibonacci retracement. Our bearish bias is further supported by stochastic where the %K line dropped from the resistance.
Areas of consideration:
H4 1st resistance level 115.175
H4 1st support level 114.418
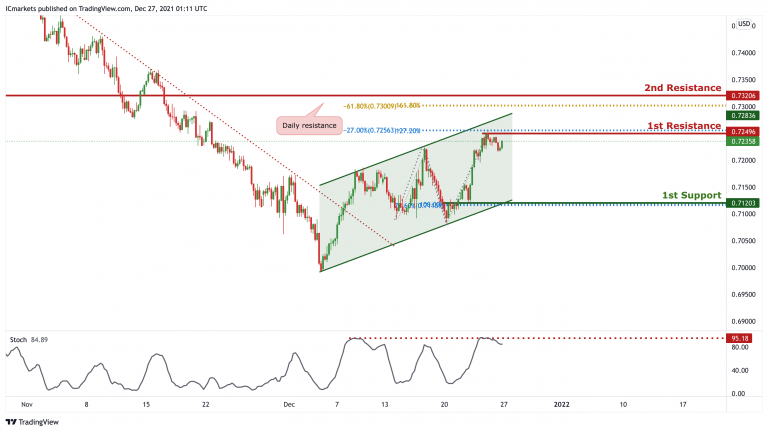
AUD/USD:
On the H4, price is reacting in an ascending channel, signifying bullish momentum. However, price is currently at a resistance, we can expect price to drop from 1st Resistance in line with 127.2% Fibonacci projection ,127.2% Fibonacci Extension and 50% Fibonacci retracement towards 1st Support in line with 100% Fibonacci projection and 78.6% Fibonacci retracement. Our short-term bearish bias is further supported by the stochastic indicator where the %K line is approaching the resistance level.
Areas of consideration:
H4 1st Support level 0.71203
H4 1st resistance level 0.72773
NZD/USD:
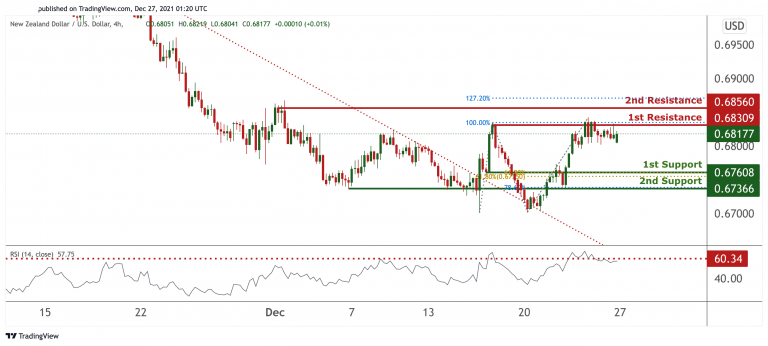
On the H4, prices are consolidating in an ascending triangle. We see the potential for further bullish movement towards our 1st resistance at 0.68676 in line with 127.2% Fibonacci extension and 161.8% Fibonacci projection. Technical indicators are showing momentum. Alternatively, breaking our 1st support may find prices dipping towards our 2nd support at 0.67886.
Areas of consideration:
H4 time frame, 1st resistance at 0.68676
H4 time frame, 1st support at 0.68211
USD/CAD:
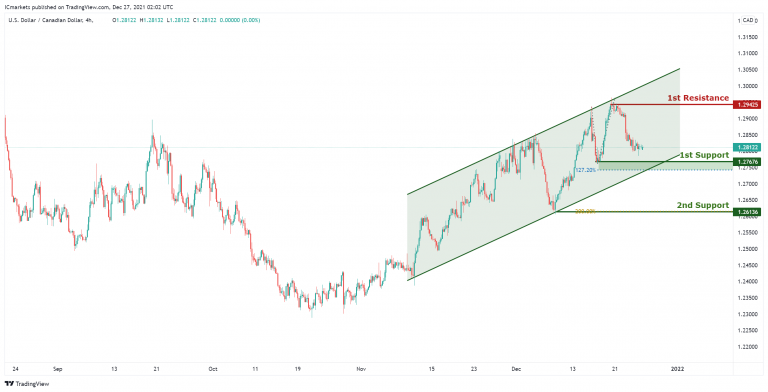
On the Weekly, with price at the resistance of the ichimoku indicator and horizontal swing high resistance, we have a bearish bias that price will drop from our 1st resistance at 1.26839 which is in line with horizontal overlap resistance, 78.6% Fibonacci retracement level to 1st support at 1.26036, which is in line with horizontal swing low support. Alternatively, price may rise up to our 2nd resistance at 1.27654, which coincides with horizontal swing high resistance, 38.2% Fibonacci retracement level .
Areas of consideration:
H4 time frame, 1st support at 26036
H4 time frame, 1st resistance at 26839
OIL:
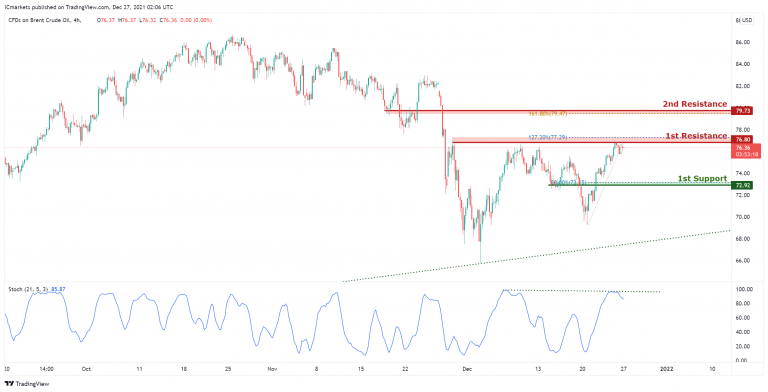
On the H4, with price on a downwards trend on the stochastics indicator, we have a bearish bias that price will drop from our 1st resistance at 79.4 which is in line with horizontal overlap resistance, 161.8% Fibonacci extension and 100% Fibonacci projection level to 1st support at 75.52, which is in line with horizontal overlap support, 38.2% Fibonacci retracement level. Alternatively, price may rise up to our 2nd resistance at 82.83, which coincides with horizontal swing high resistance and 127.2% Fibonacci extension level .
Areas of consideration:
H4 time frame, 1st resistance of 40
H4 time frame, 1st support of 52
Dow Jones Industrial Average:
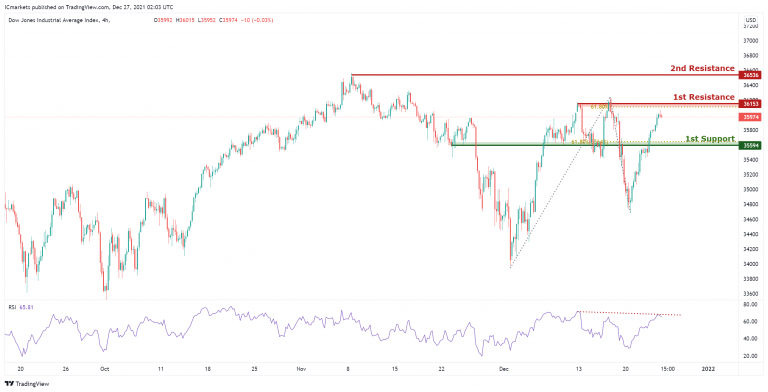
On the H4, with price rejecting the resistance on the stochastics indicator, we have a bearish bias that price will drop from our 1st resistance at 36555 which is in line with horizontal swing high resistance and 127.2% Fibonacci extension level to 1st support at 35971, which is in line with horizontal overlap support, 38.2% Fibonacci retracement level. Alternatively, price may rise up to our 2nd resistance at 37124, which coincides with horizontal swing high resistance and 161.8% Fibonacci extension .
Area of consideration:
4H resistance at 36555
4H support at 35971
EUR/USD Attempts Fresh Recovery, PMI’s Next
Key Highlights
- EUR/USD is showing a few positive signs above 1.1320.\
- It broke a key contracting triangle with resistance near 1.1340 on the 4-hours chart.
- GBP/USD accelerated further higher above the 1.3500 zone.
- The Euro Zone Manufacturing PMI could remain at 58.0 in Dec 2021.
EUR/USD Technical Analysis
The Euro formed a base above the 1.1300 level against the US Dollar. EUR/USD started a decent recovery wave above the 1.1320 and 1.1340 resistance levels.
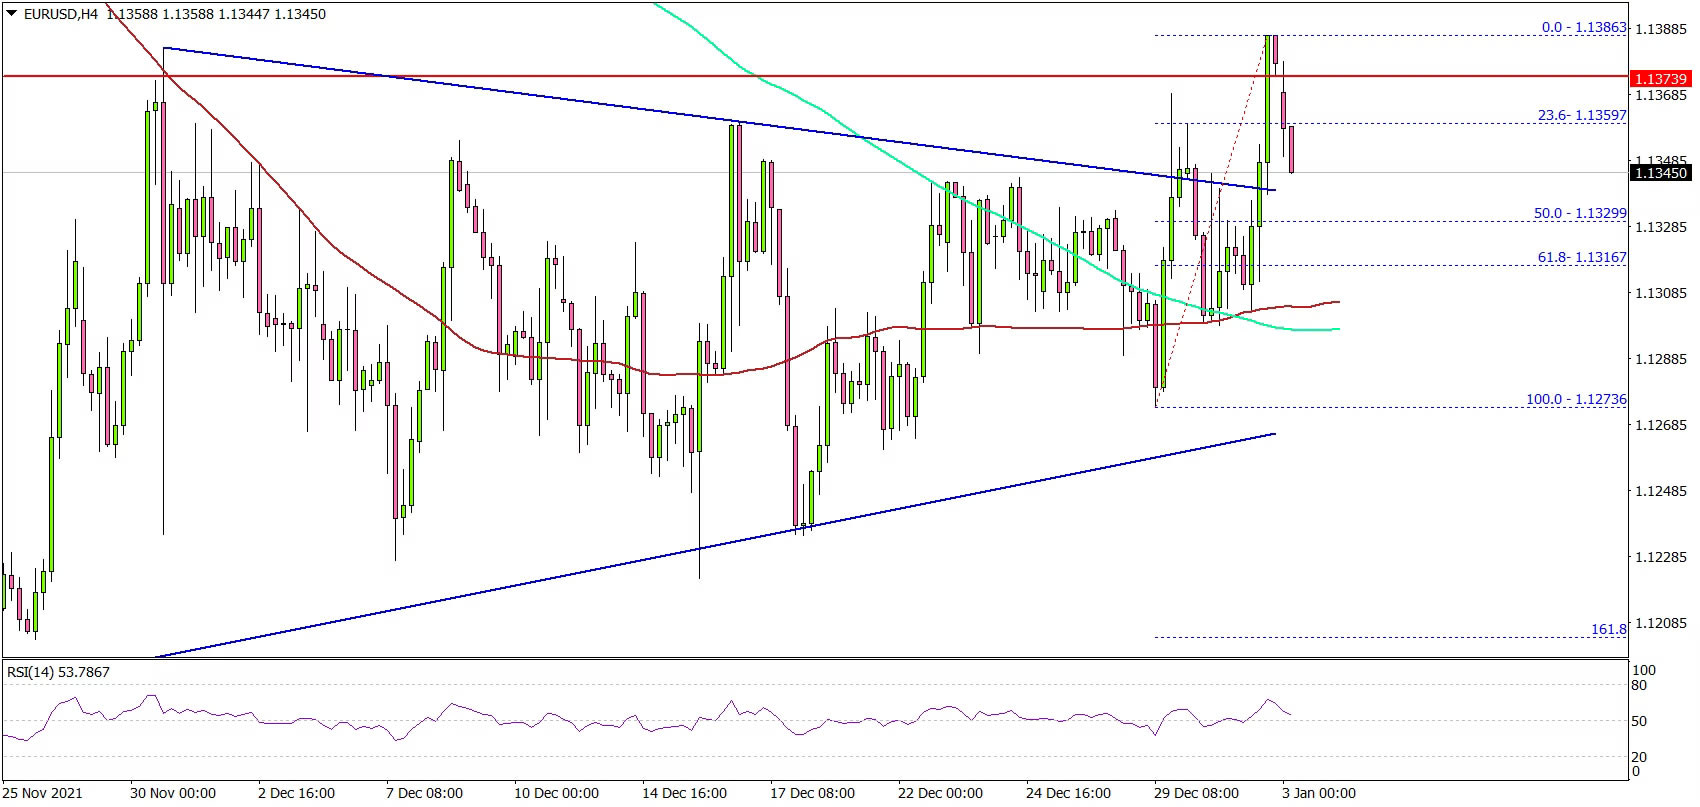
Looking at the 4-hours chart, the pair settled above the 1.1340 level, the 100 simple moving average (red, 4-hours) and the 200 simple moving average (green, 4-hours).
Besides, there was a break above a key contracting triangle with resistance near 1.1340 on the same chart. It even surpassed 1.1350 and might soon test the 1.1400 resistance. A close above 1.1400 could open the doors for more gains.
The next major resistance is near the 1.1450 level. On the downside, an immediate support is near the 1.1340 level. The main support is now forming near the 1.1300 level.
A downside break below the 1.1300 support could spark a move below 1.1280. Any more losses might send the pair towards the 1.1220 level.
Looking at GBP/USD, the pair started a major increase above the 1.3480 and 1.3500 resistance levels. The next key resistance is near 1.3580.
Economic Releases
- Germany’s Manufacturing PMI for Dec 2021 - Forecast 57.9, versus 57.9 previous.
- Euro Zone Manufacturing PMI for Dec 2021 – Forecast 58.0, versus 58.0 previous.
- US Manufacturing PMI for Dec 2021 – Forecast 57.2, versus 57.8 previous.
Market Morning Briefing: Dollar Index Has Broken Below 96
STOCKS
Dow Jones has come down but the view remains bullish towards 37000, while above 36000. Dax has room to test 37000 on the upside before we see a rejection from there. Nikkei can fall down towards 28000-27500. Shanghai can test 3700 now. Nifty needs to break above 17400 to be bullish towards 17800 else a fall towards 17000 can be seen. Sensex, also has to rise above 59000 to test 60000.
Dow (36338.30, -59.78, -0.16%) has come down. The view is still bullish to see a test of 37000 before we see a top in place. Further rise above 37000, if seen, can take the index up towards 38000.
DAX (15884.86, +32.61, +0.21%) has risen again. The view is bullish to see a test of 16200 while above 15800.
Nikkei (28791.71, −115.17 , 0.40%) has come down today. The index has failed to sustain above 29000 and has come down. A fall back towards 28000-27500 is possible now.
Shanghai (3639.78, +20.59 , 0.57%) has bounced back from the support zone at 3600. The view is bullish to see a rise towards 3650-3700 in the near term.
Nifty (17354.05,+150.10, -0.87%) rose sharply on Friday. The index can face rejection at 17400 level. A sustained break above 17400 if seen on the flip side can take the index up towards 17800, else a fall towards 17000 can be seen.
Sensex (58253.82, +459.50 , 0.80%) also rose sharply but has resistance at 59000. A strong break above 59000 is needed for the view to be bullish towards 60000. Failure to break above 59000 can drag the index back towards 58000.
COMMODITIES
Crude prices have dipped a bit but may re-test immediate resistances before falling sharply. Gold has risen above 1820 and can head to 1850 or even higher while the upmove sustains. Silver can rise to 24.50/70 on a break above 23.50. Copper can rise to 4.60/65 on a break above 4.50.
Brent (78.08) and WTI (75.56) both have dipped a bit but can re-test immediate resistances near 81 and 78-79 respectively which if hold may produce a deeper fall in the coming sessions. Watch price action near mentioned resistances.
Gold (1827.80) has risen well breaking above 1820. The upmove needs to sustain to take it higher towards 1850 and further up towards 1870-1880 in the medium term. Watch price action on a rise to 1850.
Silver (23.20) has been rising over the past 2-sessions and a break above 23.50 can take it higher towards 24.50-24.70 on the upside which would be the next important resistance. View is bullish on a break above 23.5.
Copper (4.4515) rose last week to close above 4.40 but while below 4.50, we may expect a possible range of 4.50-4.30 to hold for the near term. Only a sustained break above 4.50 can take it higher towards 4.60/65 in the medium term.
FOREX
Dollar Index has broken below 96 and may test 95.50-95.00 on the downside before again bouncing to higher levels. Euro can rise to 1.14-1.1450 on a sustained trade above 1.1350. EURJPY can test 131-132 if continues to rise from current levels. Aussie and Pound has limited scope on the upside for the near term. USDJPY has risen well and a break above 115.50 is needed to take it higher towards 116-117-118 in the longer run. USDCNY has fallen sharply and can test 6.35 before bouncing from there. USDINR can test 74.50/74.80 while above 74.
Dollar Index (95.877) broke below 96 on Friday but is holding above 95.50. a possible test of crucial support near 95 is possible before the index rises higher towards 96-97 again in the medium to long term. View is bearish towards 95 in the next few sessions.
Euro (1.1346) has fallen from 1.1386 seen on Friday. The rate had risen above 1.1350 but fell back as it could not sustain at higher levels. We may see a bounce from immediate support at 1.1320 which if seen can take the Euro higher again towards 1.14-1.1450 on the upside. Watch price action near 1.1320 on a fall from current levels.
EURJPY (130.754) trades above 130 and if it sustains to move up further, a test of 131-132 can be possible soon.
Aussie (0.7252) has dipped today but has scope to rise to 0.73-0.7325 before falling off from there. Overall view is bearish while below 0.7350.
Pound (1.3503) had also risen well on Friday but has come off today. A test of 1.36 is possible in the near term before seeing a deeper correction from there.
Dollar-Yen (115.26) has risen above 115 and could be soon headed towards 116-117-118 on the upside on a sustained break above 115.50 which is an immediate resistance above current levels.
USDCNY (6.3521) fell sharply to test 6.3374 on the downside before bouncing slightly higher today. While below 6.37, view is bearish towards 6.35. Any break below 6.35 if seen can be indicative of a sustained downfall in the pair.
USDINR (74.3350) bounced back sharply from 74.09 on Friday and seems to sustain to rise further towards 74.60/80 on the upside before facing any rejection. We may expect a dip from anywhere between 74.50/60-74.80 region.
INTEREST RATES
The US Treasury yields manage to sustain higher. A break above the immediate resistances can take them towards the upper end of their respective range. The German yields have moved up sharply and are keeping our bullish view intact. The 10Yr GoI is stuck in a narrow range while the 5Yr GoI looks vulnerable for a fall in the near-term.
The US 2Yr (0.73%), 5Yr (1.26%), 10Yr (1.51%) and the 30Yr (1.90%) Treasury yields manage to sustain higher. View remains the same. A break above 1.53% (10Yr) and 1.93% (30Yr) can take the yields up towards 1.6%-1.65% (10Yr) and 2% (30Yr) in the coming days. We retain our view of seeing a broad sideways range of 1. 3%-1.65% on the 10Yr and 1. 7%-2% on the 30Yr for some time.
The German 2Yr (-0.65%), 5Yr (-0.47%), 10Yr (-0.19%) and 30Yr (0.19%) have moved up sharply across tenors. Our bullish view of seeing a rise to -0.1%/-0.05% on the 10Yr and 0.25%-0.30% on the 30Yr remains intact.
The Indian 10Yr (6.4537%) GoI has been stuck between 6.44% and 6.5% over the last few days. A breakout on either side of this range will decide whether the yield can go up to 6.54%-6.56% or fall to 6.4% in the near-term.
The 5Yr (5.7905%) GoI has declined sharply on Friday and looks vulnerable for a fall to 5.74% in the near-term.
DATA TODAY
5:00 10:30 IN Manf PMI
...Kshitij Expn 57.4 ...Previous-57.6
8:30 14:00 CH PMI
...Kshitij Expn 64.3 ...Expected 61.2 ...Previous 62.5
9:00 14:30 EU PMI
...Previous -58.4
Data released yesterday:-
No Major data released on Friday.
Elliott Wave View: USDCAD Shows Bullish Sequence
The Fed has indicated that they plan to continue to taper and start raising interest rates from near zero to curb the strongest inflation in four decades. A hawkish Fed, if followed through in action, may support in USD at least in the short term.
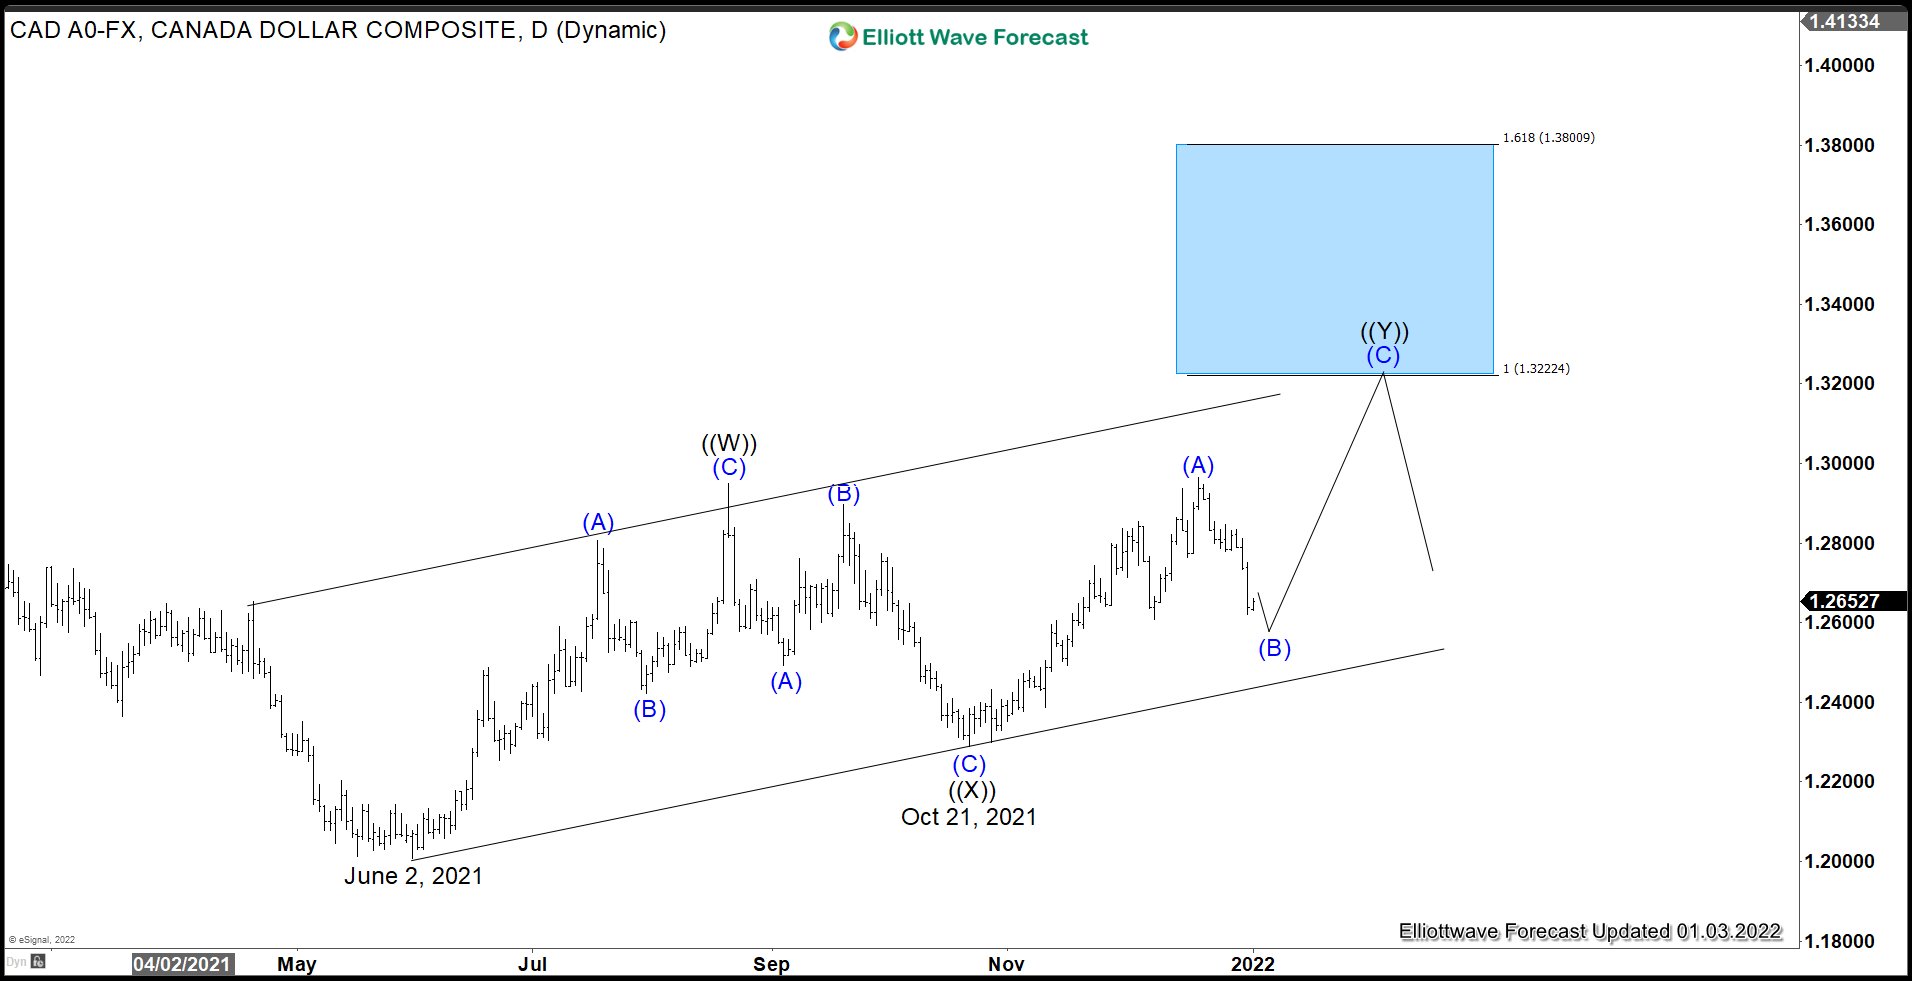
USDCAD Daily Chart
$USDCAD Daily Chart above shows an incomplete sequence from June 2, 2021 low favoring more upside. The rally from June 2 low can be counted as a double zig zag Elliott Wave structure. Up from June 2 low, wave ((W)) ended at 1.2949. Internal of wave ((W)) is unfolding as a zigzag where wave (A) ended at 1.2807, wave (B) ended at 1.2422, and wave (C) ended at 1.2949. Pullback in wave ((X)) ended at 1.2288 with internal unfolding as a zigzag. Down from wave ((W)), wave (A) ended at 1.249, wave (B) ended at 1.289, and wave (C) of ((X)) ended at 1.2288. Wave ((Y)) is in progress as a zigzag structure. Up from wave ((X)), wave (A) ended at 1.296. As far as wave (B) pullback holds above October 21, 2021 low (1.2288), expect the pair to continue higher.
USDCAD 1 Hour Chart
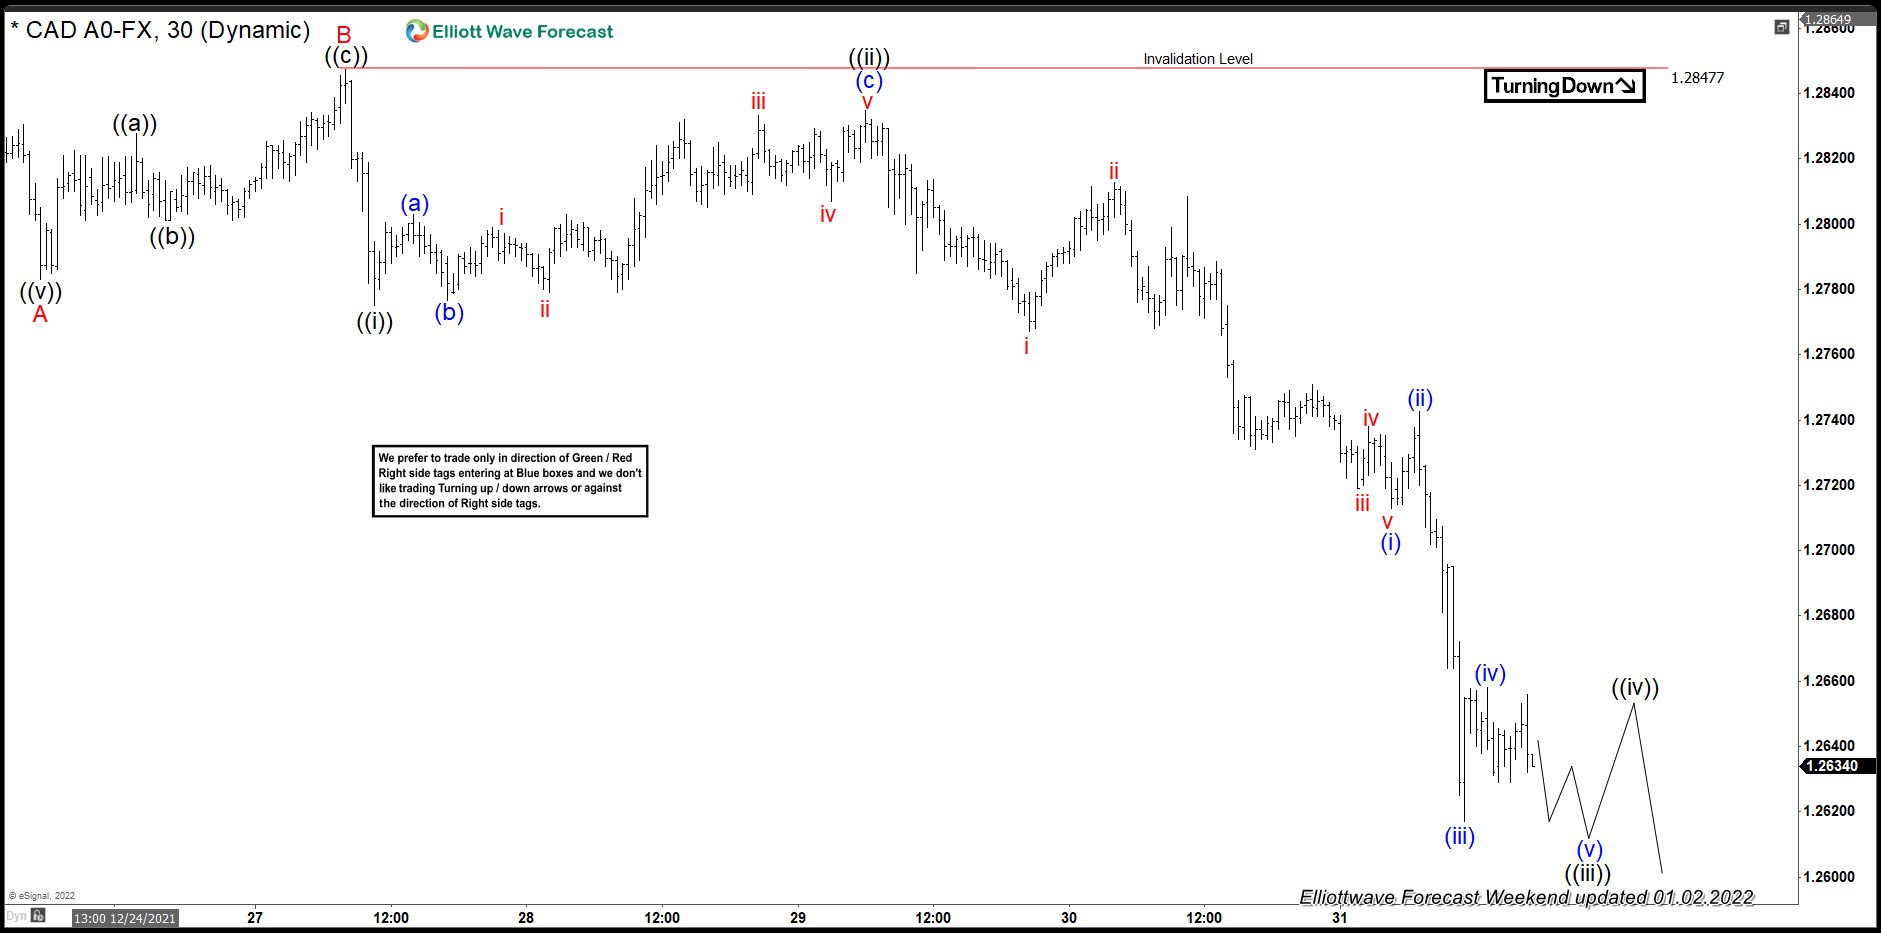
1 hour chart of USDCAD above shows that as far as it stays below 1.2847, the pair could see further downside before ending wave ((v)) of C. The pair has currently reached the 100% Fibonacci area from December 20, 2021 high which comes at 1.254 – 1.266. It can soon see support for more upside or a 3 waves rally at least.