

Sample Category Title
Pound Dips Below 1.35, Omicron Surges
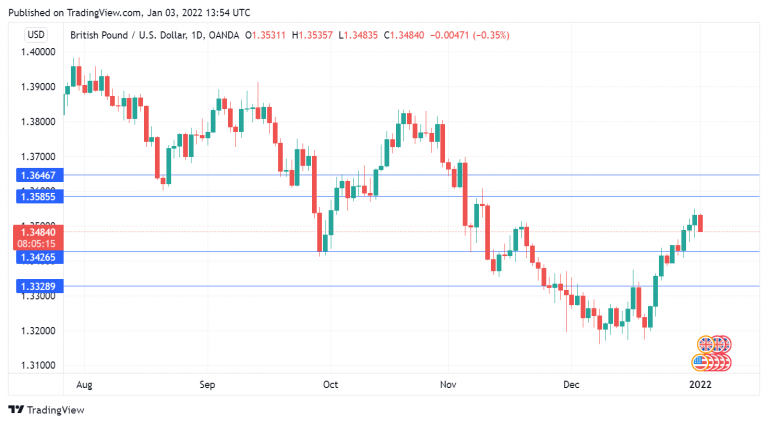
The British pound has started the New Year in negative territory. GBP/USD has dipped just below the symbolic 1.35 level.
Pound benefitting from strong risk appetite
The British pound ended 2021 with a winning week, gaining 1.03%. It was the second week in a row in which GBP/USD gained over 1%, as the risk-sensitive pound continued to make inroads against the safe-haven US dollar. On Thursday, GBP/USD rose to 1.3520, its highest level since November 10th.
The catalyst driving the pound’s rally has been strong risk appetite, which hasn’t waned despite the explosion in the number of Omicron cases. The UK has been setting new records of Covid-19 cases as Omicron rages, and a government study estimates that 1 in 10 people in London is infected with Covid. The markets have remained optimistic, noting that Omicron is less severe than previous variants of Covid, but there are concerns that Omicron could lead to a huge strain on hospitals. Meanwhile, industries and transport networks are reporting staff shortages as sick workers self-isolate, which will weigh on activity in the services sector.
The government has not introduced new health restrictions, but that could change if hospitalisation rates move higher. Prime Minister Boris Johnson will deliver an update on restrictions later today, and his comments could move the pound. If the government does announce new restrictions, investors could react negatively and extend the pound’s losses.
After a light economic calendar during Christmas week, there are key events on both sides of the pond this week. The markets will get a look at PMIs in both the US and the UK, and the US releases nonfarm payrolls at the end of the week. The December NFP is expected to jump to 400 thousand, up from 210 thousand in November.
GBP/USD Technical Analysis
- GBP/USD has support at 1.3426 and 1.3329
- There is resistance at 1.3585 and 1.3647
Euro Edges Lower as German PMI Misses Mark
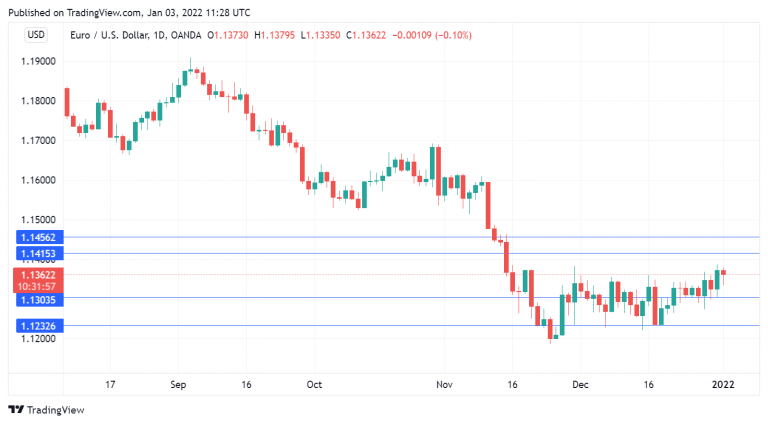
Welcome to the first trading day of 2022! The euro is slightly lower in the European session, trading around 1.1350.
German Manufacturing PMI misses consensus
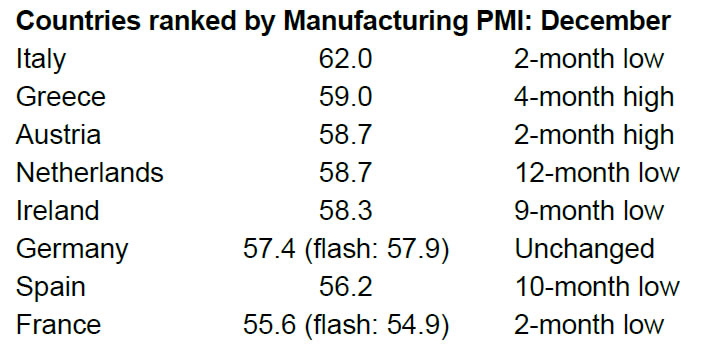
Eurozone Manufacturing PMIs for December pointed to growth across the bloc. France and Italy beat the consensus, while Spain and the all-eurozone PMIs were within expectations. The one disappointment was Germany, which came in at 57.4. This missed the forecast of 57.9 and was down from the November reading of 57.9. Supply constraints have hampered Germany’s manufacturing sector and the pace of expansion has slowed significantly since the summer of 2021, when we were seeing readings in the mid-60s.
Germany will release Retail Sales on Tuesday. This key gauge of consumer spending has struggled, posting back-to-back declines. Another decline in December would raise a red flag and investors could sour on the euro.
Omicron cases continue to skyrocket, and although it is considered milder than other Covid variants, the sheer number of infected people is putting a heavy strain on health care systems worldwide. The US, Greece and other countries have shortened their isolation periods for infected people, and this could help cushion the economic blow from Omicron.
We are likely to see a surge in Omicron cases in the coming weeks, but the critical question for the markets is how sick are those people who are infected. Market sentiment has been high despite the soaring numbers, on the assumption that Omicron is not as severe as previous variants and will not cause a severe economic downturn. If we don’t see a surge in hospitalisation rates and a return to lockdowns, I would expect risk sentiment to remain elevated.
EUR/USD Technical
- EUR/USD has support at 1.1303. Below, there is support at 1.1232
- There is resistance at 1.1456 and 1.1415
EUR/USD May Shift Back to the Downside: Elliott Wave Analysis
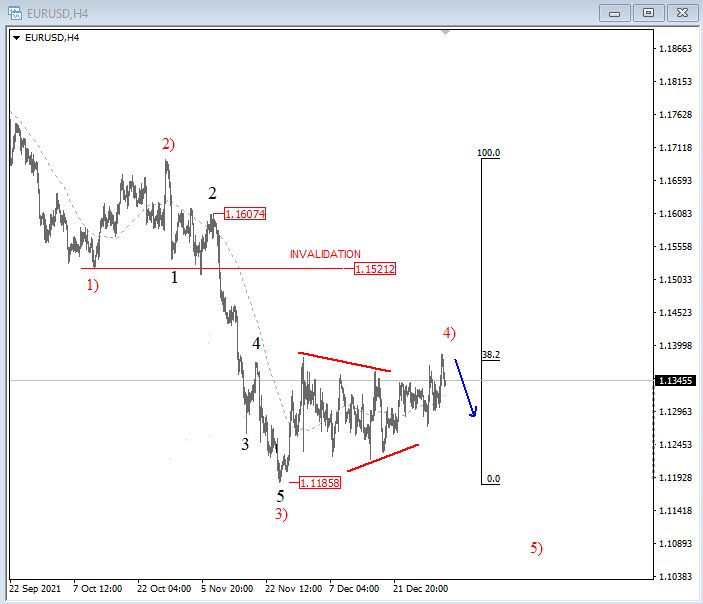
EURUSD was higher recently, but not much. Pair slowed down again very quickly around 1.14 level which we see it as a very strong resistance.
On 4h chart, EURUSD stabilized after a sharp sell-off from 1.1600 that we see as an extended wave 3) that belongs to the ongoing bearish impulse which may resume after a current rally.
We see the current slow price action as wave 4), now at 38.2% Fibonacci level resistance where pair may shift back to the downside this month. Break below 1.1250 will make a room for a fifth wave move back below 1.1185.
EUR/USD 4h Elliott Wave analysis
Dollar and Stocks Advance as New Year Kicks Off
- Dollar begins year on front foot, equities hover near highs
- Omicron, inflation, central banks, and politics in the spotlight
- Quiet day ahead but rest of the week seems promising
Dollar advances in thin markets
Happy new year to everyone. The quiet tone that characterized trading last week has carried over, with limited moves in most assets to kick off the new year. Liquidity is still in short supply as several investment hubs in Asia and Europe remain shut for holidays. News flow has also been exceptionally light, leaving investors little to go on.
The Omicron variant is spreading like wildfire but hospitalizations remain under control and most governments seem wary of going back to lockdowns, feeding optimism that this wave won’t inflict much damage on the global economy.
This cautious sense of relief is being reflected across financial markets today. Crude oil prices are on the rise, European equities are a sea of green, while the defensive Japanese yen is on the ropes. That said, all these moves are relatively minor as traders await the next big theme.
What will drive markets this year?
After a year when the US dollar sliced through the forex arena and the S&P 500 returned an astonishing 27% without any real drawdowns, it is useful to consider whether the same trends can persist moving forward.
Overall, the driving forces for markets this year might be how aggressively central banks normalize monetary policy, when inflation will peak, and politics ahead of the French presidential election and the US midterms.
For the dollar, it may be a year of two halves. The reserve currency could perform well early on but then lose its shine as ‘peak inflation’ dampens expectations for powerful Fed rate increases and the Republicans retake control of Congress, blocking spending initiatives and cooling US yields.
For equities, it may be a year characterized by volatility. Central bank stimulus acts like a volatility compression mechanism, so with liquidity now being withdrawn from the financial system while asset valuations are so high, volatility episodes could become a more frequent phenomenon. The overall trajectory is still positive, but it is unlikely to be smooth sailing like last year.
Gold remains elevated, quiet day ahead
Market participants seem to be warming up to gold once again. The precious metal briefly topped $1830 per ounce before pulling back earlier today, extending a rally that began in mid-December.
The December-January period is historically very strong for bullion, which has gained in 8 out of the last 10 Januaries. Beyond favorable seasonal patterns, the minor retreat in the dollar last month and tensions around Ukraine likely played a role too as investors hedged geopolitical risk.
As for today, there isn’t much on the economic calendar. Markets will remain closed in the United Kingdom and Canada, so trading volumes will remain thinner than normal.
Thankfully, the rest of the week promises to be more exciting with a barrage of crucial data releases including the US employment report for December, the minutes of the latest FOMC meeting, and a monthly output decision from OPEC
Volatility Return is the Safest Bet for 2022
Global equity markets had another fabulous year in 2021 with investors gaining double digit growth on their invested capital helped by continued fiscal stimulus, loose monetary policies, high levels of savings during the pandemic, a robust economic recovery, and most importantly solid corporate earnings.
The MSCI World Index ended the year 20.1% higher compared to 14.1% gains in 2020 and enjoyed their third best performance in 10 years. US equities were the major contributor to the solid performance as the S&P 500 rallied 26.9% led by energy stocks, real estate, and megacap tech firms like Alphabet, Apple, and Microsoft.
The outlier in 2021 was the Hang Seng Index which dropped 14.1%, as China took harsh regulatory measures against the education and tech sectors, forcing investors away from these stocks. However, many may become attracted again to these beaten down sectors given how cheap their valuations are now compared to other markets.
2022 will hopefully be the year of normalisation, in which the pandemic comes to an end, and people return to normal lives. Most investment banks remain bullish on equities but expect returns to be single digit or low double digit in percentage terms. The three major risks to the bullish forecasts are new, deadlier coronavirus variants, rampant inflation and monetary policy tightening more than expected, and further crackdowns in China.
Covid-19 cases have been on the rise recently, but the latest variant, “Omicron”, is not the same disease we experienced in the past. Death rates remain low despite the very high transmissibility. If that’s the trend going forward, we may be approaching the end of the pandemic, but it is probably too early to judge. Confidence can still be shaken if new variants evolve and lead to renewed supply chain disruptions and a further rise in the cost of goods. Investors will still need to closely monitor how the pandemic plays out in the upcoming few months.
Tightening monetary policy is another headwind investors should be aware of. It is the pace of tightening which is the wild card and a lot will depend on inflation. US Fed policymakers expect interest rates to rise three times in 2022 after the bond purchase program ends in March. Those interest rates hikes will keep rates below 1% in 2022 which is relatively low to historic averages, but it’s happening at a time where a lot of debt has been incurred and there is a large amount of leverage in the system.
The spread between the US two- and 10-year Treasury notes is already below 80 basis points, having flattened more than 50% since March, suggesting that a recession may not be far away. If inflation fails to fall back and the Fed speeds up the tightening cycle, we’re likely to see the curve invert and hence lead to some sort of panic selling in equities. That’s why it will be very important to monitor inflation trends over the next several months.
In such a changing environment, it is corporate profits and consumer spending that needs to pick up the slack for equities to continue heading north. However, with many assets looking overvalued compared to historic measures and several potential risks in the air, expect volatility to pick up significantly as we go through the year.
Gold Loses Steam after New 6-Week High; Bias Bullish
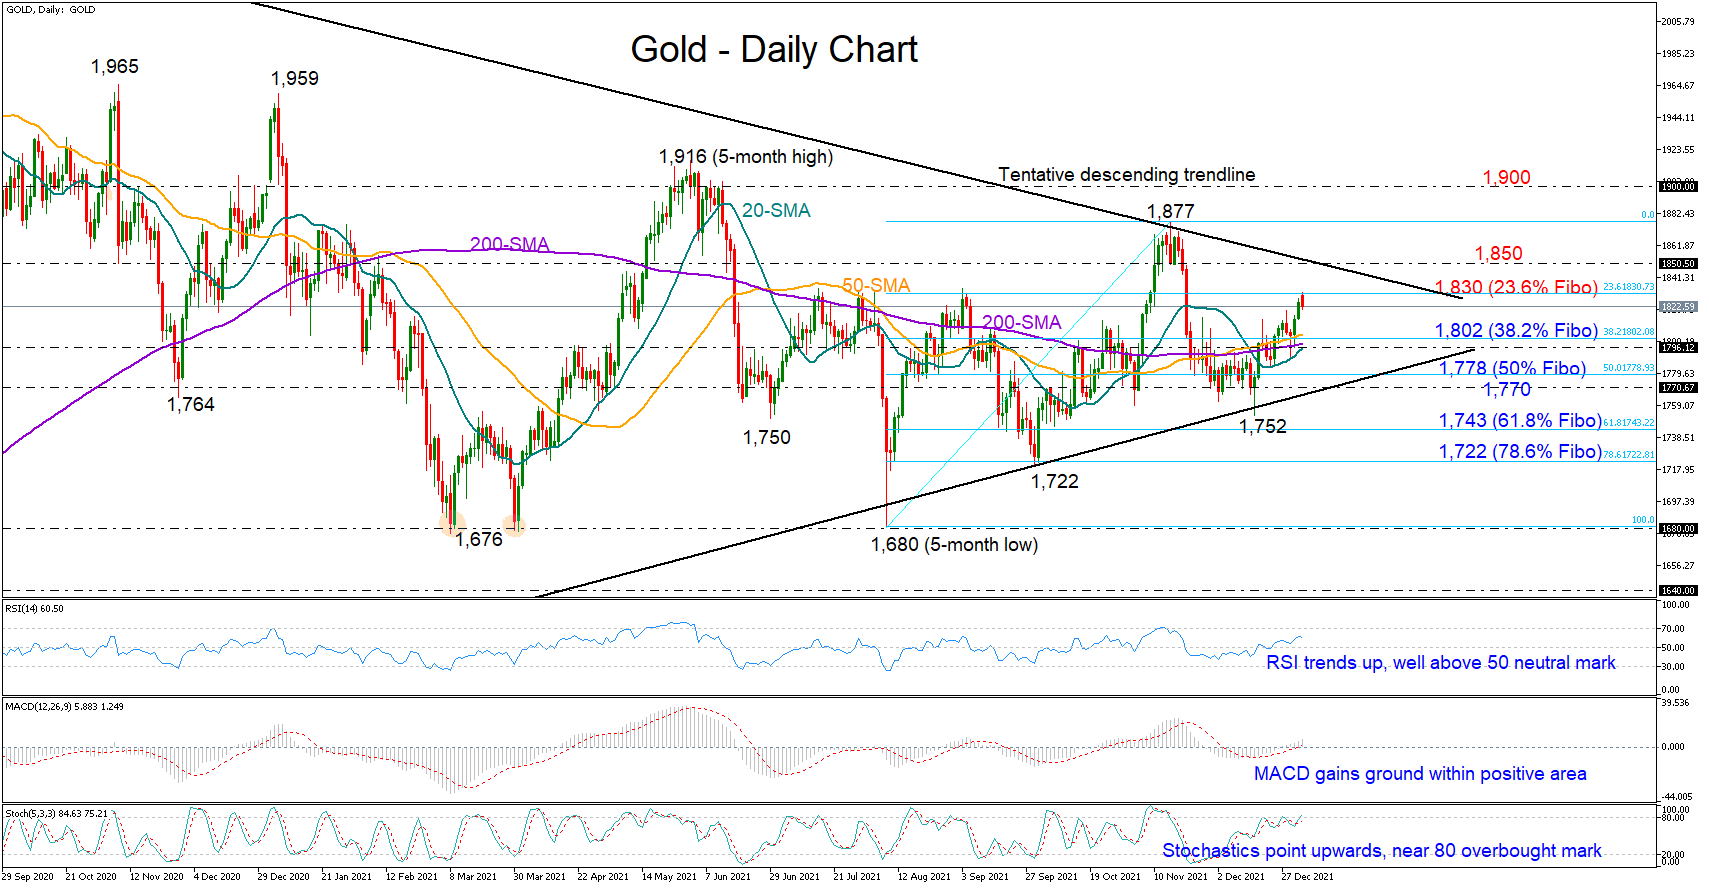
Gold marked a fresh six-week high of 1,831 in the first trading hours of 2022 before turning negative on the day.
The pullback commenced near the 23.6% Fibonacci retracement of the latest upleg (1,680 – 1,877), but looking at the momentum indicators, the current weakness in the price is not a big concern yet. The RSI continues to trend upwards well above its 50 neutral mark, the MACD is gaining strength above its signal and zero lines, and the Stochastics are pointing northwards again after a short consolidation phase, all reflecting a bullish bias.
If the precious metal resumes its positive momentum above the 1,830 border, all attention will turn to the tentative descending trendline drawn from the record high of 2,079, at 1,850. A decisive close above that line could see an acceleration towards the 1,877 peak. Yet, for the bulls to reach the 2021 top of 1,959, and hence upgrade the medium-term picture back to positive, they will first need to clear the 1,900 – 1,916 ceiling.
In the bearish scenario where the price dives below the 1,800 floor and closes below its simple moving averages (SMAs), the decline could stretch towards the 50% Fibonacci of 1,778 and the 1,770 support area. An ascending trendline (drawn from the March 2020 lows) is passing through this zone. Therefore, another correction lower from here could see a continuation towards the 1,743 – 1,722 territory. Should the sell-off gain extra legs, the five-month low of 1,680 could come next under the spotlight.
In brief, despite today’s fragility, gold could preserve buying interest. A significant break above the 1,830 – 1,850 bar could bring new buyers into the market.
USDJPY Faces Downside Risks; Overall Bullish Outlook Remains
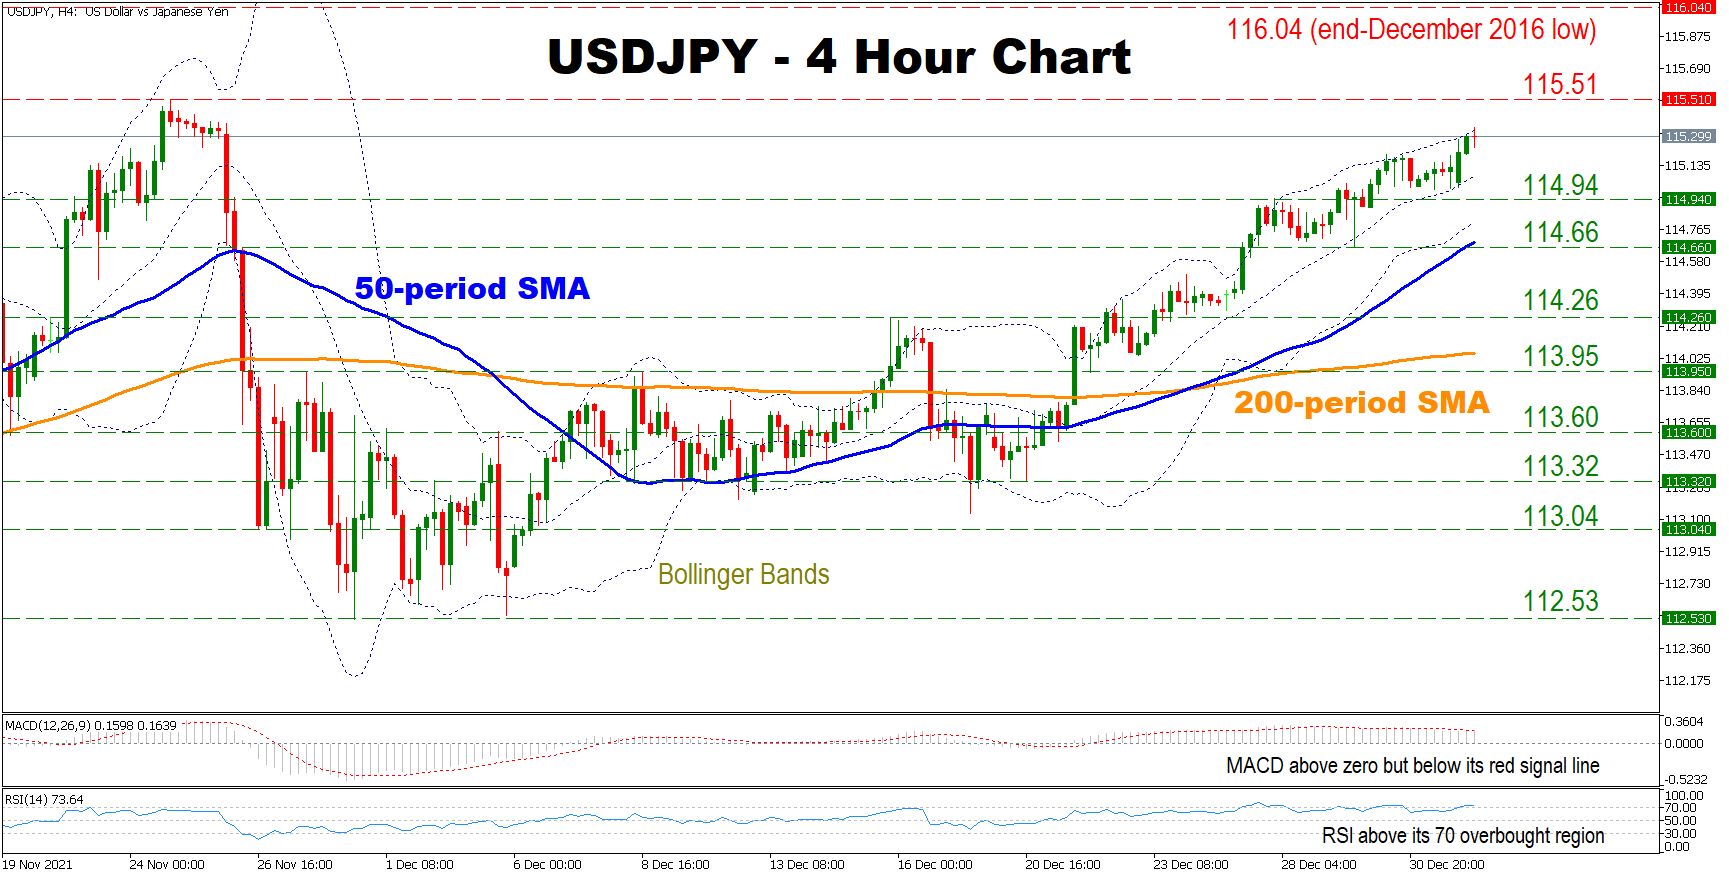
USDJPY has powered back from its December low, crossing above the 50- and 200-period simple moving average (SMA). Moreover, the 50-period SMA has crossed above the 200-period SMA, reviving hopes of a sustained bullish outlook. However, the pair is currently trading near its upper Bollinger Band, indicating that an immediate downward movement should not be ruled out.
Short-term momentum indicators are supporting a negative bias as the RSI is located above its 70 overbought region, signalling that an imminent pullback is not out of the equation. Also, the MACD is found above zero but below its red signal line, which could indicate that the recent positive bias might be losing steam.
Should the bulls maintain control, initial resistance might be found at the 115.51 level. Crossing above that point could strengthen the pair’s positive momentum, opening the door towards the end-December 2016 low at 116.04, before buyers shift their attention towards the 2016 mid-December low at 116.54.
On the flip side, if the price breaks below the 114.94 level, immediate support might be found at the region which includes the 50-period SMA and the 114.66 obstacle. A decisive move below the latter could pave the way towards the 114.26 hurdle, before sellers eye the 200-period SMA currently found at 114.05.
In brief, the overall outlook for the pair is bullish despite touching its upper Bollinger Band, which raises the immediate risk to the downside. For sentiment to change, sellers would need to drive the price below the 50-period SMA.
EURUSD Kicks Off a Depressing Start to 2022
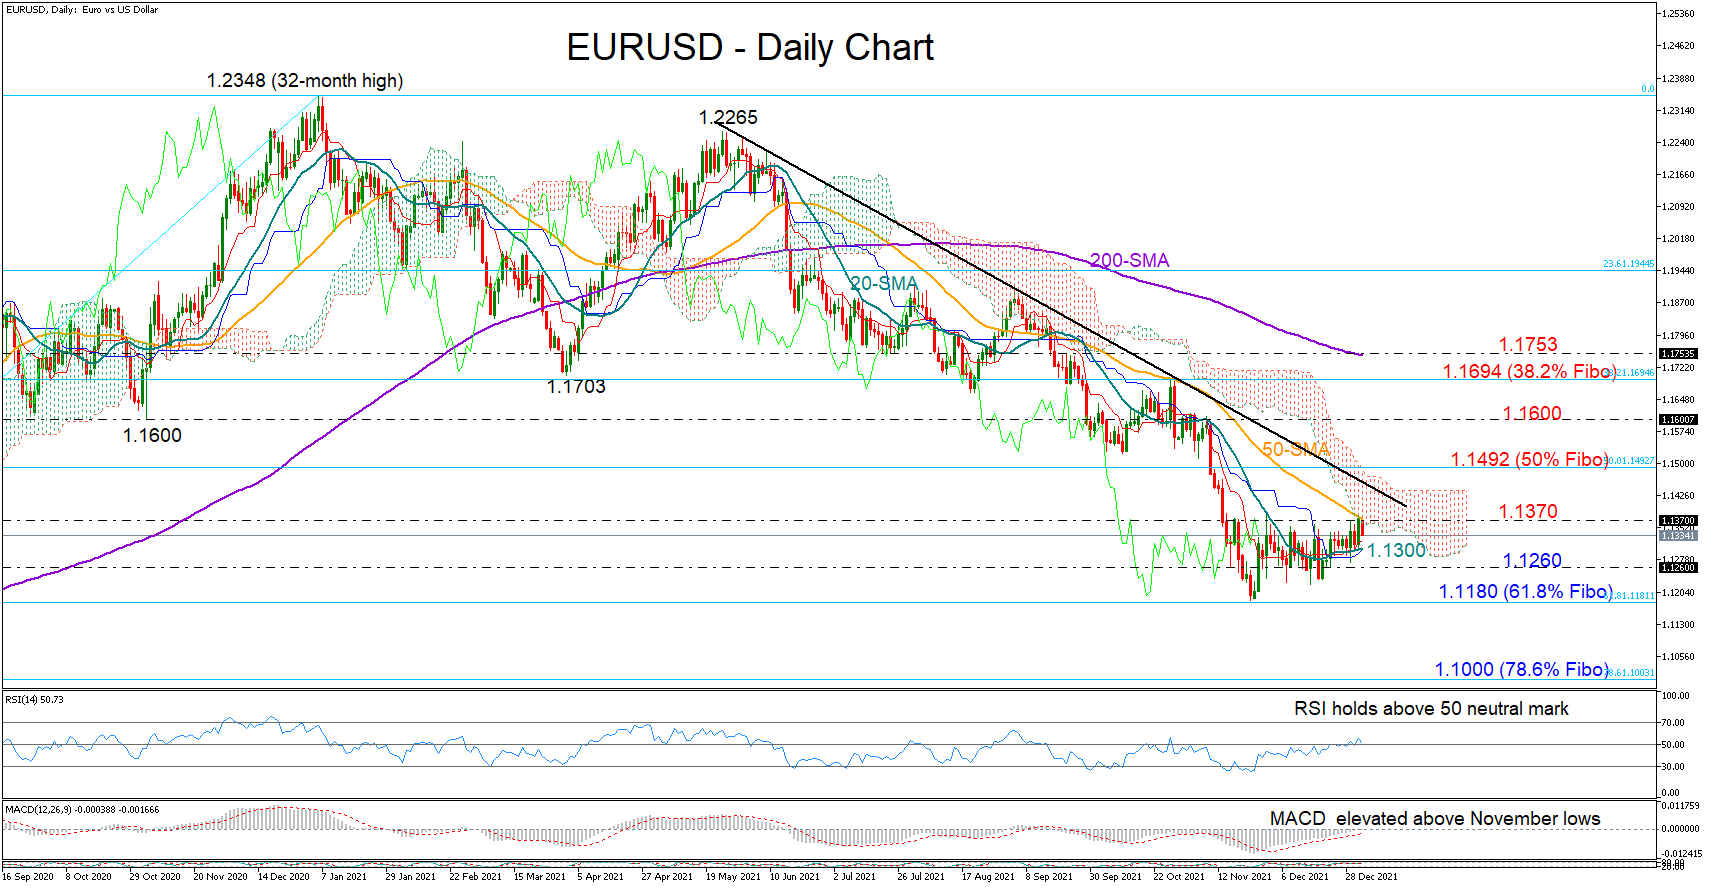
EURUSD opened on the negative side in the first trading day of 2022, unable to crawl above the 1.1370 resistance and the 50-day simple moving average (SMA) despite Friday’s last-minute pickup.
The momentum indicators, however, continue to reflect a neutral-to-bullish bias, signaling the bulls may not abandon the battle yet. With the MACD remaining elevated above its November lows, and set to enter the positive territory, and the RSI having extended its uptrend above its 50 neutral mark, there is an opportunity for further recovery. Note that the red Tenkan-sen and Kijun-sen lines have maintained their recent positive intersection, suggesting buying pressures are still present.
Beyond the 1.1370 border, there is another tough wall that the bulls need to crack to raise buying confidence in the market. That is, the descending trendline stretched from May’s peak of 1.2265 currently seen around 1.1446. Should it give way, the price could initially test the 50% Fibonacci retracement of the 2020 rally (1.0636 -1.2348) at 1.1492 before speeding up to the 1.1600 psychological mark.
In case the current weakness persists, the 20-day SMA could buffer the drawdown around 1.1300, while a bit lower, the 1.1260 support area could prevent a return to the 1.1180 bottom. Beneath the latter, which overlaps with the 61.8% Fibonacci, there is no major support until the 1.1000 number.
Summarizing, EURUSD could not stage an impressive start to 2022, but hopes for progress remain alive. A sustainable move above the 1.1446 – 1.1492 area could trigger the next bullish wave.
Intraday Market Analysis – USD Seeks Support
USDCHF tests daily support
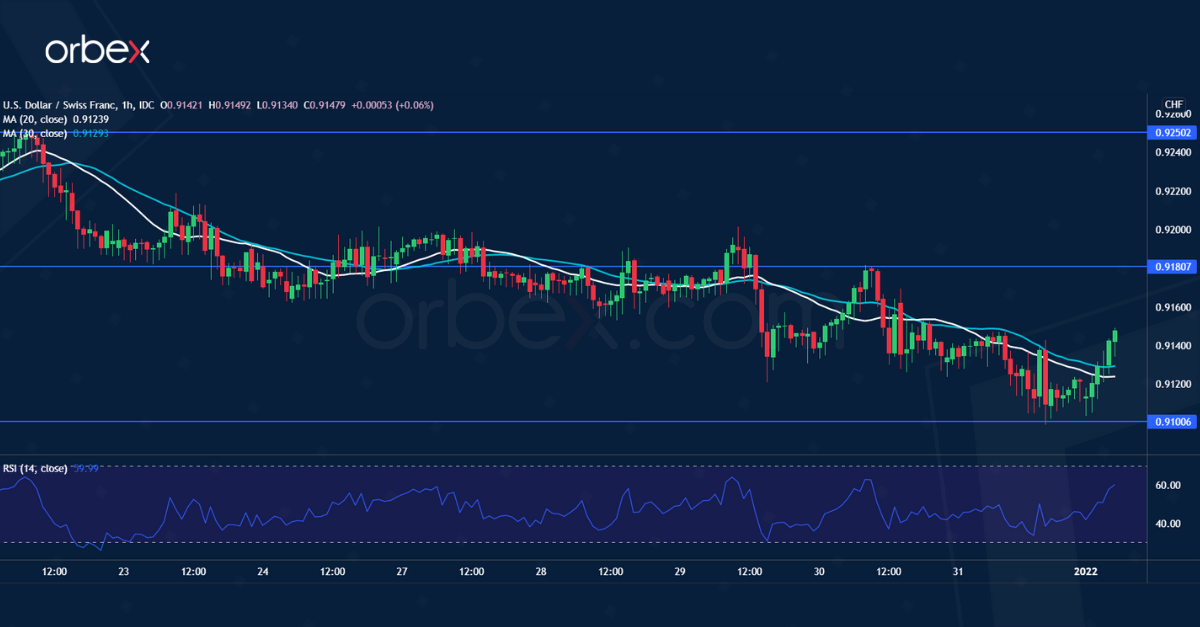
The US dollar softens over increased risk appetite. A drop below the lower band of the consolidation range at 0.9160 confirms a lack of interest in the greenback.
The pair is testing the major demand zone around 0.9100 from the daily chart. A bearish breakout could jeopardize the pair’s rebound over the past quarter. It could also trigger a sell-off towards the psychological level of 0.9000.
The bulls may be tempted to buy the dip. 0.9180 would be the first resistance to lift before they could turn the downbeat inertia around.
AUDUSD consolidates gains
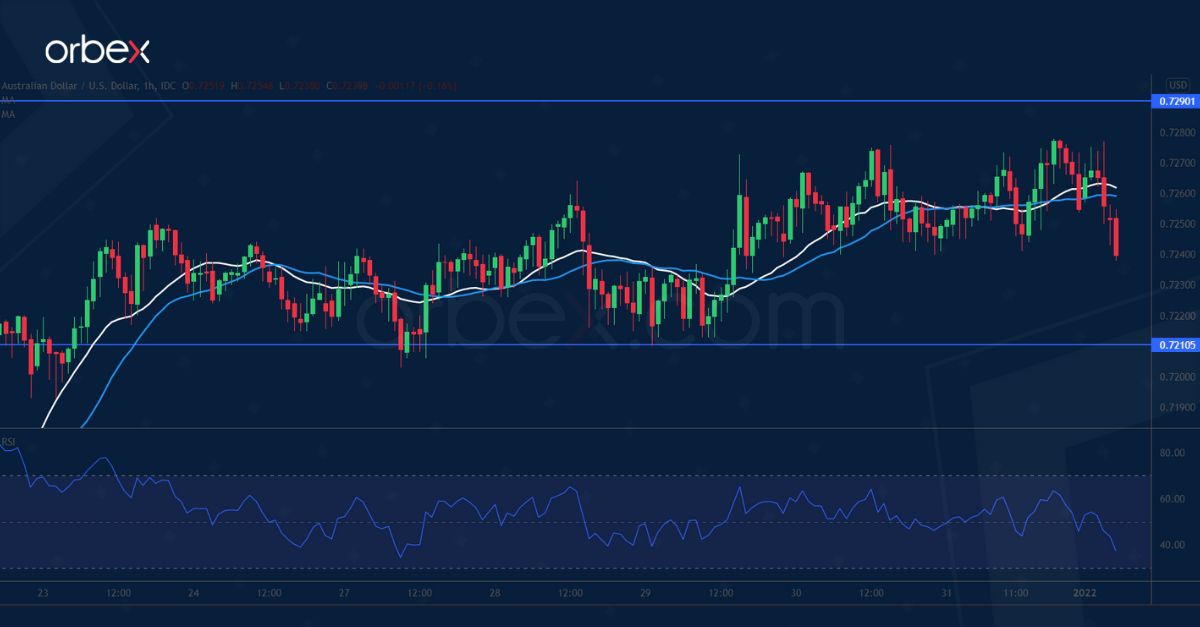
The Australian dollar finds support from rising commodity prices. A bullish MA cross on the daily chart indicates improvement in underlying sentiment.
The former supply zone between 0.7210 and 0.7220 has turned into a demand zone. Buyers may be eager to join the rally after the RSI returned to the neutrality area.
0.7290 is a fresh resistance, and a combination of profit-taking and fresh selling could temporarily weigh on the Aussie. 0.7120 is a second line of defense in case of a deeper retracement.
EURGBP falls below daily support
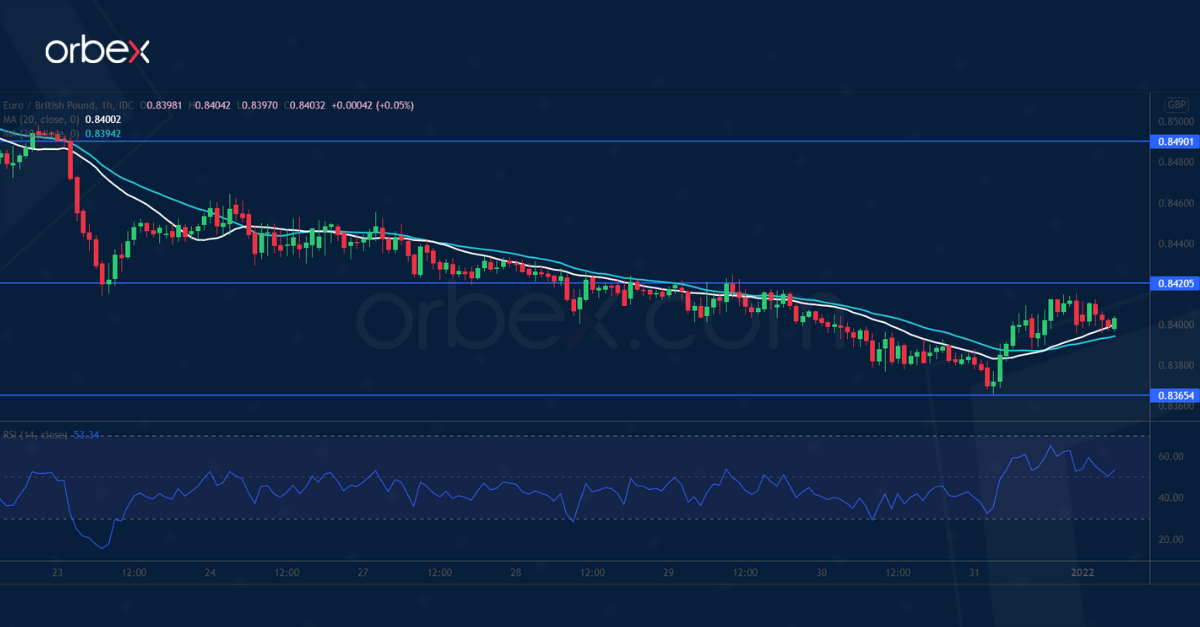
The pound outperforms the euro over diverging monetary policies. The break below the daily support at 0.8380 is an invalidation of the rebound in late November.
The RSI’s repeatedly oversold situation has attracted some buying interest, but not enough to sustain a meaningful bounce. 0.8420 is now a fresh resistance. And only its breach could prompt sellers to cover.
On the downside, 0.8365 is a fragile support. A breakout would further deteriorate sentiment and send the euro to February 2020’s lows near 0.8280.
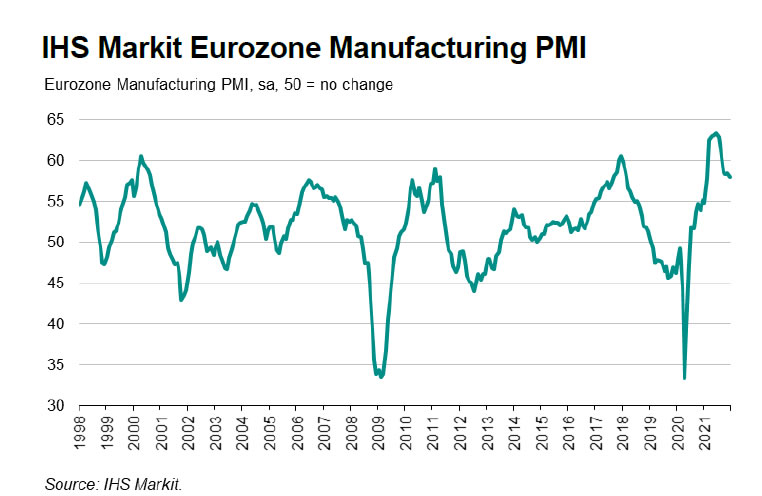
Eurozone PMI manufacturing finalized at 58.0 in Dec, alleviating supply chain pressures fed through to prices
Eurozone PMI manufacturing was finalized at 58.0 in December, down from November's 58.4. Markit said modest alleviation in supply pressures facilitated survey-record in crease in inventories. Broad sector growth growth continued to underwhelm while inflationary pressures receded slightly.
Joe Hayes, Senior Economist at IHS Markit said:
"It has been an incredibly challenging period for eurozone manufacturers this second half of 2021, but the latest survey data hasn't spoiled the festive cheer too much – we're seeing some tentative, but very welcome signs that the supply chain crisis which has plagued production lines all across Europe is beginning to recede. The Suppliers' Delivery Times Index increased for a second month in a row to its highest since February, signalling a weaker deterioration in vendor performance.
"Although what gains to be had were only marginal, with shortages, port congestion and transport issues still at large, PMI data showed stocks of purchases rising at a survey-record rate in December. This should hopefully bring some much-needed relief to production schedules in the very near-term, which have been squeezed tight by input shortages. That said, the latest survey data showed output growth remaining subdued overall and unchanged from November.
"Alleviating supply chain pressures also fed through to prices as input costs rose at the slowest rate since April. Easing inflation rates are again a welcome sign, but we're still in hot territory. We're now facing a fresh bout of economic uncertainty as the Omicron variant emerges in Europe. COVID-19-driven supply chain disruptions cannot be ruled out, and therefore neither can further spikes in inflation."