

Sample Category Title
USD/CAD Daily Outlook
Daily Pivots: (S1) 1.2658; (P) 1.2719; (R1) 1.2806; More...
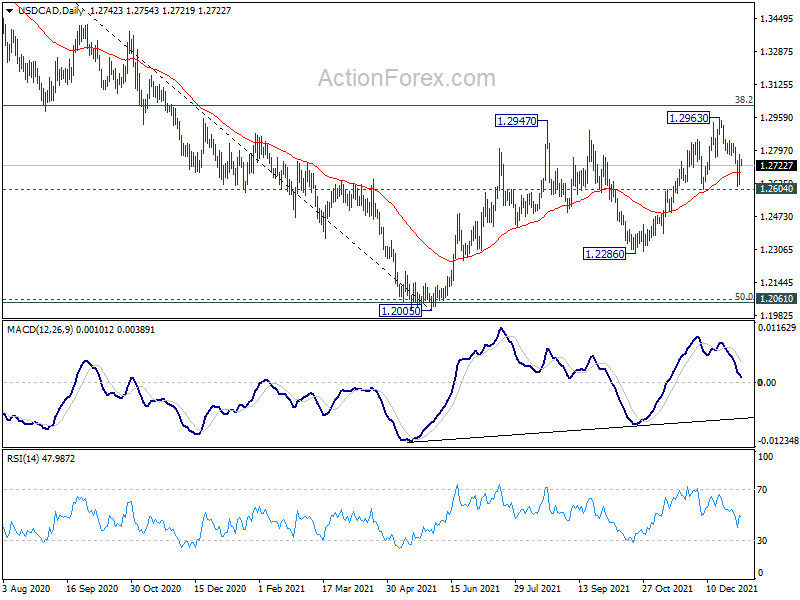
USD/CAD dropped sharply to as low as 1.2619, but recovered ahead of 1.2604 near term support. Intraday bias is turned neutral first. As long as 1.2604 support holds, we'd still slightly favor another rally. Break of 1.2963 will target 1.3022 key medium term fibonacci level. Sustained break of 1.3022 will carry larger bullish implications. However, firm break of 1.2604 will bring deeper fall back to 1.2286 support instead.

In the bigger picture, focus will be on 38.2% retracement of 1.4667 (2020 high) to 1.2005 (2021 low) at 1.3022. Sustained break there should confirm that the down trend from 1.4667 has completed after defending 1.2061 long term cluster support. Further rise would then be seen towards 61.8% retracement at 1.3650. On the downside, however, break of 1.2286 will turn focus back to 1.2005 low again.
AUD/USD Daily Report
Daily Pivots: (S1) 0.7158; (P) 0.7217; (R1) 0.7251; More...
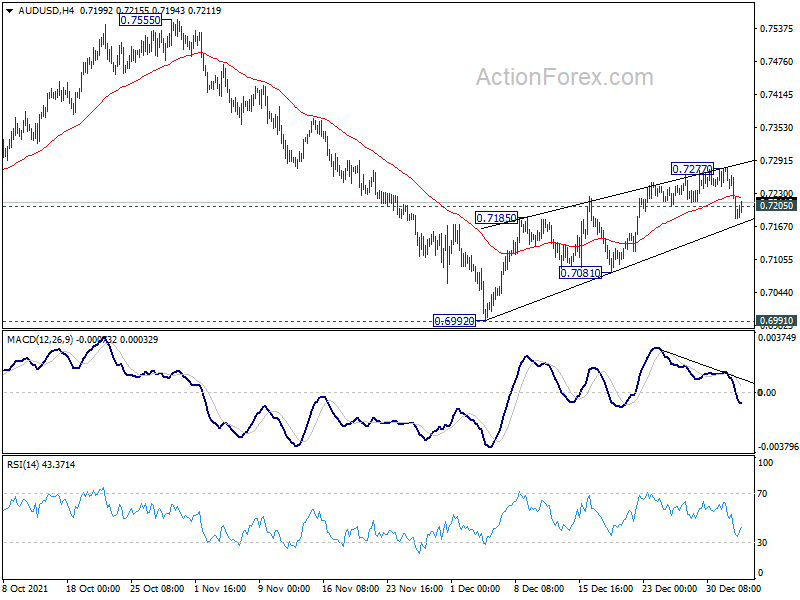
Intraday bias in AUD/USD is turned neutral first with break of 0.7205 minor support. On the upside, break of 0.7277, and sustained trading above 55 day EMA (now at 0.7236) will argue that fall from 0.8006 has completed at 0.6992, after defending 0.6991 support. Further rally would be seen to 0.7555 resistance for confirmation. However, break of 0.7081 support will revive near term bearishness and bring retest of 0.6991/2 key support zone.
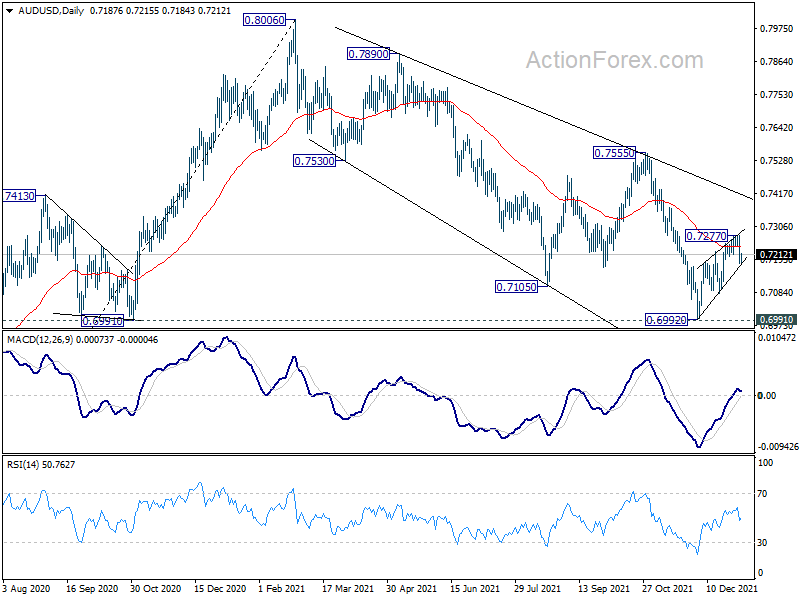
In the bigger picture, strong rebound from 0.6991 key structural support will retain medium term bullishness. That is, whole up trend from 0.5506 is still in progress. Firm break of 0.7555 resistance will target 0.8006 high and above. However, sustained break of 0.6991 will argue that the whole up trend from 0.5506 might be finished at 0.8006, after rejection by 0.8135 long term resistance. Deeper decline would then be seen back to 61.8% retracement of 0.5506 to 0.8006 at 0.6461.
EUR/USD Daily Outlook
Daily Pivots: (S1) 1.1259; (P) 1.1319; (R1) 1.1358; More...
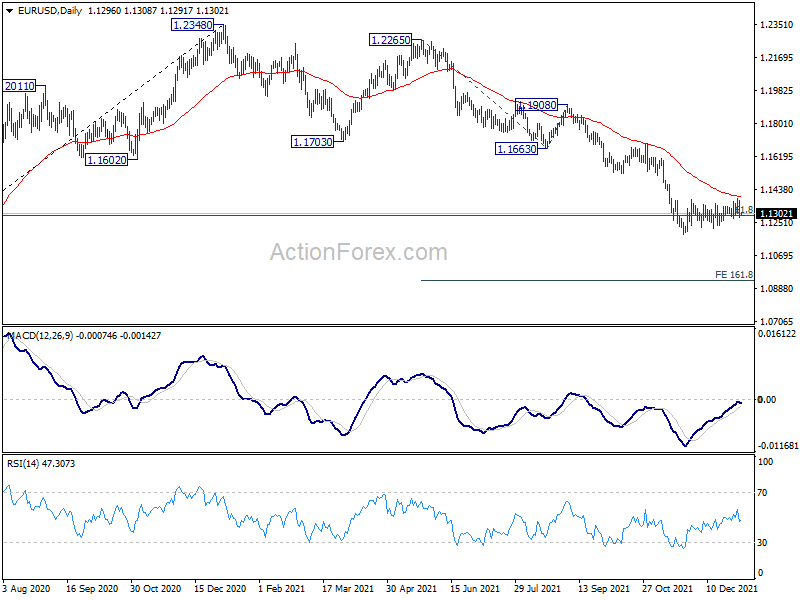
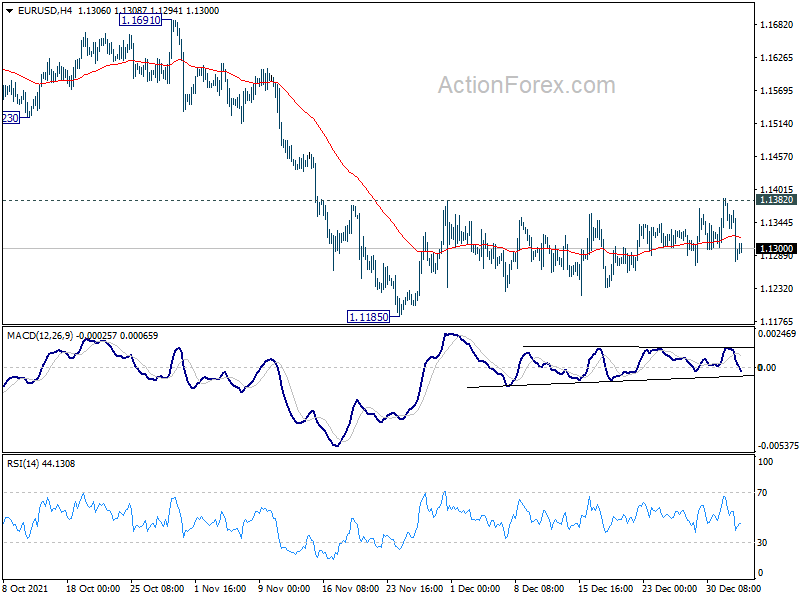
EUR/USD dropped sharply after failing to sustain above 1.1382 resistance, but stays in range above 1.1185. Intraday bias remains neutral first. On the upside, firm break of 1.1382 resistance will resume the rebound from 1.1186. Sustained trading above 55 day EMA (now at 1.1392) will bring stronger rise back to 1.1663 support turned resistance. On the downside, break of 1.1185 will resume larger decline from 1.2348. Next target is 161.8% projection of 1.2265 to 1.1663 from 1.1908 at 1.0934.
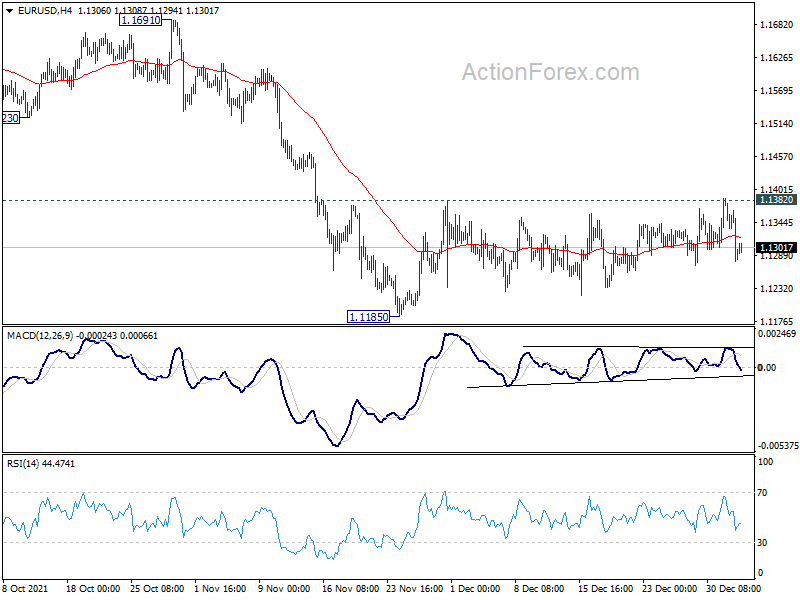
In the bigger picture, there are various ways of interpreting the fall from 1.2348 (2021 high). It could be a correction to rise from 1.0635 (2020 low), the fourth leg of a sideway pattern from 1.0339 (2017 low), or resuming long term down trend. In any case, outlook will now stay bearish as long as 1.1703 support turned resistance holds. Sustained break of 61.8% retracement of 1.0635 to 1.2348 at 1.1289 would pave the way back to 1.0635.
GBP/USD Daily Outlook
Daily Pivots: (S1) 1.3427; (P) 1.3483; (R1) 1.3534; More...
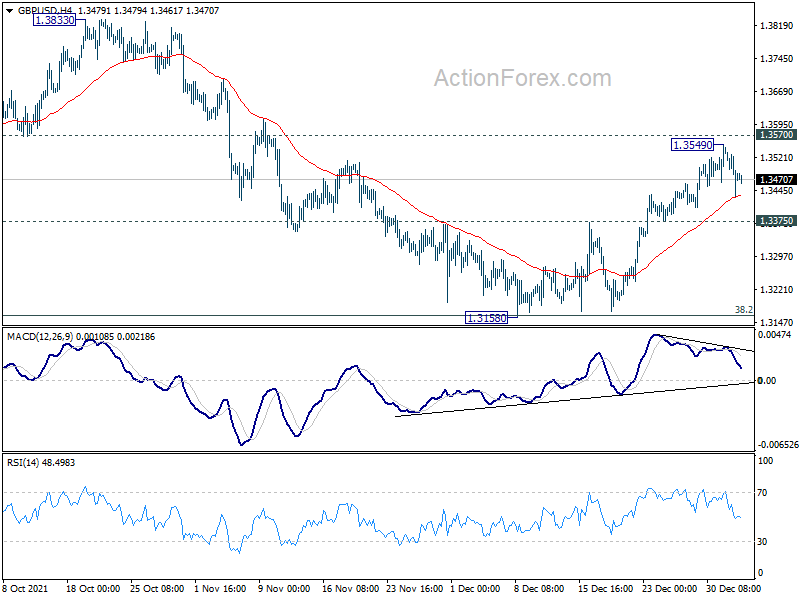
GBP/USD lost momentum and retreated after hitting 1.3549, ahead of 1.3570 support turned resistance. intraday bias is turned neutral first. we're seeing corrective fall from 1.4248 as complete with three waves down to 1.3158, after hitting 1.3164 medium term fibonacci level. Further rally is in favor as long as 1.3375 minor support holds. Sustained break of 1.3570 will l further affirm this bullish case and target 1.3833 resistance next. However, break of 1.3375 will turn bias back to the downside for 1.3158 low again.
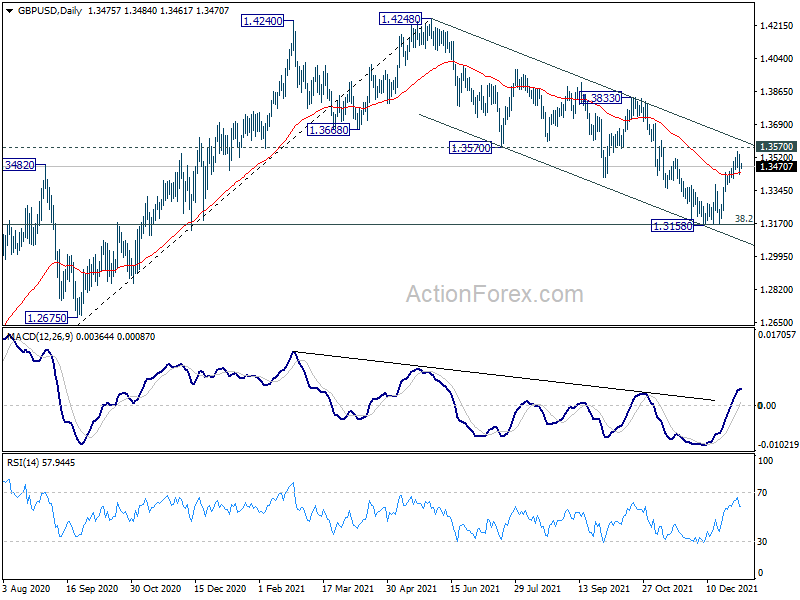
In the bigger picture, focus remains on 38.2% retracement of 1.1409 to 1.4248 at 1.3164. Sustained break there will argue that whole rise from 1.1409 has completed at 1.4248, after rejection by 1.4376 long term resistance. That will revive some medium term bearishness and and target 61.8% retracement at 1.2493. However, strong rebound from current level will revive argue that up trend from 1.1409 is still in progress, and probably ready to resume.
USD/CHF Daily Outlook
Daily Pivots: (S1) 0.9135; (P) 0.9167; (R1) 0.9222; More....
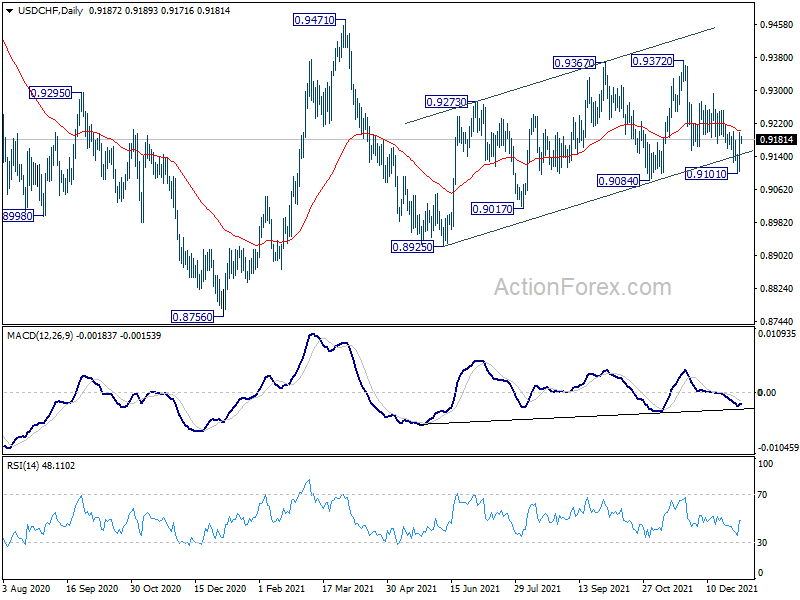
USD/CHF dipped to 0.9101 but rebounded ahead of 0.9084 support. Intraday bias is turned neutral first. On the upside, break of 0.9200 resistance will argue that fall from 0.9372 has completed with three waves down to 0.9101. Intraday bias will be back on the upside for 0.9372 resistance. On the downside, sustained break of 0.9084 support should confirm that choppy rise from 0.8925 has completed, and suggests that fall from 0.9471 is resuming. Deeper decline would be seen through 0.8925.
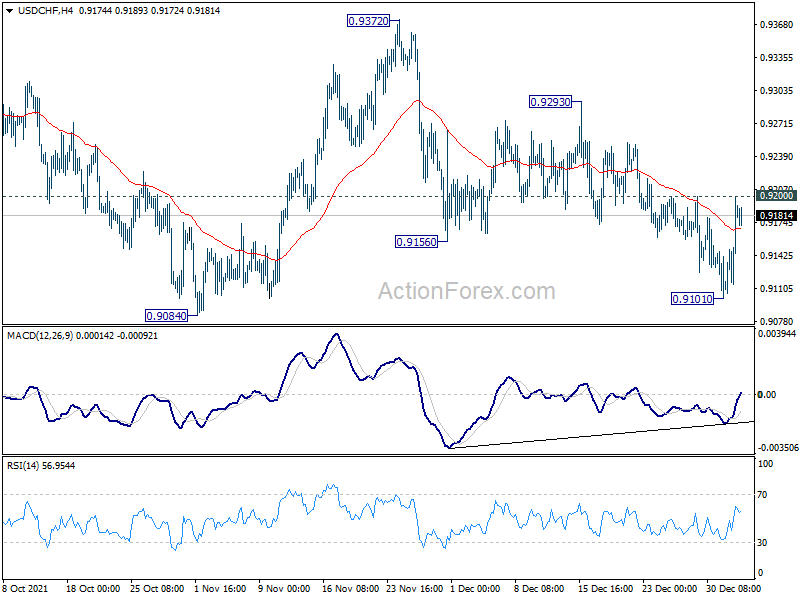
In the bigger picture, the corrective structure of the rebound from 0.8925 argues that fall from 0.9471 is not complete yet. It could either be the second leg of pattern from 0.8756 (2021 low), or resuming larger down trend from 1.0237 (2018 high). We'd pay attention to the downside momentum and assess the odds later. But for now, medium term outlook will be neutral at best as long as 0.9471 resistance holds.
USD/JPY Daily Outlook
Daily Pivots: (S1) 115.08; (P) 115.22; (R1) 115.50; More...
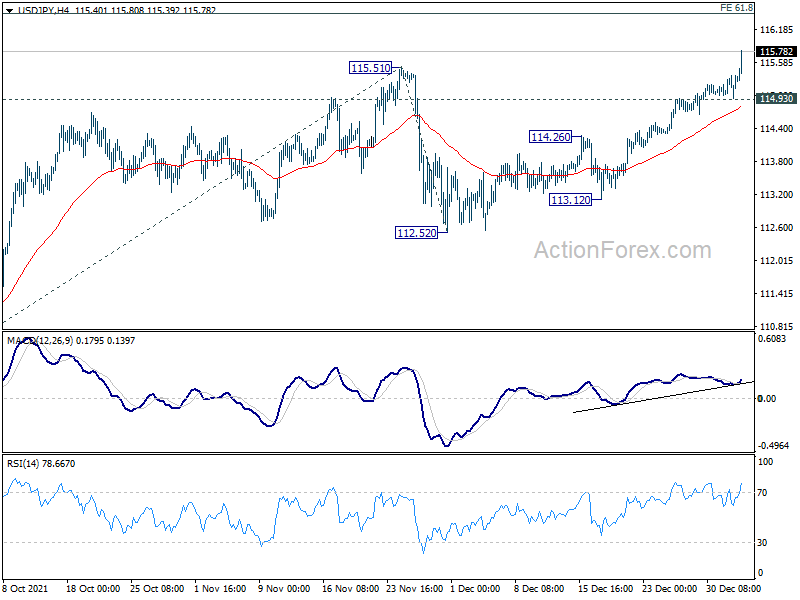
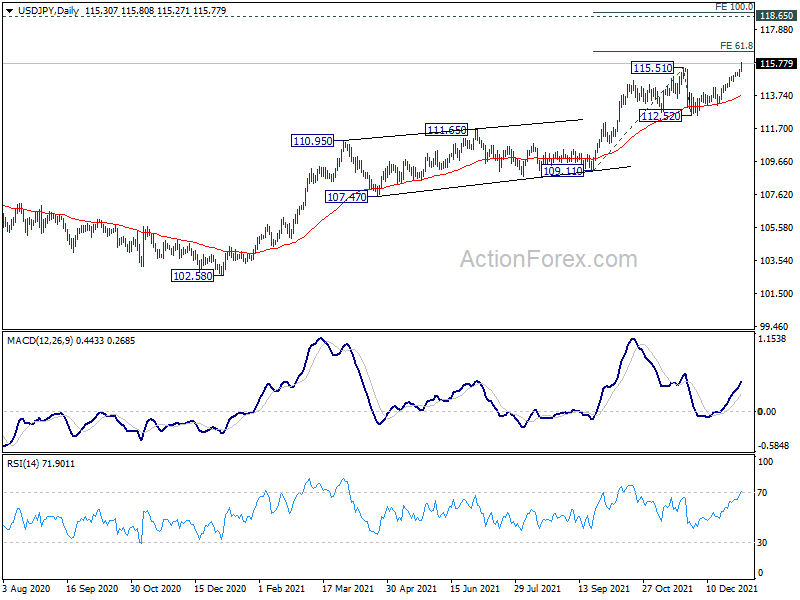
USD/JPY rises to as high as 115.80 so far today and the strong break of 115.51 resistance confirms resumption of whole up trend from 102.58. Intraday bias stays on the upside for 61.8% projection of 109.11 to 115.51 from 112.52 at 116.47. Firm break there will target 100% projection at 118.90, which is close to 118.65 long term resistance. On the downside, break of 114.93 will turn intraday bias neutral and bring some consolidations, before staging another rally.
In the bigger picture, no change in the view that rise from 102.58 is the third leg of the up trend from 101.18 (2020 low). Such rally should target a test on 118.65 (2016 high). Sustained break there will pave the way to 112.85 (2015 high) and raise the chance of long term up trend resumption. For now, this will remain the favored case as long as 112.52 support holds, in case of deep pull back.
Yen Dives on Surging Yields, Dollar Strong
Yen selloff is the main theme in the Asian markets today, in particular as USD/JPY breaks out on the upside with acceleration. The move was fueled by strong rally in US treasury yields overnight, as well as rally in Nikkei and benchmark JGB yield. Dollar is currently the strongest one for the, reversing much of the pre-holiday decline. Commodity currencies are also slightly firmer, but we'll see if Europeans could outperform them.
Technically, in addition to Yen crosses, we'd also pay attention to EUR/USD. It was knocked off by 1.1382 resistance despite a very brief breach during illiquid holiday markets. EUR/USD could be heading back to retest 1.1185 support and break will resume larger down trend. Such development, if happens, could affirm the case that Dollar is really on the move.
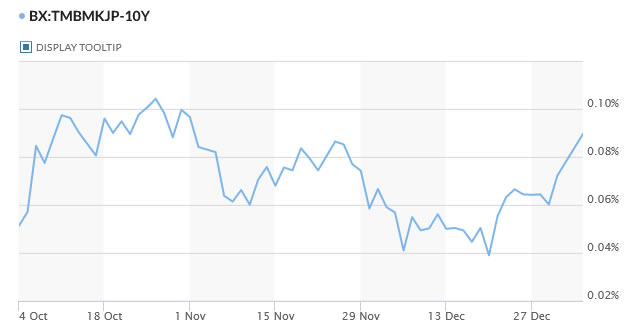
In Asia, at the time of writing, Nikkei is up 1.71%. Hong Kong HSI is down -0.29%. China Shanghai SSE is down -0.35%. Singapore Strait Times is up 1.22%. Japan 10-year JGB yield is up 0.0174 at 0.090. Overnight, DOW rose 0.68%. S&P 500 rose 0.64%. NASDAQ rose 1.20%. 10-year yield rose 0.116 to 1.628.
US 10-yr yield back above 1.6, 30-yr yield above 2.0
US treasury yields surged sharply overnight as investors continued to adjust themselves "living with the virus". Omicron is now generally taken as being much less harmful to the global economy as initially feared, despite record infection numbers.
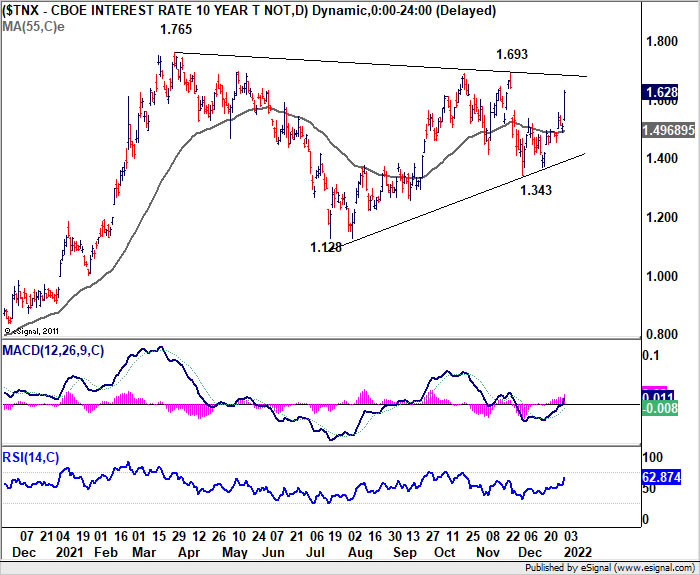
10-year yield closed up 0.116 to 1.628, back above 1.6 handle for the first time since November. We're holding on to the view that consolidation pattern from 1.765 has complete with three waves at 1.343. TNX could accelerate upwards in the near term to 1.693 resistance. Firm break there would send TNX through 1.765 to resume larger up trend from 0.398 (2020 low).
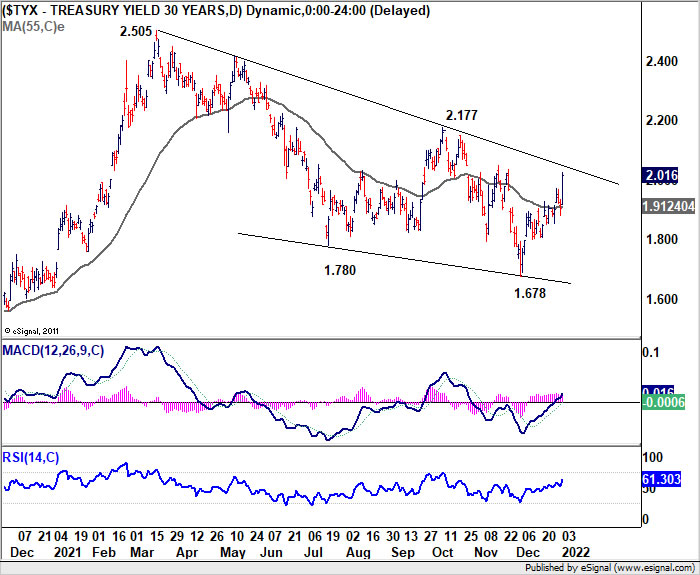
The picture in 30-year yield is similar. It's now back above 2.0 handle after yesterday's rise. Corrective pattern from 2.505 should have completed with three waves down to 1.678. Further rally should be seen to 2.177 in the near term. Sustained break there will raise the chance that it's already resuming the up trend from 0.837 (2020 low) through 2.505 high.
China Caixin PMI manufacturing rose to 50.9, improving demand and supply
China Caixin PMI Manufacturing rose to 50.9 in December, up from November's 49.9, above expectation of 50.0. The data signaled a renewed improvement in the sector with best reading since June. Caixin said rise in output was stronger amid renewed upturn in sales. Input cost inflation eased to 19-month low. Business confidence weakened amid pandemic and supply chain worries.
Wang Zhe, Senior Economist at Caixin Insight Group said: "To sum up, manufacturing demand and supply improved in December with easing inflationary pressure. But the job market was still under pressure and businesses were less optimistic, indicating unstable economic recovery. The repeated Covid-19 flare-ups and sluggish overseas demand were factors of instability."
Japan PMI manufacturing finalized at 54.3 in Dec, confidence dipped
Japan PMI Manufacturing was finalized at 54.3 in December, slightly lower than November's 54.5. But that was well above 2021's average of 52.7. Markit said output and new orders increased at slower rates. Employment level rose at fastest pace in nearly four years. Business optimism eased to four-month low.
Usamah Bhatti, Economist at IHS Markit, said: "Domestic markets were buoyed by a gradual recovery from the COVID-19 pandemic however a sharp rise in cases, particularly in South Korea hindered international demand and continued to disrupt supply chains across the sector... Delivery delays and material shortages remained a dampener on production and sales... Average lead times across the final quarter of 2021 deteriorated further... Though still optimistic, Japanese goods producers were wary of the continued impact of the pandemic and supply chain disruption, which resulted in confidence dipping to the softest since August."
Looking ahead
Germany retail sales, and unemployment will be released in European session. Swiss will release CPI while UK will release mortgage approvals, M4 money supply and PMI manufacturing final.
Later in the day, Canada will release IPPI and RMPU. US will release ISM manufacturing.
FOMC minutes, ISMs and NFP to return to focus
Minutes of the December FOMC meeting will be a major focus this week. At the meeting, Fed announced that it would speed up tapering and end it in March instead of June. Also, the new projections saw three rate hikes this year. The markets would like to see more in-depth information an related discussion.
Meanwhile, US will also release ISM indexes and non-farm payrolls, Eurozone CPI flash and Canada employment, China Caixin PMIs will be among most anticipated data release.
Here are some highlights for the week:
- Tuesday: Japan PMI Manufacturing final; China Caixin PMI manufacturing; Germany retail sales, unemployment; Swiss CPI; UK PMI manufacturing final, mortgage approvals, M4 money supply; Canada IPPI and RMPI; US ISM manufacturing.
- Wednesday: Japan monetary base, consumer confidence; Eurozone PMI services final; US ADP employment, FOMC minutes; Canada building permits.
- Thursday: China Caixin PMI services; Germany factory orders, CPI flash; UK PMI services final; Eurozone PPI; Canada trade balance; US Challenger job cuts, jobless claims, trade balance; ISM services, factory orders.
- Friday: Japan average cash earnings, household spending, Tokyo CPI core; Swiss unemployment rate, retail sales, currency reserves; Germany industrial production, trade balance; France consumer spending, industrial production, trade balance; UK PMI construction; Eurozone PMI flash, retail sales; Canada employment, Ivey PMI US non-farm payrolls.
USD/JPY Daily Outlook
Daily Pivots: (S1) 115.08; (P) 115.22; (R1) 115.50; More...
USD/JPY rises to as high as 115.80 so far today and the strong break of 115.51 resistance confirms resumption of whole up trend from 102.58. Intraday bias stays on the upside for 61.8% projection of 109.11 to 115.51 from 112.52 at 116.47. Firm break there will target 100% projection at 118.90, which is close to 118.65 long term resistance. On the downside, break of 114.93 will turn intraday bias neutral and bring some consolidations, before staging another rally.
In the bigger picture, no change in the view that rise from 102.58 is the third leg of the up trend from 101.18 (2020 low). Such rally should target a test on 118.65 (2016 high). Sustained break there will pave the way to 112.85 (2015 high) and raise the chance of long term up trend resumption. For now, this will remain the favored case as long as 112.52 support holds, in case of deep pull back.
Economic Indicators Update
| GMT | Ccy | Events | Actual | Forecast | Previous | Revised |
|---|---|---|---|---|---|---|
| 00:01 | GBP | BRC Shop Price Index Y/Y Nov | 0.80% | 0.30% | ||
| 00:30 | JPY | Manufacturing PMI Dec F | 54.3 | 54.2 | 54.2 | |
| 01:45 | CNY | Caixin Manufacturing PMI Dec | 50.9 | 50.5 | 49.9 | |
| 07:00 | EUR | Germany Retail Sales M/M Nov | -0.50% | -0.30% | ||
| 07:30 | CHF | CPI M/M Dec | -0.10% | 0.00% | ||
| 07:30 | CHF | CPI Y/Y Dec | 1.60% | 1.50% | ||
| 08:55 | EUR | Germany Unemployment Change Dec | -15K | -34K | ||
| 08:55 | EUR | Germany Unemployment Rate Dec | 5.30% | 5.30% | ||
| 09:30 | GBP | Mortgage Approvals Nov | 66K | 67K | ||
| 09:30 | GBP | M4 Money Supply M/M Nov | 0.50% | 0.60% | ||
| 09:30 | GBP | Manufacturing PMI Dec F | 57.6 | 57.6 | ||
| 13:30 | CAD | Industrial Product Price M/M Nov | 0.90% | 1.30% | ||
| 13:30 | CAD | Raw Material Price Index Nov | 0.00% | 4.80% | ||
| 14:30 | CAD | Manufacturing PMI Dec | 57.2 | |||
| 15:00 | USD | ISM Manufacturing PMI Dec | 60.2 | 61.1 | ||
| 15:00 | USD | ISM Manufacturing Prices Paid Dec | 79.5 | 82.4 | ||
| 15:00 | USD | ISM Manufacturing Employment Dec | 53.3 |
Technical Outlook and Review
DXY:
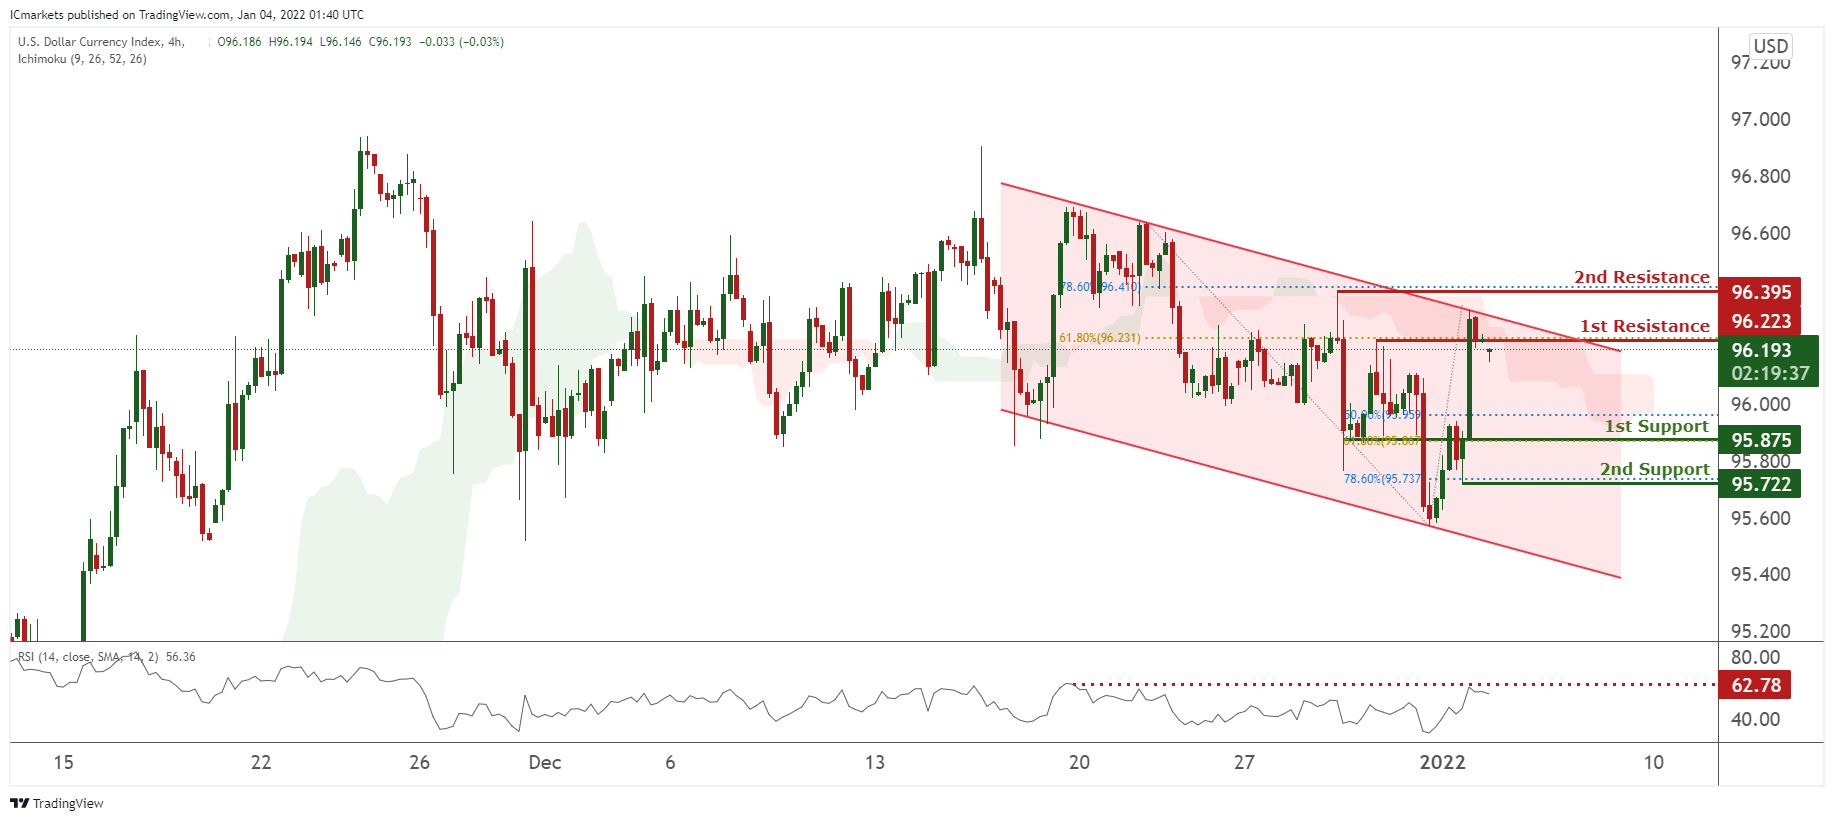
On the H4, prices are on bearish momentum and consolidating in a bearish channel. We see the potential for a dip from our 1st resistance at 96.223 in line with 96.223 in line with 61.8% Fibonacci retracement towards our 1st support in line 95.875 with 61.8% Fibonacci retracement. RSI are at levels where dips previously occurred, further supporting our bearish bias.
Areas of consideration:
- H4 time frame, 1st resistance at 96.223
- H4 time frame, 1st support at 95.875
XAU/USD (GOLD):
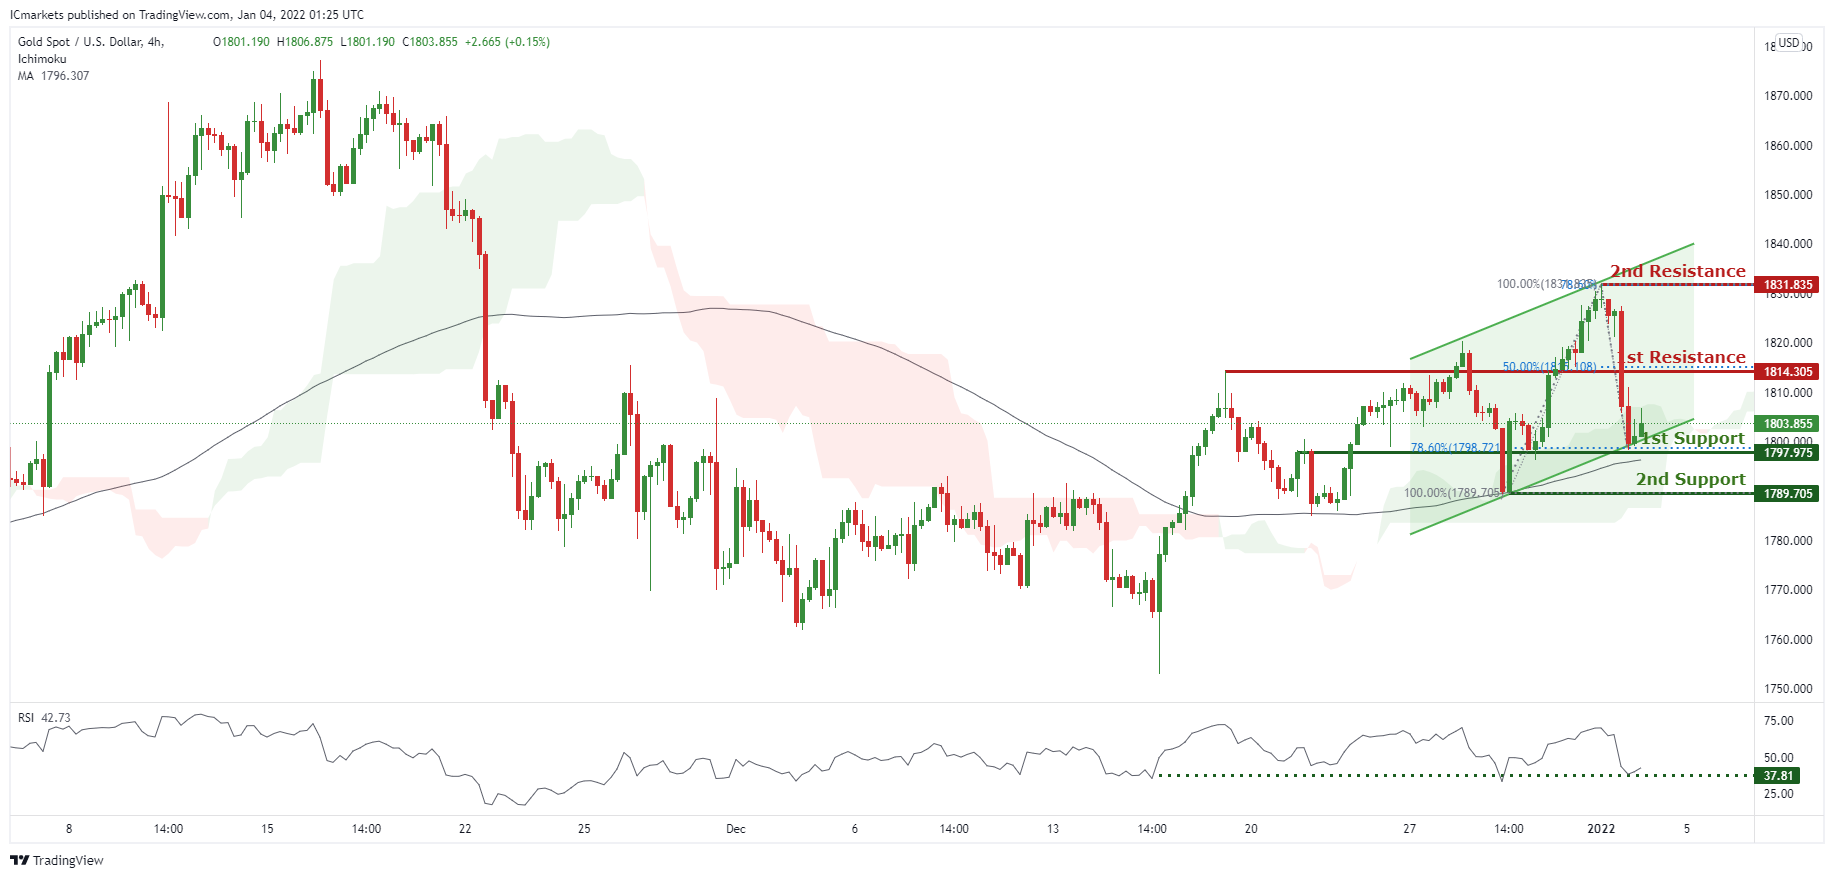
On the H4, prices are consolidating in a parallel channel and on bullish momentum. We see the potential for a bounce from our 1st support at 1797.975 in line with 78.6% Fibonacci retracement towards our 1st resistance at 1814.305 in line with 50% Fibonacci retracement. RSI are at levels where bounces previously occurred. Alternatively, breaking our 1st resistance could find prices could climb higher towards our 2nd resistance at 1831.835 in line with 100% Fibonacci retracement and 78.6% Fibonacci extension.
Areas of consideration:
- H4 1st support at 1797.975
- H4 1st resistance at 1814.305
GBP/USD
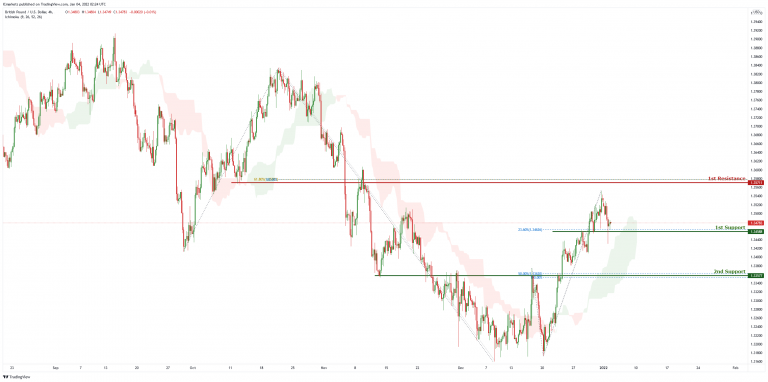
On the H4 chart price is near 1st support level of 1.34588 which is also 23.6% Fibonacci retracement. Price can potentially go to the 1st resistance level of 1.35711 which is also 61.8% Fibonacci retracement and 100% Fibonacci projection. Our bullish bias is supported by the ichimoku cloud indicator as price is trading above it.
Areas of consideration:
- H4 1st support level at 1.34588
- H4 1st resistance level at 1.35711
USD/CHF:
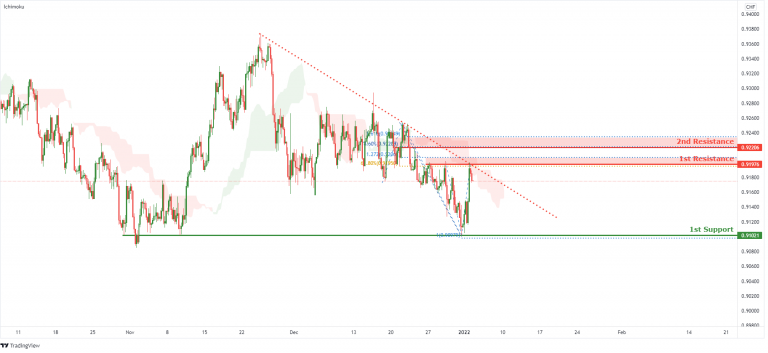
On the H4 timeframe, price is abiding to the descending trendline resistance, signifying an overall bearish momentum. We can expect price to drop from the 1st Resistance level in line with 61.8% Fibonacci retracement and 127.2% Fibonacci projection towards 1st Support in line with 100% Fibonacci projection. Our bearish bias is further supported by the price holding below the Ichimoku Cloud.
Areas of consideration:
- Watch 1st Support at 0.91021
- Watch 1st Resistance at 0.91976
EUR/USD :
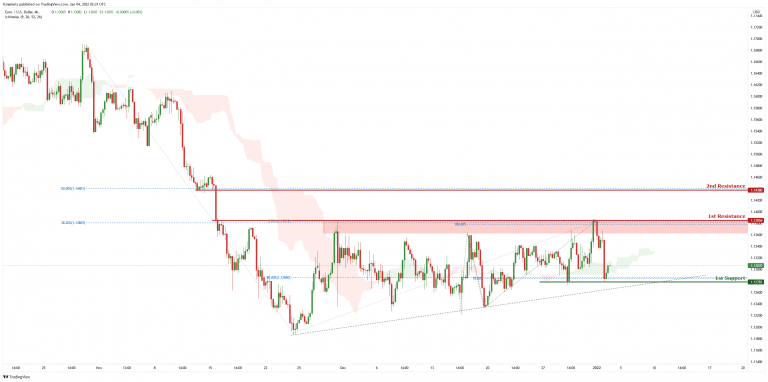
On the H4 chart, price is abiding by an ascending trendline and is near 1st support level of 1.12783 which is also 50% Fibonacci retracement and 78.6% Fibonacci projection. Price can potentially go to the 1st resistance of 1.13854 which is also 100% Fibonacci projection and 38.2% Fibonacci retracement. Our bullish bias is supported by the ichimoku cloud indicator.
Areas of consideration :
- H4 1st support at 1.12783
- H4 1st resistance at 1.13854
USD/JPY
On the H4 timeframe, price is abiding to the ascending channel, showing an overall bullish momentum. However, we can expect a short term bearish momentum and drop from 1st resistance in line with previous swing high and daily resistance towards 1st Support in line with graphical overlap support, 78.6% Fibonacci projection and 38.2% Fibonacci retracement. Our bearish bias is further supported by stochastic where the %K line dropped from the resistance.
Areas of consideration:
- H4 1st resistance level 115.500
- H4 1st support level 114.519
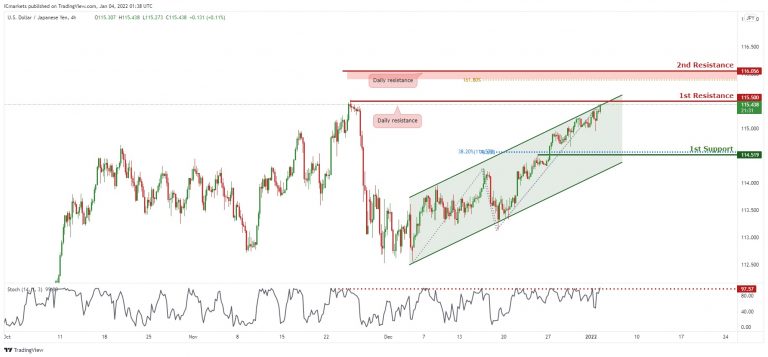
AUD/USD:
In reference to yesterday’s analysis, price is falling nicely towards 1st Support. On the H4, price is reacting in an ascending channel, signifying bullish momentum. However, price is currently at a resistance, we can expect price to drop from 1st Resistance in line with 127.2% Fibonacci projection ,127.2% Fibonacci Extension and 50% Fibonacci retracement towards 1st Support in line with 100% Fibonacci projection and 78.6% Fibonacci retracement. Our short-term bearish bias is further supported by the stochastic indicator where the %K line is approaching the resistance level. Traders should wait for price to swing higher or lower before entering.
Areas of consideration:
- H4 1st Support level 0.71203
- H4 1st resistance level 0.72773
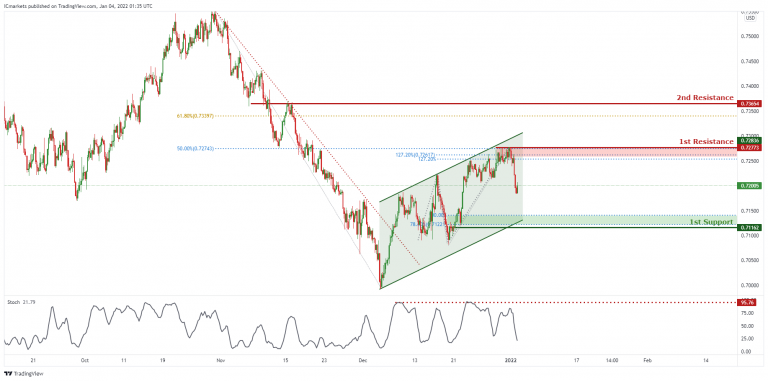
NZD/USD:
On the H4, prices are on bullish momentum and abiding to our ascending trendline. We see the potential for further bullish movement towards our 1st resistance at 0.68140 in line with 127.2% Fibonacci extension and 50% Fibonacci retracement. Technical indicators are showing momentum. Alternatively, breaking our 1st support may find prices dipping towards our 2nd support at 0.67715.
Areas of consideration:
- H4 time frame, 1st resistance at 0.68140
- H4 time frame, 1st support at 0.67919
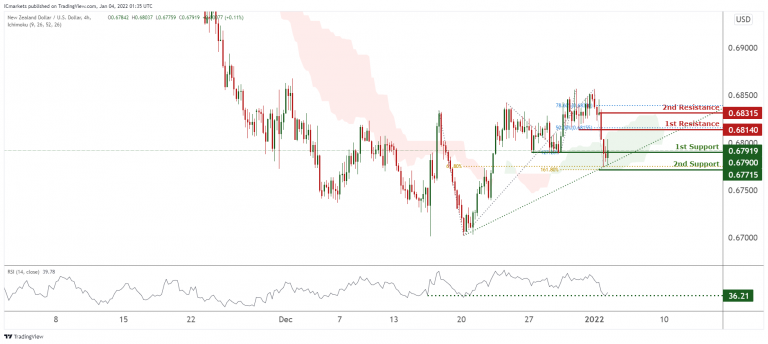
USD/CAD:
On the H4, with price at the resistance of the ichimoku indicator and horizontal swing high resistance, we have a bearish bias that price will drop from our 1st resistance at 1.27654 which is in line with horizontal overlap resistance, 38.2% Fibonacci retracement level to 1st support at 1.26839, which is in line with horizontal overlap support and 61.8% Fibonacci retracement. Alternatively, price may rise up to our 2nd resistance at 1.28282, which coincides with horizontal swing high resistance, 61.8% Fibonacci retracement level .
Areas of consideration:
- H4 time frame, 1st support at 26839
- H4 time frame, 1st resistance at 27654
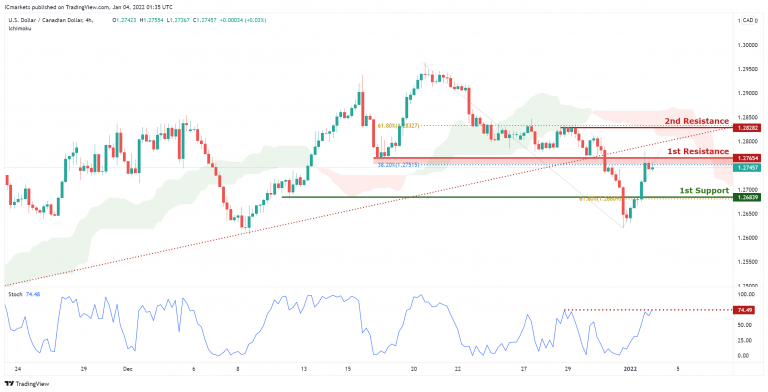
OIL:
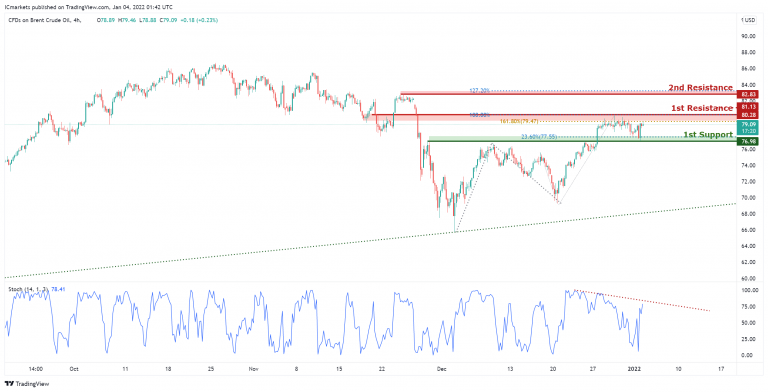
On the H4, with price on a downwards trend on the stochastics indicator and approaching the resistance on the indicator, we have a bearish bias that price will drop from our 1st resistance at 80.28 which is in line with horizontal overlap resistance, 161.8% Fibonacci extension and 100% Fibonacci projection level to 1st support at 76.98, which is in line with horizontal overlap support, 23.6% Fibonacci retracement level. Alternatively, price may rise up to our 2nd resistance at 82.83, which coincides with horizontal swing high resistance and 127.2% Fibonacci extension level .
Areas of consideration:
- H4 time frame, 1st resistance of 80.28
- H4 time frame, 1st support of 76.98
Dow Jones Industrial Average:
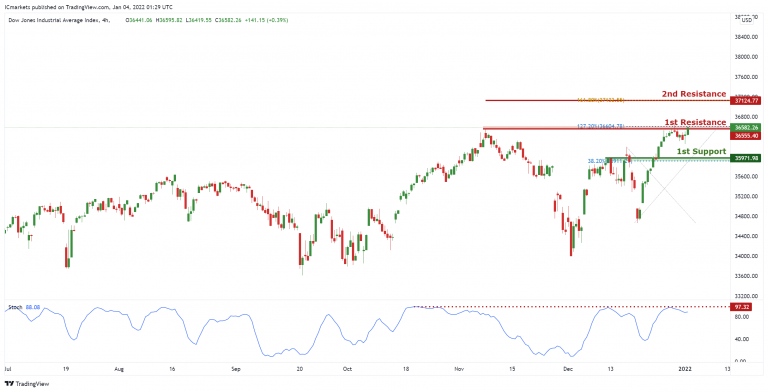
On the H4, with price rejecting the resistance on the stochastics indicator, we have a bearish bias that price will drop from our 1st resistance at 36555 area which is in line with horizontal swing high resistance and 127.2% Fibonacci extension level to 1st support at 35971, which is in line with horizontal overlap support, 38.2% Fibonacci retracement level. Alternatively, price may rise up to our 2nd resistance at 37124, which coincides with horizontal swing high resistance and 161.8% Fibonacci extension .
Area of consideration:
- 4H resistance at 36555
- 4H support at 35971
Market Morning Briefing: US Treasury Yields Surged Across Tenors
STOCKS
Equities look bullish overall. Dow Jones and Dax have room to rise towards 37000 and 16100 respectively while Nikkei can rise towards 29500 and Shanghai can consolidate between 3600-3650. Nifty and Sensex also look bullish towards 17800 and 60000.
Dow (36,585.06 +246.76 , +0.68%) has risen sharply. The view is bullish towards 37000 in the coming 1-2 weeks.
DAX (16020.73, +135.87, +0.86%) has risen above 16000 and can now target 16100-16200 in the coming sessions. Immediate view is bullish.
Nikkei (29,193.56 +401.85 , 1.40%) has risen again today. While above 29000, a test of 29500 is possible. Further rise from 29500 will open up opportunities to rise towards 30000/31000.
Shanghai (3,612.45 −27.32 ,0.75%) has dipped again today. A consolidation between 3600-3650 is possible now, before we see a break on either side.
Nifty (17625.70 ,+271.65 +1.57%) rose sharply yesterday and has room to rise towards 17800 in the coming sessions while it sustains above 17600.
Sensex (59183.22, +929.40 , 1.60%) has risen above the crucial level of 59000. The view is now bullish to see a rise towards 60000.
COMMODITIES
Crude prices are higher ahead of the OPEC+ meeting and may be limited to 81 (Brent) and 78 (WTI) on the upside before declining soon. Gold and Silver have fallen from higher levels seen yesterday but we need to see if the fall is short lived or manages to fall further from current levels. Copper has dipped too but can bounce back from 4.30.
Brent (78.99) and WTI (76.07) trade higher ahead of the OPEC meeting scheduled today where it is expected to continue easing of collective production cuts by around 400,000 bpd from next month. Libyan oil production may face reduction due to damage in an oil pipeline. Bullishness in oil prices also came in after the OPEC+ stated that it expects surplus on oil market in the first quarter of 2022 at 1.4mbpd. On the charts, both Brent and WTI can be limited to 81 and 78 respectively just now before a decline sets in.
Gold (1806.20) and Silver (22.85) have both fallen sharply from higher levels seen yesterday. While above 1800 and 22.50 respectively, there can be scope for another rise towards higher levels of 1850 and 23.50 respectively. For now, 1830 and 23.50 are immediate resistances above current levels.
Copper (4.3870) has dipped slightly but while above support at 4.30, we may expect a bounce back towards 4.45/50 soon. A range of 4.50-4.30 may hold for a few sessions.
FOREX
Dollar Index may trade within 95.50-96.50 for now while Euro has scope to rise towards 1.14 or higher. EURJPY can rise towards 131-132 while above 130.50. Aussie and Pound look bullish for the medium term. Dollar Yen needs to break above 115.50 and sustain to eventually rise towards 116-118 on the upside. USDCNY has risen well and can remain within 6.35-6.38 for now. USDINR too can be ranged within 74.80/60-73.75/74.00
Dollar Index (96.218) bounced back from levels above 95.50 itself instead of falling further down. While above 95.50, there is scope for a rise to 96.50 or even 97 on the upside. Narrow range of 95.5-96.5 and broad range of 95-97 may hold for now.
Euro (1.1346) has risen from the lower end of the 1.1258-1.1450 range and can slowly move up to the upper end of 1.14-1.1450 soon before declining again from there. Immediate view is bullish while above 1.1258-1.1300.
EURJPY (130.63) continues trade above 130 and while it sustains to move up further, a test of 131-132 can be possible soon.
Aussie (0.7199) fell sharply yesterday but has bounced today from immediate trend support near 0.7180. While above the mentioned support, a rise towards 0.7280-0.73 is possible.
Pound (1.3473) has fallen and can test 1.34 before again bouncing back towards 1.36 on the upside.
Dollar-Yen (115.48) has risen well to the previous high of 115.52 seen on 24th Nov 2021. A break above 115.50 if seen and sustained in the coming sessions would be bullish for a rise towards 116-117-118 eventually before any reversal is seen in the longer run.
USDCNY (6.3707) rose back sharply to 6.37 from levels below 6.36 seen yesterday. We may expect a range of 6.3825-6.3400 to hold for the next few sessions. Unless a break on either side is seen, it would be difficult to say which way it would finally move towards in the longer run. While below 6.39/40, view would continue to remain bearish.
USDINR (74.2650) has important resistance near 74.60/80 region and while that holds, the pair can trade within 74.60-74.00/73.75 for the near term with higher possibility of a fall towards the lower end of the mentioned range. Watch price action for a break on either side of the mentioned range for clarity on further directional move if any. Till then the mentioned range may hold.
INTEREST RATES
The US Treasury yields have surged across tenors and are coming closer to their crucial range resistances. The price action in the coming days will need a close watch to see if the yields are reversing lower from their resistances and keep the sideways range intact. The German yields are moving up in line with our expectation. Strong resistances are coming up which can halt the current rally and drag the yields lower again. The 10Yr GoI remains stable within its narrow range while the 5Yr GoI remains slightly weak to see a dip in the near-term.
The US 2Yr (0.77%), 5Yr (1.35%), 10Yr (1.62%) and the 30Yr (2.01%) Treasury yields have surged across tenors. 1.65%-1.7% on the 10Yr and 2.1% on the 30Yr are crucial levels to watch. A strong break above these levels will negate our view of seeing a broad sideways range. The price action in the coming days will need a close watch.
The German 2Yr (-0.62%), 5Yr (-0.42%), 10Yr (-0.12%) and 30Yr (0.24%) continues to move up in line with our expectation. Crucial resistances are at -0.1%/-0.05% on the 10Yr and 0.25%-0.30% on the 30Yr which are likely to halt the current rise and drag the yields lower again. A strong rise past these resistances is necessarily needed to become more bullish from here.
The Indian 10Yr (6.4603%) GoI continues to remain stable in the 6.44%-6.5% range. View remains the same. A breakout on either side of this range will decide whether the yield can go up to 6.54%-6.56% or fall to 6.4% in the near-term. From a bigger picture, 6.4% is a strong support while above which the medium-term outlook is bullish to see a break above 6.5% and see higher levels.
The 5Yr (5.7932%) GoI looks slightly weaker than the 10Yr GoI. It has to rise past 5.8% to regain strength. Else, a test of 5.74% on the downside in the near-term cannot be ruled out.
DATA TODAY
0:30 6:00 JP PMI
...Kshitij Expn 55.3 ...Expected 54.3 ...Previous 54.5 -
1:45 7:15 CN PMI
...Kshitij Expn 49.9 ...Expected 50.1 ...Previous 49.9 -
7:30 13:00 CH CPI
...Kshitij Expn -0.5 - 0.6 -
9:30 15:00 UK PMI
...Kshitij Expn 59.1 ...Expected 57.6 ...Previous 58.2 -
14:30 20:00 CA PMI
...Kshitij Expn 58.2 ...Previous 57.2 -
15:00 20:30 US Manufacturing ISM
...Kshitij Expn 62.4 ...Expected 60.4 ...Previous 61.1 -
Data released yesterday:-
-------------------------
5:00 10:30 IN Manf PMI
...Kshitij Expn 56.9 ...Previous-57.6 ...Actual 55.5
8:30 14:00 CH PMI
...Kshitij Expn 64.3 ...Expected 61.2 ...Previous 62.5 ...Actual 62.7
9:00 14:30 EU PMI
...Previous -58.4 ...Actual 58
US 10-yr yield back above 1.6, 30-yr yield above 2.0
US treasury yields surged sharply overnight as investors continued to adjust themselves "living with the virus". Omicron is now generally taken as being much less harmful to the global economy as initially feared, despite record infection numbers.
10-year yield closed up 0.116 to 1.628, back above 1.6 handle for the first time since November. We're holding on to the view that consolidation pattern from 1.765 has complete with three waves at 1.343. TNX could accelerate upwards in the near term to 1.693 resistance. Firm break there would send TNX through 1.765 to resume larger up trend from 0.398 (2020 low).
The picture in 30-year yield is similar. It's now back above 2.0 handle after yesterday's rise. Corrective pattern from 2.505 should have completed with three waves down to 1.678. Further rally should be seen to 2.177 in the near term. Sustained break there will raise the chance that it's already resuming the up trend from 0.837 (2020 low) through 2.505 high.