

Sample Category Title
USD/CHF Mid-Day Outlook
Daily Pivots: (S1) 0.9158; (P) 0.9175; (R1) 0.9189; More....
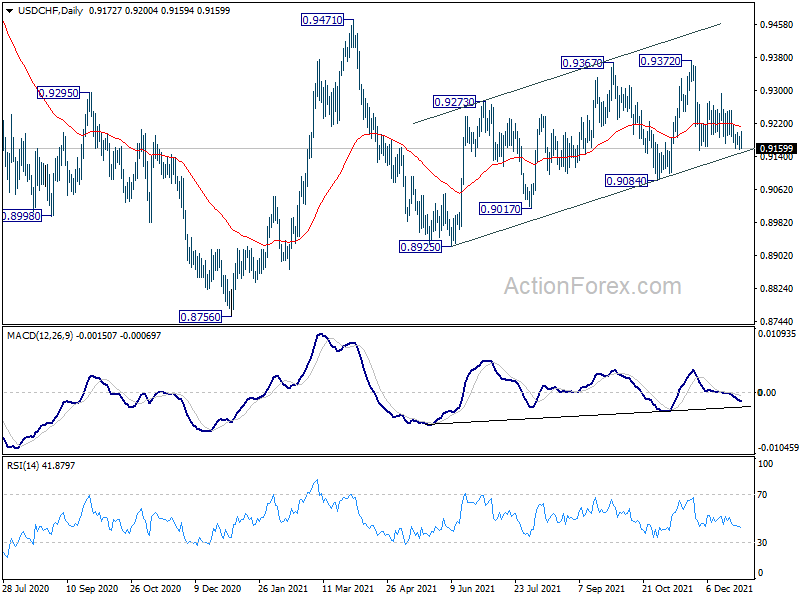
Intraday bias in USD/CHF remains neutral as it's still bounded in range above 0.9156. On the downside, below 0.9156 will target 0.9084 support. Firm break there should confirm that choppy rise from 0.8925 has completed, and suggests that fall from 0.9471 is resuming. Deeper decline would be seen through 0.8925. On the upside, break of 0.9293 will suggest that the pull back from 0.9372 is finished. Intraday bias will be turned back to the upside for 0.9372.
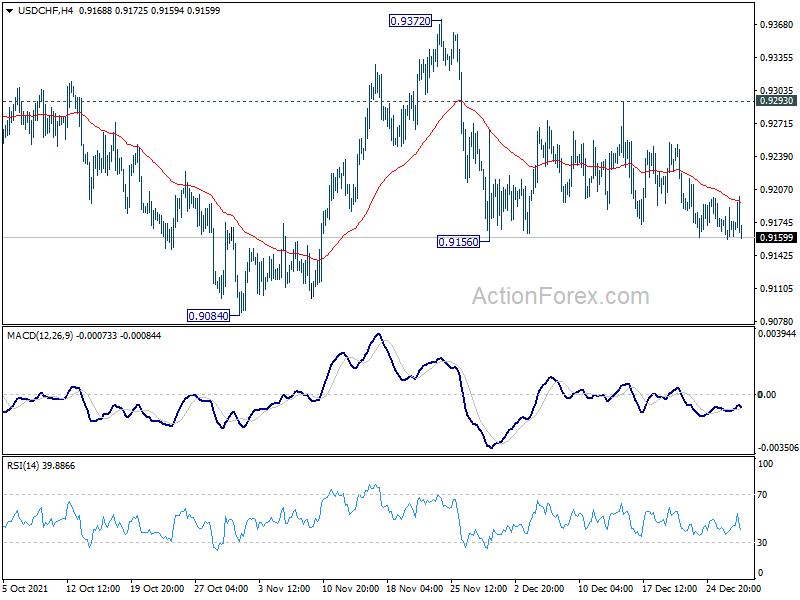
In the bigger picture, the corrective structure of the rebound from 0.8925 argues that fall from 0.9471 is not complete yet. It could either be the second leg of pattern from 0.8756 (2021 low), or resuming larger down trend from 1.0237 (2018 high). We'd pay attention to the downside momentum and assess the odds later. But for now, medium term outlook will be neutral at best as long as 0.9471 resistance holds.
EUR/USD Mid-Day Outlook
Daily Pivots: (S1) 1.1288; (P) 1.1311; (R1) 1.1331; More...
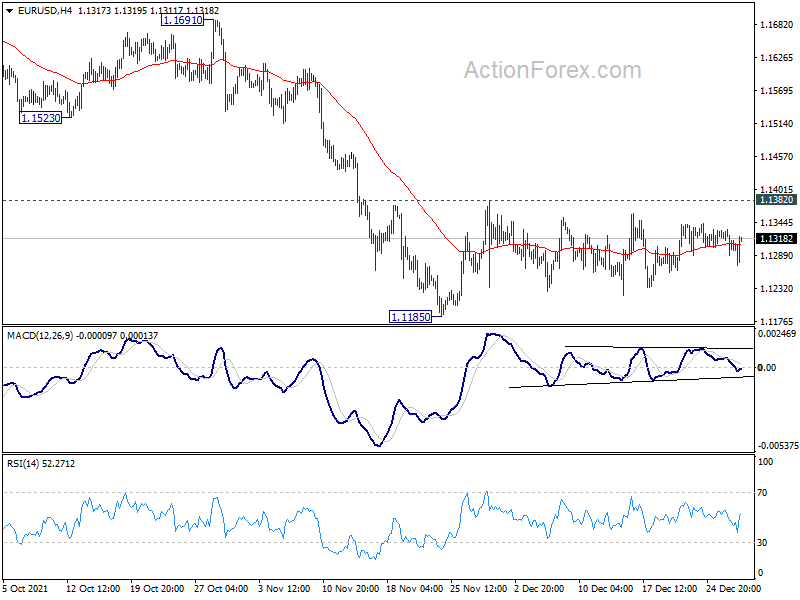
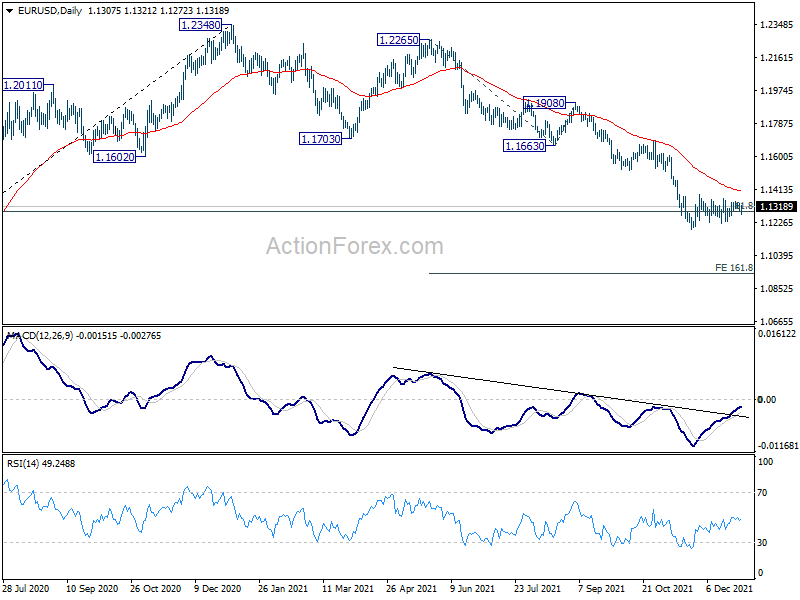
Range trading continues in EUR/USD and intraday bias remains neutral for the moment. On the downside, break of 1.1185 will resume larger decline from 1.2348. Next target is 161.8% projection of 1.2265 to 1.1663 from 1.1908 at 1.0934. On the upside, firm break of 1.1382 resistance should confirm short term bottoming at 1.1186. Intraday bias will be turned back to the upside for 55 day EMA (now at 1.1405) and above.
In the bigger picture, there are various ways of interpreting the fall from 1.2348 (2021 high). It could be a correction to rise from 1.0635 (2020 low), the fourth leg of a sideway pattern from 1.0339 (2017 low), or resuming long term down trend. In any case, outlook will now stay bearish as long as 1.1703 support turned resistance holds. Sustained break of 61.8% retracement of 1.0635 to 1.2348 at 1.1289 would pave the way back to 1.0635.
GBP/USD Mid-Day Outlook
Daily Pivots: (S1) 1.3411; (P) 1.3437; (R1) 1.3457; More...
GBP/USD's rise from 1.3158 is still in progress. Sustained trading above 55 day EMA (now at 1.3426) will be an early sign of bullish reversal. That is, correction from 1.4248 might have completed with three waves down to 1.3158, after hitting 1.3164 medium term fibonacci level. Further rally would be seen to 1.3570 support turned resistance next. On the downside, break of 1.3375 minor support will turn intraday bias neutral first.
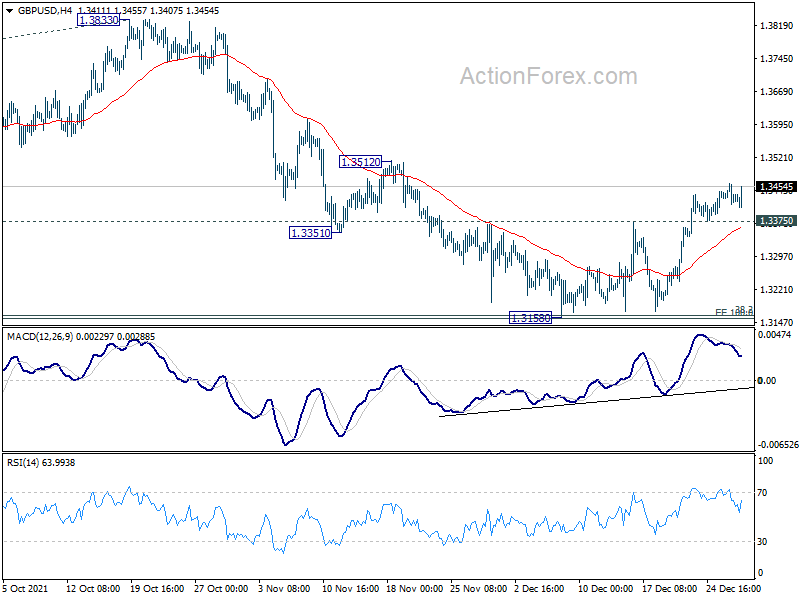
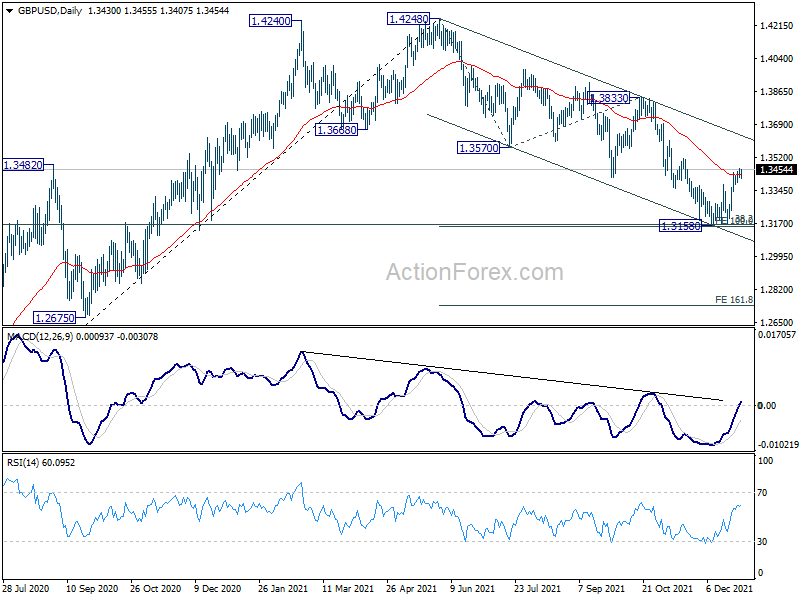
In the bigger picture, focus remains on 38.2% retracement of 1.1409 to 1.4248 at 1.3164. Sustained break there will argue that whole rise from 1.1409 has completed at 1.4248, after rejection by 1.4376 long term resistance. That will revive some medium term bearishness and and target 61.8% retracement at 1.2493. However, strong rebound from current level will revive argue that up trend from 1.1409 is still in progress, and probably ready to resume.
Sterling Firm, Yen Weak, Gold Tumbles in Holiday Mood
The markets are staying in holiday mood today, with little news flow and no important data release. There is nothing to stop Yen's decline. But as risk sentiments turned steady, commodity currencies are paring some gains. Instead, Sterling is outshining others and it's trading mildly higher broadly. Dollar is firm with Euro but there is no follow through buying in both for a noticeable rebound.
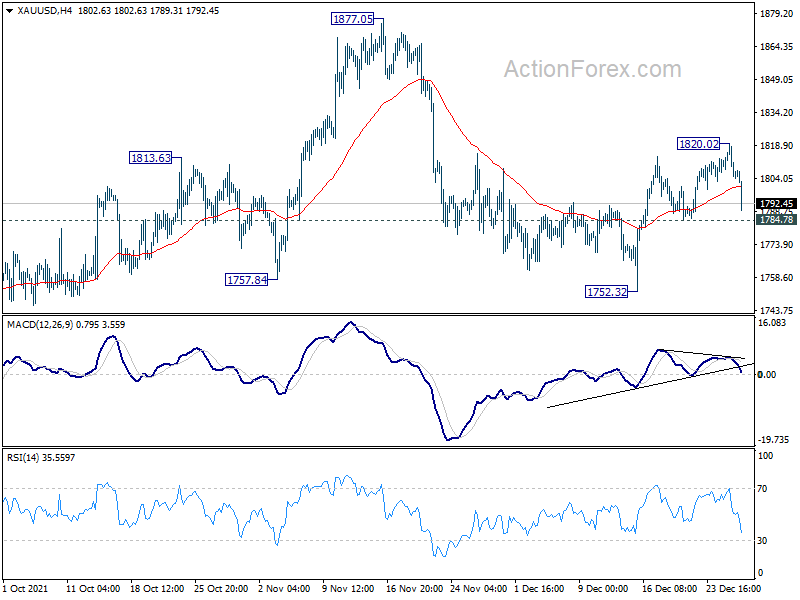
Technically, Gold's decline is picking up momentum today and it's now back below 1800 handle. Immediate focus is now back on 1784.78 support. Firm break there will argue that recovery from 1752.32 has completed with three waves up to 1820.02. Fall from 1877.05 is then ready to resume through 1752.32.
In Europe, at the time of writing, FTSE is up 0.80%. DAX is down -0.56%. CAC is down -0.21%. Germany 10-year yield is up 0.0376 at -0.210. Earlier in Asia, Nikkei dropped -0.56%. Hong Kong HSI dropped -0.83%. China Shanghai SSE dropped -0.91%. Singapore Strait Times rose 0.31%. Japan 10-year JGB yield dropped -0.0042 to 0.060.
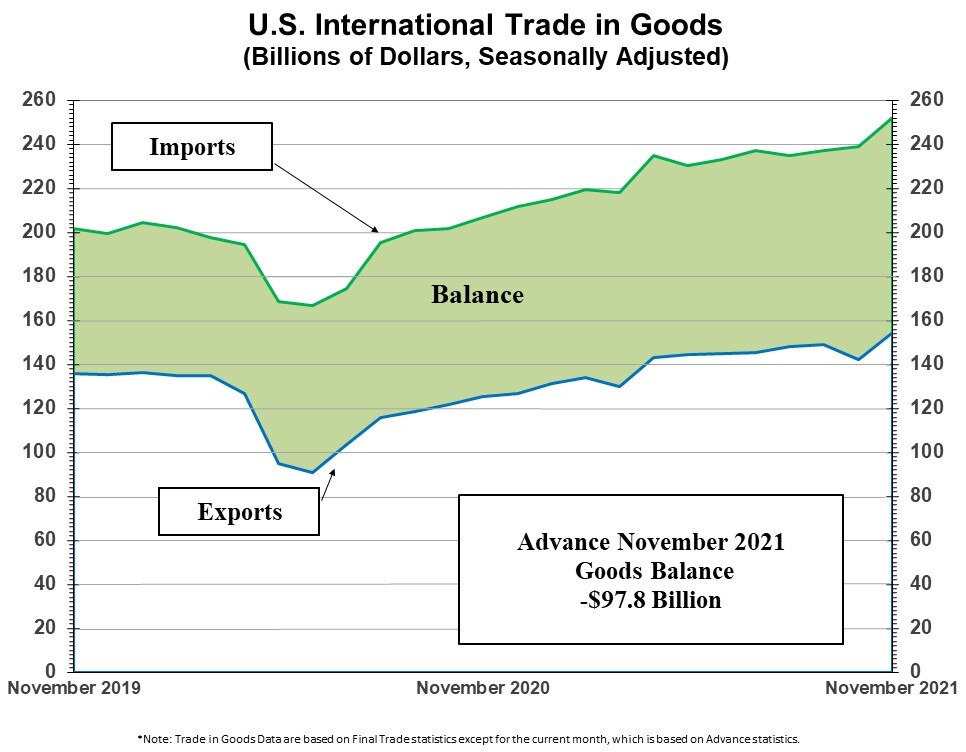
US goods trade deficit widened to USD 97.8B in Nov
US goods exports dropped USD -3.3B to USD 154.7B in November. Goods imports rose USD 11.3B to USD 252.4B. Goods trade deficit came in at USD -97.8B, worse than expectation of USD -89.0B, comparing to Novembers's USD -83.2B.
Wholesale inventories rose 1.2% mom to USD 769.9B. Retail inventories rose 2.0% mom to USD 616.9B.
Released earlier, Eurozone M3 money supply rose 7.3% yoy in November, below expectation of 7.6% mom.
Swiss Credit Suisse economic expectations rose from -10.8 to 0 in December.
GBP/USD Mid-Day Outlook
Daily Pivots: (S1) 1.3411; (P) 1.3437; (R1) 1.3457; More...
GBP/USD's rise from 1.3158 is still in progress. Sustained trading above 55 day EMA (now at 1.3426) will be an early sign of bullish reversal. That is, correction from 1.4248 might have completed with three waves down to 1.3158, after hitting 1.3164 medium term fibonacci level. Further rally would be seen to 1.3570 support turned resistance next. On the downside, break of 1.3375 minor support will turn intraday bias neutral first.
In the bigger picture, focus remains on 38.2% retracement of 1.1409 to 1.4248 at 1.3164. Sustained break there will argue that whole rise from 1.1409 has completed at 1.4248, after rejection by 1.4376 long term resistance. That will revive some medium term bearishness and and target 61.8% retracement at 1.2493. However, strong rebound from current level will revive argue that up trend from 1.1409 is still in progress, and probably ready to resume.
Economic Indicators Update
| GMT | Ccy | Events | Actual | Forecast | Previous | Revised |
|---|---|---|---|---|---|---|
| 09:00 | CHF | Credit Suisse Economic Expectations Dec | 0 | -10.8 | ||
| 09:00 | EUR | Eurozone M3 Money Supply Y/Y Nov | 7.30% | 7.60% | 7.70% | |
| 13:30 | USD | Goods Trade Balance(USD) Nov P | -97.8B | -89.0B | -82.9B | |
| 13:30 | USD | Wholesale Inventories Nov P | 1.20% | 1.80% | 2.30% | 2.50% |
| 15:00 | USD | Pending Home Sales M/M Nov | 0.60% | 7.50% | ||
| 15:30 | USD | Crude Oil Inventories | -2.7M | -4.7M |
Stocks Set for a Muted Opening; Omicron Fears Ease
Omicron not yet a problem for the US economy; dollar firms
Omicron fears are easing on growing evidence that the fast-spreading variant leads to milder symptoms. This has prompted optimism about the US growth outlook as the strain has not yet weighed on economic data, despite the surging daily cases of the past week.
The Richmond Fed’s manufacturing survey released on Tuesday rose in December beating consensus estimates. Firms reported their intention to continue raising wages to attract and retain skilled employees, reinforcing fears that inflationary pressures have not yet peaked. This could prove to be a major driving force for the US dollar as the Fed has made clear that its current priority is to combat rising inflation.
The US dollar has moved slightly lower on Wednesday against a basket of currencies, while the 10-year Treasury yields ticked higher. Meanwhile, the Japanese yen emerged today as the biggest loser in the FX arena, retreating against the euro and the greenback. Moreover, commodity based currencies such as the loonie and the aussie are struggling for a second consecutive day.
Has the Wall Street party paused?
On Tuesday, the Dow Jones climbed for a fifth consecutive session, while the S&P 500 and Nasdaq Composite fell by 0.1% and 0.6%, respectively. The substantially low trading volumes exacerbated market fluctuations, with investors shifting from tech and growth stocks into value-oriented names. Moreover, stocks benefitting from the reopening activity outperformed as the Centers for Disease Control (CDC) shortened its isolation guidance for asymptomatic Americans who test positive from ten to five days.
Futures for the major US indices are pointing for a muted opening on Wednesday as investors assess the economic implications of Omicron. Moreover, at the time of writing the European Stoxx 600 index is in the green, while in Asia, Hong Kong’s Hang Seng Index closed 0.83% lower, weighed by the worsening sentiment in China due to Beijing’s tightening of overseas share sales and property sector related risks. Oil prices are losing ground after a strong rebound over the past week, while gold also suffered minor losses on the back of rising long-dated US Treasury yields.
In other news, Elon Musk continued the trimming of his Tesla holdings, selling another 1.02 billion shares of the electric vehicle manufacturer.
US goods trade deficit widened to USD 97.8B in Nov
US goods exports dropped USD -3.3B to USD 154.7B in November. Goods imports rose USD 11.3B to USD 252.4B. Goods trade deficit came in at USD -97.8B, worse than expectation of USD -89.0B, comparing to November's USD -83.2B.
Wholesale inventories rose 1.2% mom to USD 769.9B. Retail inventories rose 2.0% mom to USD 616.9B.
EURGBP Directed Lower by 200-MA
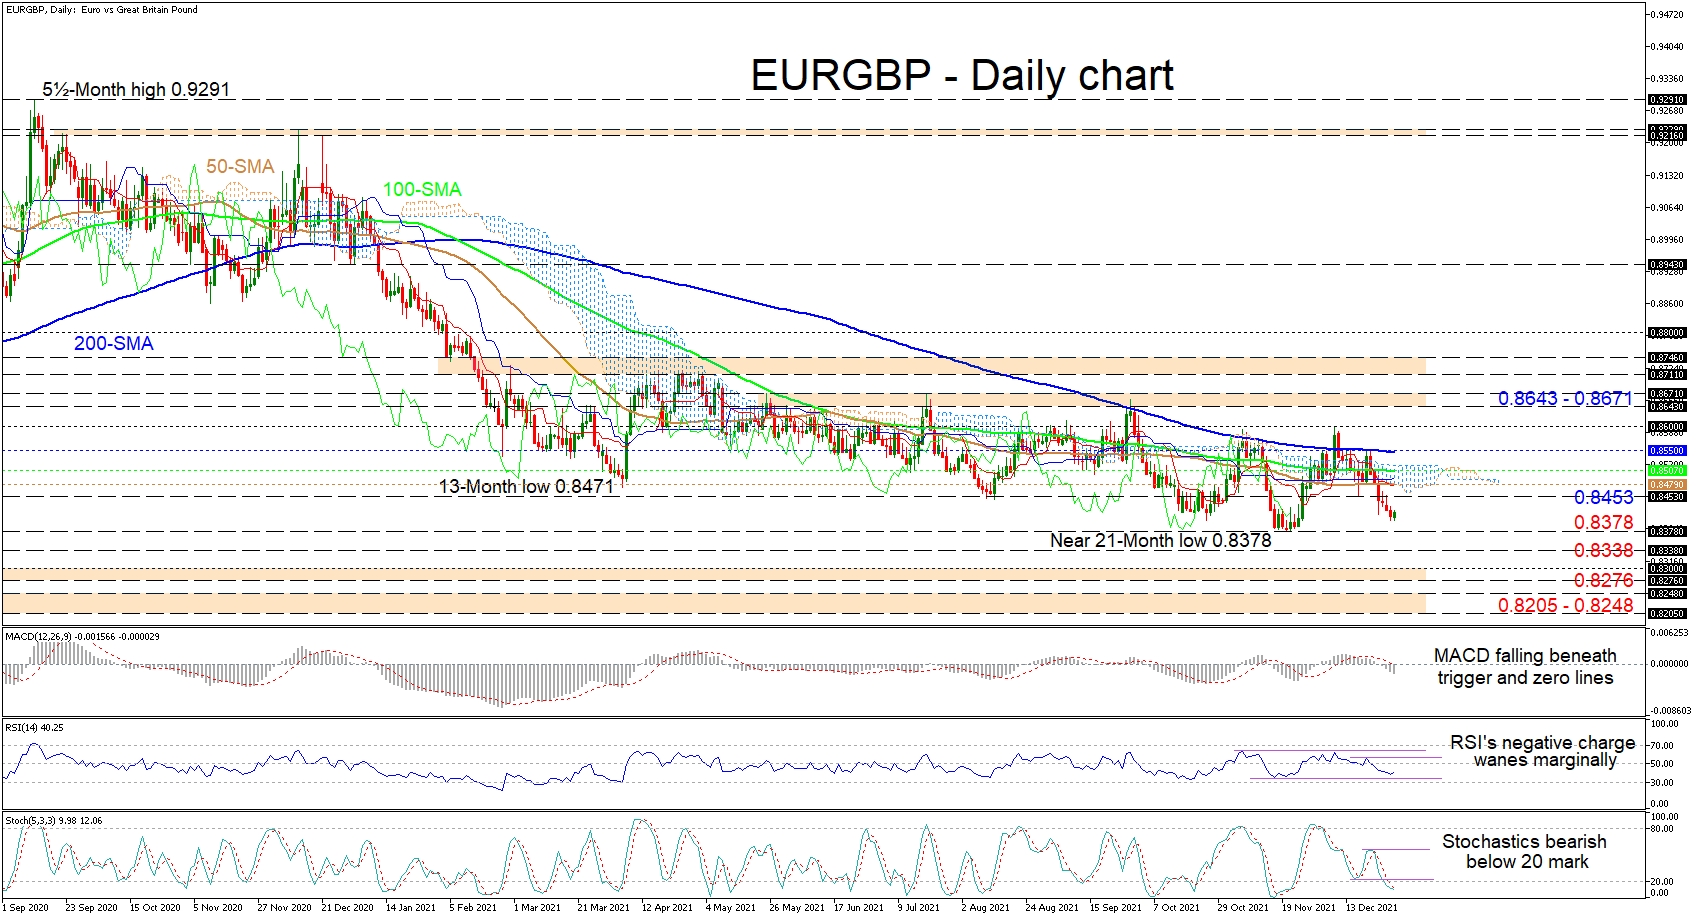
EURGBP sellers have remained in control for more than a week, exacerbating a downward move beneath the Ichimoku cloud after the 200-day simple moving average (SMA) curbed recent attempts of the pair to advance. The relatively flatlined SMAs are endorsing a sideways trajectory and are making it difficult for the price to boost upside momentum.
The Ichimoku lines and the cloud are not hinting of a clear price direction, while the short-term oscillators are exhibiting mixed messages regarding the bearish tone in the pair. The MACD is signalling that negative momentum is growing as it falls south of the zero threshold. That said, the RSI is gliding in bearish territory but is reflecting that buyers are starting to fight back, while the stochastic oscillator is implying that the pair may surrender more ground. This is backed by the stochastic lines, which are sustaining their negative charge in the oversold territory.
If the down move endures, initial support could occur at the near 21-month low of 0.8378. Steering underneath this barrier the pair may tilt increasingly negative, hitting a key low from back in February 2020 at 0.8338 before challenging the now critical support of 0.8276-0.8300. This aforementioned support took shape with the 41-month trough in December 2019 of 0.8276 and the soon followed trough of 0.8281. Nonetheless, a break beneath this would bolster negative tendencies bringing the test of the 0.8205-0.8248 support band into play, which was formed by the lows from the end of June until mid-July 2016.
Alternatively, if buying interest intensifies, the bulls will encounter a fortified zone of resistance approximately extending for a full base point from the 0.8453 low until the 0.8550 high. This section comprises of congested resistance obstacles from the SMAs, the cloud and the Ichimoku lines. So, in the event the bulls muster a profound upward force to conquer this, they may then thrust for the 0.8600 handle. From here, another resistance band of 0.8643-0.8671, involving multiple peaks since May could negate buyers’ efforts to fuel the bullish bearing.
Summarizing, EURGBP is exhibiting a neutral-to-bearish tone beneath the SMAs as it trades in the vicinity of the near 21-month low of 0.8378.
Asian Equities Follow New York Split
Asian markets mixed
Wall Street had a mixed night overnight, even as US yields tracked lower. The dearth of data releases globally continued although the second-tier data from the US continued to be positive. The Case-Shiller House Price Index and US House Price Index releases rose as expected, while the Redbook activity report rose to 21.40% for December YoY, and the Richmond Fed Manufacturing Index and Dallas Fed Services Index both beat expectations.
Investors in big-tech trimmed long positions and it looked for all money like a defensive rotation from growth into value as the Nasdaq fell, while the Dow Jones gained. The S&P 500 was almost unchanged, rising just 0.10%. The Nasdaq fell by 0.56%, while the Dow Jones rose by 0.26%. In Asia, that trend has continued with Dow futures rising another 0.27%, with the S&P unchanged and Nasdaq futures falling 0.15%.
That has led to a North Asia ASEAN split today, with more tech-centric North Asia markets retreating, while ASEAN has moved higher. The Nikkei 225 and South Korean Kospi have dropped by 0.85%. Mainland China is under pressure, the Shanghai Composite easing 0.55% while the CSI 300 has retreated 1.0% lower. Hong Kong has followed them South, falling 0.65%.
Singapore has risen by 0.30% today, with Taipei jumping 0.80% higher, bucking the tech trend lower. Jakarta and Kuala Lumpur are unchanged with, Bangkok rallying by 0.15%, while Manila is 0.40% lower. Australian markets are full of optimism today, led by, you guessed it, banks, and resources. The ASX 200 and All Ordinaries have rallied by 1.15%.
Gold’s Losses Risk Breach Of 1,800 Level Again
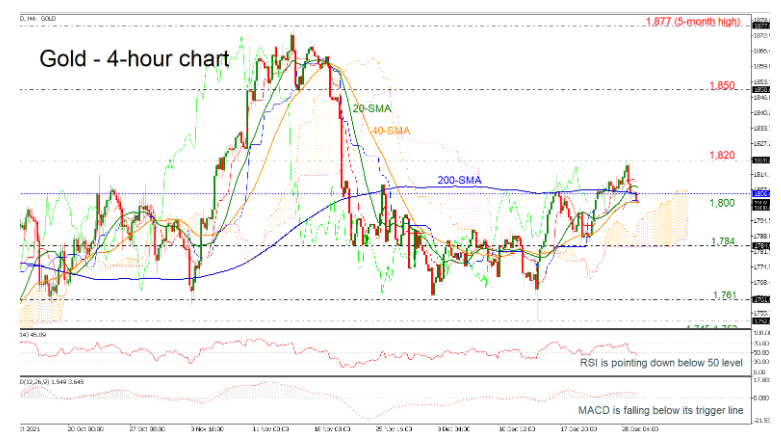
Gold prices are approaching again the 40-period SMA which is near the 1,800 psychological mark. The RSI indicator is ticking south slightly below the neutral threshold of 50, while the MACD is losing momentum below its trigger line and near the zero level. The Ichimoku lines are also pointing down, while the short-term simple moving averages (SMAs) are following the current price action.
The selling interest would likely take the market towards the 1,800 support level before touching the 1,784 recent low, which overlaps with the lower boundary of the Ichimoku cloud. Further losses could move the commodity until the 1,761 barrier.
On the other side, a successful jump above the 200-period SMA could drive the price until the 1,820 resistance ahead of 1,850.
All in all, the yellow metal has been in ascending move over the last two weeks and any advances beyond 1,820 could confirm this outlook.
US Equity Rally Pauses
US equity markets trading sideways
It was a mostly sideways session overnight in New York, the US dollar remained steady, oil held near recent highs, and the equity rally paused for breath. The dearth of data releases globally continued although the second-tier data from the US continued to be positive. The Case-Shiller House Price Index and US House Price Index releases rose as expected, while the Redbook activity report rose to 21.40% for December YoY, and the Richmond Fed Manufacturing Index and Dallas Fed Services Index both beat expectations.
Although omicron cases in the US and Europe amongst others, continue to surge, it has yet to make its presence felt negatively in economic data. Europe’s restrictions will have a tail impact but, for now, markets are overwhelmingly pricing in the latest variant as a milder incarnation, despite its easier contractibility. With market activity much reduced for the holiday season, investors continue to tentatively price in a global recovery hitting a minor bump, and not a pothole.
The Chinese government continues to make soothing comments about lending to the real economy to support more balanced and inclusive growth next year, with the property sector woes taking a backseat, for now. Markets have quickly put the complete lockdown of the city of Xi’an behind them. The narrative will only swing back to negative if the virus escapes the city boundaries and initiates outbreaks in other Chinese cities.
Asia’s calendar remains thin this week, in line with markets elsewhere. Singapore’s Import and Export Prices, and PPI, will be of passing interest, if only because inflationary pressures continue to rise in the City-state. Higher than forecast YoY numbers could cause some reassessment of the Monetary Authority of Singapore’s tightening path, although local equities seem as immune to that reality as they do everywhere else.
The most interesting data tonight will likely be US official crude oil inventories, where omicron’s rampage could show up in higher oil derivative stockpiles. That may give the oil recovery some food for thought but is very unlikely to derail it. The fast-money tail-chasers inhabiting the oil market recently look like they are finally taking a holiday break instead of drinking too much coffee.
South Korean Industrial Production tomorrow and South Korean Inflation and official China PMIs on Friday will be the focus of regional traders still at their desks. Otherwise, we remain at the mercy of headline-driven volatility, a theme that has dominated December.
The major mover overnight was bitcoin, which fell by 6.70% to USD 47,560 of fiat US currency. I can’t see any news behind the move, and I suspect year-end book squaring into thin market conditions exaggerated the range. There is nothing to suggest that Bitcoin’s recent USD 45,000 to USD 52,000 is under threat. Only a daily close above or below those levels hints that a new directional move is in play. Although I consider the crypto space as a whole to be a giant case of the Emperor’s New Clothes and the home moronic speculative banality, I do acknowledge it is a tradeable if not investable, “asset class,” and perhaps more fun than the casino. In that respect, only a weekly close below USD 40,000.00 will have me concerned that another major downside correction is in play.