Sample Category Title
Markets Quiet Ahead of Fed, ECB, BoE, SNB, BoJ, and Lots of Data
The markets are rather quiet in Asian session. Stock indexes are trading higher but no follow through buying is seen. In the forex markets, major pairs and crosses are stuck inside Friday's range, with commodity currencies a touch firmer. Activity could remain subdued with an empty calendar for today. Yet, volatility is guaranteed with five major central bank meeting scheduled for the week, plus a lot of important data ahead.
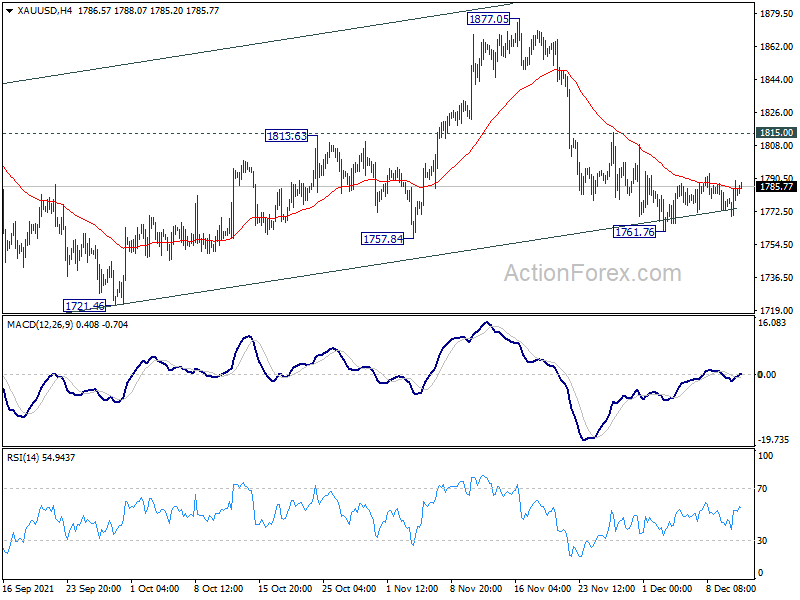
Technically, we continue to pay attention for signs of breakout in Dollar. In particular, we're talking about ranges of 1.1185/1382 in EUR/USD, 112.52/113.94 in USD/JPY and 0.9156/0.9274 in USD/CHF. At the same time, we'll monitor the next movement in Gold to confirm Dollar's direction. For now, more decline is expected in Gold as long as 1815 minor resistance holds. Break of 1761.76 will resume the fall from 1877.05 towards 1721.46 support next.
In Asia, at the time of writing, Nikkei is up 0.87%. Hong Kong HSI is up 1.03%. China Shanghai SSE is up 1.00%. Singapore Strait Times is up 0.29%. Japan 10-year JGB yield is down -0.0025 at 0.054.
Japan Tankan large manufacturing index unchanged a 18, outlook ticked down
According to the BoJ's Tankan survey in Q4, large manufacturing index was unchanged at 18, below expectation of 19. Large manufacturing outlook dropped from 14 to 13, below expectation of 19.
Non-manufacturing index rose sharply from 2 to 9, well above expectation of 6. That's the highest reading since December 2019. Non-manufacturing outlook also rose from 3 to 8, but missed expectation of 10.
Output price index for large enterprises jumped from 10 to 16, highest since the 1980s. Input prices index also rose from .37 to 49, highest since 2008.
Large firms are expecting to increased capital spending by 9.3% in the year ending in March 2022, lower than expectation of 9.8%.
Also released, machine orders rose 3.8% mom in October, above expectation of 2.1% mom. That's the first rise in three months.
NZIER: NZ inflation to stay above RBNZ target mid-point through to 2025
NZIER lowered near-term economic outlook of New Zealand, reflecting the impact of pandemic restrictions, "which turned out to persist for longer than initially expected". For the year to March 2022, GDP growth was revised down from 4.5% to 4.3%. But growth for 2023 was revised up from 4.5% to 4.6%.
Growing capacity pressures are contributing to a sharp rise in inflation. CPI is expected to 5.1% in 2022 (up from prior estimate of 3.0%), and remain elevated above RBNZ's inflation target mid-point of 2% "through to 2025".
NZD trade-weighted index forecast was revised lower "partly reflecting market disappointment at smaller than expected interest rate increased from the Reserve Bank in its November meeting." NZD TWI is expected to peak at 74.5 for the year to March 2023 (revised down from 74.8), then ease to 72.7 in 2025.
Fed, ECB, BoE, SNB, BoJ, plus lots of data
Five major central bank will meet this week. Fed Chair Jerome Powell has already indicated that FOMC will consider faster pace of tapering. That would give Fed more flexibility to raise interest rates earlier to counter inflation, which is at multi-decade high. Fed's new economic projections and more importantly the dot-plot of interest rate expectations would be watched closely.
ECB will need to signal what it's going to with the Pandemic Emergency Purchase Programme next. It's reported that the PEPP will still end in March as scheduled. But ECB would probably boost the regular Asset Purchase Programme temporary to smooth out the transition. The boost could come in as a form of envelope until the end of the year. Also, it could just lift the monthly purchases for a short period of time, and reveal later.
BoE officials had been talking up rate hike even before November meeting. But the outlook changed drastically after the arrival of Omicron and return to restrictions. Even a known hawk Michael Sanders turned cautious, preferring to wait and see Omicron's impact first. So, it's more likely that BoE will keep powder dry for the moment.
SNB is generally expected to keep monetary policy unchanged, and maintain that negative interest rate and the willingness to intervene remain necessary. BoJ will keep the parameters of the QQE with Yield Curve Control unchanged, but it might start scaling back some emergency funding.
The economic calendar is also ultra-busy. Here are some highlights for the week:
- Monday: Japan Tankan survey.
- Tuesday: Australia NAB business confidence; UK employment; Swiss PPI; Eurozone industrial production; US PPI.
- Wednesday: New Zealand current account; Australia Westpac consumer sentiment; China retail sales, fixed asset investment, industrial production; Japan tertiary industry index; UK CPI, PPI; Canada CPI, manufacturing sales; US retail sales, Empire state manufacturing, import price index, business inventories, NAHB housing index, FOMC rate decision.
- Thursday: New Zealand GDP;Australia PMIs, employment; Japan trade balance, PMI manufacturing; Eurozone PMIs; ECB rate decision; UK PMIs, BoE rate decision; SNB rate decision; US Philly Fed survey, jobless claims, building permits and housing starts, industrial production, PMIs.
- Friday: New Zealand ANZ business confidence; BoJ rate decision; Germany PPI, Ifo business climate; UK retail sales; Eurozone CPI final.
EUR/JPY Daily Outlook
Daily Pivots: (S1) 127.97; (P) 128.18; (R1) 128.55; More....
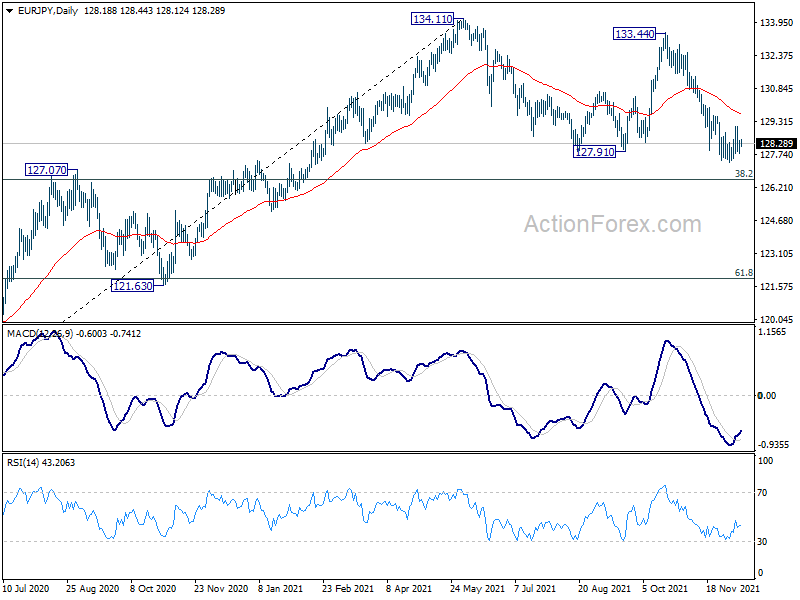
Intraday bias in EUR/JPY remains neutral at this point, as consolidation from 127.36 is extending. On the downside, break of 127.36 will resume larger pattern from 134.11 to 126.58 medium term fibonacci level. We'd look for some support from there to bring rebound. But sustained break of 126.58 will carry larger bearish implications. On the upside, break of 129.09 will bring stronger rebound to 55 day EMA (now at 129.66) and above.
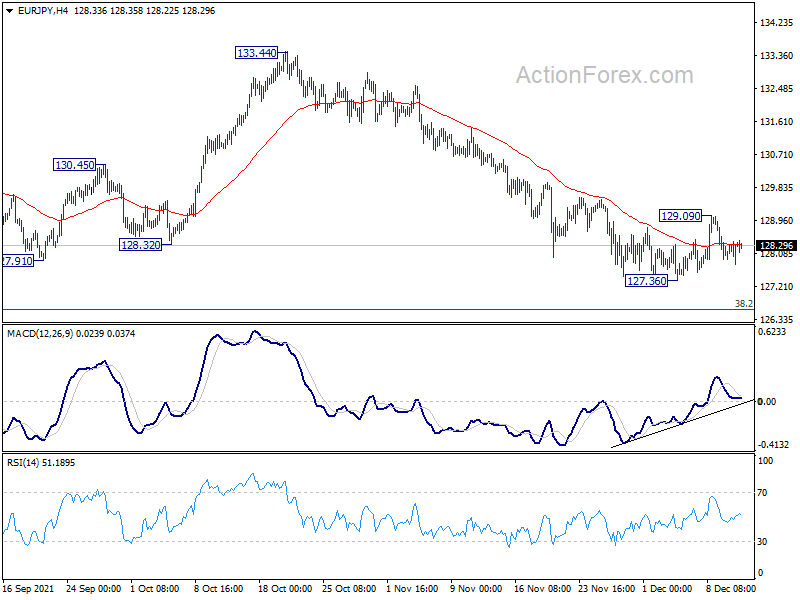
In the bigger picture, as long as 38.2% retracement of 114.42 (2020 low) to 134.11 at 126.58 holds, up trend from 114.42 is still in favor to continue. Break of 134.11 will target long term resistance at 137.49 (2018 high). However, sustained break of 126.58 will raise the chance of medium term bearish reversal. In this case, deeper decline would be seen to 61.8% retracement at 121.94, and possibly below.
Economic Indicators Update
| GMT | Ccy | Events | Actual | Forecast | Previous | Revised |
|---|---|---|---|---|---|---|
| 23:50 | JPY | Tankan Large Manufacturing Index Q4 | 18 | 19 | 18 | |
| 23:50 | JPY | Tankan Non-Manufacturing Index Q4 | 9 | 6 | 2 | |
| 23:50 | JPY | Tankan Large Manufacturing Outlook Q4 | 13 | 19 | 14 | |
| 23:50 | JPY | Tankan Non - Manufacturing Outlook Q4 | 8 | 10 | 3 | |
| 23:50 | JPY | Tankan Large All Industry Capex Q4 | 9.30% | 9.80% | 10.10% | |
| 23:50 | JPY | Machinery Orders M/M Oct | 3.80% | 2.10% | 0.00% | |
| 17:00 | GBP | Financial Stability Report |
Market Morning Briefing: Pound Has Bounced From Support Near 1.3150
STOCKS
Dow, Nikkei, Shanghai and Indian indices are looking strong for the near term while the movement is indecisive in Dax which can move either ways towards 15400 or 15900 from current levels. We may look for an overall upward momentum to continue in most indices mentioned below.
Dow (35970.99, +216.30, +0.60%) rose on Friday and while above immediate trend support at 35750, the view is bullish to see a rise towards 36250-36500 soon.
DAX (15623.31, -15.95, -0.10%) has come down slightly today. While below 15900/800, the index can fall to 15400 or lower. For now we look for a possible range of 15800-15500 to hold over the next couple of sessions.
Nikkei (28696.68, +258.91, +0.91%) has risen above 28500 again. The view is bullish while above 28500 to see a rise towards 29000 and 29500 eventually. A break below 28500 on the other hand, can take the index down towards 28000.
Shanghai (3696.69, +30.35, +0.83%) has risen today. The index has resistance at 3700 which if holds can send the index down to 3600. If Shanghai manages to break above 3700 then the next level to watch will be 3725.
Nifty (17511.30, -5.55, -0.032%) remained in a range of 17400-17535 before closing at 17511.30 on Friday. The resistance at 17600/800 can hold for now and we can see a consolidation before we see any sharp movement.
Sensex (58786.67, -20.46, -0.035%) dipped slightly on Friday. A strong break above 59000/59500 is needed for the view to be bullish towards 60000. Else a range between 58000-59000 can hold for the near term
COMMODITIES
Crude prices have moved up well but have immediate resistances coming up which if holds can produce a fall again soon. Watch price action near 77 on Brent and near 73 on WTI which if hold can produce a decline. Gold and Silver are ranged within 1760-1790 and 21/22-24 respectively and may move up which supports hold. Copper can trade within 4.40-4.25 before breaking on either side of the range.
Brent (76.10) has risen back towards resistance near 77 which can hold and produce a dip to 74-72 again. Any break above 77 would prove our view wrong and force us to look at higher targets of 78/79.
WTI (72.66) fell from trend resistance at 73 last week bust has attempted to rise again. We may expect a range of 73-70 to hold for now before either falling sharply in the medium term towards 68-67 or trying to break above 73. We would be cautious at current levels.
Gold (1786.20) is likely to be ranged within 1790-1760 in the near term. Any break thereafter will indicate further clarity on direction.
Silver (22.29) has support at 22 and 21 which are likely to hold and produce an eventual rise to 24-24.50.
Copper (4.3245) fell is ranged within 4.40-4.25 and may continue so for the next few sessions.
FOREX
Most currency pairs are volatile and within a broad range. Unless the range break on either side, it may not give clarity on further direction from current levels. Hence we may expect the consolidation to continue for a few more days. Dollar Index and Euro remain within 97-95.50 and 1.12-1.14 region while EURJPY can trade within 127.50-129. Aussie and Pound are seen within 0.72-0.73 and 1.3350-1.34 respectively while USDCNY is falling well from 6.38/39 and looks bearish towards 6.35/34. USDINR can test 76.00-76.20 on a rise above 75.80. Watch price action at 75.80 today. A fall can drag the pair towards 75.50. USDJPY is ranged within 112-114.
Dollar Index (96.172) has been ranged below 96.50 for the last few sessions and unable to break on either side of the 97-95.50 range. A break on either side is necessary for the index to give clarity on further direction.
Euro (1.1298) is holding below 1.1355 and has immediate support at 1.1290 which if holds can again push the Euro back towards 1.1355. Broad range of 1.12-1.14 is holding well. A break on either side would be needed in the longer run to indicate further direction. Till then near term is likely to continue within the sideways range.
EURJPY (128.26) has risen from 127.80, slightly above the support at 127.50. A range of 127.50-129 may hold for the near term.
Aussie (0.7166) is in a range below immediate resistance at 0.72. While below 0.72, Aussie can trade within 0.72-0.71 before rising higher towards 0.7250-0.73. View is to see a slow rise in the near term.
Pound (1.3252) has bounced from support near 1.3150 and while it holds there is scope for a rise to 1.335-1.34 soon.
Dollar-Yen (113.54) is holding well below 114 but can fall to 112.70-112.50 on the downside. Upside is likely to be limited at 114 just now. We would wait to see a break on either side for more clarity.
USDCNY (6.3621) tested 6.3820 on Friday and has been falling sharply from there. There is scope for a fall to 6.34 again on the downside. Overall view is bearish while below 6.40-39
{USDINR (75.77) moved up sharply on Friday to close above 75.75. Any break above 75.80 if seen today can open up chances of 76.0-76.20 on the upside before falling back towards 75.50 or lower.
INTEREST RATES
The US Treasury yields remained stable on Friday. The strong surge in the US CPI data on Friday did not have a major impact on the yields. We retain our view of seeing a rise within the expected range in the coming days. The US Federal Reserve meeting on Wednesday will be the next key event to watch. The German yields remain lower and are keeping intact our bearish view of seeing a further fall from here. The European Central Bank (ECB) policy meeting is on Thursday this week. The Indian 10Yr and 5Yr GoI have risen back sharply on Friday and look mixed to move either way from here within their sideways range.
The US 2Yr (0.67%), 5Yr (1.26%), 10Yr (1.50%) and the 30Yr (1.89%) yields remain stable after having fallen on Thursday last week. The view remains the same. 1.35%-1.65% on the 10Yr and 1.7%-2% on the 30Yr is the broad possible range of trade now. Within this, chances are high for the yields to move up towards 1.65% (10Yr) and 2% (30Yr) while they remain above 1.4% and 1.8% respectively.
The German 2Yr (-0.71%), 5Yr (-0.59%), 10Yr (-0.35%) and 30Yr (-0.04%) yields remain lower and stable. The bearish view remains intact as the 0.05% (30Yr) and -0.25% (10Yr) had held well last week. We retain our view of seeing a fall to -0.45% / -0.5% (10Yr) and -0.1% / -0.2% (30Yr) in the coming weeks.
The Indian 10Yr (6.3699%) and 5Yr (5.6857%) have bounced-back sharply on Friday contrary to our expectation to dip further within the expected range. The near-term outlook is mixed. The yields can go on either side within their 6.3%-6.4% (10Yr) and 5.62%-5.73% (5Yr) range in the coming days.
EUR/USD Could Recover If It Clears 1.1400
Key Highlights
- EUR/USD is consolidating above the 1.1220 support zone.
- It cleared a major bearish trend line with resistance near 1.1285 on the 4-hours chart.
- GBP/USD might start an upside correction above the 1.3300 resistance.
- Crude oil price seems to be forming a base for a fresh increase above $73.50.
EUR/USD Technical Analysis
The Euro found support near the 1.1200 and 1.1220 support levels against the US Dollar. EUR/USD is now attempting a recovery wave above the 1.1300 resistance zone.
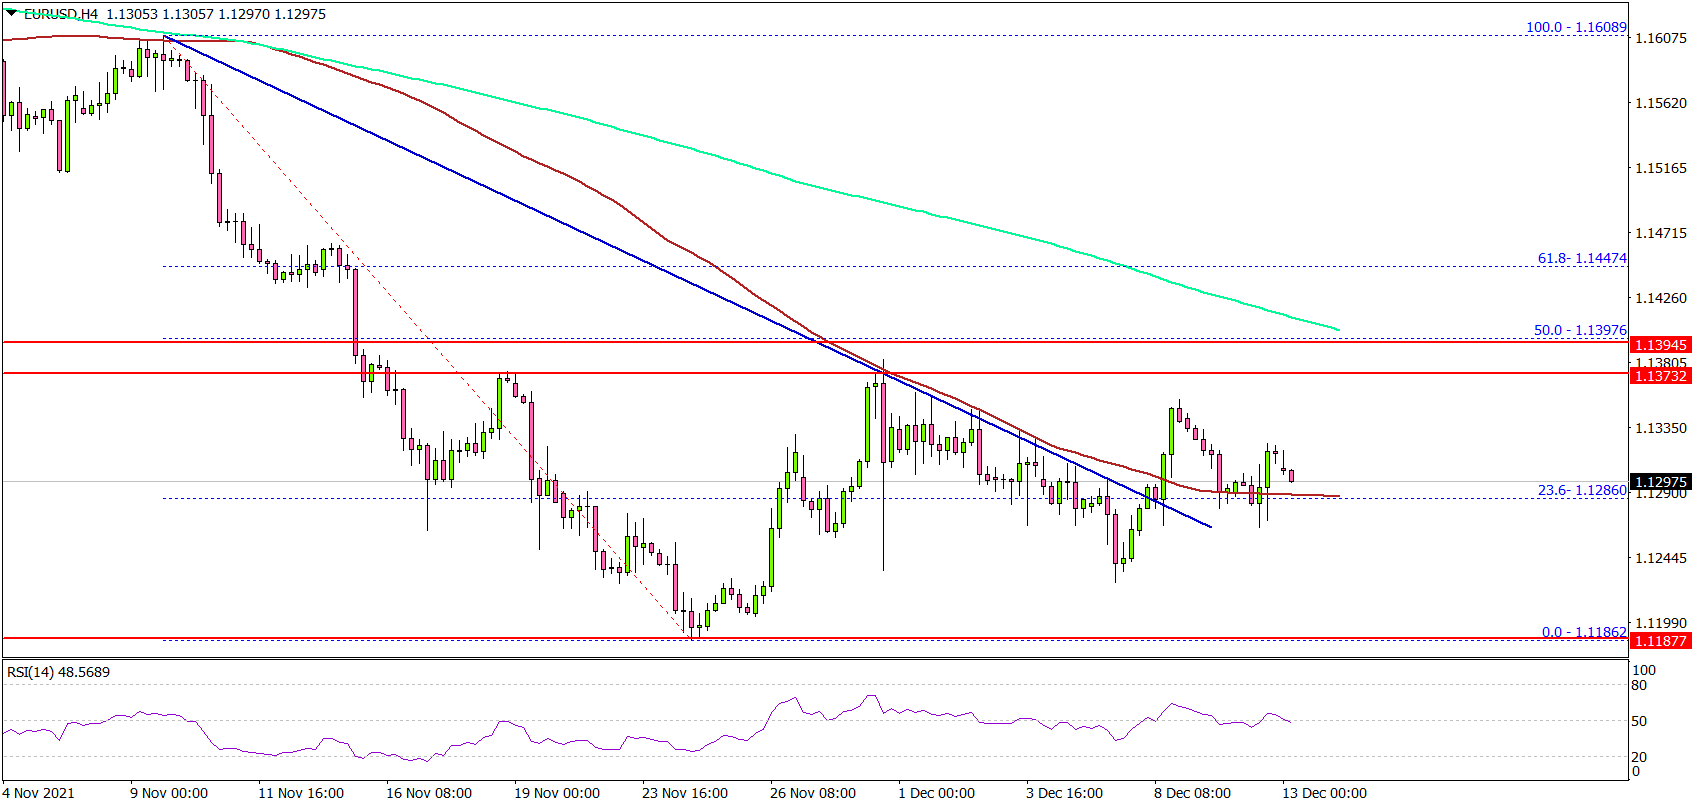
Looking at the 4-hours chart, the pair is attempting a decent upward move above the 1.1300 resistance. The pair even climbed above the 23.6% Fib retracement level of the downward move from the 1.1608 swing high to 1.1186 low.
There was also a break above a major bearish trend line with resistance near 1.1285 on the same chart. The pair even climbed above the 1.1320 level and the 100 simple moving average (red, 4-hours). On the upside, the bulls are now facing resistance near the 1.1380 level.
The next key resistance is near the 50% Fib retracement level of the downward move from the 1.1608 swing high to 1.1186 low. The main resistance is near the 1.1400 level and the 200 simple moving average (green, 4-hours).
A clear break above the 1.1380 and 1.1400 resistance levels could open the doors for a steady upward move. If not, there could be a fresh decline below the 1.1280 support. The next major support is near the 1.1220 level, below which the pair could decline heavily.
Looking at GBP/USD, the pair spiked below the key 1.3200 support zone, and it is now attempting an upside correction.
Economic Releases
- German Wholesale Price Index for Nov 2021 (MoM) – Forecast +1.0%, versus +1.6% previous.
NZIER: NZ inflation to stay above RBNZ target mid-point through to 2025
NZIER lowered near-term economic outlook of New Zealand, reflecting the impact of pandemic restrictions, "which turned out to persist for longer than initially expected". For the year to March 2022, GDP growth was revised down from 4.5% to 4.3%. But growth for 2023 was revised up from 4.5% to 4.6%.
Growing capacity pressures are contributing to a sharp rise in inflation. CPI is expected to 5.1% in 2022 (up from prior estimate of 3.0%), and remain elevated above RBNZ's inflation target mid-point of 2% "through to 2025".
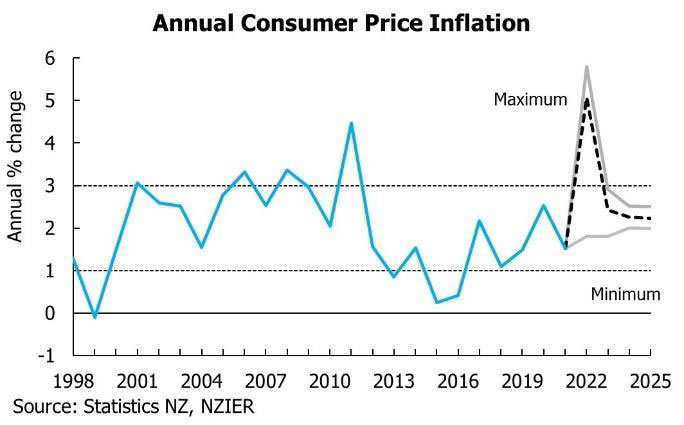
NZD trade-weighted index forecast was revised lower "partly reflecting market disappointment at smaller than expected interest rate increased from the Reserve Bank in its November meeting." NZD TWI is expected to peak at 74.5 for the year to March 2023 (revised down from 74.8), then ease to 72.7 in 2025.
Japan Tankan large manufacturing index unchanged a 18, outlook ticked down
According to the BoJ's Tankan survey in Q4, large manufacturing index was unchanged at 18, below expectation of 19. Large manufacturing outlook dropped from 14 to 13, below expectation of 19.
Non-manufacturing index rose sharply from 2 to 9, well above expectation of 6. That's the highest reading since December 2019. Non-manufacturing outlook also rose from 3 to 8, but missed expectation of 10.
Output price index for large enterprises jumped from 10 to 16, highest since the 1980s. Input prices index also rose from .37 to 49, highest since 2008.
Large firms are expecting to increased capital spending by 9.3% in the year ending in March 2022, lower than expectation of 9.8%.
Also released, machine orders rose 3.8% mom in October, above expectation of 2.1% mom. That's the first rise in three months.
Eco Data 12/13/21
[php_everywhere instance="1"]
FOMC Preview – Fed to Double Size of QE Tapering
The Fed this week will announce acceleration of QE tapering. With inflation approaching 7%, policymakers would likely revise its view on inflation outlook and "retire" the word "transitory". The updated economic projections and median dot plots showing members' interest rate projections would also be released. The Fed funds rate will stay a 0-0.25% until mid-2022.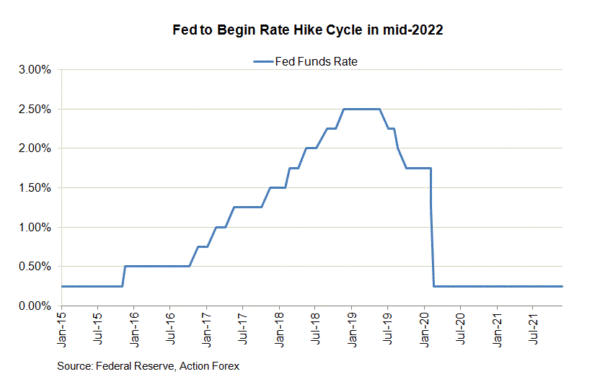
Inflation accelerated to a 39-year higher of +6.8% y/y in November, in line with expectations, from +6.2% in the prior month. Core CPI, inflation excluding food and energy, rose to +4.9% y/y, from October’s +4.6%. The job market remained resilient.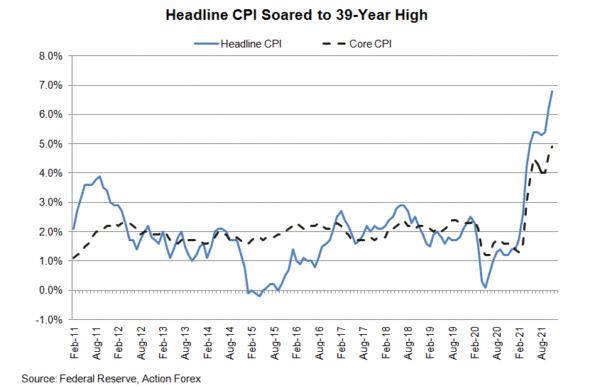
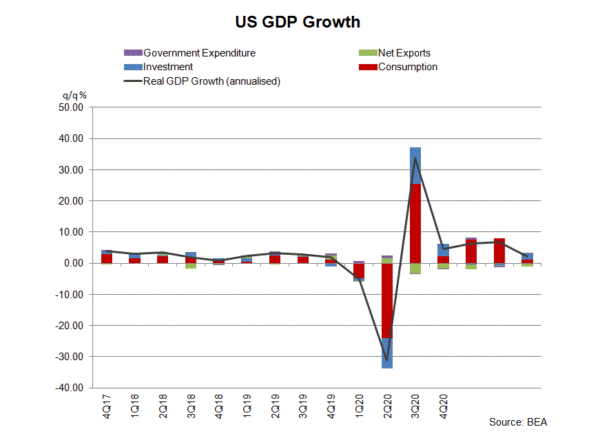
The unemployment rate slipped -0.4 ppt to 4.2% in November, beating consensus of 4.5%. Non-farm payrolls increased +210K, following a +531K addition a month ago. This fell short of market expectations of +550K. Participation rate climbed +0.2 ppt to 61.8% for the month. The economy expanded at an annualized +2.1% q/q in 3Q21, up from +2% in the prior quarter.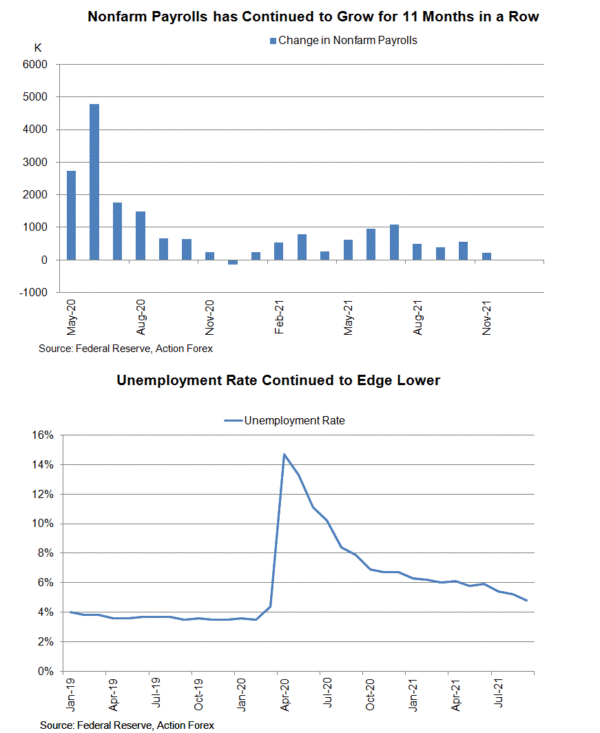
 At a speech before the Congress, Fed chair Jerome Powell suggested that the word “transitory”, meaning that “it won’t leave a permanent mark in the form of higher inflation”, should “retire”. This signaled that Fed realize that elevated inflation is more persistent than previously anticipated. At the updated economic projections, the staff should revise higher inflation rate and lower the unemployment rate.
On the monetary policy, Powell reiterated several times that discussion about accelerating QE tapering at would be made at the December meeting. As he indicated, the central bank is “going to have a conversation at our next meeting about accelerating the taper and ending our asset purchases a few months early”. We expect the Fed to double the size of tapering to US30B / month, a pace that would lead the entire QE program to finish by early March 2022. The focus would then turn to rate hike. CME’s 30-day Fed funds futures currently projects that at least one rate hike will be seen in May 2022.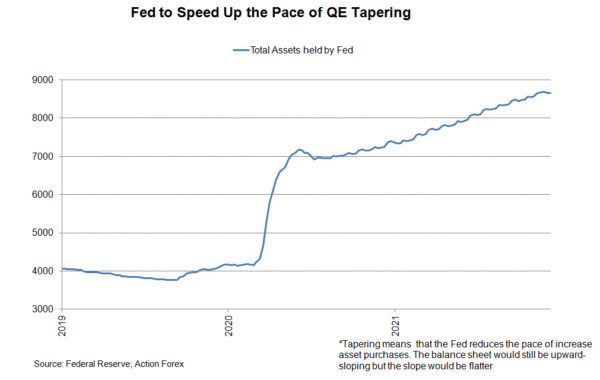
Forex and Cryptocurrency Forecast
EUR/USD: Ahead of the Fed and ECB Meetings
We titled this section of the review "Employment and Inflation Decide Everything" last week. It is these two parameters that determine the monetary policy of central banks in the current situation. The next meeting of the US Federal Reserve will take place on Thursday, December 16, and the markets expect the regulator to speed up the procedure for curtailing incentives, and, perhaps, even increase the interest rate. Undoubtedly, these decisions will be influenced by the macro statistics released in recent days.
The report from the US labor market published on December 09, looks pretty good overall. The number of initial applications for unemployment benefits was expected to grow by 3,000, but it fell by 43,000 to 185,000 instead. This is the minimum in more than half a century, since 1969. On the other hand, the situation with repeated applications turned out to be worse than forecasted: their number increased by 38 thousand instead of falling by 72 thousand. But if we sum up both indicators, we get a reduction in applications by 5,000, which confirms the trend towards the recovery of the labor market. Moreover, the number of open vacancies has grown by 431 thousand: there is already a shortage of labor in the United States.
As for inflation, the higher it is, the greater the chances that the Fed will begin to tighten its monetary policy even faster. And we are talking not only about reducing the repurchase of assets, but also about raising the key rate, which can lead to a further strengthening of the dollar.
Inflation in the United States has currently reached record levels in more than forty years and, judging by the data released on December 10, continues to grow. The consumer price index (CPI) rose to 6.8% on an annualized basis in November from 6.2% in October. As for the core index (Core CPI), it was 4.9% YOY, which is also higher than the previous value (4.6% in October). And the market will be now waiting to see how the Fed will react to these numbers at the upcoming meeting. The head of this organization Jerome Powell and his colleagues convinced investors earlier of their readiness for aggressive monetary restrictions.
About 70% of Financial Times experts believe that the return of monetary policy to the pre-Covid level will proceed quite smoothly, and the interest rate will reach 1.5% by the end of 2023 (it is 0.25% now). At the same time, only 10% of the surveyed analysts expect that the first stage of the rate hike will occur in the Q1 of 2022, 50% are betting on the Q2. As for the complete curtailment of the $120 billion quantitative easing (QE) program, more than half of the respondents believe that this will happen by the end of March of the coming year.
The next meeting of the European Central Bank will be held on the same day as the Fed meeting on Thursday, December 16. We have already written that, unlike the Fed, the ECB plans to take its first step in this direction only in 2023. It will calmly watch the record price increases in the Eurozone countries until then. But there are chances that the European regulator will nevertheless decide to accelerate, following the example of its overseas colleague, and turn from a dove into a hawk. This will be a pleasant surprise for the EUR/USD bulls. And this cannot be ruled out, especially since the hawkish statements of such authoritative officials as Isabel Schnabel are beginning to sound from the depths of the ECB.
This member of the Bank's Governing Council said the other day that asset purchases were an important tool during market shocks and recessions, but the balance of QE advantages and disadvantages deteriorates during the period of economic growth, increasing the risks of financial instability. And the market reacted by albeit short-term, growth of the European currency even to this, in general not binding statement of Mrs. Schnabel.
In anticipation of the Fed and ECB meetings, the EUR/USD pair revolves around Pivot Point 1.1300 for the second consecutive week. This time, it completed the five-day period near this line at 1.1316. Among experts, 75% expect further strengthening of the US currency, 20% are betting on the growth of the euro. The remaining 5% have taken a neutral position.
But the two-week sideways trend causes confusion and discord among the indicators on D1. As for trend indicators, 60% are colored red, 40% are green. As for oscillators, 40% point to the south, 30% to the north and another 30% to the east. Resistance levels are located in the zones and at levels 1.1355, 1.1380, 1.1435-1.1465 and 1525. The nearest support level is 1.1300, then 1.1265, 1.1225, 1.1185, then 1.1075-1.1100
As for the events of the coming week, in addition to the meetings of the Central Banks and subsequent comments of their management, the release of statistics on retail sales in the US on Wednesday December 15, as well as the publication of data on business activity in Germany and the Eurozone on December 16 should be noted. In addition, a meeting of the European Council will take place on Thursday and Friday.
GBP/USD: Ahead of Fed and Bank of England Meetings
December 16 will bring a lot of excitement to traders: in addition to the Fed and the ECB, the Bank of England will also make a decision on further monetary policy and interest rates on this day. The value of the business activity index in the UK services sector Markit will become known the same day. In addition, data on unemployment will be released on Tuesday December 14 and inflation in the UK consumer market on Wednesday 15 December.
The pound weakened last week after the UK government introduced new quarantine measures due to a new strain of COVID-19. According to statistics, the number of infections with the Omicron strain doubles every two to three days. Simple calculations show that with such dynamics, the number of infections may exceed 1 million by the end of the month (10.6 million cases have been recorded in the country since the beginning of the pandemic). The situation is of concern for investors, and therefore they do want to receive information from the Bank of England whether the Omicron coronavirus strain has influenced the plans to curtail the stimulus program.
The bulls for the GBP/USD pair were not pleased with weak macro-economic statistics, which turned out to be worse than forecasted. Also, the pound continues to be under pressure from the consequences of Brexit and significant disagreements between the EU and the UK over the Northern Ireland Protocol, due to which, according to British officials, the country is faced with a shortage of goods and supply disruptions.
At the same time, 40% of analysts still hope for the pair to grow. But if the Bank of England does not raise rates again, their hopes will melt like the morning fog over London. And given the government's position on quarantine, the regulator is highly likely to leave the rate unchanged at least until February 2022. The majority (60%) of the experts vote for this outcome of the meeting.
Pending regulatory decisions, the GBP/USD pair completed the session in the same way it traded a week ago: in the 1.3265 zone. However, despite this, 75% of the trend indicators on D1 still support the bears. Among the oscillators there are 80% of them, the remaining 20% turned upward.
Task No.1 for the bulls is to overcome the key resistance in the 1.3285-1.3300 zone. And this will not be a problem if the Bank of England does raise the interest rate on December 16. Subsequent resistances are located at levels 1.3360, 1.3410, 1.3475, 1.3515, 1.3570, 1.3610, 1.3735, 1.3835. The nearest support is located in the 1.3210-1.3220 zone, followed by the levels 1.3195, 1.3160, 1.3135, 1.3075. In case of a breakout of the latter, the pair may fall down to the horizon of 1.2960.
USD/JPY: The Yen Holds Defense. It holds it so far
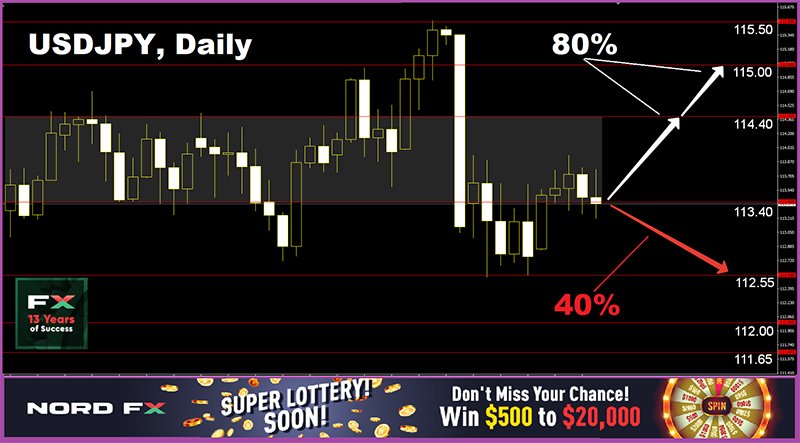
If the EUR/USD pair revolves around 1.1300 for the second week, USD/JPY does the same, only around 113.30. The risk appetites that returned to the market and pushed up the stock indices, could not have any significant effect on the Japanese currency, which was supported by the statement of the member of the Board of the Bank of Japan Hitoshi Suzuki. He said commenting on the COVID-19 situation that if the US Federal Reserve starts to cut QE and raises interest rates faster than expected, the Bank of Japan could also raise long-term rates. According to Hitoshi Suzuki, rates may rise as soon as the coronavirus uncertainty disappears, which will help the Japanese economy continue to recover. It is certainly not worth expecting that the increase will take place at the next meeting of the regulator on Friday, December 17. The rate is most likely to remain at the previous negative level of -0.1%.
The deputy head of the Bank Masayoshi Amamiya tried to add optimism to investors. The country's economy was in stagnation, but, according to the regulator's calculations, it should recover during 2022, even despite the Omicron strain. The official's comments came after the very weak data on Japan's GDP for the Q3 were released on Wednesday, December 8. They showed a drop of 0.9% against the previous value of minus 0.8% and a positive forecast of +0.4%.
Giving the previous forecast, most experts expected the USD/JPY pair to make another attempt to return to the 113.40-114.40 channel. This is exactly what happened: the dollar began to advance, and it rose to the height of 113.95 on December 8, although then there followed a trend reversal a finish at the lower border of the channel, at 113.40.
As for the forecast for the coming week, 80% of experts believe that the pair will go up again with the help of the US Federal Reserve and, possibly, even break through the upper border of the 113.40-114.40 channel. The resistance levels are 113.70, 114.00, 114.40, 114.70, 115.00 and 115.50, the long-term target of the bulls is the December 2016 high of 118.65. Only 20% of analysts vote for the bearish scenario. The nearest support level is 112.55, then 112.00 and 111.65.
Among the oscillators on D1, 60% are still facing south, 30% remain neutral, and the remaining 10% have turned north. Trend indicators have a 50-50 draw.
CRYPTOCURRENCIES: Investors Bet on Ethereum
There is still no definite explanation why bitcoin fell below $42,000 on the night of December 04. However, it is worth paying attention to the fact that the fall of the crypto market took place together with the fall of the stock market and the flight of investors from risky assets. The reason for this was the news about the largest real estate developer in China Evergrande. The media reported that its founder was summoned to the government because of the possible bankruptcy of the company, which could create serious problems for the entire world economy.
Galaxy Digital Research analysts believe that is not the case. The triggers for the collapse, in their opinion, were the general nervousness due to the new COVID-19 strain Omicron and the statement by Fed Chairman Jerome Powell about a possible faster curtailment of the QE program.
Be that as it may but having set a record on November 10 at the height of $68,780, the flagship cryptocurrency is rolling down for the fifth week in a row. And the optimism of experts and investors also decreases along with its value.
Bitwise Asset Management Chief Investment Officer Matt Hougan believes that bitcoin is now unlikely to have time to update the highs and reach $100,000 before the end of 2021. "I think this level could be the goal for 2022," said the top manager in an interview with Bloomberg. Growth should be driven by growing support from institutions, and for this, in his opinion, there are "fundamental driving forces".
Louis Navellier, a famous investor and economist, believes that the "driving forces", on the contrary, are directed downwards. A large bubble has been inflated in the stock market, which could lead to a strong correction of risky assets, as a result of which bitcoin could fall to $10,000.
Navellier recalled that a serious drop in the rate of the main cryptocurrency also followed during a similar correction in February-March 2020. This time, in his opinion, the situation could be even worse, and bitcoin could lose up to 80% of its capitalization. And this may be facilitated by the actions of the US Federal Reserve to tighten monetary policy.
"A fall below $46,000 (200-day moving average) would be a bearish signal. Bitcoin must fall to $28,500 to complete the double top pattern, and such a decline could indicate a drop below $10,000. This is an 80% decline and bitcoin has already shown similar behavior," the investor said, referring to the end of 2017.
Recall that then, a prolonged fall followed after a dizzying rise to $19,270. It lasted about a year and was called the crypto winter, during which the BTC/USD pair lost almost 85%.
A sharp turn to the south occurred not only in 2017, but also in the second half of 2019. And, of course, one cannot but recall a very recent example: April-July of this year, when bitcoin quotes sank 55% in three months.
These bearish waves hit the pockets and wallets of speculators hard and made us talk about a possible complete and final collapse of the crypto market once again. 99bitcoins calculated: the year is not over yet, and BTC has already been predicted death 41 times. The opponents of the coin were even more active only in 2017 and 2018: the premature death of the asset was reported 124 and 93 times then.
The latter of the current obituaries is by economist Bill Blain. Blain calls bitcoin a Ponzi scheme incapable of fulfilling the function of money, and argues that cryptocurrency accelerates inflation. Moreover, unlike a number of other crypto critics, Blain also doubts the blockchain technology: "From time to time, I dig through the myriad of garbage that disguises itself as the genius of the blockchain, mathematics and computational logic underlying cryptography... This is 10% fascinating and 90% complete nonsense," he writes.
Well-known analyst and trader Ton Weiss, unlike Bill Blain and Louis Navellier, believes that it is too early to bury cryptocurrency. In his opinion, bitcoin has a better chance of reaching a new all-time high this year after the current collapse. The coin needs to gain a foothold above $53,500 for the bulls to seize the initiative. "I think it will be like a V-turn. We will not have another chance to buy bitcoin below $50,000," Weiss believes.
If, under negative circumstances, the decline still continues, it will certainly attract the interest of long-term holders. Every time a pullback occurs, investors begin to buy out the fall in anticipation of a new rise in price, and do not allow the crypto market to fall into an uncontrolled collapse.
So large bitcoin holders (from 100 to 10 thousand BTC) have already bought 67,000 coins last week. Of course, this is not a lot. Therefore, there is no need to talk about a return to the bullish trend yet. On the contrary, the advantage is still in the hands (or rather, in their paws) of the bears who are trying to push the BTC/USD pair below the $46,000-48,000 zone, where the 200-day moving average passes.
At the time of writing the review (on the night of December 10 to December 11), the total capitalization of the crypto market is $2.215 trillion (minus 25% compared to the historical maximum of November 10). The Crypto Fear & Greed Index is still in the Extreme Fear zone at 24 points. But the bitcoin dominance index dropped to 39.88%, yielding more and more "territory" to its main competitor, ethereum, whose market share reached 22%. (For comparison, 71.86% for BTC and 10.63% for ETH at the very beginning of the year).
The ETH/USD chart shows clearly that ethereum is recovering significantly better than bitcoin after falling on December 04. And if the BTC/USD pair has grown by a little more than 55% over the past five months, the increase in ETH/USD was more than 130%.
The main driver of its growth in recent months has been the burning of coins for transactions on the network and the fact that the rate of their burning outstrips the rate of their production. The ethereum network has already burned more than 1 million coins since the activation of the London hard fork.
Rahul Rai, the manager of the cryptocurrency fund BlockTower Capital, believes that the versatility of the ethereum blockchain will be the main factor that will attract both developers and investors. He is confident that if ethereum manages to restart the global financial system, its market will be much larger than that of bitcoin in the future. The crypto millionaire predicts that it may be as early as mid-2022. ETH will be the first cryptocurrency in terms of capitalization.
Analysts of the American investment bank JPMorgan made a similar statement in April. In their opinion, bitcoin is a consumer commodity. It can compete with precious metals and be seen as a store of value, but it will give way to ethereum in the long run, which is the pillar of the cryptocurrency economy.
Director of Bitwise Asset Management Matt Hougan predicted an "explosion of activity based on ethereum" in his forecast for 2022 as well. "Investors will look at Ethereum, Solana or Polygon. They are beginning to understand that cryptocurrency is more than just bitcoin," says Hougan.
EUR/USD Weekly Outlook
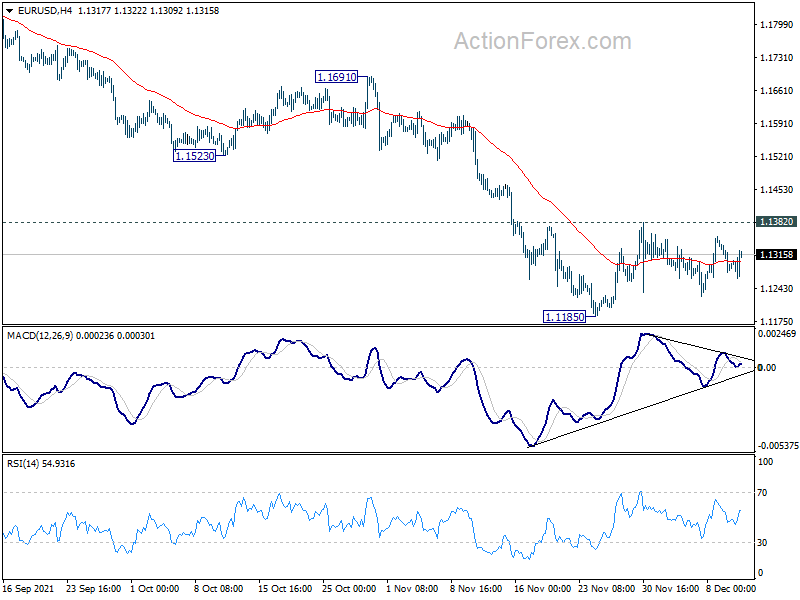
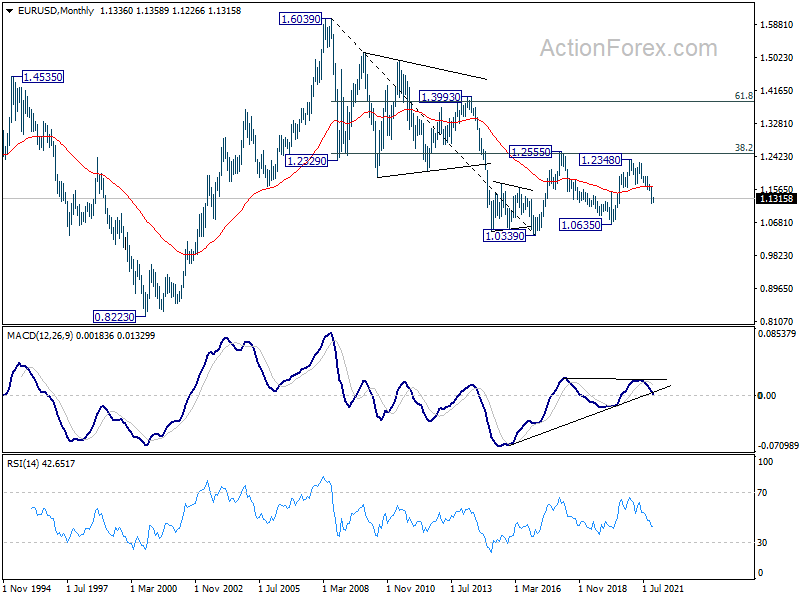
EUR/USD stayed in consolidation from 1.1185 last week and outlook is unchanged. Initial bias remains neutral this week first. Downside breakout is mildly in favor with 1.1382 minor resistance intact. On the downside, break of 1.1185 will resume larger fall from 1.2348. Next target is 161.8% projection of 1.2265 to 1.1663 from 1.1908 at 1.0934. On the upside, however, firm break of 1.1382 resistance should confirm short term bottoming at 1.1186. Intraday bias will be turned back to the upside for 55 day EMA (now at 1.1462).
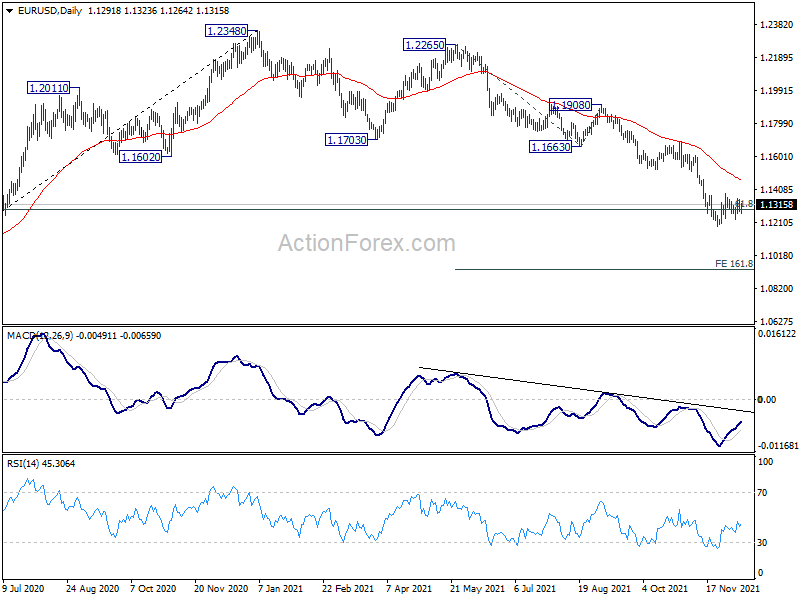
In the bigger picture, there are various ways of interpreting the fall from 1.2348 (2021 high). It could be a correction to rise from 1.0635 (2020 low), the fourth leg of a sideway pattern from 1.0339 (2017 low), or resuming long term down trend. In any case, outlook will now stay bearish as long as 1.1703 support turned resistance holds. Sustained break of 61.8% retracement of 1.0635 to 1.2348 at 1.1289 would pave the way back to 1.0635.
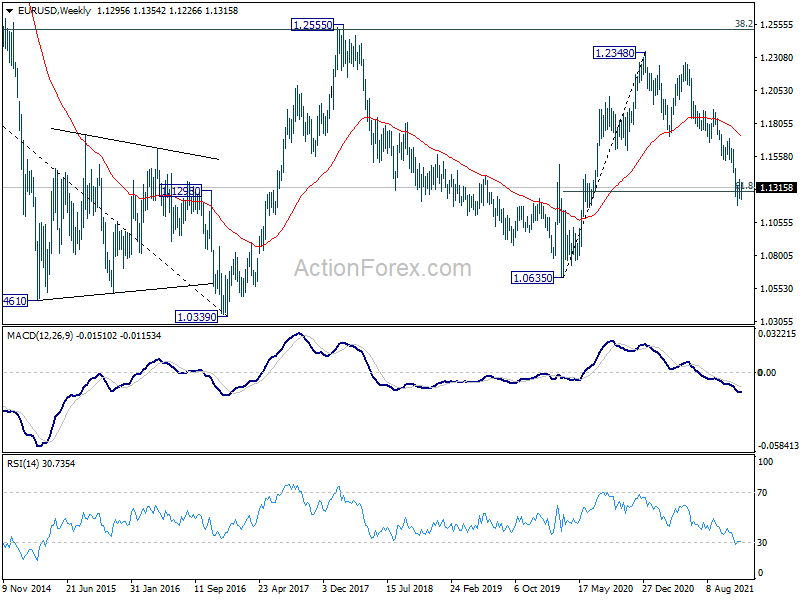
In the long term picture, EUR/USD has possibly failed 1.2555 cluster resistance (38.2% retracement of 1.6039 to 1.0339 at 1.2516) again. Long term outlook will remain neutral as sideway pattern from 1.0339 (2017 low) is extending with another medium term fall. For now, we'd hold back from assessing the chance of downside breakout, and monitor the momentum of the decline from 1.2348 first.
USD/JPY Weekly Outlook
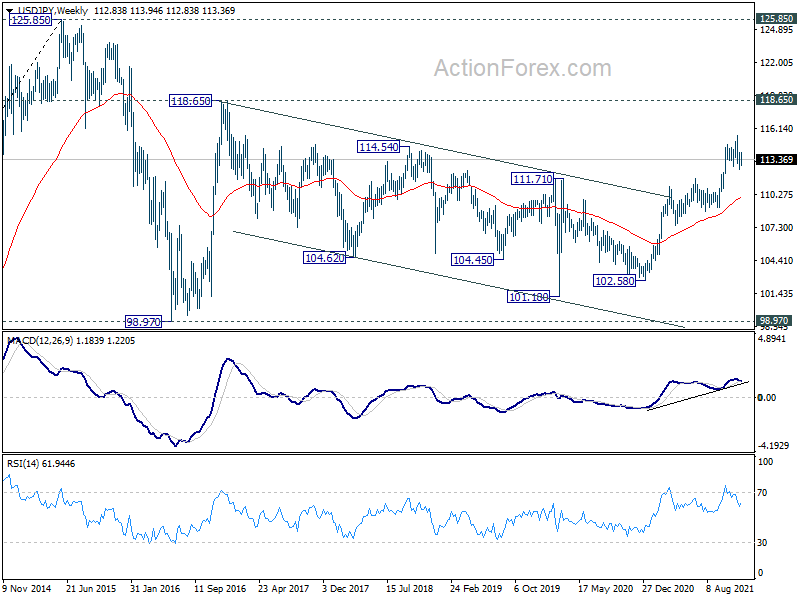
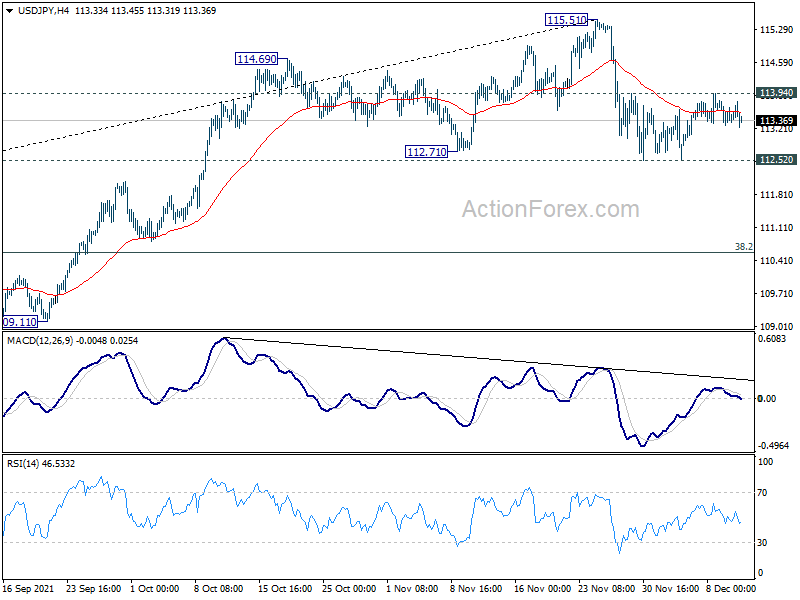
USD/JPY stayed in tight range last week and outlook is unchanged. Initial bias remains neutral this week first. On the downside, sustained break of 112.71 will argue that it's already correcting whole rise from 102.58. Deeper fall would be seen to 38.2% retracement of 102.58 to 115.51 at 110.57. On the upside, break of 113.94 minor resistance will turn bias back to the upside for retesting 115.51 high instead.
In the bigger picture, no change in the view that rise from 102.58 is the third leg of the up trend from 101.18 (2020 low). Such rally should target a test on 118.65 (2016 high) on resumption. However, firm break of 109.11 structural support will argue that the trend might have reversed and bring deeper fall to 107.47 support and possibly below.
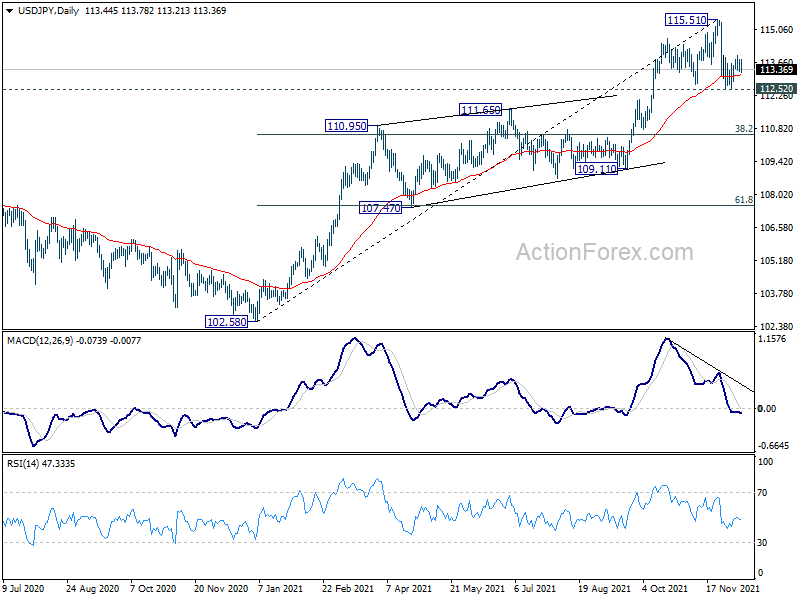
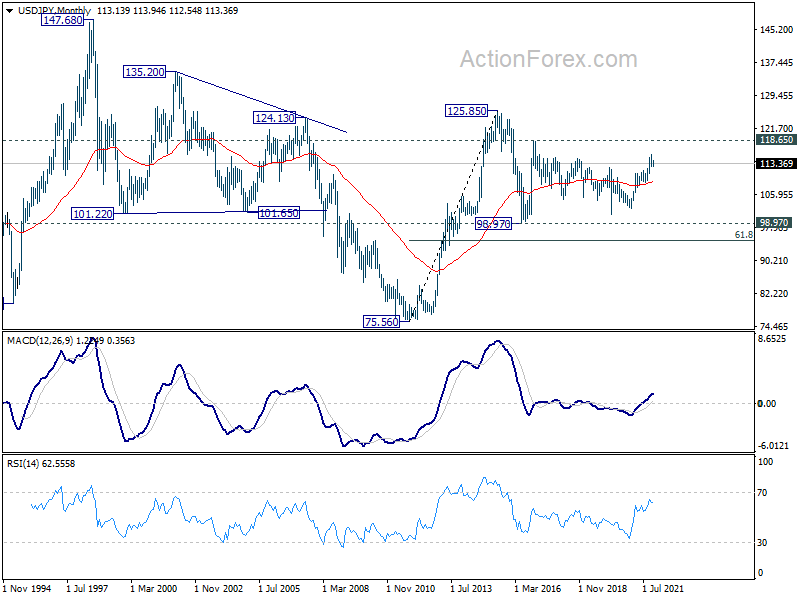
In the long term picture, the rise from 75.56 (2011 low) long term bottom to 125.85 (2015 high) is viewed as an impulsive move, no change in this view. Price actions from 125.85 are seen as a corrective pattern which could still extend. In case of deeper fall, downside should be contained by 61.8% retracement of 75.56 to 125.85 at 94.77. Up trend from 75.56 is expected to resume at a later stage for above 135.20/147.68 resistance zone.