

Sample Category Title
BoJ Amamiya: No need to adjust large-scale monetary easing at present
BoJ Deputy Governor Masayoshi Amamiya said in a speech that Japan's inflation rate is still "far below the price stability target of 2 percent". CPI is projected to be just around 1% even in fiscal 2023, the end of the current projection period. Therefore, BoJ will "persistently continue with powerful monetary easing" under the current QQE with yield curve control.
While central banks in US and Europe have recently started adjusting their monetary policy, the situation is different in Japan. Amamiya said, "given the price developments in Japan I have described, I think it makes sense that the Bank does not actually need to adjust its large-scale monetary easing at present".
EUR/USD – Can It Turn Things Around?
Or are there bigger falls to come?
The euro is trading lower against the dollar again after a brief rebound late last month. But was the rebound brief or is there more to come?
While the one-hour chart appears to show no shortage of momentum, the latest daily candle appears to indicate some hesitation. That appears to be contradictory, but the fact that this happened so close to the prior lows may be significant.
The question is whether the hesitation near the lows or the momentum on the shorter-timeframe is more significant. It’s hard to ignore either but it should become clear one way or the other, and very soon.
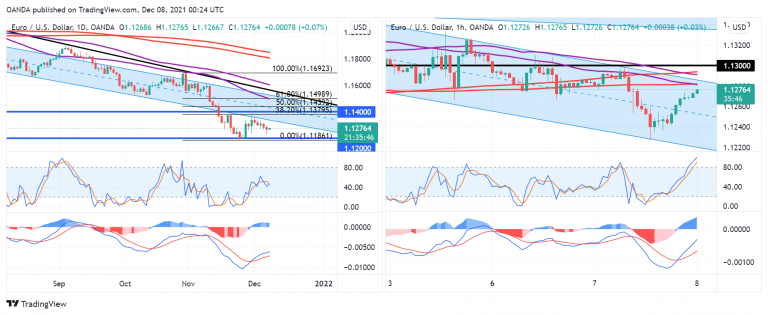
Another failure to break the lows could come on rapidly deteriorating momentum, or a breakout could occur on much more.
Or, we could see a breakaway attempt in the other direction. The first hurdle here is 1.13. A move above here takes us above the descending channel on the one-hour chart, and the 55/89 and 200/233-hour SMA bands.
That would be a strong bullish signal on the hour chart that may generate some upward momentum in the near term and could lead to a broader correction on the longer timeframes.
Elliott Wave View: AUDUSD Corrective Zigzag Rally In Progress
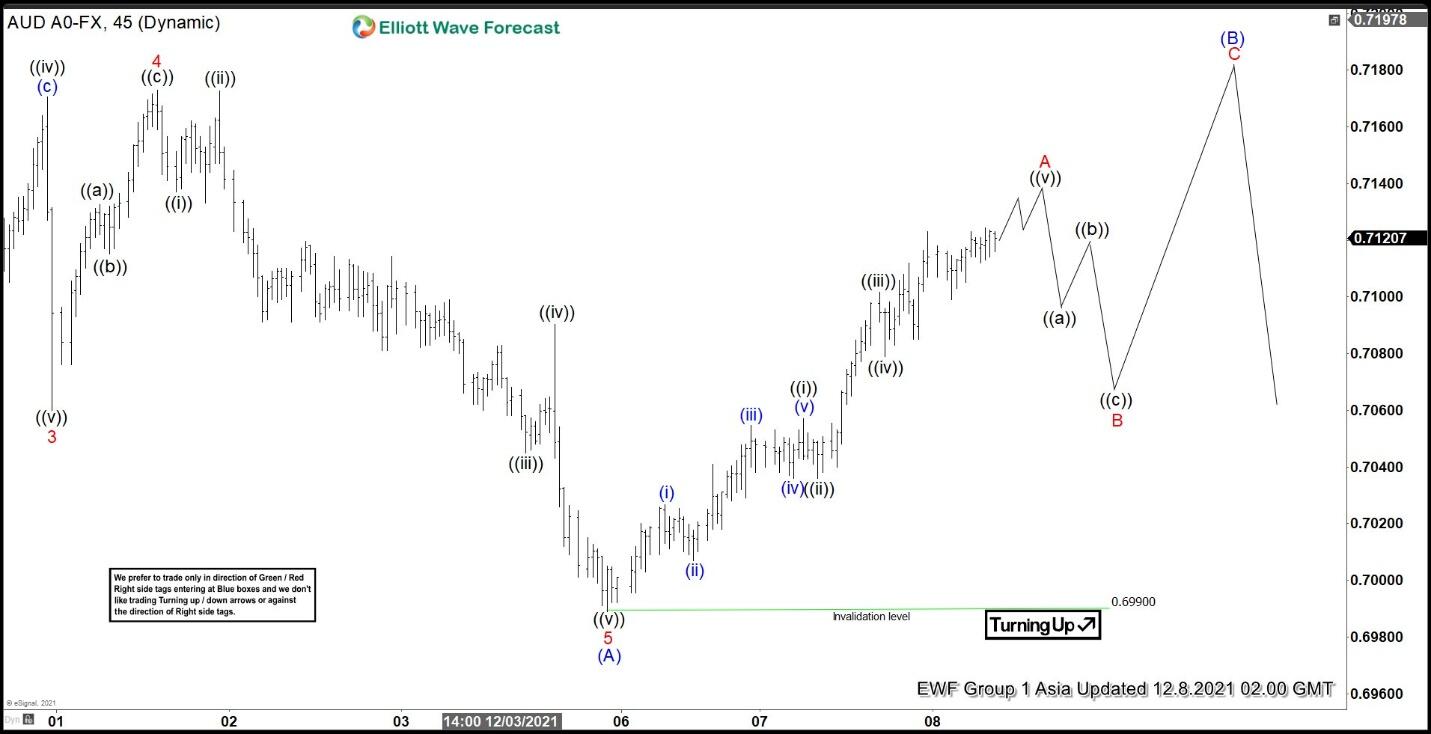
AUDUSD shows a 5 swing incomplete bearish sequence from February 2021 peak favoring further downside to complete a 7 swing double three Elliott Wave structure. Short Term Elliott Wave view suggests AUDUSD ended cycle from October 29, 2021 peak in wave (A) at 0.6993. The internal structure of wave (A) unfolded as a 5 waves impulse. Down from October 29 high, wave 1 ended at 0.7357 and rally in wave 2 ended at 0.743. Pair resumes lower in wave 3 towards 0.706 and bounce in wave 4 ended at 0.7173. Final leg lower wave 5 ended at 0.6989 which completed wave (A) in higher degree.
Rally in wave (B) is in progress to correct cycle from October 29 peak before pair resumes lower again. Internal of wave (B) is unfolding as a zigzag Elliott Wave structure. Near term, expect pair to end wave A of this zigzag soon, then it should pullback in wave B to correct the rally from December 4, 2021 low before pair resumes higher again. Near term, as far as pivot at 0.699 low stays intact, expect dips to find support in 3, 7, or 11 swing for more upside.
AUDUSD 45 Minutes Elliott Wave Chart
NZD/USD Could Extend Decline Below 0.6700
Key Highlights
- NZD/USD started a major decline from well above 0.7000.
- A crucial bearish trend line is forming with resistance near 0.6840 on the 4-hours chart.
- EUR/USD is struggling to recover and might extend losses.
- GBP/USD could continue to move down below 1.3150.
NZD/USD Technical Analysis
The New Zealand Dollar started a major decline from 0.7150 against the US Dollar. NZD/USD gained bearish momentum after it broke the 0.7000 support level.
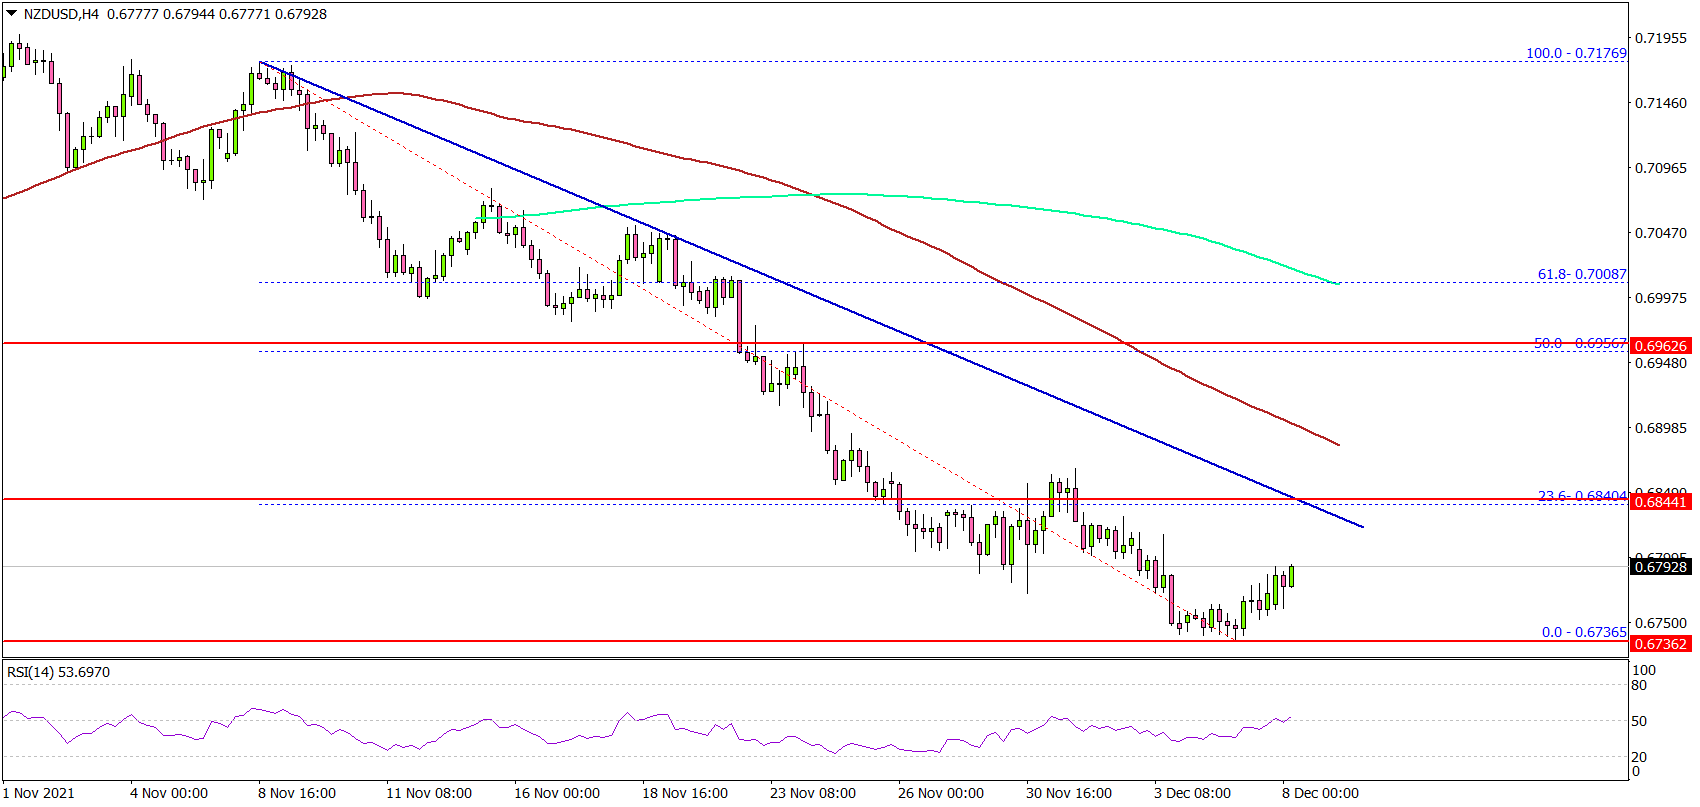
Looking at the 4-hours chart, the pair even settled below 0.7000, the 100 simple moving average (red, 4-hours), and the 200 simple moving average (green, 4-hours).
The pair even broke the 0.6850 support level. It tested the 0.6740 zone and is currently consolidating losses. On the upside, the pair is facing resistance near 0.6800. There is also a crucial bearish trend line forming with resistance near 0.6840 on the same chart.
The trend line is close to the 23.6% Fib retracement level of the downward move from the 0.7176 swing high to 0.6736 low.
The next major resistance is near 0.6950 or the 50% Fib retracement level of the downward move from 0.7176 swing high to 0.6736 low. A clear break above the trend line resistance and then 0.6950 could open the doors for a steady upward move.
If not, there could be more losses below the 0.6730 and 0.6700 support levels. In the stated case, the pair may possibly decline towards the 0.6550 level.
Looking at EUR/USD, the pair is showing bearish signs and might continue to slide below 1.1200. Besides, GBP/USD could also decline further below 1.3150.
Economic Releases
- BoC Interest Rate Decision – Forecast 0.25%, versus 0.25% previous.
Market Morning Briefing: Aussie Is Now Trading Just Above 0.7100
STOCKS
Most global indices amongst the ones mentioned below have risen sharply over 1% except the Shanghai which rose by 0.71% today. The strongest movement among them is seen in Dax with a 2.82% rise seen yesterday. We may expect the indices to remain strong for this week followed by another leg of decline soon. Watch important resistances above current levels.
Dow (35719.43, +492.40, +1.40%%) has broken above the resistance at 35500. Now a break above 35750, if seen and sustained would be bullish for a rise towards 36500-37000.
DAX (15813.94, +433.15, +2.82%) has risen sharply breaking above our expected 15800 mentioned yesterday. If the index sustains above 15800, it can test 15900-16100 before we see a dip again.
Nikkei (28774.05, +318.45, +1.12%) has risen sharply today, breaking the resistance at 28500. The view is bullish to see a rise towards 29000/29500. If the index fails to rise above 29000/29500 then a fall towards 28000 can be seen again.
Shanghai (3619.66, +25.36, +0.71%) trades above 3600. The resistance at 3625 can hold well. Our view is bearish while below 3625 to see a dip towards 3550-3500. A strong break above 3600 on the other hand would confirm a rise towards 3700.
Nifty (17176.70, +264.45, +1.56%) recovered yesterday. The previously established range of 16800-17400 is holding well. Any break on either side can take the index either towards 16200 or towards 17600/800.
Sensex (57633.65, +886.51, +1.56%) rose yesterday. The index needs to break above 58000 to be bullish towards 59000.
COMMODITIES
Crude prices have risen as fears on the new Covid variant subsides. We may look for a reversal in Brent from 75-77 region and from 73 on the WTI. Gold needs to break above 1790-1800 to move up else can remain stuck within 1760-1800 region for now. Copper is stuck too within 4.25-4.45 and needs to break on either side to either head towards 4.00 or towards 4.80. Silver is trading near the lower end of the 22-24 range and a break on the downside, if seen can allow a test of 21 before a reversal is seen in the medium term.
Brent (75.23) has been rising sharply over the past few sessions. On the 3-day candles, immediate resistance is seen near 75-77 region which if holds can produce a decline in the near term back towards 70 or lower. Failure to decline from 75-77 region will open up possibility of a rise towards 79-80 before the expected fall is seen from there.
WTI (71.90) has immediate resistance near 73 which can hold and produce a decline from there in the near term.
Gold (1791.20) trades near the resistance level. While below 1800-1790, Gold has scope to fall towards 1760. Only a sustained break above 1800 can take it higher towards 1820 again.
Silver (22.58) trades above support at 22 and needs to bounce to remain within 22-24 range. Else a fall towards 21 cannot be negated soon.
Copper (4.3430) is stuck within 4.25-4.40/45 zone. On a fall below 4.25, there could be scope to test deeper and crucial support at 4.00 while there would be enough room on the upside towards 4.80 if the price manages to break above 4.45/50.
FOREX
Currency pairs are mixed today. Dollar Index can fall to 95.50 while below 97-96.50 while Euro needs to break above 1.13 and sustain to head towards 1.14-1.1450. Dollar Yen is ranged within 112-114 and a break on either side would indicate next course of movement. USDCNY has fallen sharply and if does not bounce from 6.35, can be dragged towards 6.30. USDINR needs a close watch near 75.75/50 today. EURJPY is ranged while Pound and Aussie see some corrective bounce.
Dollar Index (96.1460) tested 96.59 yesterday before coming off from there. We may continue to look at the range of 95.50-96.50/97 to hold for the near term unless a break on either side is seen.
Euro (1.1291) dipped to 1.1227 overnight before rising back from there. A break above 1.13 if seen would take it higher towards 1.14-1.1450 before a reversal is seen in the medium term.
EURJPY (128.12) is holding above 127.50 and trades within 127.50-128.50/129 and may remain within this range for some more time before a break on either side is seen to give more clarity on further direction.
Aussie (0.7140) is now trading just above 0.7100, throwing a challenge to the downtrend since 0.7555 (28-Oct). We need to keep a close watch to see if the current ongoing rally in the Aussie from 0.6990 (04-Dec) would sustain to rise towards 0.72 and higher or fall back from 0.72 in the near term.
Pound (1.3259) trades within 1.32-1.33 region and may continue for a few more sessions before seeing a bounce.
Dollar-Yen (113.45) has risen within the 114-112.50 range. Unless the price breaks on either side, we may expect it to hold for a few more sessions.
USDCNY (6.3529) fell sharply below 6.36 and can be headed towards 6.35 before a bounce is seen. Failure to hold above 6.35 can take the index towards 6.30. View is bearish.
{USDINR (75.4450) is ranged within 75.50-75.20/25 and a break on the upside can lead to a rise to 75.75 soon before a final reversal takes place. Watch price action near 75.50/75 today.
INTEREST RATES
The US Treasury yields have risen across tenors. The bounce in the 10Yr and 30Yr seems to be sustaining well for now and the yields may move further up in the coming days within their broad expected sideways range. The German yields remain stable and lower. The bearish view is intact to see a further fall from here. The 10Yr and 5Yr GoI have risen sharply yesterday and can rise further in the near-term to test their next key resistances and then come down again. The Reserve Bank of India's monetary policy outcome is due today.
The US 2Yr (0.69%) and the 5Yr (1.25%) Treasury yields have risen sharply while the 10 Yr (1.46%) and the 30Yr (1.79%) have inched further up slightly. While above 1.4%, the 10Yr can test 1.5%-1.55%. Similarly, the 30Yr can rise to 1.85% while it sustains above 1.7%. Overall, the yields are likely to move up within their expected broad range of 1.35%-1.65% (10Yr) and 1.7%-2% (30Yr)
The German 2Yr (-0.72%) and the 5Yr (-0.61%) yields have bounced up slightly while the 10Yr (-0.38%) and 30Yr (-0.10%) continue to remain lower and stable. Our bearish view of seeing a fall to -0.45% / -0.5% on the 10Yr and -0.1% / -0.2% on the 30Yr remains intact.
Contrary to our expectation, the Indian 10Yr (6.3909%) has risen above 6.38%. While this break sustains, a further rise to 6.43%-6.45% is possible. The region between 6.43%-6.45% is a strong resistance which is likely to hold and trigger a reversal towards 6.38% and lower again. The price action in the 6.43%-6.45% will need a close watch.
The 5Yr (5.7199%) has risen well above 5.7% but has resistance at 5.74% which can cap the upside. The 5Yr is likely to fall-back from 5.74% towards 5.68%.
Eco Data 12/8/21
[php_everywhere instance="1"]
December Flashlight for the FOMC Blackout Period
Summary
The FOMC's final meeting of 2021, to conclude on December 15, will leave plenty to talk about at this year's holiday parties. The highest inflation in a generation shows few if any signs of slowing in the near term. Along with the rapidly tightening labor market, the persistence of inflation pressures has committee members rethinking where policy needs to be positioned to balance the current risks to the outlook.
Despite initially announcing plans to taper asset purchases just five weeks ago, we expect the FOMC to start reducing its asset purchases at a faster pace at its meeting next week. Specifically, we look for the FOMC to reduce Treasury and mortgage-backed securities purchases at a pace of $15 billion and $7.5 billion per month, respectively, which would lead to purchases wrapping up in April 2022 instead of June 2022, which is when it would have been reached under the current pace.
FOMC members have taken pains to convey that the wind-down of asset purchases is not directly linked to the fed funds rate, and that ending asset purchases sooner is partly intended to give the FOMC greater optionality in the year ahead. That said, we expect a more hawkish tilt from the FOMC's Summary of Economic Projections. It would not surprise us to see the "dot plot" indicate at least two 25-bp rate hikes in 2022, followed by an additional three hikes in both 2023 and 2024. That would put the median estimate for the fed funds target range at the end of 2024 at 2.00%-2.25%. Although below the FOMC's longer-term estimated rate of 2.50%, that is above current market pricing and could feel to some at the party that the punchbowl is being removed.
The Groundwork Is Laid for a Faster Taper, but Omicron Deals a Wildcard
At the conclusion of the FOMC's November 3 meeting, the committee announced it would begin reducing its pace of asset purchases. More specifically, the committee announced it would reduce the $80 billion monthly rate of Treasury purchases by $10 billion per month in both November and December, while reducing the initial $40 billion monthly pace of mortgage-backed securities (MBS) buying by $5 billion per month over the same period. If tapering were to continue at that pace, asset purchases would conclude in June 2022. However, the FOMC did not indicate how much it would scale back purchases beyond December, giving itself the flexibility to make adjustments "if warranted by changes in the economic outlook."
Since November 3, there have been a few notable data developments as well as changes in how key Fed officials view the outlook. First, inflation has continued to surprise to the upside. The consumer price index rose a scorching 0.9% in October, pushing the one-year change up to a 30-year high of 6.2%. Core PCE inflation at 4.1% is now more than twice the FOMC's target (Figures 1 & 2). The November CPI report, to be released this Friday, will give an additional look at inflation developments. We expect another uncomfortable print for the Fed, with a 0.8% monthly rise pushing prices up to a year-over-year rate just shy of 7%.
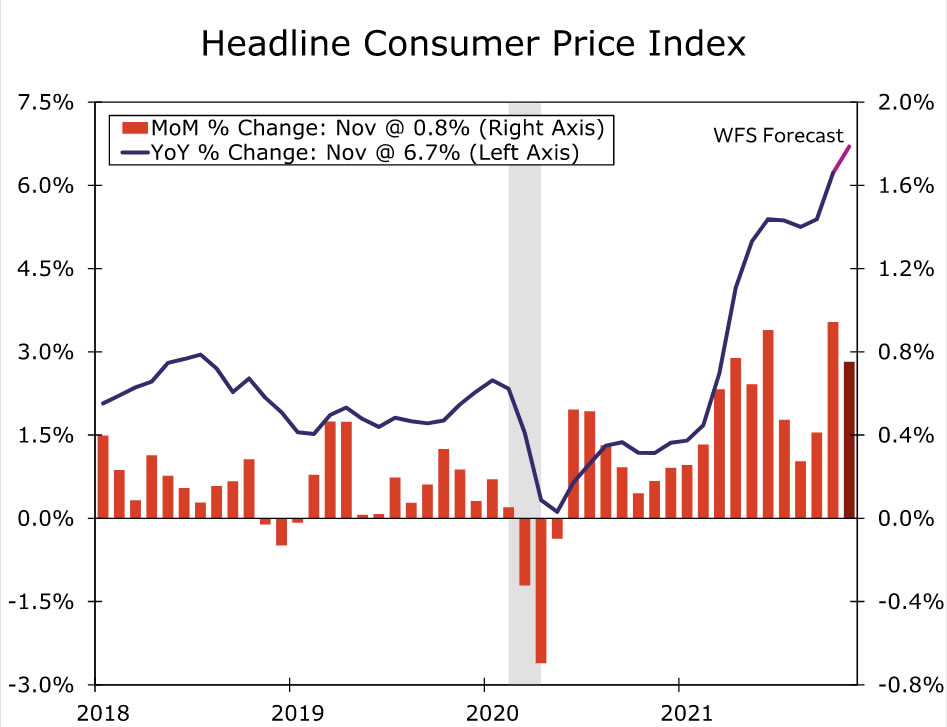
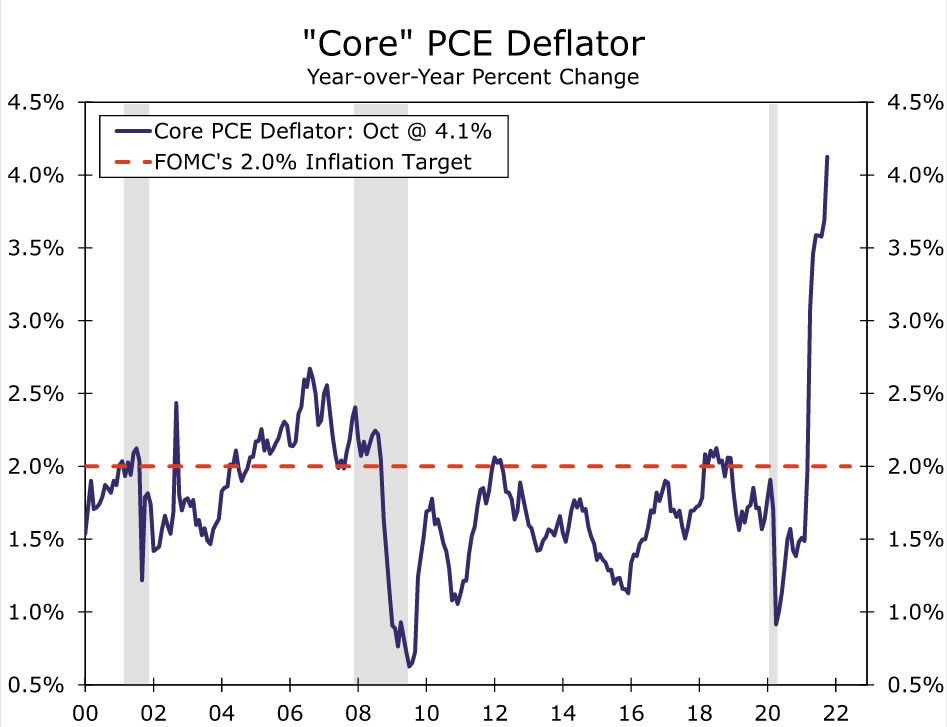
But beyond any one month's data, FOMC members have indicated that the strongest inflation in a generation is likely to take longer to subside than previously thought. In Chair Powell's prepared remarks to Congress last week, he stated that "it now appears that factors pushing inflation upward will linger well into next year," and that it was time to retire using "transitory" to describe the current bout of above-target inflation.
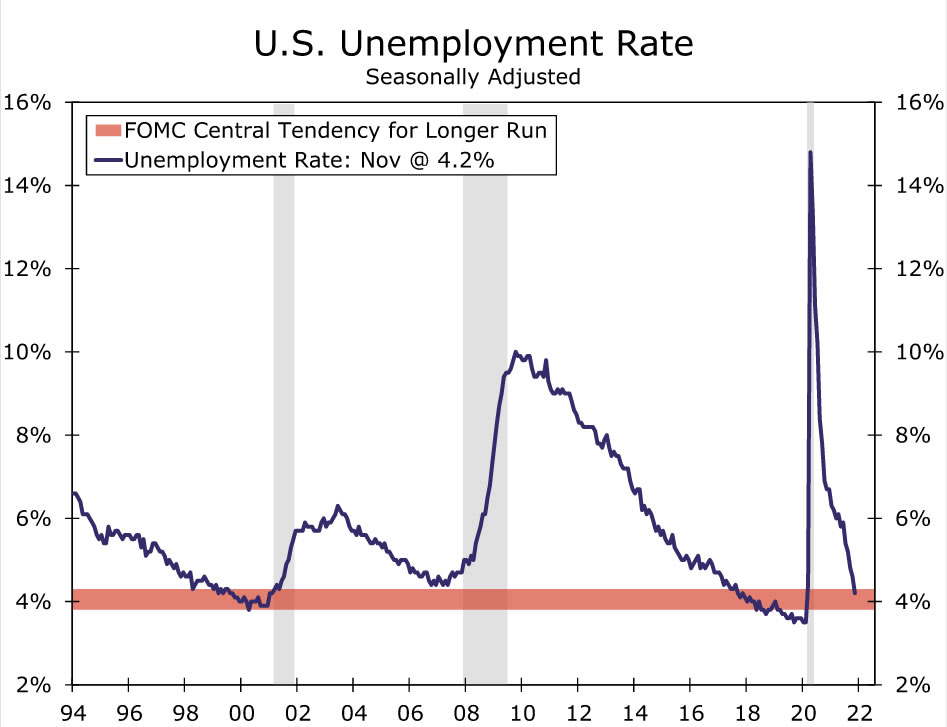
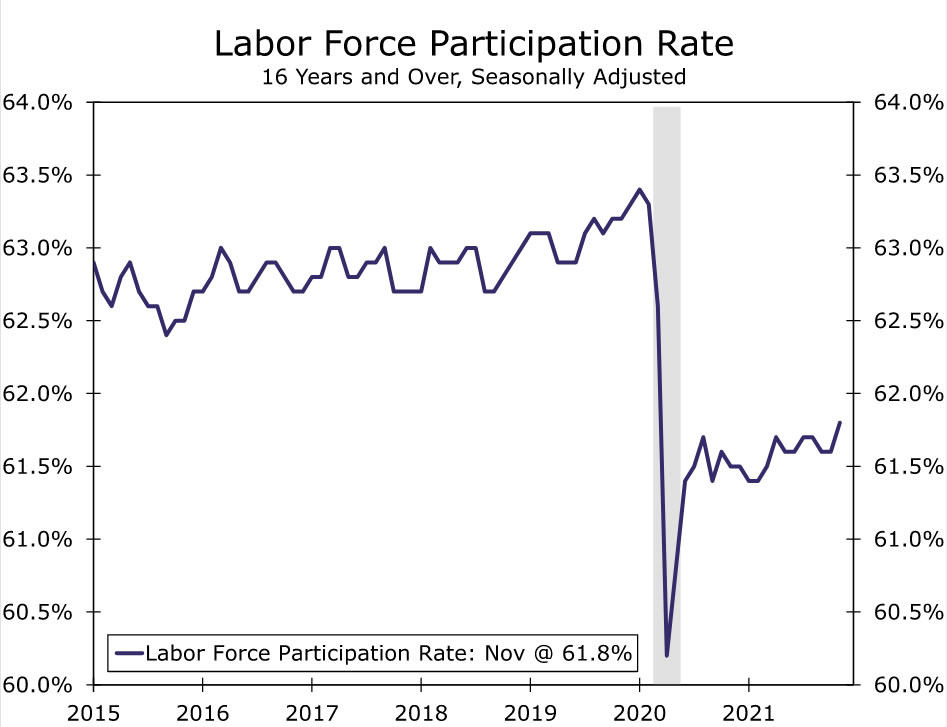
The labor market has also made meaningful strides toward full employment over the inter-meeting period. Although November payrolls underwhelmed, a solid gain in October and upward revisions to prior months' data show 1.1 million more employees on the books since the FOMC's most recent meeting concluded. What's more, the unemployment rate has declined rapidly, falling 0.6 points, even as labor force participation has risen to a new COVID-era high (Figures 3 & 4). While there is still room for the jobs picture to improve, the clearly tighter labor market reduces the tension between the FOMC's price stability and employment goals.
The recent inflation and labor market developments have led to a chorus of FOMC members flagging the possibility of reducing asset purchases more quickly. The laundry list of officials includes more hawkish members, such as Waller (Board), Bostic (Atlanta), Bullard (St. Louis) and Mester (Cleveland), but also more dovish members, Clarida (Board) and Daly (San Francisco). Even Chair Powell recently highlighted the potential for a faster pace of tapering at the FOMC's upcoming meeting. Notably, his comments came after the emergence of the Omicron variant become known. We believe that if Powell viewed Omicron as a significant threat to the outlook at that time, he would have refrained from saying that it would be appropriate to discuss wrapping up purchases a few months earlier at the December meeting.
Our working assumption therefore is that the FOMC will announce plans to speed up the tapering of its asset purchases at its meeting next week. Specifically, we expect the committee to announce that for January, it will purchase $45 billion of Treasuries and $22.5 billion of MBS, i.e., reducing Treasury and MBS monthly purchases by $15 billion and $7.5 billion, respectively. At that pace, asset purchases would wrap in April rather than June. However, if information in the coming days points to the Omicron variant becoming a bigger threat to the economic outlook and/or November's CPI report paints a significantly more benign picture of inflation, then we could envision the FOMC punting any adjustments until its January 26 meeting. In other words, an accelerated taper is not a sure-fire bet.
The Dots Will Rise, but How Much?
Next week's FOMC meeting will include the first update to the Summary of Economic Projections (SEP) since the September 21-22 FOMC meeting. As we have already discussed, much has changed in the economic outlook since then, and all eyes will be on the dot plot, as financial market participants try to discern the outlook for fed funds rate hikes once the taper is complete. In the September projections, the median dot for the end of 2022 sat squarely between zero and one 25-bp rate hike (Figure 5). This was largely in line with market pricing at the time. However, over the past few months, market pricing for 2022 rate hikes has increased sharply. As of this writing, markets are priced for approximately 66 bps of tightening in 2022. Our best guess is the updated dots to be released next week will have a median projection of two 25-bp rate hikes in 2022.
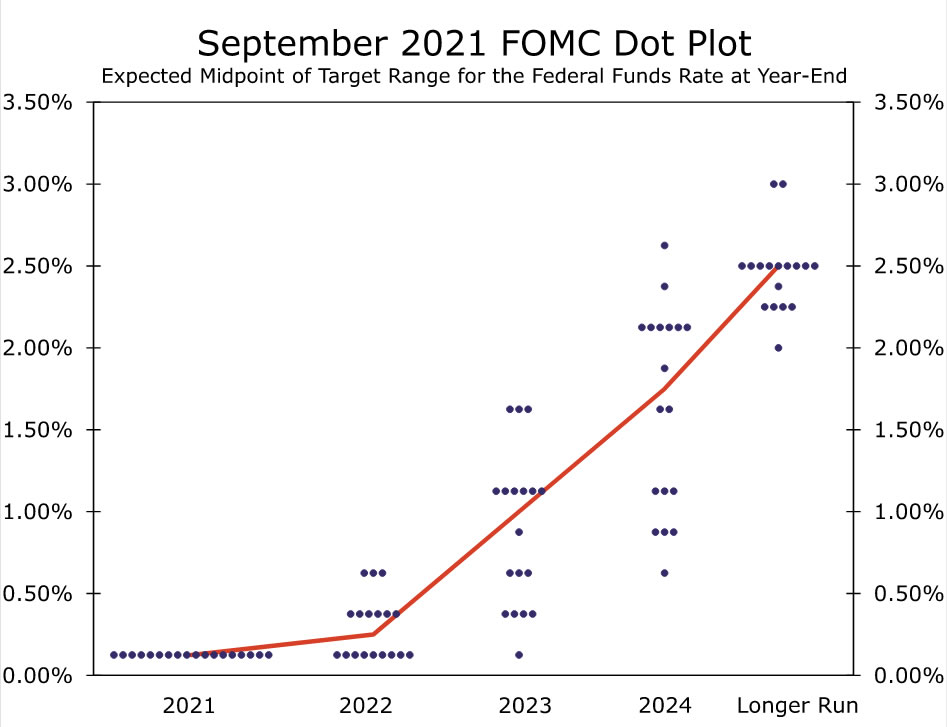
Past 2022, we doubt the median dot will change all that much, although the distribution of participant submissions might. The September projections showed a median of three rate hikes in 2023 and three more in 2024. If the median dot moves to two hikes in 2022 and the 2023/2024 dots continue to indicate three hikes each year, the cumulative number of hikes would put the fed funds target range at 2.00%-2.25% at the end of 2024. Perhaps one more rate hike sneaks in somewhere over that horizon, but any more than that and the median dot would be at or above the "longer-run" dot of 2.5%. We doubt most FOMC participants want to signal that short-term rates may rise above the neutral rate this far out.
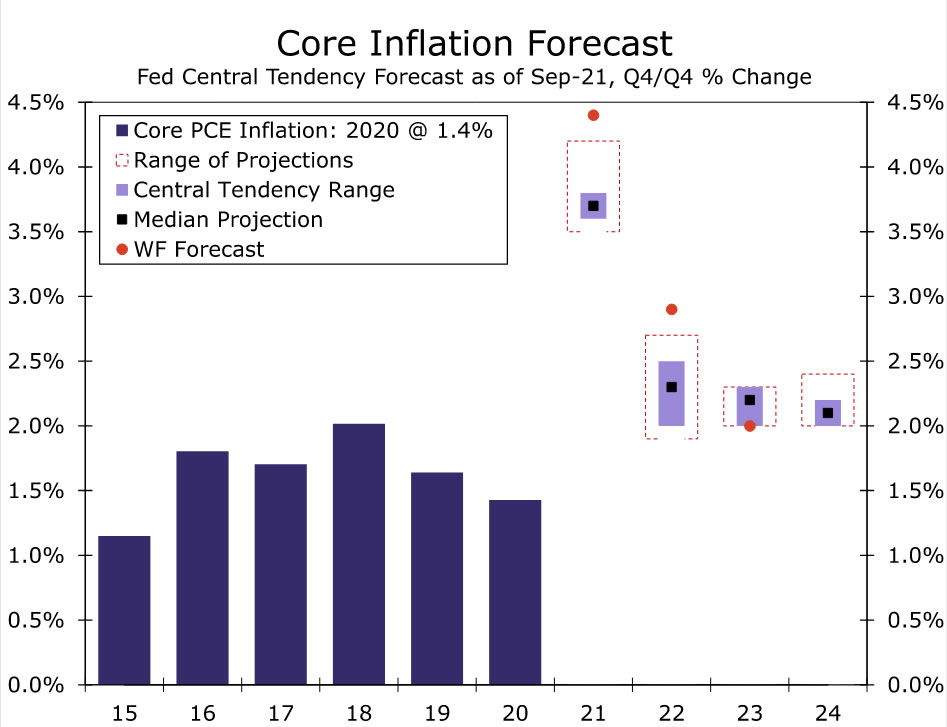
Other than the dots, the second-most important SEP projection will be the FOMC's inflation outlook. As it has done at the past few meetings, the FOMC will need to mark to market its 2021 inflation projections. The FOMC's September median core PCE inflation forecast for Q4-2021 was 3.7%, a number that is already below October's reading of 4.1%. More interesting, in our view, will be the 2022 projections. The FOMC's median core PCE inflation projection for Q4-2022 was 2.2% in September. Our current forecast is for 2.9% (Figure 6). We doubt the updated median projection will be as high as our forecast, but something in the 2.4%-2.7% range seems plausible to us. Revisions to the projections for real GDP growth and the unemployment rate should be more modest and probably will not garner as much attention as changes to the dots and inflation outlook.
Even the Fed Has Plenty of Job Openings to Fill
Shortly before Thanksgiving, President Biden announced his intention to nominate Jerome Powell for another term as Chair of the Board of Governors. President Biden also announced that he would nominate current Governor Lael Brainard to be the Vice Chair. The timing of their confirmation votes has not yet been announced, but we suspect they will be confirmed sometime in the first few weeks of January. Assuming they are both confirmed, and Richard Clarida, whose term expires at the end of January, is not appointed for another Board term, there will be three vacant seats on the seven member Board of Governors. One of these three vacant seats would be the Vice Chair of Supervision, whose duties include leading the Federal Reserve's financial system regulatory initiatives. Media reports suggest President Biden will put forth candidates for at least a couple of these seats in the coming weeks, but thus far, no one has been officially named. We doubt any of these potential candidates would materially change our outlook for monetary policy, but as the situation evolves, we will update our readers accordingly.
WTI Oil Outlook: Oil Prices Extend Recovery on Fading Omicron Fears, Iran
WTI oil rallies for the second straight day and accelerates well above the psychological $70 level, in extension of Monday’s 4% advance.
Receding fears about the Omicron variant on rising hopes that virus will not set the global economy back revived the risk appetite.
Stall of Iran nuclear talks signals delays in the return of Iranian oil that also inflated oil prices.
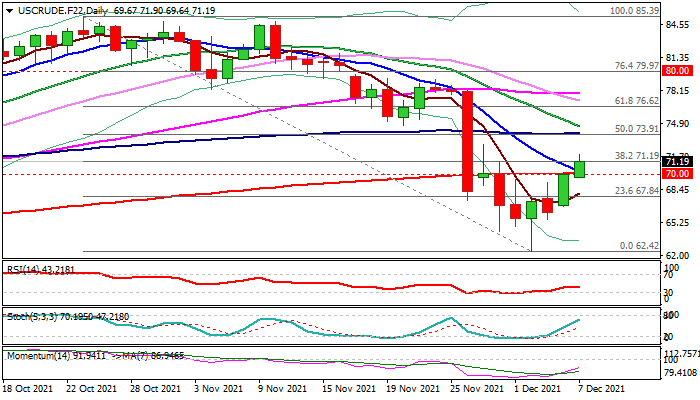
WTI price rose to the highest in 1 –1/2 week in European trading on Tuesday, on probe through pivotal Fibo barrier at $71.19 (38.2% of $85.39/$62.42 pullback), generating further reversal signal after last Thursday’s Hammer.
Close above $70 (reinforced by 200DMA) is a minimum requirement for maintaining reversal signal, which would be boosted by daily close above $71.19 Fibo barrier, for a test of key resistance at $73.59/67 (base of thick daily cloud/daily Kijun-sen).
Improving daily studies add to fresh bullish sentiment, with focus on today’s release of API crude stocks report and crude inventories on Wednesday, which could provide fresh signals.
Res: 71.90; 72.90; 73.67; 74.75.
Sup: 70.93; 70.00; 69.64; 67.84.
WTI Futures Recover Lost Ground; Buyers Gain Confidence
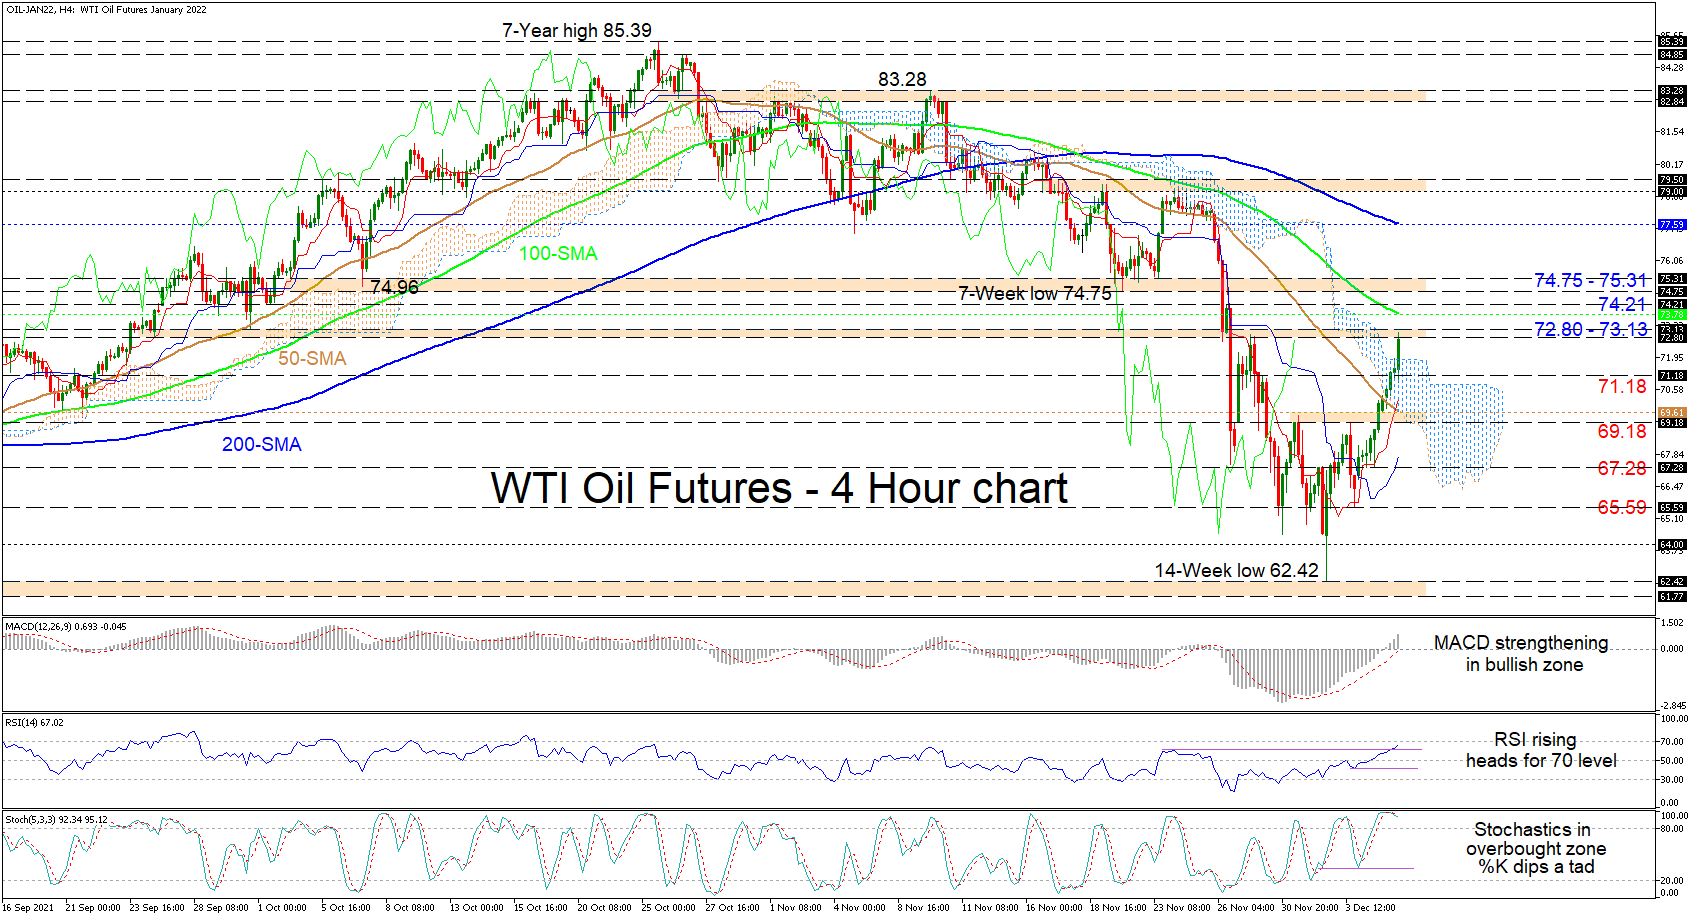
WTI oil futures are piloting higher past the 50-period simple moving average (SMA) and the Ichimoku cloud. The recent strong rally, which began on December 3 off the 65.59 level, is extending the upside reversal from a 14-week low of 62.42 with the rising Ichimoku lines indicating that bullish forces are potent.
The SMAs continue to fall, promoting the negative picture but have yet to digest the recent buoyancy in the commodity. The short-term oscillators are favouring the upside. The MACD, some distance above its red trigger line, is powering on in the bullish section, while the RSI is soaring towards the 70 overbought level. The stochastic lines are in overbought territory and the %K line is hinting of a slight pause in bullish drive.
If buyers stay in the driver’s seat, they face an initial resistance band from 72.80 to 73.13. Overcoming this, the price may tackle the 100-period SMA at 73.78 and the nearby 74.21 barrier before it challenges the resistance border of 74.75-75.31. In the event the bulls push beyond these congested obstacles, the price could shoot for the 200-period SMA at 77.59.
Otherwise, if the 72.80-73.13 barrier cools advances, sellers may find support from the cloud’s upper band and the 71.18 level (previous resistance-now-support). Receding further, the zone from the 50-period SMA at 69.61 until the inside swing high of 69.18 could form a support base. Should selling pressures grow again, the blue Kijun-sen and adjacent 67.28 low could draw traders’ focus ahead of the 65.59 trough.
Summarizing, WTI futures are exhibiting a strong bullish tone. A break above the 74.75-75.31 boundary could significantly boost upside momentum, while a break beneath the 65.59 trough would be needed for sellers to regain the upper hand.
Stocks Push Higher Again
We’re seeing improvements in risk appetite again on Tuesday as fears around Omicron continue to ease following earlier reports of less severe symptoms.
This is still an extremely fragile market but the early signs are offering some hope. The initial announcement a couple of weeks ago had investors fearing the worst and so far, that’s not what we’re seeing. Time will tell whether investors are getting ahead of themselves but a couple of days without a negative Omicron headline has the dip buyers flooding back in.
Given the concern among global leaders and various organisations over the last couple of weeks, I struggle to see all of the updates being as positive, which makes more two-way price action a strong possibility.
And if it is, then we just have high inflation and monetary tightening to contend with at a time when the global economy is hardly thriving. Of course, that’s a better outcome than higher inflation, rising rates, and Omicron lockdowns but it’s far from perfect which may spoil the party a little. A Santa rally may be underway but it will be a bumpy ride.
Surprising calm around China
There’s a surprising element of calm around Chinese growth as well; a firm belief that authorities have this under control and will stop the Evergrande crisis from spilling over into something much more devastating. We’ll see how the restructuring goes but with the company now failing to source the funds to make coupon payments, it’s about to get real which is probably at least partly why we’re seeing support is arriving in the form of a RRR cut. Further measures will be necessary but so far it’s been enough to ease the nerves.
Can bitcoin find some bullish momentum again?
Bitcoin provided a brief reminder that huge price swings go both ways when it plunged on the weekend but it’s recovered much of those losses in the days that have followed. It’s even climbed back above USD 50,000 but some big tests remain if it’s going to recapture some bullish momentum in these uncertain times. The next one is USD 53,500 which was a big area of support last month.
Oil continues higher on Omicron optimism
Oil prices are continuing to ride the risk wave higher, having been battered by Omicron headlines at times over the last couple of weeks. Crude hit a low after the OPEC+ decision but quickly recovered on the immediate adjustment caveat and since then it has been trading higher.
That could be a sign that OPEC+ has effectively put a floor under the crude price in order to protect its near-term interests but it’s probably more to do with the timing of the Omicron headlines. Don’t get me wrong, oil prices certainly saw some relief following the meeting but traders love to test the limits in these situations and may well still. But the Omicron updates just aren’t allowing for it currently.
There could still be further to run before we potentially see some profit-taking. We’re already seeing a bit in WTI around USD 71.50 but could see more on approach to USD 75, while in Brent, USD 76.50-77.50 is key. Ultimately it comes down to the headlines though and if symptoms prove to be less severe, meaning fewer hospitalisations and fatalities than feared, there’s no reason oil prices can’t head back towards the levels seen for much of November.
Gold choppy ahead of the Fed
It’s been a bit of a choppy session for gold, which continues to trade in relatively tight ranges despite volatility elsewhere in the markets without making headway in either direction. It’s currently a little higher on the day having recovered small losses suffered in the aftermath of the US data. Higher than expected unit labor costs triggered a jump in the dollar which weighed on the yellow metal, not that it lasted for long.
It seems gold is trading with an eye on the Fed next week and an ear to the ground for Omicron news. The next week will be key, after which I expect it to take off in one direction or the other. The Fed’s response will be critical depending on the new variant as it may be faced with inflation and restrictions. Early signs are promising but that’s all it is.